Risk of injury analysis in depth jump and squat jump
←
→
Page content transcription
If your browser does not render page correctly, please read the page content below
Original Article

Risk of injury analysis in depth jump and squat jump
CURTIS L. TOMASEVICZ1,2             , JEFFREY C. WOLDSTAD3, DAVID D. JONES1
1Department of Biological Systems Engineering, University of Nebraska, Lincoln, United States of America
2Nebraska  Athletic Performance Laboratory, University of Nebraska, Lincoln, United States of America
3Department of Industrial Engineering, South Dakota School of Mines and Technology, Rapid City, United
States of America

                                                   ABSTRACT

Introduction: The depth jump (DJ) and squat jump (SJ) are accepted ways to assess and train power
producing ability but are not without risk of injury. Methods: Sixteen male participants (age = 21.7 ± 1.54 yrs.,
height = 177.7 ± 11.4 cm, mass = 77.7 ± 13.6 kg) were evaluated for power exertion capabilities while being
assessed for risk of injury in the knee and low back through a range of resistances based on a percentage
of participants’ heights in the DJ (0% through 50%) and bodyweights for the SJ (0% through 100%). Two
variables were used to assess the risk of injury in the knee: valgus angle and internal abduction moment
(IAM). Four variables were used in the low back: compression and shear force at the L5/S1 vertebrae, intra-
abdominal pressure (IAP), and erector muscle tension. Results: With increasing DJ drop height, participants
showed increased risk of injury in the knee through the valgus angle and IAM. In the low back, significant
correlation occurred between increasing drop height and the shear force and IAP while compression force
and erector muscle tension were more correlated with the power exertion of the participants than the drop
height. With increasing SJ resistance, no significant increased risk of knee injury was detected. However, all
low back variables except the IAP were significantly influenced by the increased resistance. Conclusion: Risk
of injury in the knee and low back can be strongly dependent not only on the type of jump, but also the amount
of resistance. The resulting power exerted by the athlete can also influence the risk of injury.
Keywords: Kinematics; Kinetics; Knee assessment; Trunk assessment; Drop jump; L5/S1 vertebrae.

    Cite this article as:
    Tomasevicz, C.L., Woldstad, J.C., & Jones, D.D. (2021). Risk of injury analysis in depth jump and squat jump.
       Journal of Human Sport and Exercise, in press. doi:https://doi.org/10.14198/jhse.2022.174.05

1
 Corresponding author. Department of Biological Systems Engineering, University of Nebraska, 234 Chase Hall, P.O. Box
830726, Lincoln, Nebraska, United States of America.
   E-mail: ctomasevicz2@unl.edu
   Submitted for publication October 09, 2020
   Accepted for publication November 20, 2020
   Published in press January 18, 2021
   JOURNAL OF HUMAN SPORT & EXERCISE ISSN 1988-5202
   © Faculty of Education. University of Alicante
   doi:10.14198/jhse.2022.174.05
                                                                          VOLUME -- | ISSUE - | 2021 |         1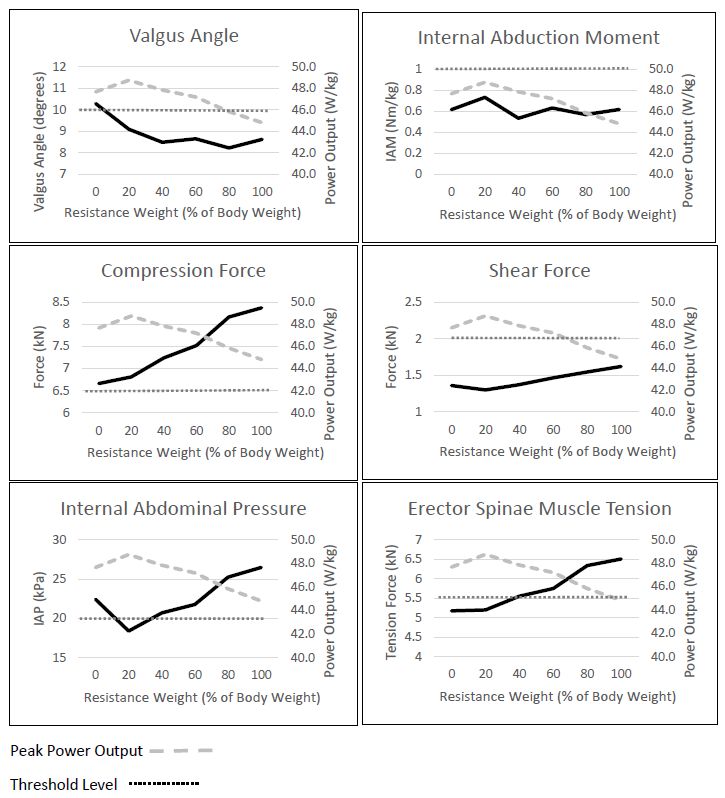
Tomasevicz, et al. / Risk of injury during depth jump & squat jump         JOURNAL OF HUMAN SPORT & EXERCISE

INTRODUCTION

With the use of force plates, the DJ and the SJ are two jumping exercises that can be extremely useful in
assessing velocity and force production for velocity-based training (VBT) and power development of an
athlete. However, these movements are not without a risk of injury. A DJ is a movement that begins with an
athlete standing upright on a platform of a specified height. An athlete steps from the platform and falls to the
ground where they immediately attempt to jump vertically as high as possible with minimal ground contact
time.

Incorporating DJs into a training program can lead to significant improvements in overall vertical jump power
output (Bobbert et al., 1986). The acceleration of the body due to the drop distance leads to a high force of
impact during landing allowing for the elastic properties of tendons to aid in the rebound jump through the
stretch-shortening cycle (SSC) (Cesar et al., 2016; Hewett et al., 2005). This impact is often accompanied
by instability at the knee in the frontal plane due to an increase in the valgus angle inducing an amplified risk
of injury at this joint. In a SJ, an athlete begins a movement from the flexed position at the bottom of a jump
and explodes vertically. As opposed to a jump squat, there is no eccentric or countermovement of concern
in the SJ, only a concentric motion is implemented. The external resistance of a SJ is usually in the form of
added weight from a barbell, but can also be a weight belt, trap bar, dumbbells, or a weighted vest. A proper
VBT program that includes SJs can improve an athlete’s ability to produce lower body power (Mackala et al.,
2013; Rodano, 1996). Athletes that perform SJs with heavy resistance could be susceptible to instability in
the knee while the added external weight can also augment compression and shear force on the low back
leading to injuries at this location (Bobbert et al., 1986; Cesar et al., 2016).

Knee
Two knee variables are typically analysed as potential risks of injury; the valgus angle and the IAM about the
knee. The valgus angle is defined as the resultant angle from an extended line of the femur to the tibia with
the patella as the vertex (Hewett et al., 2005; Myer et al., 2015). When an athlete performs a
countermovement jump task, the transition from the eccentric to concentric movement is typically when the
knee is most vulnerable as it is at its highest flexion and abduction angles. In this posture, athletes performing
a DJ are required to produce high muscle, tendon, and ligament forces quickly as they rebound and jump as
high as possible. Postures with valgus angles greater than 10° while at deep flexion angles have been
associated with higher risk of injury (Griffin et al., 2000; Hewett et al., 2005). An individual athlete’s valgus
angle threshold is dependent upon several factors that include gender, age, natural skeletal structure, tissue
stiffness, hydration level, and endocrinology factors as well as weak glute and lateral quadriceps muscles,
foot pronation and external rotation, and uncoordinated muscle activation (Herrington & Munro, 2010; Swartz
et al., 2005). With training and adaptation, some of these contributing factors can be improved leading to a
more stable knee joint. While the valgus angle can indicate postures where injury to the anterior cruciate
ligament (ACL) is more likely, it does not reflect the force placed on the knee joint and therefore, not a certain
injury indicator. The ground reaction force (GRF) produced by an athlete during a jump in addition to the
continuously changing knee valgus angle can lead to high stress on the ACL(Cesar et al., 2016; Hewett et
al., 2005; Myer et al., 2015; Pollard et al., 2010). Therefore, the IAM about the knee is also a potential indicator
of significant stress on the ACL. The IAM of the knee is defined as the moment about the centre of the patella
in the frontal plane due to the ground reaction force (GRF) applied and the perpendicular distance from that
force vector to the patella (Myer et al., 2015). An increase in either the force or the distance away from the
line of force will add to the stress on the ACL and other knee ligaments. To minimize the tension force on the
ACL, a moment of zero would be ideal. However, sports require an athlete to cut and change direction, absorb
force, accelerate, and decelerate from a variety of positions so it is impractical to eliminate the IAM entirely.

     2      | 2021 | ISSUE - | VOLUME --                                                © 2021 University of Alicante
Tomasevicz, et al. / Risk of injury during depth jump & squat jump       JOURNAL OF HUMAN SPORT & EXERCISE

It can only be minimized in an attempt to reduce the risk of injury. All athletes are different anthropometrically
and physiologically, so there is no specific threshold at which joint decampment is certain to occur. As a
result, there is no precise criterion value relating the IAM to ACL injury. However, studies have been done to
measure athletes’ IAMs from different movements (mostly in jumping movements) in both injured and
uninjured athletes (Cesar et al., 2016; Hewett et al., 2005; Pollard et al., 2010). One investigation noted that
an IAM of 1.0 (N·m)/kg could be viewed as a threshold value for athletes with a high risk of ACL injury (Hewett
et al., 2005).

Lower back
In a highly dynamic movement such as a resisted jumping exercise like a DJ or SJ, each individual vertebra
can experience compression, tension, rotational, and shear forces of different magnitudes leading to several
types of injuries. Four variables can be potential predictors of low back injuries; spinal compression force and
shear forces, tension force in the erector spinae muscles, and intra-abdominal pressure (IAP). Although some
compression force is necessary to ensure a healthy spine, compression and shear forces in the low back
have shown to be linked to low back pain, discomfort, and injury (Andersson, 1997; Chaffin & Andersson,
1991; Kumar, 1996). Degeneration of the spinal vertebral discs occurs under compression most often at the
L4/L5 and the L5/S1 locations (Chaffin & Andersson, 1991).

Previous investigations have shown that the spine encounters the greatest amount of compression forces at
these locations due to the geometrical and mechanical makeup of the human body (Genaidy et al., 1993;
Kumar, 1996). Up to 85% of all disc herniations occur at the L4/L5 or the L5/S1 level (Chaffin & Andersson,
1991). For brief moments, the spine can withstand large amounts of compression force. It is estimated that
a healthy, young adult can withstand a compressive force of 3.432 kN repeatedly without a significant risk of
injury (Genaidy et al., 1993). The National Institute for Occupational Safety and Health (NIOSH) suggests
that for a typical healthy adult, the spine not be repeatedly subjected to levels of compression that exceed
6.5 kN at the L5/S1 intervertebral disc (NIOSH, 1981; Waters et al., 1993). However, no such limit was
proposed or found for trained athletes in which adaptation to compression has occurred.

To estimate an individual’s specific tolerable compression limit, equations that incorporate variables such as
age, gender, and body weight have been developed (Adams & Hutton, 1982; Brinckmann et al., 1987;
Hansson et al., 1987; Hutton & Adams, 1982). With these compression limits, a damage load for an individual
is defined ranging from 33% to 93% of the compression limit with an average of about 60% (Eie, 1966). The
damage load represents the force at which the stiffness of the vertebrae begins to decrease and the initial
signs of damage become apparent, but not necessarily when there is an onset of pain (Yoganandan et al.,
1989).

Excessive shear forces measured at the L5/S1 vertebrae often subject the spine to disc herniation and/or
rupture as well as muscle and soft tissue damage (Adams & Hutton, 1982). NIOSH suggests that the spine
not be exposed to repeated occurrences of greater than 2.0 kN of shear force (Chaffin & Andersson, 1991;
NIOSH, 1981; Osvalder et al., 1993; Waters et al., 1993). However, untrained persons have been advised to
avoid an even more limited value of 1.0 kN for occasional exposure and 700 N for those that are subjected
to over 100 loadings per day (Gallagher & Marras, 2012).

To estimate the compression and shear forces in the spine, specifically at the L5/S1 vertebrae, it is first
necessary to estimate the tension force in the muscles acting to support the low back. The agonist muscles
which support the low back, spine, and pelvis are the erector spinae, iliopsoas, paraspinal, and multifidus
muscles. The erector spinae muscle tension can be estimated through modelling techniques by first

                                                                        VOLUME -- | ISSUE - | 2021 |        3
Tomasevicz, et al. / Risk of injury during depth jump & squat jump JOURNAL OF HUMAN SPORT & EXERCISE
calculating the moment about the L5/S1 vertebrae in the sagittal plane (Chaffin & Andersson, 1991). Due to
several physiological factors, it is very difficult to set a maximum limit for the tension force in the low back
muscles. These factors include training experience, age, gender, anthropometry, hydration levels, and
others. The threshold value for the erector spinae muscle tension of 5.5 kN was found to be a suggested limit
for a healthy population of adults in an occupational setting (Osvalder et al., 1993). However, it is believed
that trained athletes could endure a much greater level.
High IAP along with thoracic pressure helps reduce the compressive force on the spine by counteracting the
moment at the L5/S1 vertebrae created by the weight anterior of the low back. Typically, weightlifters
intentionally try to exert IAP up to 20.0 kPa to counteract the tension on the low back (Adams MA., 2004).
High IAP dissipates some of the tension force on the low back muscles, but repeated exposure to high
pressures could lead to internal injuries. Therefore, IAPs greater than 20.0 kPa are often considered to be a
risk of injury.
The complexity of the spine, both in structure and in biomaterial, makes a detailed model difficult to create.
A model that depicts an accurate estimation of the trunk muscle forces, internal spine forces, and pelvic
stabilization, as well as the IAP depends on a large variety of variables. The base model for low back analysis
is typically a free-body diagram of the spine in the sagittal plane, especially in symmetric movements in the
frontal plane. Figure 1 is the model used in this investigation is based on an ergonomic model which reduces
the complexity of individual joints between each vertebra and is included in the Appendix (Anderson et al.,
1985; Chaffin & Andersson, 1991).
Figure 1. Biomechanical model (Chaffin & Andersson, 1991).
4 | 2021 | ISSUE - | VOLUME -- © 2021 University of AlicanteTomasevicz, et al. / Risk of injury during depth jump & squat jump JOURNAL OF HUMAN SPORT & EXERCISE
Through the model, the objective of this investigation was to evaluate the potential risk of injury for DJ and
SJ activities performed under varying levels of resistance while assessing lower body power output. While
the potential for injury exists at many joints, this investigation focused on ACL knee injuries and low back
injuries at the L5/S1 intervertebral disc. It was hypothesized that an increase in both DJ drop height and SJ
weight would be associated with an increase in risk of injury in an athlete’s knees and low back compared to
recommended standard thresholds. Furthermore, an increase in power exertion by the subject would also
contribute to increased risk of injury in both the knee and low back variables.
MATERIALS AND METHODS
Participants
Sixteen healthy males participated in the investigation (age: 21.7 ± 1.54 yrs., height: 177.7 ± 11.4 cm, mass:
77.7 ± 3.6 kg, Body Mass Index (BMI): 24.4 ± 2.4). The participants were notified of the potential risks
involved and all participants gave their written informed consent which was approved by the institutional
review board. All participants were screened for fitness level through a questionnaire that inquired about
athletic history, estimated one-repetition maximum (1RM) squat, frequency of lifting and exercise, type of
exercise, and history of injury. Each participant was required to be familiar with how to perform a maximum
effort DJ and SJ including proper warm-up and execution. Exclusion criteria included recovery from any
musculoskeletal injuries in the last six months, the inability to squat 1.5 times their body weight, and an
exercise routine of less than three times per week. Furthermore, no participants were allowed to schedule
their session within 48 hours of their most recent workout session to ensure adequate recovery and maximum
effort.
Experimental design
The data collection was done at an indoor, temperature-controlled facility on a hardwood floor. Each session
lasted one hour and was scheduled at the participants’ convenience. Each participant was allowed an
indefinite amount of time to warmup with flexibility, agility, and cardiovascular exercise at their pace and
comfort level to provide maximal effort for every jump. Once a participant was adequately ready to provide a
maximal effort, 49 retro-reflective markers B&L Engineering, Santa Ana, CA, USA) were placed on
strategically determined locations of the body for biomechanical evaluation.
Methodology
The DJs were performed at heights of 0-, 10-, 20-, 30-, 40-, and 50% (± 2 cm) of each participant’s height.
To eliminate the benefit of upper body movement, participants were required to either keep their hands on
their hips or behind their back as arm swing can affect a vertical jump height by as much as 10% (Ashby &
Delp, 2006; Ashby & Heegaard, 2002; Adrian Lees et al., 2004). The DJ at “zero” height, was essentially a
simple countermovement vertical jump with restricted arm motion. The other DJs were done from a box of
appropriate height from a set of Plyo-Safe Elite Plyo-Boxes (UCS Strength & Speed, Lincolnton, NC, USA).
The participants were instructed to minimize any anticipatory effect of the drop to be consistent with the height
of the platform. The participants dropped onto two force plates simultaneously and were instructed to
immediately jump vertically with maximal effort focusing on both maximal jump height as well as a minimal
time spent on the ground. Each participant performed three jumps at each box height for maximum effort in
ascending height order as encouraged by a medical professional. Only the best performance of the three
jumps (as measured by peak power) from each height was kept for analysis. This is common practice for
assessment in many athletic combines so as not to include subpar efforts (Kuzmits & Adams, 2008; Lephart
et al., 1991; Stuart M. McGill et al., 2012). No coaching, biomechanical instruction, or verbal guidance was
VOLUME -- | ISSUE - | 2021 | 5Tomasevicz, et al. / Risk of injury during depth jump & squat jump JOURNAL OF HUMAN SPORT & EXERCISE
given unless there appeared to be a risk of injury. Between jumps, each participant was allowed enough time
to have self-determined rest in order to perform the next jump with a maximum effort.
Secondly, the participants were tested in the resisted SJ with resistances set at 0-, 20-, 40-, 60-, 80-, and
100% of their measured body weight. The jumps were done in ascending resistance order. The external
resistance was in addition to their body weight. This weight was applied through a barbell placed on the
shoulders and located just below the C7 vertebrae as recommended (Yule, 2007). The initial resting height
of the bar was set on squat rack arms so the participants would begin their movement from a comfortable
flexed position with an approximate 90 degree knee flexion angle (87.9°, ± 4.7°). The participants started
the jump with each foot on one of two separate force plates, jumped maximally, and landed back on the
respective force plates. Three jumps were performed at each resistance level with the best jump selected for
analysis as measured by peak power. For “zero” resistance, the barbell was replaced with a 0.96 m x 2.54
cm polyvinyl chloride (PVC) pipe with negligible mass (0.44 kg). All other SJs were done with a standard 15
kg or 20 kg barbell and the appropriate calculated resistance (± 1.14 kg).
The three-dimensional data were collected at 200 Hz on 18 Oqus 400 cameras (Qualisys, Gothenburg,
Sweden) and processed through a 12 Hz low-pass Butterworth filter using Visual3D software. The Qualisys
camera system used had a residual error of ± 2 mm for each marker. The force plate data were collected on
two 0.90 m x 0.90 m force plates (Bertec Corporation, Columbus, OH, USA). The two force plates were used
for parallel foot placement with the data collected at 1,000 Hz unfiltered but reduced down to 200 Hz to match
the kinematic data. The force data were synchronized to the kinematic data through Visual3D and also run
through a 12 Hz low-pass Butterworth filter.
Analysis
A virtual marker representing the centre of mass for all participants was created using anthropometric
modelling obtained from the 49 reflective markers for all the jump movements through the Qualisys software.
The displacement of the centre of mass was plotted versus time throughout the jumping movement. This
displacement was the measured change in x, y, and z directions, as opposed to just the vertical displacement
of the jumps. The intended jumping movements took place primarily in the vertical direction, but the combined
displacement was analysed with displacement anterior/posterior and lateral. This resultant displacement and
force vector was considered when calculating power production analysis.
The derivative of the centre of mass displacement with respect to time was calculated using a forward
difference method to represent the velocity of the participant. The instantaneous power output was then
calculated as the dot product of the velocity vector of the centre of mass and the force vector at each data
point. The absolute instantaneous power was normalized by body mass. The concentric phase of the jump
was the length of time from the moment of the beginning of knee extension by 1° until the time of toe-off from
the force plates as defined by a measured force of less than 10 N (Cesar et al., 2016). Peak power was
defined as the maximum instantaneous power at any single instant during the concentric phase while the
average power was the statistical mean of the power output across each data point throughout the concentric
phase. The valgus angle was tracked throughout the jumps using the lower leg markers. The most severe
angle from either knee was recorded along with the instant that it occurred during the concentric action of the
jump. At the instant, the IAM about the knee was calculated for analysis. The low back risk-of-injury variables
were found using the biomechanical model found in the Appendix during the concentric action of the jump.
6 | 2021 | ISSUE - | VOLUME -- © 2021 University of AlicanteTomasevicz, et al. / Risk of injury during depth jump & squat jump JOURNAL OF HUMAN SPORT & EXERCISE
Statistical analysis
First, a Pearson correlation was found between each of the six risk-of-injury variables (2 knee and 4 low
back) and the drop height levels in the DJ. This was done to observe the effect of the increasing drop height
on the increasing risk of injury. Second, if the correlation was found to be less than excellent (< + .90), a
Pearson correlation was found between the risk-of injury variables and the power output exerted by the
participants at each drop height to observe any effect of the external power exerted by the participant (Koo
& Li, 2016). Similarly, a Pearson correlation was calculated between the risk-of-injury variables and the
increasing resistance weight in the SJ. If the observed correlation was less than + .90, the correlation between
the variables and the power output exerted by the participants was found.
RESULTS
Depth jump
The mean peak power output for the group was found at each of the drop heights. Non-linear regression
analysis showed that the drop height had a significant quadratic effect on the peak power each participant
was able to produce (R2 = .93). The 20% drop height level was found to incite the greatest power output
compared to the other drop heights (p < .05). At the optimal 20% level, the average normalized peak power
output for the group was 66.9 W/kg (± 16.9). All other level resulted in lower power production (Tomasevicz
et al., 2019). This is shown in the background of each variable plot in Figure 2.
The valgus angle assessment showed that the drop distance had a correlation of .94 with the average peak
valgus angle of the participants (Figure 2 and Table 1). More threshold violations (9 violations) occurred at
the highest drop height compared to just 6 from no height (Table 2). Furthermore, the overall average valgus
angle at each level was greater than the 10° threshold for all but the two shortest drop heights.
In addition to the valgus angle found at the knee, the IAM in the frontal plane was calculated for each knee
throughout the entire movement. At the instant of the greatest valgus angle in the most severe knee, the IAM
was recorded and normalized by the participant’s mass. These most severe IAMs were averaged across all
16 participants at each of the six DJ drop heights. The minimum IAM was at the 10% drop height level at
0.86 N·m/kg and grew to 1.85 N·m/kg at the 50% level resulting in a correlation of .84.
The peak compression force occurred at the 20% drop height level at a pooled value of 10.7 kN (± 3.5). After
the 20% level, the force dropped off with increasing drop height to a value of 10.0 kN (± 2.7) at the 50% level.
All the compression values were found to be greater than the 6.5 kN threshold. The increasing drop heights
and the compression force at the L5/S1 vertebrae had a correlation of .55. Therefore, the subsequent
correlation analysis was done between the compression force and the power exerted by the participant. This
correlation was found to be .95 giving rise that the low back risk of injury as measured by the compression
force is more explained by the effort of the participant and not the drop distance.
The maximum sheer force of 4.1 kN (± 0.9) occurred at the 50% drop height. Only the DJs from the lowest
two heights resulted in a shear force less than the 2.0 kN threshold. The correlation between the shear force
and the drop height was .99.
The estimated IAP also increased with the increasing drop heights with an excellent correlation of .95. The
maximum IAP was 107.1 kPa (± 66.4) measured at the highest drop height or 50% of the participants’
heights. The DJ from zero height was the only jump that did not result in the 20 kPa threshold being exceeded.
VOLUME -- | ISSUE - | 2021 | 7Tomasevicz, et al. / Risk of injury during depth jump & squat jump JOURNAL OF HUMAN SPORT & EXERCISE
Table 1. Risk of injury correlation with increasing drop height and peak power exertion in DJs.
Drop Height Valgus Angle Internal Abduction Compression Shear Intra Ab Muscle
Exerted Power
(% of Participant (degrees) Moment (N∙m) Force (kN) Force (kN) Pressure (kPa) Tension (kN)
Output (W/kg)
Height) **10.0 **1.0 **6.5 **2.0 **20.0 **5.5
52.8 9.5 0.95 *7.0 1.6 15.2 *6.0
0
(± 9.6) (± 6.3) (± 0.6) (± 2.0) (± 0.4) (± 7.9) (± 1.9)
63.5 9.9 0.85 *10.3 1.9 *33.8 *8.3
10
(± 14.0) (± 5.0) (± 0.8) (± 3.2) (± 0.5) (± 22.2) (± 2.6)
66.9 *10.1 *1.02 *10.7 *2.5 *48.5 *8.7
†20
(± 16.5) (± 5.0) (± 0.9) (± 3.5) (± 0.8) (± 32.4) (± 2.8)
65.9 *10.3 *1.05 *10.4 *2.8 *49.2 *8.4
30
(± 19.8) (± 4.2) (± 1.0) (± 3.6) (± 1.1) (± 32.5) (± 3.0)
63.2 *11.1 *1.23 *10.2 *3.5 *72.3 *8.4
40
(± 16.6) (± 4.4) (± 1.3) (± 2.9) (± 1.0) (± 37.6) (± 2.5)
59.9 *12.2 *1.85 *10.0 *4.1 *107.1 *8.3
50
(± 14.6) (± 4.9) (± 1.6) (± 2.7) (± 0.9) (± 66.4) (± 2.3)
Correlation with Drop Height (r) .94 .84 .55 .99 .95 .60
Correlation with Power Output (r) .10 -.10 .95 .27 .25 .93
* Exceeds recommended threshold for healthy population. ** Threshold level. † Drop height inciting maximum power output.
Table 2. Number of participants exceeding recommended threshold levels.
Resistance Level Intra Ab Erector Spinae
Valgus Internal Abduction Compression (subject Shear
(% of Participant Height Pressure Tension
(10°) Moment (1.0 Nm/kg) dependent) (2.0 kN)
or Weight) (20.0 kPa) (5.5 kN)
0 6 38% 6 38% 0 0% 2 13% 2 13% 10 63%
10 6 38% 6 38% 4 25% 6 38% 11 69% 12 75%
Depth Jump
† 20 7 44% 7 44% 6 38% 11 69% 15 94% 14 87%
30 6 38% 7 44% 4 25% 12 75% 15 94% 14 87%
40 7 44% 7 44% 3 19% 16 100% 16 100% 15 94%
50 9 56% 10 63% 3 19% 16 100% 16 100% 15 94%
0 6 38% 3 19% 0 0% 1 6% 6 38% 9 56%
† 20 6 38% 5 31% 0 0% 0 0% 8 50% 7 44%
Squat Jump
40 4 25% 3 19% 0 0% 0 0% 8 50% 9 56%
60 6 38% 3 19% 0 0% 0 0% 9 56% 10 63%
80 5 31% 4 25% 0 0% 0 0% 9 56% 10 63%
100 5 31% 5 31% 0 0% 2 13% 11 69% 11 69%
† DJ height or SJ weight inciting maximum power output. n = 16 participants.
8 | 2021 | ISSUE - | VOLUME -- © 2021 University of AlicanteTomasevicz, et al. / Risk of injury during depth jump & squat jump JOURNAL OF HUMAN SPORT & EXERCISE
Table 3. Risk of injury correlation with increasing external weight and peak power exertion in SJs.
Power Valgus Angle Internal Abduction Compression Shear Intra Ab Muscle
Squat Jump Weight
Output (degrees) Moment (N∙m) Force (kN) Force (kN) Pressure (kPa) Tension (kN)
(% of Body Weight)
(W/kg) **10.0 **1.0 **6.5 **2.0 **20.0 **5.5
47.7 *10.3 0.62 *6.7 1.4 *22.4 5.2
0
(± 9.9) (± 7.6) (± 0.38) (± 1.8) (± 0.7) (± 2.2) (± 1.5)
48.7 9.1 0.73 *6.8 1.3 18.4 5.2
†20
(± 9.2) (± 5.0) (± 0.45) (± 2.4) (± 0.3) (± 8.5) (± 1.9)
47.8 8.5 0.50 *7.2 1.4 *20.7 *5.5
40
(± 7.9) (± 4.3) (± 0.43) (± 2.0) (± 0.3) (± 10.8) (± 1.7)
47.2 8.6 0.51 *7.5 1.5 *21.8 *5.7
60
(± 7.3) (± 4.8) (± 0.53) (± 2.1) (± 0.3) (± 11.0) (± 1.7)
45.8 8.2 0.53 *7.7 1.5 *23.7 *5.9
80
(± 7.3) (± 4.4) (± 0.46) (± 2.9) (± 0.3) (± 13.1) (± 2.3)
44.8 8.6 0.58 *8.4 1.6 *26.5 *6.5
100
(± 7.4) (± 4.8) (± 0.60) (± 2.1) (± 0.3) (± 11.8) (± 1.8)
Correlation with Resistance Weight (r) -.78 -.30 .99 .93 .75 .97
Correlation with Power Output (r) .42 .39 -.92 -.98 -.97 -.95
* Exceeds recommended threshold for healthy population. ** Threshold level. † Resistance weight inciting maximum power output.
VOLUME -- | ISSUE - | 2021 | 9Tomasevicz, et al. / Risk of injury during depth jump & squat jump JOURNAL OF HUMAN SPORT & EXERCISE
Figure 2. Depth jump risk of injury in knee and low back with increasing drop height.
Like the compression force, the tension in the erector spinae peaked at the 20% level at an average of 8.7
kN (± 2.8) and fell off slightly at the highest drop heights resulting in correlation of .60. The subsequent
correlation analysis between the tension force and the power exerted was .93 showing that the muscle
tension is also explained by the power exerted by the participant and not simply increased drop height. The
threshold of 5.5 kN was exceeded at all drop heights.
VOLUME -- | ISSUE - | 2021 | 10Tomasevicz, et al. / Risk of injury during depth jump & squat jump JOURNAL OF HUMAN SPORT & EXERCISE
Figure 3. Squat jump risk of injury in knee and low back with increasing drop height.
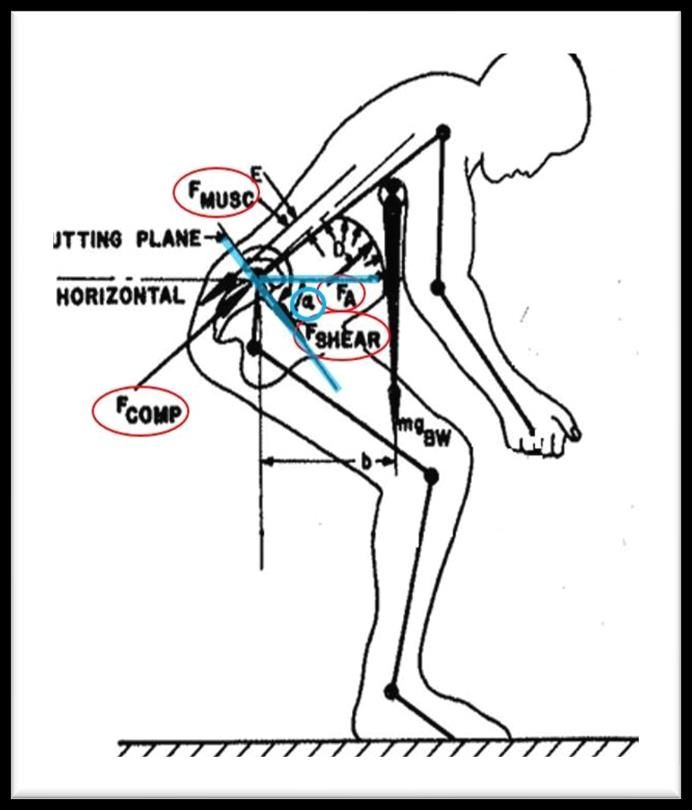
Squat jump
The average normalized peak power output for each resistance level showed that the participants were able
to produce maximum power with an external resistance of about 20% of their body weight at 48.7 W/kg (±
9.6). This shows that the increase in external weight had a significant quadratic effect (R2 = .94) on the peak
power output ability of the participants climaxing nearest the 20% level as shown in the background of the
plots in Figure 3. Figure 3 and Table 3 show the risk-of-injury variables for the SJ. The valgus angle did not
VOLUME -- | ISSUE - | 2021 | 11Tomasevicz, et al. / Risk of injury during depth jump & squat jump JOURNAL OF HUMAN SPORT & EXERCISE
show an increasing trend with the increasing levels of resistance. In fact, the valgus angle decreased overall
with a correlation of -.78. The highest valgus angle occurred in the SJ with zero weight added at 10.3° (±
7.6). The smallest valgus angle in the SJ occurred at the 80% body weight resistance level at 8.2° (± 4.4).
Additionally, no significant correlation was found between the power exerted and valgus angle in the SJ (r =
0.42). At most, 6 participants exceeded the threshold level at any drop height level (Table 2).
The peak IAM in the SJ occurred at the 20% resistance level at 0.73 (N·m)/kg (± 0.45). However, the IAM in
the knees during the SJ did not have a significant correlation with the increasing load. Furthermore, the
correlation between the power exerted and the IAM was insignificant (r = 0.39). There were only 5 participants
that exceeded the 1.0 Nm/kg threshold at any drop distance. Using the biomechanic model, the estimated
compression force averaged across the group tended to follow a linear relationship and correlated extremely
high (r = 0.99). The compression force reached a peak value of 8.4 kN (± 2.1) at the 100% resistance level.
While the average compression force at each resistance level exceeded the NIOSH recommended 6.5 kN
threshold for healthy adults, none of the participants violated the participant-dependent damage load level
(Genaidy et al., 1993).
The pooled shear force also showed an increase with the levels of resistance with a significant linear effect
(r = 0.93). The minimum shear force occurred at the 20% resistance level at 1.3 kN (± 0.3) while the maximum
force occurred at the heaviest resistance level at a value of 1.6 kN (± 0.3). All the forces were below the 2.0
kN threshold value.
The mean estimated IAP for each resistance level showed a less than excellent significant correlation (r < +
.90) with increasing resistance level increments. The peak IAP was at the 100% resistance level at 26.5 kPa
(± 11.8). Further analysis using the power exerted showed a strong negative correlation between the IAP
and the exerted power (r = -0.97) giving rise that neither the increased resistance weight nor the increased
of power exerted by the participant resulted in increased IAP. Despite the lack of trend, 11 of the 16
participants violated the 2.0 kPa threshold at the heaviest resistance level.
A significant correlation was evident in the erector spinae muscle tension force with the external resistance
increase (r = 0.97). The peak tension was at the 100% level at 6.5 kN (± 1.8). At the heaviest resistance
level, 11 participants exceeded the 5.5 kN level.
DISCUSSION
Depth jump
The optimal drop height for a participant to exert maximum power was found to be nearest the 20% height
level. From this height, an athlete can utilize the stretch-shortening cycle more efficiently than DJs from lower
heights. DJs from greater heights inflict too great of an impact force for the athlete to overcome and results
in a lower power output (Tomasevicz et al., 2019). This aligns with other investigations that seek optimal DJ
heights based on fixed drop heights independent of athlete stature (20 – 40 cm) (A. Lees & Fahmi, 1994).
A large valgus angle in dynamic movements along with internal rotation will have a higher potential for an
ACL injury (Van Lunen & Kramer, 2010). An angle greater than 10.0° was considered to be a high risk of
injury. It was expected that, with higher depth jumps, the increased impact force would coerce the participants
to experience greater valgus angles increasing the risk of ACL injury. There was a linear relationship between
the drop height and the valgus angle resulting in a linear regression line with a 0.5° average increase in
valgus angle with each 10% increase in drop height. Further exploration showed that, each depth jump from
12 | 2021 | ISSUE - | VOLUME -- © 2021 University of AlicanteTomasevicz, et al. / Risk of injury during depth jump & squat jump JOURNAL OF HUMAN SPORT & EXERCISE
greater than 10% of the participant’s height induced a valgus angle greater than the threshold of 10°.
Therefore, it would seem that participants dropping from heights 20% or greater should proceed with caution
to reduce the risk of ACL injury.
The IAM may give a better indication of the potential of injury than the valgus angle as it includes the amount
of force experienced in the knee, not just the kinematic biomechanic positioning as with the valgus angle.
The IAM of the knee showed a strong correlation with the increased drop heights giving further support to
the hypothesis that drops from greater heights induce greater risk of injury to an athlete’s ACL. Additionally,
with a value of 1.0 N·m/kg viewed as a significant risk of injury, 10 of the 16 participants exceeded this
threshold value from the greatest drop height. Therefore, it was demonstrated by both the valgus angle and
the IAM about the knee that, in a DJ, an increase of drop height may lead to higher risk of injury due to
instability in the knee. The significant collapse could result in extensive ACL tension force and lead to higher
potential for an ACL injury (Cesar et al., 2016; Griffin et al., 2000).
The estimated compression force on the L5/S1 vertebrae in a DJ showed the maximum force occurred at the
20% drop height level, the same height at which participants were able to generate maximum power as seen
in Figure 2. However, as the drop height increased to greater than 20% of the participants’ heights, the
average compression force for the DJ decreased. Further analysis showed that the compression force was
explained strongly by the power exerted by the participant (0.95) more than the drop height (0.55). Therefore,
an athlete must be aware that the compression on the L5/S1 vertebrae is dependent on effort exerted to
rebound and jump vertically. On average, the compression force felt by a participant in every DJ was a
violation of the 6.5 kN threshold recommended by NIOSH. However, it should be noted that NIOSH states
that the value of 6.5 kN is established as a threshold with repeated exposure in an occupational setting
(NIOSH, 1981). No empirical evidence or study was found that supports a one-time warning value for either
the general healthy population or a trained athlete. A dynamic estimation for the peak tolerable compression
force based on body weight, gender, and age can be calculated for an individual but still does not account
for training experience (Genaidy et al., 1993). Regardless, using this variable damage load value for each
participant, Table 2 shows that no violations occurred at the lowest resistance level and the greatest number
of participants that exceeded the tolerance limit (6 participants) was at the intermediate 20% drop height.
This further supports the conclusion that the risk of injury measured by compression force on the L5/S1
vertebrae in a DJ is more a result of power exertion and not as much on the drop height.
Unlike the compression force, the shear force at the L5/S1 vertebrae increased linearly with the increasing
drop height, regardless of power exerted by the participant. From zero height, or a countermovement jump,
the average shear force on the L5/S1 disc was 1.6 kN (± 0.4) and this force grew at an average of 500 N
with each 10% increase in height to 4.1 kN (± 0.9) at the highest drop. For DJs from 20% and higher, the
shear force for all 16 participants was greater than the NIOSH recommended threshold of 2.0 kN (Table 2).
Overall, all 16 participants exceeded the 2.0 kN level for the DJs of 40% and 50% showing that drops jumps
from substantial height can lead to a significant risk of injury of the low back through sheer force. Although
this threshold is recommended for a healthy adult without consideration of the tolerance a trained athlete can
accrue after regular exposure to high impact forces.
The IAP counteracts the moment about the L5/S1 vertebrae when an athlete’s trunk is leaning anteriorly
helping to protect against large tension force on spinae musculature as well as large compression forces on
the vertebral discs. While the accuracy of modelling the IAP has been questioned, the importance for stability
is not disputed (Chaffin & Andersson, 1991; S. M. McGill & Norman, 1987). However, exceptionally high IAP
may cause internal injuries and was therefore considered a risk-of injury variable in this investigation. Figure
VOLUME -- | ISSUE - | 2021 | 13Tomasevicz, et al. / Risk of injury during depth jump & squat jump JOURNAL OF HUMAN SPORT & EXERCISE
2 and Table 1 show that, at the highest drop height, the pressure was estimated to be 107.1 kPa (± 66.4) or
7 times the value of a countermovement jump from 0% drop height, and it is 5 times greater than the threshold
value of 20.0 kPa. And with a high correlation of .95, it can clearly be concluded that increased drop heights
lead to increased IAP in DJs. This high correlation with drop height could possibly explain that the lack in
increased compression force and muscle tension force with increased drop height. An athlete could be using
IAP to counteract the compression force and muscle tension.
The average peak muscle tension force in the low back was estimated to be highest at the 20% drop height
at 8.7 kN (± 2.8) and fell to 8.3 kN (± 2.3) at the highest drop height. Like the compression force the greatest
risk of injury, as viewed by this muscle tension, was due to the participant exerting a great amount of power
more than the impact of the drop height. Again, the subjects could be using high IAP to combat the need for
high muscle tension. A standard threshold value was difficult to establish for the muscle tension force
because athletes with different training experience can handle different levels of tension without injury.
However, a population that is simply deemed ‘healthy’ should be able to tolerate 5.5 kN of force (Osvalder et
al., 1993). Eighty of the 96 (83%) total assessed DJs violated this value in this investigation giving rise that a
trained athlete tolerance level higher than 5.5 kN would be more appropriate. Future investigations could
attempt to better quantify a reasonable threshold for trained athletes, possibly correlated to a 1RM strength
assessment such as a squat, deadlift, or good-morning lift. Regardless, by measure of erector muscle
tension, it can be concluded from this investigation that the rebound power exertion and the jump velocity
determines the risk of injury in the low back muscles for an athlete training with DJs and less on the drop
height.
Athletes that incorporate DJs into their strength and conditioning program will adapt to the DJ movement with
increased strength and stability in the knee reducing the risk of soft tissue injury compared to an untrained
participant. They would also build a tolerance to low back forces such as compression and shear force
reducing the risk of a low back injury. Therefore, more research would be necessary to establish quantified
threshold values that would better indicate a risk of injury. This does not however, nullify the results that show
the increasing danger in the knee and low back with increased drop height even for well-trained athletes.
Furthermore, the compression force and muscle tension were the most severe at the highest power-inducing
drop heights indicating that the power exerted by the athlete also contributes to increased risk of injury.
Squat jump
Squat jumps with an external resistance of about 20% bodyweight provided the optimal resistance for the
participants to exert maximum power. Heavier weights, while necessitating greater force exertion, did not
allow the participants to move very fast resulting in a lower power output. SJs with less external weight did
not provide enough resistance for an athlete to optimize their power producing capabilities.
As the participants concentrically accelerated upward in the SJ movement, the increased weight resistance
did not have a significantly affect the knee valgus angle. In fact, the valgus angle decreased with increasing
weight. The highest valgus angle occurred in the SJ at the lowest resistance level with zero weight added at
10.3° (± 7.6°). The only resistance level in the SJ with a valgus angle greater than the 10.0° threshold was
with zero resistance (10.3°, ± 7.6°). Through observation of the valgus angle plot, it can be concluded that
the SJ does not carry a risk of injury in the knee with increased weight. In fact, the knee seems to be at the
highest risk with no resistance and stabilizes between 8° and 9° without indication of increasing with heavier
applied external weight.
14 | 2021 | ISSUE - | VOLUME -- © 2021 University of AlicanteTomasevicz, et al. / Risk of injury during depth jump & squat jump JOURNAL OF HUMAN SPORT & EXERCISE
The IAM about the knee did not substantially trend up or down with the increased SJ resistance. This, along
with the results of the valgus angle, showed that the participants were able to hold a stable knee position
despite a heavier load. This is most likely due to the participants’ tendency to activate the glute muscles while
in the static squat position before jumping (Hasson et al., 2004; Nuzzo & McBride, 2013). Most likely,
increased glute activation prior to movement helped hold the knee laterally, preventing the knee from medial
collapse when the concentric movement started.
Unlike in the DJ, the low back compression force in the SJ was found to have a linearly significant trend with
the increased external resistance (r = 0.99). The lowest compression force occurred at 20% weight resistance
at 6.4 kN (± 2.4). The compression forces at all other levels were greater than the 6.5 kN level (Table 3).
Clearly, an increase in external resistance placed greater compression force on the low spine.
The participants averaged a shear force at the L5/S1 that peaked with the highest external load of 100%
body weight with the force of 1.6 kN (± 0.3). The lowest force was found at the 20% body weight resistance
level at 1.3 kN (± 0.3). The estimated shear forces at all levels of resistance were below the NIOSH threshold
value of 2.0 kN suggesting that, although the shear force increases with external resistance, the starting
static position allows athletes to minimize the risk of injury in the low back.
No significant correlation was found between the IAP and the increasing SJ weight (r < + .90). This could
explain why the compression force did see a significant trend with the increasing weight. Participants were
not able to biomechanically increase the IAP to combat the compression force and muscle tension. However,
the model in this investigation only considers the biomechanic positioning when estimating the IAP and the
participant-initiated pressure was not factored into the calculation.
The tension force on the erector spinae and other low back muscles was highly correlated to the increasing
SJ resistance weight. The greatest tension force occurred when the heaviest weight was applied (6.5 kN, ±
1.8). The greatest number of threshold violations also occurred at the 100% resistance level (11 of 16
participants) (Table 2). A value of 5.5 kN was used as a threshold to indicate a high risk of injury. Exceeding
this number represents a safety concern in a “healthy adult population”. This study showed that all SJs with
a resistance of 40% of bodyweight and greater violated the threshold level. However, trained and stronger
athletes will be able to experience more tension without injury than untrained individuals simply classified as
“healthy adults”. More research is needed to find a more established threshold level for a trained and athletic
population.
In general, the knee metrics did not indicate a risk of injury in the SJ. In fact, greater resistance seemed to
induce a more stable knee as the participants were able to activate stabilizing synergistic muscles to prevent
knee collapse. However, the increased SJ external weight did induce a greater risk of injury in the low back
as measured by the compression force, shear force, and muscle tension.
CONCLUSION
Overall, the type of jump and the resistance level influenced the risk of injury of an athlete in both DJ and SJ.
In some cases, the power exertion by the participants explained the increase in risk of injury. As the drop
height of the DJ increased, the risk of injury in the knee increased as measured by both the valgus angle and
the IAM. However, increasing the weight resistance in the SJ did not increase the risk of injury in either of
the knee variables.
VOLUME -- | ISSUE - | 2021 | 15Tomasevicz, et al. / Risk of injury during depth jump & squat jump JOURNAL OF HUMAN SPORT & EXERCISE
In the low back, the shear force at the L5/S1 vertebrae and the IAP increased in the DJ with increasing drop
height. Further analysis showed that the compression force and the muscle tension in the DJ increased with
the increasing level of power exertion by the participant. In the SJ, the compression force, the shear force,
and the erector muscle tension increased with increased weight, but none of the variables showed an
increased risk of injury with increased power exertion.
Although the results clearly show some increasing risks of injury, specific quantitative thresholds were not
helpful to indicate a risk. Several of the participants exceeded the recommended thresholds in the knee and
low back established for a healthy adult population in an occupational setting. However, more research would
be needed to establish risk-of-injury thresholds for a weight trained athlete to evaluate true risk of injury in
the knee and low back.
AUTHOR CONTRIBUTIONS
Curtis Tomasevicz: data collection and writing. Jeffrey Woldstad: data analysis. David Jones: editing.
SUPPORTING AGENCIES
No funding agencies were reported by the authors.
DISCLOSURE STATEMENT
The authors declare that there are no conflicts of interest with the funding of this study. The results are
presented clearly, honestly, and without fabrication, falsification, or inappropriate data manipulation.
Furthermore, the results of this study do not constitute endorsement by the American College of Sports
Medicine.
REFERENCES
Adams, M. A., & Hutton, W. C. (1982). Prolapsed intervertebral disc: A hyperflexion injury. Spine, 7(3),
184–191. https://doi.org/10.1097/00007632-198205000-00002
Adams MA. (2004). Biomechanics of back pain. Acupuncture in Medicine, 22(4), 178–188.
Anderson, C. K., Chaffin, D. B., Herrin, G. D., & Matthews, L. S. (1985). A biomechanical model of the
lumbosacral joint during lifting activities. Journal of Biomechanics, 18(8), 571–584.
https://doi.org/10.1016/0021-9290(85)90012-0
Andersson, G. (1997). The epidemiology of Spinal Disorders. In Frymoyer, J.(Ed.) The Adult Spine:
Principles and Practice. Philadephia. New York: Raven Press.
Ashby, B. M., & Delp, S. L. (2006). Optimal control simulations reveal mechanisms by which arm
movement improves standing long jump performance. Journal of Biomechanics, 39(9), 1726–1734.
https://doi.org/10.1016/j.jbiomech.2005.04.017
Ashby, B. M., & Heegaard, J. H. (2002). Role of arm motion in the standing long jump. Journal of
Biomechanics, 35(12), 1631–1637. https://doi.org/10.1016/s0021-9290(02)00239-7
Bobbert, M. F., Mackay, M., Schinkelshoek, D., Huijing, P. A., & van Ingen Schenau, G. J. (1986).
Biomechanical analysis of drop and countermovement jumps. European Journal of Applied
Physiology and Occupational Physiology, 54(6), 566–573. https://doi.org/10.1007/bf00943342
16 | 2021 | ISSUE - | VOLUME -- © 2021 University of AlicanteTomasevicz, et al. / Risk of injury during depth jump & squat jump JOURNAL OF HUMAN SPORT & EXERCISE
Brinckmann, P., Johannleweling, N., Hilweg, D., & Biggemann, M. (1987). Fatigue fracture of human
lumbar vertebrae. Clinical Biomechanics, 2(2), 94–96. https://doi.org/10.1016/0268-0033(87)90134-
3
Cesar, G. M., Tomasevicz, C. L., & Burnfield, J. M. (2016). Frontal plane comparison between drop jump
and vertical jump: implications for the assessment of ACL risk of injury. Sports Biomechanics, 15(4).
https://doi.org/10.1080/14763141.2016.1174286
Chaffin, D. B., & Andersson, G. B. J. (1991). Occupational biomechanics. Second edition (Vol. 2).
Eie, N. (1966). Load capacity of the low back. Journal of the Oslo City Hospitals, 16(4), 73–98.
Gallagher, S., & Marras, W. S. (2012). Tolerance of the lumbar spine to shear: A review and
recommended exposure limits. Clinical Biomechanics, 27(10), 973–978.
https://doi.org/10.1016/j.clinbiomech.2012.08.009
Genaidy, A. M., Waly, S. M., Khalil, T. M., & Hidalgo, J. (1993). Spinal compression tolerance limits for
the design of manual material handling operations in the workplace. Ergonomics, 36(4), 415–434.
https://doi.org/10.1080/00140139308967899
Griffin, L. Y., Agel, J., Albohm, M. J., Arendt, E. A., Dick, R. W., Garrett, W. E., Garrick, J. G., Hewett, T.
E., Huston, L., Ireland, M. L., Johnson, R. J., Kibler, W. B., Lephart, S., Lewis, J. L., Lindenfeld, T.
N., Mandelbaum, B. R., Marchak, P., Teitz, C. C., & Wojtys, E. M. (2000). Noncontact anterior
cruciate ligament injuries: risk factors and prevention strategies. The Journal of the American
Academy of Orthopaedic Surgeons, 8, 141–150. https://doi.org/10.5435/00124635-200005000-
00001
Hansson, T. H., Keller, T. S., & Spengler, D. M. (1987). Mechanical behavior of the human lumbar spine.
II. Fatigue strength during dynamic compressive loading. Journal of Orthopaedic Research, 5(4),
479–487. https://doi.org/10.1002/jor.1100050403
Hasson, C. J., Dugan, E. L., Doyle, T. L. A., Humphries, B., & Newton, R. U. (2004). Neuromechanical
strategies employed to increase jump height during the initiation of the squat jump. Journal of
Electromyography and Kinesiology, 14(4), 515–521. https://doi.org/10.1016/j.jelekin.2003.12.004
Herrington, L., & Munro, A. (2010). Drop jump landing knee valgus angle; normative data in a physically
active population. Physical Therapy in Sport, 11(2), 56–59.
https://doi.org/10.1016/j.ptsp.2009.11.004
Hewett, T. E., Myer, G. D., Ford, K. R., Heidt, R. S., Colosimo, A. J., Mclean, S. G., van den Borget, A.
J., Paterno, M. V., & Succop, P. (2005). Biomechanical Measures of Neuromuscular Control and
Valgus Loading of the Knee Predict Anterior Cruciate Ligament Injury Risk in Female Athletes A
Prospective Study Biomechanical Measures of Neuromuscular Control and Valgus Loading of the
Knee Predict Ant. American Journal of Sports Medicine, 33(4), 492–501.
https://doi.org/10.1177/0363546504269591
Hutton, W. C., & Adams, M. A. (1982). Can the lumbar spine be crushed in heavy lifting? Spine, 7(6),
586–590. https://doi.org/10.1097/00007632-198211000-00012
Koo, T. K., & Li, M. Y. (2016). A Guideline of Selecting and Reporting Intraclass Correlation Coefficients
for Reliability Research. Journal of Chiropractic Medicine, 15(2), 155–163.
https://doi.org/10.1016/j.jcm.2016.02.012
Kumar, S. (1996). Spinal compression at peak isometric and isokinetic exertions in simulated lifting in
symmetric and asymmetric planes. Clinical Biomechanics, 11(5), 281–289.
https://doi.org/10.1016/0268-0033(96)00015-0
Kuzmits, F. E., & Adams, A. J. (2008). The NFL combine: does it predict performance in the National
Football League? Journal of Strength and Conditioning Research / National Strength & Conditioning
Association, 22(6), 1721–1727. https://doi.org/10.1519/jsc.0b013e318185f09d
VOLUME -- | ISSUE - | 2021 | 17Tomasevicz, et al. / Risk of injury during depth jump & squat jump JOURNAL OF HUMAN SPORT & EXERCISE
Lees, A., & Fahmi, E. (1994). Optimal drop heights for plyometric training. Ergonomics, 37(1), 141–148.
https://doi.org/10.1080/00140139408963632
Lees, Adrian, Vanrenterghem, J., & Clercq, D. D. (2004). Understanding how an arm swing enhances
performance in the vertical jump. Journal of Biomechanics, 37(12), 1929–1940.
https://doi.org/10.1016/j.jbiomech.2004.02.021
Lephart, S. M., Perrin, D. H., Fu, F. H., & Minger, K. (1991). Functional performance tests for the anterior
cruciate ligament insufficient athlete. Journal of Athletic Training, 26, 44–50.
Mackala, K., Stodolka, J., Siemienski, A., & Coh, M. (2013). Biomechanical analysis of squat jump and
countermovement jump from varying starting positions. Journal of Strength and Conditioning
Research, 27(10), 2650–2661. https://doi.org/10.1519/jsc.0b013e31828909ec
McGill, S. M., & Norman, R. W. (1987). Reassessment of the role of intra-abdominal pressure in spinal
compression. Ergonomics, 30(11), 1565–1588. https://doi.org/10.1080/00140138708966048
McGill, Stuart M., Andersen, J. T., & Horne, A. D. (2012). Predicting performance and injury resilience
from movement quality and fitness scores in a basketball team over 2 years. Journal of Strength and
Conditioning Research, 26(7), 1731–1739. https://doi.org/10.1519/jsc.0b013e3182576a76
Myer, G. D., Ford, K. R., Di Stasi, S. L., Foss, K. D. B., Micheli, L. J., & Hewett, T. E. (2015). High knee
abduction moments are common risk factors for patellofemoral pain (PFP) and anterior cruciate
ligament (ACL) injury in girls: is PFP itself a predictor for subsequent ACL injury? British Journal of
Sports Medicine, 49(2), 118–122. https://doi.org/10.1136/bjsports-2013-092536
NIOSH. (1981). Work practices guide for manual lifting. US Department of Health and Human Services,
Technical Report Number: 81-122.
Nuzzo, J. L., & McBride, J. M. (2013). The Effect of Loading and Unloading on Muscle Activity During the
Jump Squat. Journal of Strength and Conditioning Research, 27(7), 1758–1764.
https://doi.org/10.1519/jsc.0b013e318291b8b2
Osvalder, A. L., Neumann, P., Lövsund, P., & Nordwall, A. (1993). A method for studying the
biomechanical load response of the (in vitro) lumbar spine under dynamic flexion-shear loads.
Journal of Biomechanics, 26(10), 1227–1236. https://doi.org/10.1016/0021-9290(93)90070-u
Pollard, C. D., Sigward, S. M., & Powers, C. M. (2010). Limited hip and knee flexion during landing is
associated with increased frontal plane knee motion and moments. Clinical Biomechanics, 25(2),
142–146. https://doi.org/10.1016/j.clinbiomech.2009.10.005
Rodano, R. (1996). Gender Differences in Joint Momentand Power Measurements During Vertical Jump
Exercises. ISBS-Conference.
Swartz, E. E., Decoster, L. C., Russell, P. J., & Croce, R. V. (2005). Effects of Developmental Stage and
Sex on Lower Extremity Kinematics and Vertical Ground Reaction Forces During Landing. Journal
of Athletic Training, 40(1), 9–14.
Tomasevicz, C. L., Hasenkamp, R., Ransone, J. W., & Jones, D. (2019). Optimal depth jump height
quantified as percentage of athlete stature. Journal of Human Sport and Exercise, 15(3).
https://doi.org/10.14198/jhse.2020.153.17
Van Lunen, B. L., & Kramer, L. C. (2010). Understanding and Preventing Noncontact ACL Injuries. In
Athletic Training & Sports Health Care (Vol. 2, Issue 1, pp. 43–44). https://doi.org/10.3928/19425864-
20101222-08
Waters, T. R., Putz-Anderson, V., Garg, A., & Fine, L. J. (1993). Revised NIOSH equation for the design
and evaluation of manual lifting tasks. Ergonomics, 36(7), 749–776.
https://doi.org/10.1080/00140139308967940
Yoganandan, N., Ray, G., Pintar, F. A., Myklebust, J. B., & Sances, A. (1989). Stiffness and strain energy
criteria to evaluate the threshold of injury to an intervertebral joint. Journal of Biomechanics, 22(2),
135–142. https://doi.org/10.1016/0021-9290(89)90036-5
18 | 2021 | ISSUE - | VOLUME -- © 2021 University of AlicanteYou can also read