Task 7 - River floods - JRC PESETA III project - europa.eu
←
→
Page content transcription
If your browser does not render page correctly, please read the page content below

Task 7 – River floods
                   JRC PESETA III project

                   Lorenzo Alfieri, Francesco Dottori and
                   Luc Feyen

                   2018

                                                        EUR 29422 EN
This publication is a Technical report by the Joint Research Centre (JRC), the European Commission’s science
and knowledge service. It aims to provide evidence-based scientific support to the European policymaking
process. The scientific output expressed does not imply a policy position of the European Commission. Neither
the European Commission nor any person acting on behalf of the Commission is responsible for the use that
might be made of this publication.

Contact information
Name: Lorenzo Alfieri
Email: lorenzo.alfieri@ec.europa.eu
Tel.: +390332783835

JRC Science Hub
https://ec.europa.eu/jrc

JRC110308

EUR 29422 EN

  ISBN 978-92-79-96911-9        ISSN 1831-9424       doi:10.2760/849948

Luxembourg: Publications Office of the European Union, 2018

© European Union, 2018

The reuse policy of the European Commission is implemented by Commission Decision 2011/833/EU of 12
December 2011 on the reuse of Commission documents (OJ L 330, 14.12.2011, p. 39). Reuse is authorised,
provided the source of the document is acknowledged and its original meaning or message is not distorted. The
European Commission shall not be liable for any consequence stemming from the reuse. For any use or
reproduction of photos or other material that is not owned by the EU, permission must be sought directly from
the copyright holders.

All content © European Union, 2018

How to cite this report: Alfieri L., Dottori F., and Feyen L., PESETA III – Task 7: River floods, EUR 29422 EN,
Publications Office of the European Union, Luxembourg, 2018, ISBN 978-92-79-96911-9, doi:10.2760/849948,
JRC110308.
Contents

Executive Summary ............................................................................................... 2
1 Introduction ...................................................................................................... 5
2 Methodology ..................................................................................................... 7
   2.1 Flood risk analysis ....................................................................................... 7
       2.1.1 Data and models ................................................................................. 7
       2.1.2 Modelling approach .............................................................................. 8
   2.2 Adaptation measures for flood risk reduction ................................................... 9
       2.2.1 Increase of flood protection levels .......................................................... 9
       2.2.2 Reduction of the peak flows .................................................................. 9
       2.2.3 Reduction of vulnerability...................................................................... 9
       2.2.4 Relocation ......................................................................................... 10
3 Results ........................................................................................................... 11
   3.1 Flood hazard in Europe ............................................................................... 11
   3.2 Flood risk in Europe ................................................................................... 12
   3.3 Strategies for flood risk reduction ................................................................ 19
4 Conclusions .................................................................................................... 24
References ......................................................................................................... 25
List of abbreviations and definitions ....................................................................... 28
List of figures ...................................................................................................... 30
List of tables ....................................................................................................... 31

                                                            i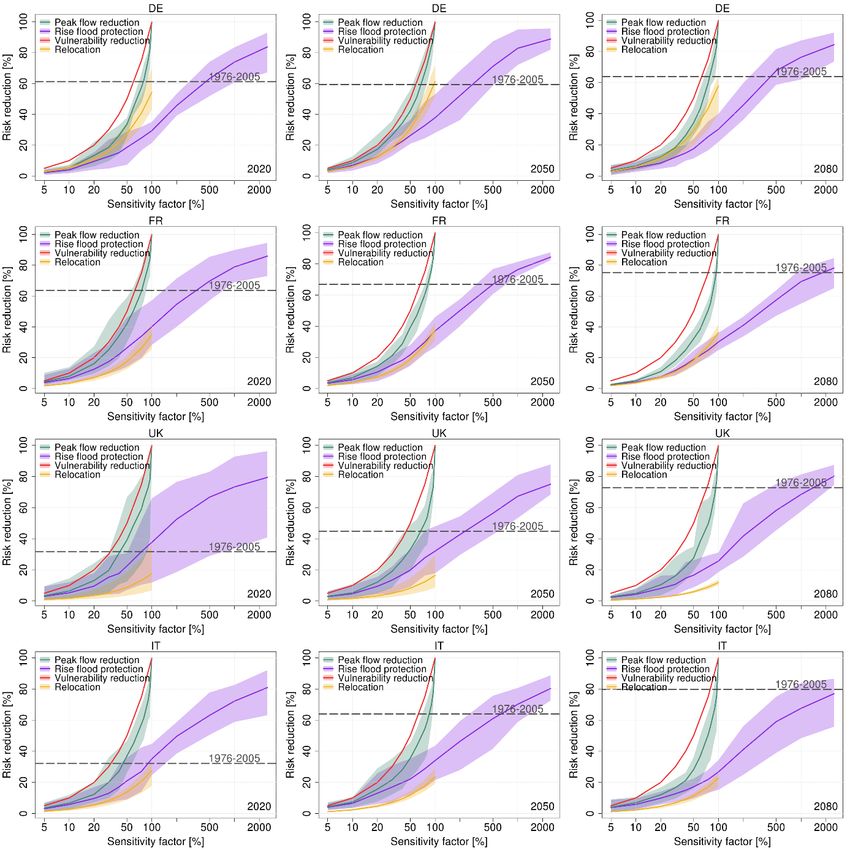
Executive Summary
Since 1980 river floods in Europe have resulted in over 4,700 fatalities and caused direct
economic losses of more than €150 billion (2013 values), and future risk is likely to increase
due to the combination of climatic and socio-economic drivers. As such, reliable research
works are needed to investigate river flood risk under future climate scenarios, and to
evaluate adaptation strategies able to limit the impacts of river flooding.
In this report, we present results of the PESETA III river flood risk assessment based on
an ensemble of high-resolution regional climate scenarios and suitable socio-economic
pathways. We evaluated river flood risk in Europe throughout the 21st century by
comparing flood impacts under baseline (1976-2005) climate with those in the near (2021–
2050) and far (2071–2100) future and under specific warming levels (SWLs) of 1.5, 2 and
3°C global warming above preindustrial levels. Simulated flood risk scenarios are
representative for high levels of greenhouse gas concentrations in the atmosphere, and
considering both time-based and warming-based scenarios allows to evaluate the influence
of the speed of warming on flood impacts.
Our analysis includes all EU member states plus a number of neighbouring countries, most
of which include parts of European river basins like the Danube. The neighbour countries
considered are Bosnia – Herzegovina, Belarus, Iceland, Kosovo, Moldova, Montenegro, the
Former Yugoslav Republic of Macedonia (FYROM), Norway, Serbia and Switzerland.
An ensemble of seven regional climate projections from 1970 to 2100 forced by the
Representative Concentration Pathway (RCP) 8.5 scenario were run through a distributed
hydrological model and resulting streamflow was analysed statistically to estimate future
changes in the river flood hazard in Europe. Note that the analysis does not consider other
flood processes such as coastal floods (due to storm surges and waves), nor pluvial and
flash floods (caused by localized, high-intensity rainfall events). Impacts of river floods in
Europe were evaluated by combining the occurrence and magnitude of future discharge
peaks with present exposure maps (population, landuse) and information on flood
defences. Estimates of expected economic damage and population affected were produced
considering first only climatic drivers (static economic analysis) and then including the
effects of socio-economic development coherent with the considered climate scenarios
(dynamic economic analysis). Furthermore, the risk assessment framework was applied to
qualitatively evaluate the risk reduction potential of a number of flood adaptation
strategies. Measures taken into account include the rise of flood protection, reduction of
the peak flows through water retention, reduction of vulnerability and relocation to safer
areas.
Under baseline climate, in Europe around 216,000 people are exposed each year to river
flooding and annual flood damage amounts to €5.3 billion. In most regions of Europe we
see an increase of flood risk due to global warming (see Figure 1). Under a 2°C global
warming scenario, which under the RCP8.5 pathway will occur in the early 2040s, and
considering current socio-economic conditions, flood impacts could more than double, with
525,000 people annually exposed to floods and €13 billion of expected annual losses. If
near term (2021-2050) climate conditions are considered, approximately 450,000 people
could be exposed annually to river flooding and direct flood damages could reach €12
billion. Longer term climate conditions (2071-2100) imposed on present society could
result in over 700,000 people annually exposed to floods while direct flood damages could
see a more than three-fold increase with respect to current conditions, reaching €17 billion
of average annual losses.

                                              2
Figure 1. Expected annual damage for baseline, near (2021-2050) and far future (2071-2100) (left
graph) and different levels of warming (right graph). Figures show flood impacts under future climate
conditions on present European society. Note that some countries are not included in the graphs
because impacts are negligible compared to other countries.

                                                 3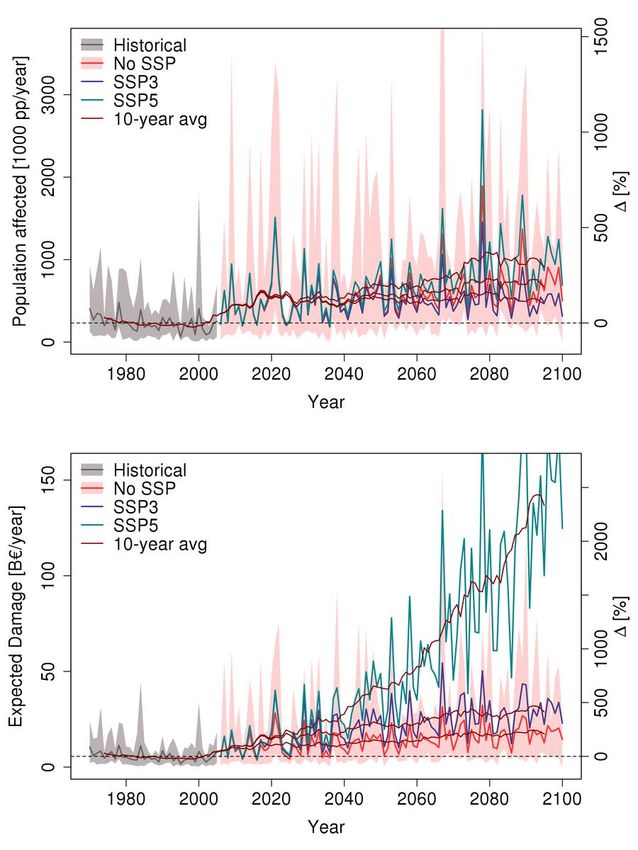
Projections of flood impacts show an even more pronounced increase when socio-economic
scenarios are considered in the projections. Depending on the socio-economic scenario,
average estimates of population annually affected by floods could range between 500,000
and 550,000 in the 2021-2050 period, and between 530,000 and 975,000 in the 2071-
2100 period. A larger increase is foreseen in expected annual flood damage, which is
projected to rise to €19-26 billion in 2021-2050 and €29-112 billion in 2071-2100. This
shows that flood risk is amplified by economic growth. However, the projected socio-
economic conditions imply a wealthier society hence also an increase in the capacity to
absorb the increase in flood risk. As for the evaluation of risk adaptation options, results
suggest that the future increase in expected damage and population affected by river floods
can be compensated through different configurations of adaptation measures. The
adaptation efforts should favour measures targeted at reducing the impacts of floods (such
as relocation and vulnerability reduction), rather than trying to avoid them. Conversely,
adaptation plans only based on rising flood protections have the effect of reducing the
frequency of small floods and exposing the society to less-frequent but catastrophic floods
and potentially long recovery processes.

                                             4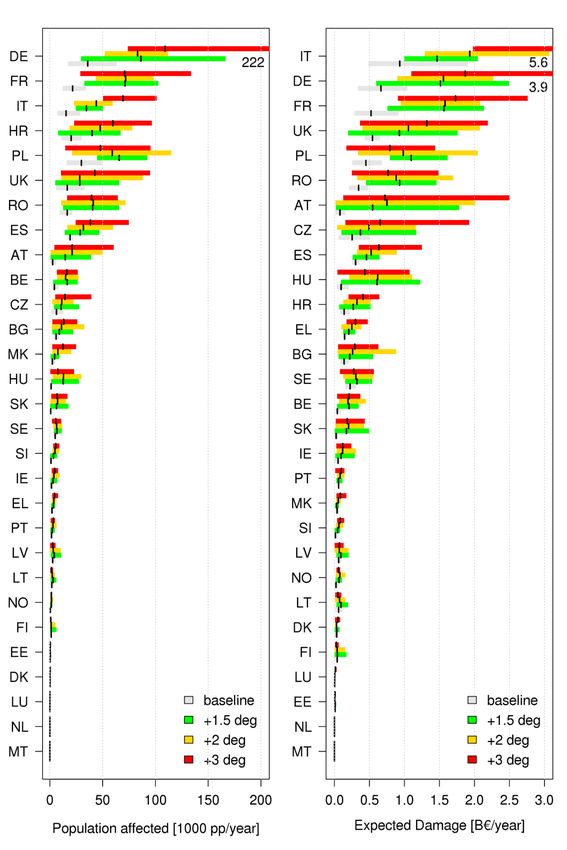
1 Introduction
Flood risk is the combination of the probability of a flood event and of the potential adverse
consequences for human health, the environment, cultural heritage and economic activity
associated with a flood event (EU Floods Directive, European Commission, 2007). A key
component of flood risk assessment is the accurate estimation of the flood hazard (i.e.
magnitude and frequency, or probability, of floods) and of the potential impact on human
activities. The latter is usually quantified as the product of exposure, that is, “people,
property, systems, or other elements present in hazard zones that are thereby subject to
potential losses”, and of vulnerability, that is, “the characteristics and circumstances of a
community, system or asset that make it susceptible to the damaging effects of a hazard”
(UNISDR, 2009). All components of flood risk are subject to changes in time due to socio-
economic development and the possible influence of a changing climate. This makes the
assessment of present and future flood risk a particularly challenging task.
Since 1980 river floods in Europe have resulted in over 4,700 fatalities and caused direct
economic losses of more than €150 billion (based on 2013 values), which is almost one-
third of the damage caused by all natural hazards (EEA, 2017). Moreover, the current
knowledge suggests that climate change will be a determining factor in intensifying the
hydrological cycle and most likely lead to an increase in the magnitude and frequency of
intense precipitation events in many parts of Europe (see, e.g., Frei et al., 2006;
Christensen and Christensen, 2007; van der Linden and Mitchell, 2009; Nikulin et al.,
2011), which may lead to an increase in future flood hazard in those regions (e.g., Dankers
and Feyen, 2009; Whitfield, 2012).
The objective of the river flood analysis in PESETA III is to evaluate flood impacts in Europe
throughout the 21st century. To this end, this work makes use of the pan-European flood
hazard mapping procedure by Alfieri et al. (2014), which is for the first time fully integrated
into a high resolution flood risk assessment at continental scale. This is combined with
projections of future flood hazard (Alfieri et al., 2015) driven by an ensemble of climate
projections for RCP8.5. Climate projections from 1970 to 2100 are run through a
distributed hydrological model and resulting streamflow is analysed statistically to estimate
future changes in the flood hazard in Europe. Note that such analysis complements the
evaluation of future changes in river flow and water resources performed in Task 12.
Specifically, while Task 12 considers changes in magnitude and frequency of high-flow and
low-flow conditions, the focus is on frequent and low-intensity river floods. Conversely,
here we analyze the full range of possible flood events, including less frequent and more
severe floods, and we evaluate their consequences through simulating floodplain
inundation processes and evaluating flood impacts.
Note that in the present work we analyse only river flooding, that is, flood events caused
by overflowing of water from rivers above a specific size (i.e. upstream drainage area
above 500 km2). We do not consider flash floods (due to localized, high-intensity rainfall
events involving the minor river network) and coastal floods, which are the main topic of
Task 8. From now on in the text, for reasons of conciseness we use the term “flood” to
refer to river flooding.
We quantify the future impact of floods in Europe by combining the occurrence and
magnitude of future discharge peaks with present exposure maps and information on flood
defences. Future estimates of expected economic damage and population affected are
produced considering first only climatic drivers (static economic analysis) and then
including the effect of possible socio-economic development (dynamic economic analysis)
coherent with the considered climate scenarios.
In addition to flood risk evaluation, adaptation plans are a vital component of current and
future disaster risk reduction strategies (Adger et al. 2005; Brandimarte et al. 2009). Flood
risk reduction may be tackled through structural and non-structural measures involving
flood zoning, land-use planning and private precautionary measures, with notable
differences in the approach from country to country, even within Europe (Kreibich et al.
2015). While the number of coordinated flood reduction plans is steadily growing,

                                              5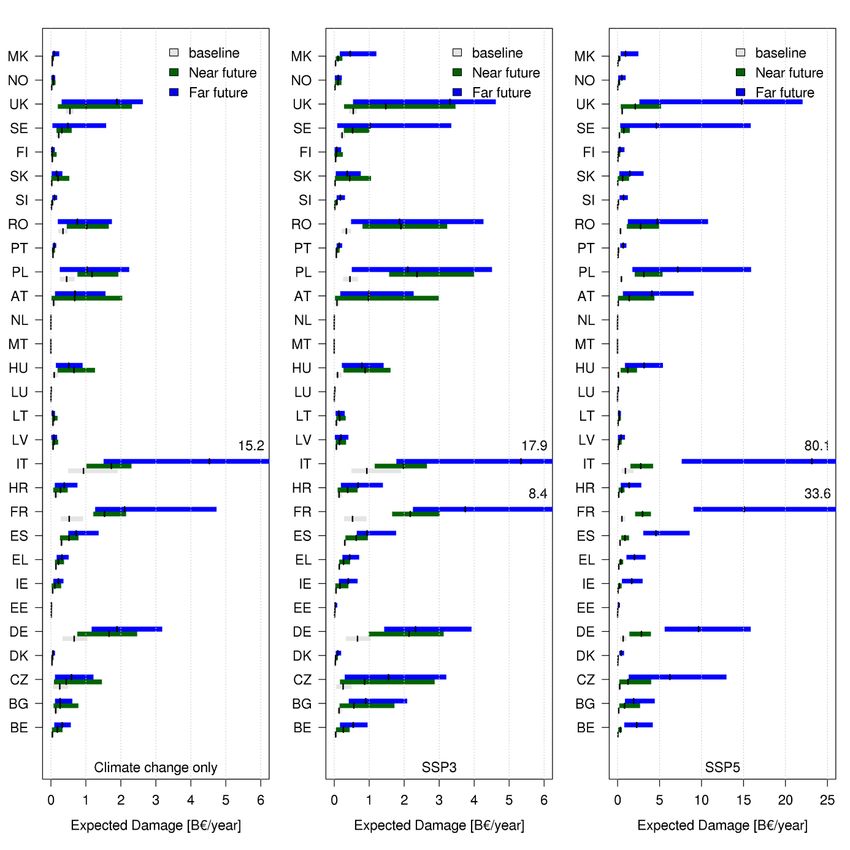
particularly at community level (e.g., Stahre 2008; Reinhardt et al. 2011), most flood risk
prevention actions performed in the past decades focused on corrective rather than
preventive measures. After a flood had hit, a recurrent case of flood management was to
reinforce and rise flood protections up to a level that would safely confine the peak flow of
the river in case a similar event occurred again in the future (see e.g., Fenn et al. 2014).
Yet, more and more research studies based on past events acknowledge dykes heightening
as measures of last resort or even examples of maladaptation (Hallegatte 2009; Zurich
2014; Wenger 2015), as they give a misleading impression of complete safety which is at
odds with the catastrophic consequences in case of failure during flood events (e.g., Di
Baldassarre et al. 2015). The last two decades have seen a progressive policy shift towards
programs to give “room for rivers” (Rohde et al. 2006; Opperman et al. 2009), aimed to
increase the storage space of rivers by restoring floodplains and thus reducing the flood
depth by spreading floodwaters over wider areas. Other adaptation options such as
relocation to safer areas or flood proofing of buildings require deeper commitment of
homeowners and have thus found limited applications in practice (McLeman and Smit
2006; Bichard and Kazmierczak 2012). Yet, insurance programs and disaster financing
schemes have large potential in steering the flood risk management in the private and
public sectors (Keskitalo et al. 2014; Jongman et al. 2014).
Quantifying the benefits of adaptation measures is crucial for planning nation-wide
coordinated actions for flood risk reduction in view of future socio-economic dynamics and
the potential intensification of the hydrological cycle and of its extremes (Alfieri et al.
2015a). In the frame of PESETA III we perform a sensitivity analysis to understand the
potential of different adaptation measures to reduce flood risk. To this end we consider
four different adaptation options in our flood risk assessment framework and evaluate their
risk reduction effectiveness. Each adaptation option is therefore simulated in 8 to 12
different configurations to assess the sensitivity of its implementation on the resulting flood
risk. Risk reduction estimates are obtained by aggregating the results of seven ensemble
simulations in space, over 28 European countries, and in time, through two 30-year time
slices, to strengthen the robustness of the analysis.

                                              6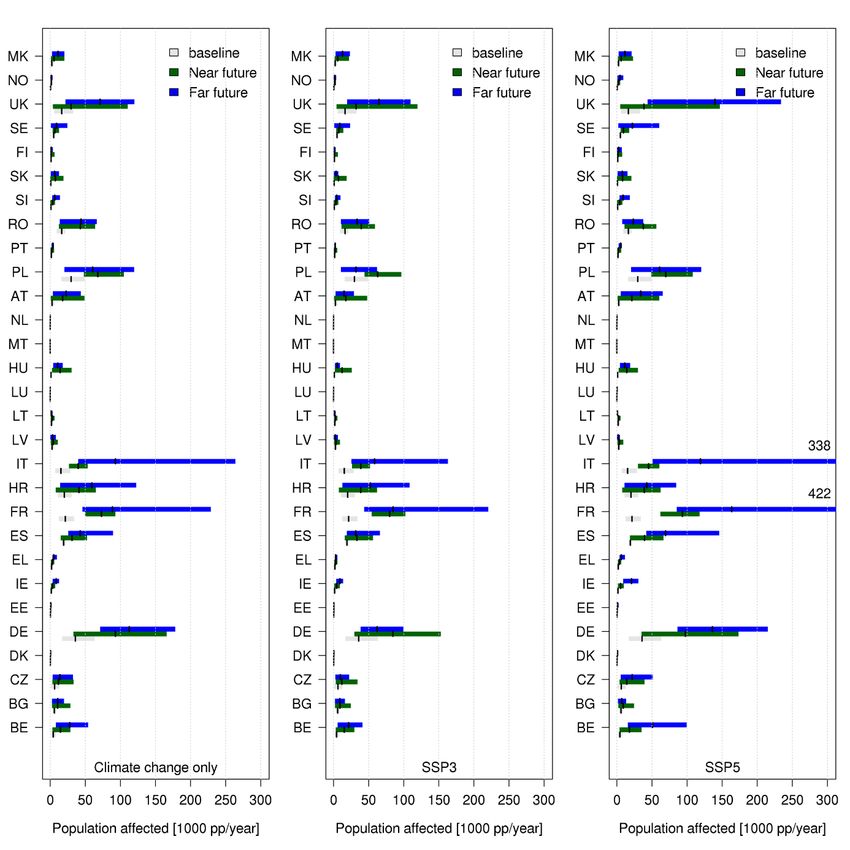
2 Methodology
The risk assessment framework applied for the present study combines hydrological
modelling driven by historical climate scenarios and future projections, statistical extreme
value analysis and inundation modelling with the vulnerability of assets and people to
floods in order to estimate direct impacts of floods. The risk assessment framework is also
applied to evaluate the risk reduction potential of a number of strategies for flood
adaptation.
Statistical and quantitative analyses shown in this report are performed over 30-year time
periods. The historical scenario spans the period 1976–2005, hereinafter referred to as
“baseline”, after the median year of the time slice. Similarly, future time slices span over
the windows 2021–2050 and 2071–2100 are referred to as “near future” and “far future”,
respectively. In addition, we compare impacts for the historical scenario with those over
30-year time slices centred on the year that the specific warming levels (SWLs) of 1.5, 2
and 3°C global warming above preindustrial levels are reached (see Table 1). Note that
the 1.5°C and 2°C warming scenarios are explicitly considered in the recent Paris
Agreement, while a 3°C global warming is a scenario that could be expected by the end of
the 21st century if adequate mitigation strategies are not taken.
Both time-based and warming-based time windows are driven by the same scenario of
greenhouse gases emission, to evaluate the influence of the speed of warming on flood
impacts.

Table 1. Regional climate projections used in the flood analysis and corresponding year of
exceeding 1.5, 2 and 3°C warming.

 Institute     GCM               RCM                Driving ens   SWL:1.5      SWL:2         SWL:3
                                                    member

 KNMI          EC-EARTH          RACMO22E           r1i1p1          2031       2046          2069

 SMHI          HadGEM2-ES        RCA4               r1i1p1          2025       2037          2055

 SMHI          EC-EARTH          RCA4               r12i1p1         2028       2042          2067

 MPI-CSC       MPI-ESM-LR        REMO2009           r1i1p1          2031       2045          2068

 CLMcom        MPI-ESM-LR        CCLM4-8-17         r1i1p1          2031       2045          2068

 SMHI          MPI-ESM-LR        RCA4               r1i1p1          2031       2045          2068

 CLMcom        EC-EARTH          CCLM4-8-17         r12i1p1         2028       2042          2067

2.1 Flood risk analysis

2.1.1 Data and models
EURO-CORDEX historical climate scenarios and future projections with the Representative
Concentration Pathway (RCP) 8.5 in Europe (Jacob et al. 2014) are used as input to
simulate river streamflow over the period 1970-2100. RCP8.5 is representative of high

                                                7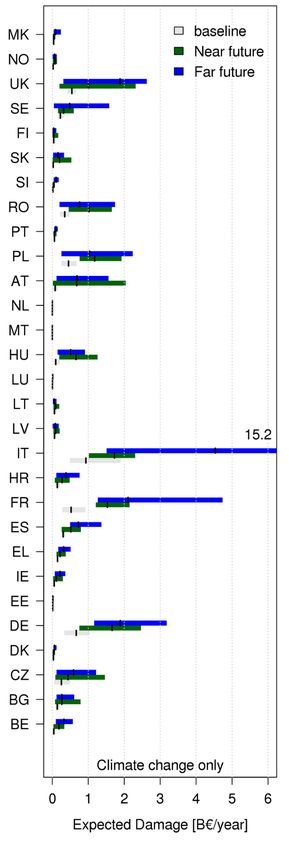
level greenhouse gas concentrations in the atmosphere. We selected seven models (see
Table 1) giving priority to driving Global Circulation Models (GCMs) with high ranking in
the performance evaluation of CMIP5 models carried out by Perez et al. (2014). Continuous
daily streamflow simulations are computed with Lisflood, a distributed, physically based
hydrological model, run at 5km grid resolution (Burek et al., 2013a; van der Knijff et al.,
2010). We used the following variables from the climate models to force Lisflood: daily
precipitation, average, minimum and maximum temperature, incoming solar radiation,
surface air pressure, specific humidity and wind speed. Lisflood is also used in Task 12 to
evaluate future changes in river flow and water resources. However, in task 12 the analysis
of high-flow conditions is limited to frequent and low-intensity river floods (Q99.9, i.e.
flows occurring approximately once every 3 years). Conversely, here we perform a full
analysis of high-flow conditions including less frequent and more severe flows, which are
more representative of hazardous flood events. Two-dimensional hydraulic simulations to
derive flood hazard maps are performed with Lisflood-FP (Bates et al., 2010), using flood
hydrographs with statistical features derived by Lisflood hydrological simulations. Such
simulations allows to represent floodplain inundation processes, which are not simulated
in Task 12.
Exposure information is given by the European population density map by Batista e Silva
et al. (2013) and by the refined version of the CORINE Land Cover proposed by Batista e
Silva et al. (2012). Both maps are consistent with official statistical data at European scale.
Moreover, they are available at the same resolution of flood hazard maps (100m) and are
consistent with the data used by other Tasks of PESETA III (e.g. Task 5 – Energy).
Vulnerability to floods is included in the form of damage functions and through a flood
protection map. Country specific depth-damage functions from Huizinga (2007) are used
to link flood depth with the corresponding direct economic damage, considering CORINE
land use classes and gross domestic product (GDP) per capita at local administrative level.
Spatial information on the flood protection level in Europe was obtained from the 5 km
resolution map produced by Jongman et al. (2014).
To disentangle the effects of climate change and socio-economic development flood risk
scenarios are obtained assuming static exposure values (static economic analysis, only
accounts for the effects of climate change) and by including socio-economic dynamics
(dynamic economic analysis) defined by two Shared Socioeconomic Pathways (SSP, O’Neill
et al., 2014) in the model chain. We considered scenarios of socio-economic development
driven by mitigation challenges (SSP5) or both mitigation and adaptation challenges
(SSP3), which are both compatible with the RCP 8.5 scenario (van Vuuren and Carter
2014). In addition, we evaluated impacts for the socio-economic scenario developed in
Task 2 of the PESETA III project (Peseta SP in the following) and based on the ECFIN
Ageing report. The coupling of climate scenarios with coherent projections of socio-
economic growth allows an overall evaluation of the future flood risk and the related
uncertainty.
Gross domestic product (GDP) and population projections from the Organisation for
Economic Co-operation and Development (OECD) for SSP5 and SSP3 were acquired in the
form of 5-years national multipliers and applied to the exposure layers (i.e. population
density and damage functions) to include socioeconomic features in the future population
affected and expected damage estimation. A similar procedure has been applied to
evaluate the socio-economic scenario developed in Task 2.

2.1.2 Modelling approach
In a first step, we used the Lisflood-FP model fed with hydrological input from Lisflood to
produce 100 m resolution maps of flood extent and flood depth in Europe for the observed
climate and return periods 10, 20, 50, 100, 200, 500 years (for more details see Alfieri et
al., 2014). Flood hazard maps were then combined with depth-damage functions and
population density maps described in Section 2.1.1 to derive expected economic damage
(ED) and population affected (PA) by floods for each of the return periods, assuming no

                                              8
flood protection. Finally, 100 m resolution maps of ED and PA were aggregated to 5 km
resolution and linked with the river network used in Lisflood.
As a second step, streamflow simulations run with Lisflood over the period 1970-2100 were
used to determine magnitude and recurrence of projected discharge peaks. Extreme value
statistical distributions were fitted on the simulated annual maxima of the control period
(1976–2005), to derive analytical relations between extreme streamflow and probability of
occurrence (and consequently of their return period), in each point of the European river
network. In this step, a Gumbel extreme value distribution was assumed for annual
maximum discharges, as described by Alfieri et al. (2015). Finally, for each of the seven
climate scenarios, flow peaks exceeding the local flood protection levels are assigned an
impact (PA and ED) through linear interpolation among the return periods estimated for
the current climate. Finally, impact estimates are aggregated in space and time, to produce
country-wide and Europe-wide estimates of expected annual damage (EAD) and expected
annual population affected (EAPA) over 30-year time slices of the baseline and future
scenarios. Maps refer to population estimates of 2006 and to GDP Purchasing Power
Standards of 2007.
2.2 Adaptation measures for flood risk reduction
Four types of adaptation measures were considered and implemented to different extents,
to assess their sensitivity to the corresponding risk reduction. In the figures and the related
discussions presented in Section 3.3, multiplicative and reduction rates associated to each
adaptation option defined below are referred to as “sensitivity factors”. Each adaptation
option targets the reduction of flood risk by acting on one of the three components of the
risk formula, namely hazard, exposure and vulnerability. Note that adaptation options have
been evaluated considering future socio-economic developments based on SSP5 scenario.
2.2.1 Increase of flood protection levels
It aims at reducing the vulnerability of people and assets to extreme streamflow conditions.
It requires limited space as it normally consists of elevating the river banks, through
permanent or temporary barriers, to increase the maximum streamflow that the
watercourse can fully contain and convey downstream without causing damage. This keeps
flood storage to minimum levels hence the magnitude of the flood peak remains unchanged
for long river reaches. As a consequence, its implementation (and maintenance) need be
homogeneous within each river basin as local weaknesses would represent preferential
triggering points for flooding. In the simulation framework, the return period of current
flood protections in Europe, expressed in years, was increased by a set of 12 constant rates
ranging between 5 % and 2500 %, where the upper bound was set to 10,000 years.
2.2.2 Reduction of the peak flows
This adaptation option aims at reducing the flood hazard through a reduction and a delaying
of peak flows during extreme events. Peak reduction is achieved by setting up areas within
or aside the river network that can be flooded in a controlled manner when the river stage
reaches critical levels. In addition, peak flows are reduced by reservoirs, sustainable urban
drainage systems (SUDS, e.g., Pasche et al. 2008), retarding basins, infiltration basins,
and through targeted land management plans such as afforestation and river renaturation
(Reinhardt et al. 2011). In this study, we run the impact model with a set of 11 different
reduction factors between 5 % and 95 % applied to the return period (i.e., the average
recurrence interval) of simulated discharge peaks.
2.2.3 Reduction of vulnerability
This measure includes all adaptation options which can be modelled through a progressive
reduction of the vulnerability, including the implementation of early warning systems, dry
and wet flood proofing, and floating buildings, among others (see Kreibich et al. 2015;
9Pappenberger et al., 2015). In the impact model, the adaptive measure is implemented
through a multiplicative factor, ranging between 0 and 1, applied to the damage curves
and to the population density layer. One should note that this measure does not reduce
the frequency of flooding events but rather the consequences of the flooding, hence the
reduction in population affected is to be seen as a reduction of the degree of disruption to
the population and their activities
2.2.4 Relocation
Relocation reduces the exposure of people and assets at risk of flooding by moving them
to areas with negligible risk (King et al. 2014). Here, we define a relocation mask as the
set of areas with 3 or more meters of flood depth following an event with return period of
20 years, assuming no flood protections in place. By definition, in these areas, flooding has
a 50 % probability to occur in a 13.5 year period, so it is likely to be experienced by
permanent residents once or more in their lifetime. In the impact assessment, we tested
8 different relocation ratios between 5 % and 100 %, to be applied as multiplicative factors
to people and assets located within the area defined by the relocation mask. These modified
exposure layers are then used within the risk assessment framework to estimate the
impact of future flood peaks and their corresponding inundation depths.
103 Results
3.1 Flood hazard in Europe
We report in Table 2 the results of the frequency analysis of extreme peak flow events
above a 100-year return period (referred to as f100), aggregated at country level. Such
an analysis is of particular interest, given that the average protection level of the European
river network is of the same magnitude (Rojas et al., 2013), with some obvious differences
among different countries and river basins (Jongman et al., 2014). In other words, a
substantial increase in the frequency of peak flows below the protection level is likely to
have a lower impact, in terms of population affected and economic losses, in comparison
to a small but significant change in extreme events causing settled areas to be inundated
by the flood flow. A summary of country-aggregated estimates of f100 and the relative
changes from the baseline in future time slices is shown in Table 2. Values are obtained by
counting the average frequency of occurrence in all grid points of the river network within
each country. The statistical significance of the estimated change in the ensemble mean
was tested with a two-proportion z test. A stringent p value of 1‰ is chosen as threshold
for significance, to compensate for the autocorrelation of extreme events in neighbouring
grid points along the drainage direction. In addition, this issue is mitigated by the use of
an ensemble of seven independent models. Note that no flood damages are computed for
Cyprus and Malta because the river network in these countries is below the minimum
threshold considered in the analysis.
The first striking outcome of Table 2 is the predominance of positive changes in f100 since
the “near future” time slice, with most of the countries experiencing an increase of more
than 100% and several exceeding 200% and more like Iceland (390%), Kosovo (405%)
and the Netherlands (296%). In the “far future” time slice, projected changes show a
further increase above 200% in most countries, with values ranging between 11% in
Finland and up to 1050% in Iceland. This means that in all countries there will be an
increase in frequency of severe flood events.
11Table 2. Mean annual exceedance frequency of the 100-year return period peak flow for different
European countries and percentage change between the baseline and the future time slices.
Changes in italic are not significant at 1‰.
f100 Δf100
Country
baseline 2021-2050 2071-2100 2021-2050 2071-2100
Austria 0.0067 0.0223 0.0316 231% 369%
Belgium 0.0102 0.0344 0.0519 235% 407%
Belarus 0.0083 0.0152 0.0157 83% 90%
Bosnia - Herzegovina 0.0096 0.0211 0.0302 121% 216%
Bulgaria 0.0159 0.0292 0.0324 84% 104%
Croatia 0.0062 0.0165 0.0267 165% 328%
Cyprus 0.0000 0.0000 0.0000 0% 0%
Czech Republic 0.0140 0.0199 0.0246 42% 76%
Denmark 0.0179 0.0228 0.0377 28% 111%
Estonia 0.0025 0.0069 0.0118 179% 379%
Finland 0.0031 0.0030 0.0034 -4% 11%
France 0.0094 0.0235 0.0334 150% 256%
FYROM 0.0120 0.0204 0.0464 69% 285%
Germany 0.0115 0.0235 0.0282 105% 146%
Greece 0.0113 0.0242 0.0410 113% 262%
Hungary 0.0087 0.0222 0.0236 153% 170%
Ireland 0.0086 0.0211 0.0494 147% 477%
Iceland 0.0020 0.0100 0.0235 390% 1050%
Italy 0.0126 0.0241 0.0483 92% 284%
Kosovo 0.0088 0.0443 0.0512 405% 484%
Lithuania 0.0078 0.0131 0.0122 66% 55%
Luxemburg 0.0058 0.0201 0.0194 247% 235%
Latvia 0.0054 0.0163 0.0192 202% 255%
Malta 0.0000 0.0000 0.0000 0% 0%
Moldova 0.0203 0.0402 0.0310 98% 53%
Montenegro 0.0089 0.0200 0.0388 125% 335%
The Netherlands 0.0090 0.0358 0.0511 296% 465%
Norway 0.0027 0.0086 0.0091 215% 233%
Poland 0.0125 0.0268 0.0261 114% 109%
Portugal 0.0074 0.0115 0.0237 55% 220%
Romania 0.0088 0.0224 0.0266 154% 201%
Serbia 0.0091 0.0275 0.0374 203% 313%
Slovenia 0.0061 0.0230 0.0365 279% 501%
Slovakia 0.0050 0.0153 0.0144 206% 190%
Sweden 0.0029 0.0062 0.0093 118% 224%
Spain 0.0090 0.0185 0.0286 106% 218%
Switzerland 0.0036 0.0122 0.0223 238% 517%
United Kingdom 0.0120 0.0216 0.0410 81% 242%
Europe 0.0080 0.0204 0.0320 113% 234%
3.2 Flood risk in Europe
Spatially aggregated mean values of Expected Annual Damage (EAD) and Expected Annual
People Affected (EAPA) per year are shown in Figures 2 and 3, together with the ensemble
spread given by the seven model realizations. Relative changes from the baseline average
values can be read in the y-axis on the right. Projections of EAD and EAPA considering
12SSP3 and SSP5 are shown in Figure 2, while impact projections considering PESETA
socioeconomic scenario (Peseta SP) are displayed in Figure 3.
Figure 2. Simulated damage and population affected per year and relative change from the
baseline scenario (Europe-wide aggregated figures). Future scenarios include no SSP (with
ensemble spread in pink), SSP3, and SSP5, together with their 10-years moving average.
Overall mean impact in Europe for the baseline scenario amounts to €5.3 billion of damage
and 216,000 people affected per year. This compares well with estimates by the
Association of British Insurers (ABI, 2005) and by the European Environment Agency (EEA,
2010), reporting figures of annual losses between €4.3 and 8 billion and 262,000 people
affected each year by flood events in Europe. If SSPs are not considered, this means when
only accounting for the effects of climate change, overall mean projections of annual
population affected by floods are estimated to increase to 530,000 for the “near future”
time slice and to further rise to 720,000 for the “far future”. Conversely, the expected
13annual damage is projected to rise to €12.5 billion (+108%) and €17.5 billion (+227%)
through the future time slices. When SSPs are accounted for, EAPA remains comparable to
the “No SSP” scenario for the “near future” time slice, and increases for the “far future” to
reach 530,000 and 975,000 for SSP3 and SSP5, respectively. Under the Peseta SP scenario
EAPA remains always close to the “No SSP” scenario (Figure 3). The increases are much
larger for EAD, which is projected to reach 29 B€ under SSP3, and a stunning €112 billion
under SSP5, while under the Peseta SP scenario the projected value exceeds €50 billion.
Figure 3. Simulated damage and population affected per year and relative change from the
baseline scenario (Europe-wide aggregated figures). Future scenarios include no SSP (with
ensemble spread in pink) and Peseta scenario, together with their 10-years moving average.
Future risk projections for each time slice are then broken down at country level for the
three socioeconomic pathways as shown in Figures 4, 5 and 6. These figures highlight
14countries that contribute the most to the overall change in flood risk through the current
century, together with the associated uncertainty of the ensemble and their mean value.
Figure 4. Country aggregated expected annual damage for the baseline and future time slices of
2021-2050 (near future) and 2071-2100 (far future) (mean value and ensemble spread) for the
three cases of no SSP (left), SSP3 (centre), and SSP5 (right). Some countries are not included in
the graphs because impacts are negligible compared to other countries.
Results clearly show an increasing spread of the model ensemble in time, though with
some exceptions, notably in the near future time slice (i.e. 2021-2050). When only the
climate forcing is considered (i.e. “No SSP” scenario), countries with mean EAD larger than
€1 billion by the end of the century are Italy (€4.6 billion), France (€2.1 billion), UK (€1.9
billion) and Germany (€1.8 billion), though Poland is projected to reach €1.2 billion by the
time slice 2020, later decreasing at about €1 billion by the end of the century. Where SSPs
or Peseta SP are included, EAD is projected to rise further in all countries, reaching an
average five-fold increase for the SSP5 in the “far future” time slice as compared to the
“No SSP” scenario, which becomes seven-fold for UK and France. Considering projections
of average annual population affected driven only by climate forcing, the most affected
countries by the end of the century will be Germany (110,000), Italy (95,000) and France
(90,000). Under SSP3 scenario, EAPA is comparable or lower with respect to the “No SSP”,
15while in the SSP5 scenario the impacts for all countries are projected to be larger, with an
increasing spread of the model ensemble. Under Peseta SP scenario, the increase of future
impacts is generally in between SSP3 and SSP5 values (Figure 6).
Figure 5. Country aggregated affected population for the baseline and future time slices of 2021-
2050 (near future) and 2071-2100 (far future) (mean value and ensemble spread) for the three
cases of no SSP (left), SSP3 (centre), and SSP5 (right). Some countries are not included in the
graphs because impacts are negligible compared to other countries.
16Figure 6. Country aggregated affected population (right) and economic damage (left) for the
baseline and future time slices of 2021-2050 (near future) and 2071-2100 (far future) (mean value
and ensemble spread) for the Peseta SP scenario. Some countries are not included in the graphs
because impacts are negligible compared to other countries.
Figure 7 shows the annual ED and PA for the baseline and specific warming levels (SWLs)
of 1.5, 2 and 3°C. Note that no SSPs have been considered in this case.
17Figure 7. Country aggregated EAD and EAPA for the baseline and 3 specific warming levels (1.5, 2
and 3°C warming) based on a static economic analysis. Some countries are not included in the
graphs because flood damages are negligible compared to other countries.
Results show a general trend of rising flood losses with increasing warming level. At present
about 220,000 people are flooded annually, which rises to 480,000 under 1.5°C global
warming. With 2°C warming this amount is slightly higher to equal 510,000, whereas under
3°C warming more than 600,000 people will be annually under risk of flooding. Direct
18economic losses from flooding show a similar trend, with expected annual damages
projected to rise from €5.3 billion/year at present to €11 billion/year, €12 billion/year and
€14.5 billion/year respectively under 1.5, 2, and 3°C warming. In a 3°C warmer world, the
four largest European countries in terms of population (i.e., Germany, France, United
Kingdom and Italy) are projected to suffer a considerable increase in population affected
and direct damage by river floods, reaching a total (ensemble mean) of 290,000 people
affected and €8 billion damage per year, as compared to 90,000 people and €2.7 billion
damage per year in the present climate.
When evaluating the results, it is important to remember that the proposed approach is
focused on the flood risk due to riverine floods in river basins with upstream area larger
than 500 km2 (see Alfieri et al., 2014). Hence, the impact due to flash floods, surface water
flooding and coastal floods is not accounted for. In addition, despite our effort to
characterize and possibly minimize the climatic uncertainty, one should be aware of other
sources of uncertainty (e.g., in the hydrological and hydraulic modelling, in the space-time
discretization, in the impact model, among others) which affect complex modelling
framework such as the one presented in this work.
3.3 Strategies for flood risk reduction
The effect of the four adaptation strategies described in Sect. 2.2 on annual estimates of
population affected and expected damage in Europe is shown in Fig. 8. Each graph includes
the corresponding average impact of the same set of simulations over the baseline window
1976–2005. Graphs in Fig. 8 clearly indicate increasing flood risk and ensemble spread for
time slices further in time, as a combination of increasing hazard due to climatic change
and of socio-economic drivers. Also, the graphs indicate a non-linear behaviour in the risk
reduction of the first two adaptation options, as opposed to a linear trend in the latter two,
which leave the flood depth and extent unchanged while acting on measures to reduce the
disruption to population and assets. Past levels of flood impact are unlikely to be retained
by the end of the century if only one adaptation option is implemented.
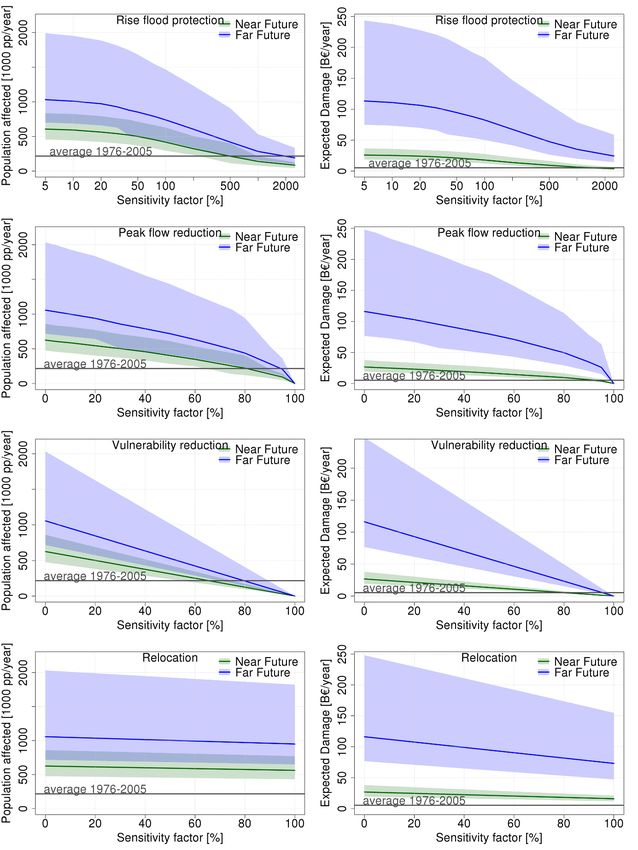
Risk reduction estimates were then aggregated for each of the 28 countries. Figures 9 and
10 show the results for Germany, France, UK and Italy, which together contribute to more
than 50 % of the European population considered in this study. Note that we considered
here three future time slices centred respectively at 2020, 2050 and 2080, to illustrate
better the development in time. Each graph shows, with a horizontal dashed line, the risk
reduction needed to retain the relative flood impact of the baseline window 1976–2005.
Differently from Fig. 8, the horizontal line referring to historical impact data do not include
the socio-economic development but only the effect of climate change. In practice, it
represents the risk reduction needed to keep the historical ratio of population affected and
economic damage as compared to the country population and GDP. In most countries, the
required risk reduction grows in time due to the increasing flood risk, which implies a
continuous effort to improve the adaptation strategy. For instance, in Germany (DE) in the
TS 2020, historical values of flood impact can be retained as long as adaptation measures
are implemented to achieve a risk reduction of 65 % (PA, Fig. 9) and 61 % (ED, Fig. 10),
as compared to the no-adaptation scenario. Regarding population affected, the risk
reduction can be achieved on average with 65 % reduction of vulnerability, 80 % reduction
of the return period of peak flows, or a 5 to 10-fold increase in the return period of flood
protections. One can note that a complete relocation of people living in the relocation mask
would reduce the population affected by only 12 %, which is far less than the target risk
reduction. On the other hand, the reduction in expected damage through relocation was
always found larger (e.g., 59 % in Germany), suggesting that a considerable proportion of
assets is currently located in areas at risk of flooding. Also, it is noteworthy that
vulnerability reduction measures do not depend on the climate scenarios and consequently
on the frequency of flooding, hence no spread of the climate scenarios can be seen in Figs.
9 and 10.
19Figure 8. Benefits of four adaptation strategies on ensemble annual estimates of population
affected (left) and expected damage (right) in Europe in future time slices 2021-2050 (Near
Future) and 2071-2100 (Far Future), as compared with baseline period (1976-2005).
20Figure 9. Risk reduction in population affected through different adaptation options. Ensemble
projections over 3 time slices are shown for Germany, France, UK and Italy
When evaluating the results, it should be considered that sensitivity factors approaching
100 % reduction of the peak flow and of the vulnerability are unrealistic with technologies
currently available. Simulations in the upper range of sensitivity are shown for
completeness of the analysis as well as to show the effect of the climate uncertainty at
different sensitivity levels. In real world applications, peak flow reduction rates rarely
exceed 50 % (Pasche et al. 2008; Reinhardt et al. 2011) and tend to decrease with the
event magnitude and with the catchment area. With regard to vulnerability reduction, early
warning systems are known to yield profitable cost-benefit ratios (Pappenberger et al.
2015), though with relatively low risk reduction ratios (Meyer et al. 2012). On the other
hand, structural measures for vulnerability reduction lead to higher risk reduction rates, at
the expense of more considerable investments.
21Figure 10. Risk reduction in expected damage through different adaptation options. Ensemble
projections over 3 time slices are shown for Germany, France, UK and Italy
From a numerical viewpoint, it appears that rising flood protections is the only adaptation
option that can compensate for any increase in the flood risk. It has relatively high cost-
effectiveness (Fenn et al. 2014) and often finds little societal resistance in its
implementation as it is mostly not associated with land-use changes. However, a
comprehensive analysis of costs and benefits of this adaptation measure should include
the following issues:
– An additional risk component is due to the probability of failure of the flood
protections for event magnitudes lower than the design standards, as often occurs
in flood events (Zurich 2014).
– Heightening river dykes reduces the probability of overflowing thus minimizing the
floodplain storage and increasing the magnitude of peak flows downstream.
– Rising flood protections and the consequent reduction in the frequency of flooding
events favours the loss of flood memory, leading to increasing exposure in flood-
prone areas (Di Baldassarre et al. 2015). This dynamic, usually referred to as “levee
22effect”, is characterized by potentially long flood-free periods followed by
catastrophic events and large flood losses.
On the other hand, empirical evidence suggests that recurrent flooding is usually
associated with decreasing vulnerability (e.g., Jongman et al. 2015), due to the enhanced
resilience and coping capacity acquired by the society during previous events (so-called
“adaptation effect”).
Finally, the benefits of methods relying on reducing the exceedance of flood thresholds
(i.e., rising flood protections, reducing peak flow) heavily depend on the future climate
scenario. In some cases, the magnitude of future climate extremes is within a relatively
wide range around that of local flood protections, so that the consequent ensemble range
of estimated risk reduction can be large. Uncertainty in risk reduction consistently
decreases in the case of relocation and disappear altogether in vulnerability reduction, as
these measures rely on reducing the consequences of a flooding event, rather than trying
to avoid it.
234 Conclusions
Results from this work suggest that future river flood risk in Europe will largely increase
compared to present levels, due to both climate change and socio-economic developments.
According to the models applied, impacts under current socio-economic conditions and for
baseline climate amount to €5.3 billion of damage and 216,000 people affected by river
floods every year, well within the range of the observed values found in the literature. By
forcing the model with high end climatic projections, the socio-economic impact of river
floods is projected to increase by an average of 220% by the end of the century, due to
climate change only.
Estimates of population annually affected in 2021-2050 are within 500,000 and 640,000
and within 540,000 and 950,000 in 2071-2100. Larger variability is foreseen in the future
economic growth and consequently in the expected damage of flooding, with central
estimates at 10–30 B€ in 2021-2050 and 30–100 B€ in 2071-2100. Under a 2°C global
warming scenario and considering current socio-economic conditions, flood impacts could
more than double, with 520,000 people annually exposed to floods and 12.5 B€ of annual
losses.
High-end climate scenarios are hereby shown to be linked with a significantly larger impact
of future river floods on the European economy and society. In addition, we showed how
four different classes of adaptation options can reduce the future flood risk to compensate
for the impact of climate change. Research findings suggest that current relative flood
impact levels can be retained or even decreased in the future decades, provided that
coordinated and effective adaptation plans are promptly prepared and put into action.
Under the projected increase in frequency and magnitude of river floods, traditional
approaches based only on rising indefinitely local flood protections are not sustainable in
the long term. The combined effect of these two dynamics is likely to exacerbate the “levee
effect” by reducing the frequency of moderate events and exposing the society to few
catastrophic floods, followed by potentially long and painful post-event recovery. We
recommend future adaptation strategies to be based on a combination of different
measures working in synergy and optimized at the level of river basins, rather than through
independent actions over selected river reaches.
24References
Alfieri, L., Burek, P., Feyen, L., Forzieri, G., 2015a. Global warming increases the
frequency of river floods in Europe, Hydrol. Earth Syst. Sci. 19, 2247-2260.
Alfieri, L., Feyen, L., Dottori, F., Bianchi, A., 2015b. Ensemble flood risk assessment in
Europe under high end climate scenarios, Glob. Environ. Change 35, 199–212,
doi:10.1016/j.gloenvcha.2015.09.004
Alfieri, L., Feyen, L., Di Baldassarre, G., 2016. Increasing flood risk under climate
change: a pan-European assessment of the benefits of four adaptation strategies,
Clim. Change 136, 507-521.
ABI, 2005. Financial Risks of Climate Change - Summary Report, Association of
British Insurers.
Adger, W.N., Arnell, N.W., Tompkins, E.L., 2005. Successful adaptation to climate
change across scales. Glob. Environ. Change 15, 77–86.
doi:10.1016/j.gloenvcha.2004.12.005
Bates, P. D., Horritt, M. S., Fewtrell, T. J., 2010. A simple inertial formulation of the
shallow water equations for efficient two-dimensional flood inundation
modelling. J. Hydrol. 387, 33-45.
Batista e Silva, F., Lavalle, C., Koomen, E., 2012. A procedure to obtain a refined
European land use/cover map. J. Land Use Sci. 1–29. doi:http://dx.doi.org/
10.1080/1747423X.2012.667450.
Batista e Silva, F., Gallego, J., Lavalle, C., 2013. A high-resolution population grid map
for Europe. J. Maps 9, 16–28. doi:http://dx.doi.org/10.1080/ 17445647.2013.764830.
Brandimarte, L., Brath, A., Castellarin, A., Di Baldassarre, G. 2009. Isla Hispaniola: A
trans-boundary flood risk mitigation plan. Phys Chem Earth 34, 209–218.
doi:10.1016/j.pce.2008.03.002
Bichard, E., Kazmierczak, A., 2012. Are homeowners willing to adapt to and mitigate
the effects of climate change? Clim. Change 112, 633–654. doi:10.1007/s10584-011-
0257-8
Burek, P., Knijff van der, J., Roo de, A., 2013. LISFLOOD, Distributed Water Balance
and Flood Simulation Model Revised User Manual 2013. Publications Office,
Luxembourg.
Christensen, J. H., & Christensen, O. B., 2007. A summary of the PRUDENCE model
projections of changes in European climate by the end of this century. Clim.
change, 81, 7-30.
Dankers, R., Feyen, L., 2009. Flood hazard in Europe in an ensemble of regional
climate scenarios. J. Geophys. Res. Atmos. 114, doi:http://dx.doi.org/10.1029/
2008jd011523.
Di Baldassarre, G., Viglione, A., Carr, G., et al., 2015. Debates—perspectives on
sociohydrology: capturing feedbacks between physical and social processes.
Water Resour Res 51, 4770–4781, doi:10.1002/2014WR016416
EEA, Mapping the Impacts of Natural Hazards and Technological Accidents In
Europe - An Overview of the Last Decade. European Environment Agency, ISBN 978-
92-9213-168-5 No. EEA Technical report No. 13/2010, 2010.
EEA, 2017. Climate change, impacts and vulnerability in Europe 2016. EEA Report
No 1/2017.
European Commission, 2007. Directive 2007/60/EC of the European Parliament and
of the Council of 23 October 2007 on the assessment and management of flood
risks.
25Fenn, T., Fleet, D., Hartman, M., et al., 2014. Study on economic and social benefits
of environmental protection and resource efficiency related to the European
semester final report.
Frei, C., Schöll, R., Fukutome, S., Schmidli, J., Vidale, P.L., 2006. Future change of
precipitation extremes in Europe: Intercomparison of scenarios from regional
climate models. Journal of Geophysical Research: Atmospheres, 111(D6).
Hallegatte, S., 2009. Strategies to adapt to an uncertain climate change. Glob
Environ Chang 19, 240–247. doi:10.1016/j.gloenvcha.2008.12.003
Huizinga, H.J., 2007. Flood Damage Functions for EU Member States. HKV Lijn in
water, Lelystad, the Netherlands.
Jacob, D., Petersen, J., Eggert, B., et al., 2014. EURO-CORDEX: new high-resolution
climate change projections for european impact research. Reg Environ Chang 14,
563–578. doi:10.1007/s10113-013-0499-2
Jongman, B., Hochrainer-Stigler, S., Feyen, L., Aerts, J. C. J. H., Mechler, R., Botzen, W.
J. W., Bouwer, L. M., Pflug, G., Rojas, R., and Ward, P. J., 2014. Increasing stress on
disaster-risk finance due to large floods. Nat. Clim. Change 4, 264–268,
doi:10.1038/nclimate2124.
Keskitalo, E.C.H., Vulturius, G., Scholten, P., 2014. Adaptation to climate change in
the insurance sector: examples from the UK, Germany and the Netherlands. Nat
Hazards 71, 315–334. doi:10.1007/s11069-013-0912-7.
King D, Bird D, Haynes K, et al. (2014) Voluntary relocation as an adaptation strategy
to extreme weather events. Int J Disaster Risk Reduct 8, 83–90.
doi:10.1016/j.ijdrr.2014.02.006
Kreibich H, Bubeck P, Van Vliet M, De Moel H, 2015. A review of damage-reducing
measures to manage fluvial flood risks in a changing climate.
Opperman, J.J., Galloway, G.E., Fargione, J., et al., 2009. Sustainable floodplains
through large-scale reconnection to rivers. Science 326, 1487–1488.
doi:10.1126/science.1178256
McLeman, R., Smit, B., 2006 Migration as an adaptation to climate change. Clim
Chang 76, 31–53 doi:10.1007/s10584-005-9000-7.
Nikulin, G., et al., 2011. Evaluation and future projections of temperature,
precipitation and wind extremes over Europe in an ensemble of regional climate
simulations. Tellus A 63.1, 41-55.
Pasche, E., Manojlovic, N., Behzadnia, N., 2008. Floods in small urban catchments:
hydrological sensitivity, risk assessment and efficient integrative strategies of
mitigation. In: Proceedings of the 11th International Conference on Urban Drainage,
Edinburgh.
Reinhardt, C., Bölscher, J., Schulte, A., Wenzel, R., 2011. Decentralised water retention
along the river channels in a mesoscale catchment in South-Eastern Germany.
Physics and Chemistry of the Earth 36, 309–318. doi:10.1016/j.pce.2011.01.012
Pappenberger F, Cloke HL, Parker DJ, et al., 2015. The monetary benefit of early flood
warnings in Europe. Environ Sci Pol 51:278–291. doi:10.1016/j.envsci.2015.04.016
Perez, J., Menendez, M., Mendez, F. J., Losada, I. J., 2014 Evaluating the performance
of CMIP3 and CMIP5 global climate models over the north-east Atlantic region,
Clim. Dynam. 43, 2663-2680, doi:10.1007/s00382-014-2078-8.
Rojas, R., Feyen, L., and Watkiss, P., Climate change and river floods in the European
Union: Socio-economic consequences and the costs and benefits of adaptation,
Global Environ. Change, 23, 1737–1751, doi:10.1016/j.gloenvcha.2013.08.006.
UNISDR, 2009. UNISDR Terminology on Disaster Risk Reduction.
26Reinhardt, C., Bölscher, J., Schulte, A., Wenzel, R., 2011. Decentralised water retention
along the river channels in a mesoscale catchment in South-Eastern Germany.
Physics and Chemistry of the Earth 36, 309–318, doi:10.1016/j.pce.2011.01.012
Rohde, S., Hostmann, M., Peter, A., Ewald, K.C., 2006. Room for rivers: An integrative
search strategy for floodplain restoration. Landsc Urban Plan 78, 50–70.
doi:10.1016/j.landurbplan.2005.05.006
van der Linden, P., & Mitchell, J. E., 2009. ENSEMBLES: Climate change and its
impacts-Summary of research and results from the ENSEMBLES project.
van der Knijff, J.M., Younis, J., de Roo, A.P.J., 2010. LISFLOOD: a GIS-based
distributed model for river basin scale water balance and flood simulation. Int. J.
Geogr. Inf. Sci. 24, 189–212.
van Vuuren, D.P., Carter, T.R., 2014. Climate and socio-economic scenarios for
climate change research and assessment: reconciling the new with the old. Clim.
Change 122, 415–429. doi:http://dx.doi.org/10.1007/s10584-013-0974-2.
Zurich, 2014. Risk Nexus, Central European floods 2013: a retrospective.
Wenger, C., 2015. Better use and management of levees: reducing flood risk in a
changing climate. Environ Rev 23, 240–255, doi:10.1139/er-2014-0060.
Whitfield, P.H., 2012. Floods in future climates: a review. Journal of Flood Risk
Management 5(4), 336-365.
27You can also read