Development of a precipitation-area curve for warning criteria of short-duration flash flood - NHESS
←
→
Page content transcription
If your browser does not render page correctly, please read the page content below
Nat. Hazards Earth Syst. Sci., 18, 171–183, 2018
https://doi.org/10.5194/nhess-18-171-2018
© Author(s) 2018. This work is distributed under
the Creative Commons Attribution 4.0 License.

Development of a precipitation–area curve for warning criteria of
short-duration flash flood
Deg-Hyo Bae1 , Moon-Hwan Lee1 , and Sung-Keun Moon2
1 Departmentof Civil and Environmental Engineering, Sejong University, Seoul, 05006, South Korea
2 WaterResources Research Division, Water Resources & Environment Research Group, Rural Research Institute,
Korea Rural Community Corporation, Ansan-si, Gyeonggi-do, 15634, South Korea

Correspondence: Deg-Hyo Bae (dhbae@sejong.ac.kr)

Received: 13 June 2017 – Discussion started: 10 July 2017
Revised: 8 November 2017 – Accepted: 19 November 2017 – Published: 12 January 2018

Abstract. This paper presents quantitative criteria for flash      1   Introduction
flood warning that can be used to rapidly assess flash flood
occurrence based on only rainfall estimates. This study was        Flash floods are among the deadliest natural disasters, with
conducted for 200 small mountainous sub-catchments of the          significant socioeconomic effects and the highest average
Han River basin in South Korea because South Korea has             mortality rate among types of floods (Jonkman, 2005). Flash
recently suffered many flash flood events. The quantitative        floods are generally associated with localized, intense rain-
criteria are calculated based on flash flood guidance (FFG),       fall events in small and medium watersheds. It is difficult to
which is defined as the depth of rainfall of a given duration      monitor and forecast flash floods due to the unusually short
required to cause frequent flooding (1–2-year return period)       response time for these natural disasters. Additionally, cli-
at the outlet of a small stream basin and is estimated using       mate change likely increased the number of extreme rain-
threshold runoff (TR) and antecedent soil moisture condi-          fall events and the risk of flash floods (Gregory and Mitchell,
tions in all sub-basins. The soil moisture conditions were         1995; Palmer and Raisanen, 2002). Therefore, reliable flash
estimated during the flooding season, i.e., July, August and       flood forecasting methods are necessary for flash flood re-
September, over 7 years (2002–2009) using the Sejong Uni-          sponse.
versity Rainfall Runoff (SURR) model. A ROC (receiver op-             To judge flash flood occurrence, there are three methods:
erating characteristic) analysis was used to obtain optimum        flash flood susceptibility assessment, the flow comparison
rainfall values and a generalized precipitation–area (P –A)        method and the rainfall comparison method (Hapuarachchi
curve was developed for flash flood warning thresholds. The        et al., 2011). Flash flood susceptibility assessment can be
threshold function was derived as a P –A curve because the         considered a useful first step in determining the contribut-
precipitation threshold with a short duration is more closely      ing factors to the flash flood vulnerability (possibility of flash
related to basin area than any other variables. For a brief de-    flood occurrence and degree of danger) of a catchment using
scription of the P –A curve, generalized thresholds for flash      limited data (Collier and Fox, 2003). The flow comparison
flood warnings can be suggested for rainfall rates of 42, 32       method compares the model-driven flow value with the ob-
and 20 mm h−1 in sub-basins with areas of 22–40, 40–100            served flooding threshold, which is a criterion for deciding
and > 100 km2 , respectively. The proposed P –A curve was          whether flooding should be expected or not. However, this
validated based on observed flash flood events in different        approach has some limitations for real-time flash flood fore-
sub-basins. Flash flood occurrences were captured for 9 out        casting because it requires long historical data and hydrolog-
of 12 events. This result can be used instead of FFG to iden-      ical simulation to establish a flash flood modeling system.
tify brief flash flood (less than 1 h), and it can provide warn-   The rainfall comparison method compares threshold rain-
ing information to decision-makers or citizens that is rela-       fall causing flooding flow with the forecast rainfall instead
tively simple, clear and immediate.                                of comparing forecast with observed flows. This method is
                                                                   a tool to warn of an imminent flash flood and the typical

Published by Copernicus Publications on behalf of the European Geosciences Union.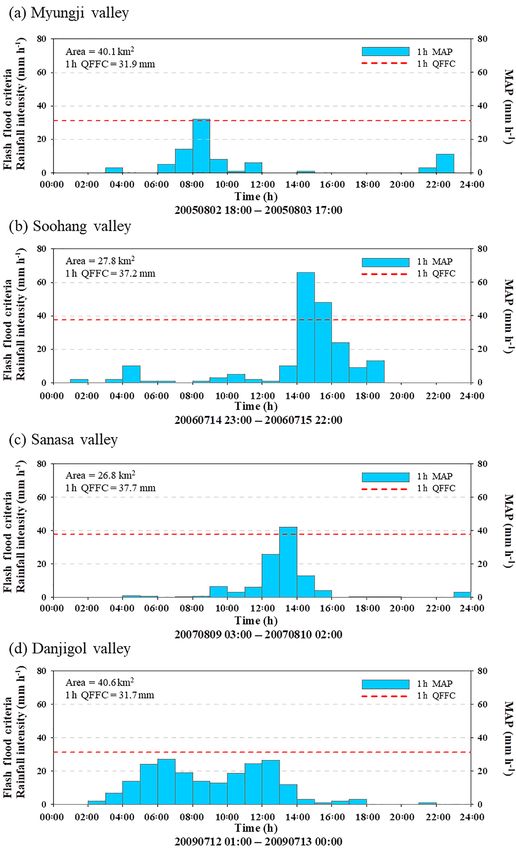
172 D.-H. Bae et al.: Development of a precipitation–area curve
method is FFG (flash flood guidance) (Carpenter et al., 1999; A) curve for flash flood warning based on FFG due to the
Carpenter and Georgakakos, 1993). This method is com- lack of observed flash flood events. Thus, a P –A curve was
monly used for flash flood forecasting, as it is easily under- derived by using FFG, but we validated the criteria by using
stood by the general public because it provides a qualitative observed flash flood events. Additionally, this study derives
criterion that can be used to intuitively determine whether a the importance of soil moisture estimation and which vari-
flash flood will occur. able has the largest effect for deciding flash floods related to
Some recent studies suggest the limitations of FFG (Nor- topography information. The proposed criteria and method-
biato et al., 2008; Montesarchio et al., 2011; Gourley et ology will serve as an important tool for issuing flash flood
al., 2012). The limitations of FFG are in the assumptions warnings based on only rainfall information.
of spatially–temporally uniform rainfall and linear response
and the use of regional relationships to make inferences
about ungauged locations. FFG performance in ungauged 2 Study area and datasets
basins is less accurate (Norbiato et al., 2008). Recent studies
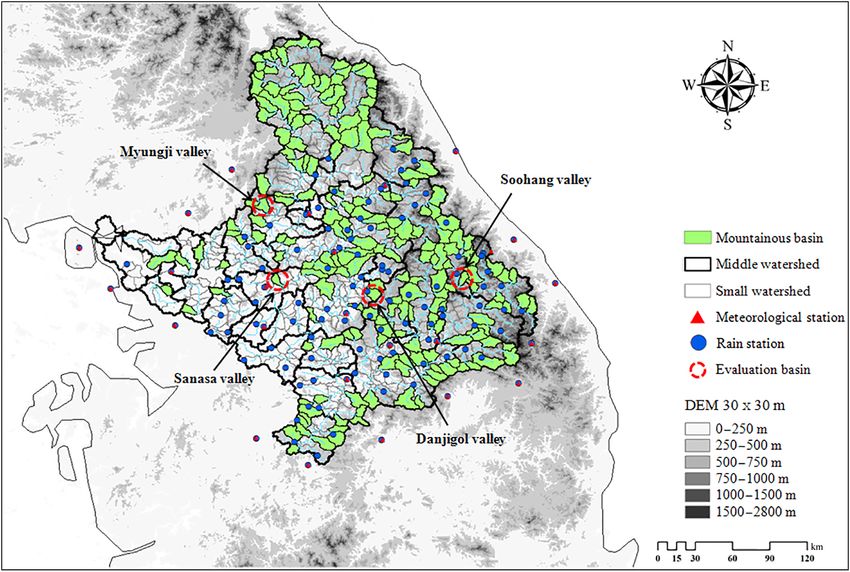
The study was conducted in small mountainous sub-
tried to improve the warning accuracy. Schmidt et al. (2007)
catchments in the Han River basin. The Han River basin
proposed a raster-based method to derive a gridded FFG
is located in the center of the Korean Peninsula at 36◦ 300 –
(GFFG). Gourley et al. (2012) reported that FFG performs
38◦ 550 N and 126◦ 240 –129◦ 020 E. The watershed area spans
better than GFFG, but GFFG can detect spatial variability.
over 26 356 km2 , or approximately 23 % of the South Ko-
Miao et al. (2016) established a strategy for flash flood warn-
rean territory (Fig. 1). The 660 sub-basins with areas of
ing that is based on the definition of rainfall threshold us-
0.1–179.8 km2 were delineated using ArcGIS (as shown in
ing distributed hydrological model. They claimed that phys-
Fig. 2a). Figure 2b shows the relative frequencies of sub-
ically based methodologies are more appropriate for flash
basins with areas in different ranges. The average area of
flood forecasting. In South Korea, flash flood studies have
a sub-basin was 38.5 km2 , with a standard deviation of
also been performed. Bae and Kim (2007) provided the FFG
25.7 km2 . Most of the sub-basins were in the range of 20–
using the Manning equation, GIUH (geomorphologic instan-
40 km2 , with a relative frequency of approximately 40 %.
taneous unit hydrograph) and TOPMODEL (Beven et al.,
The reservoirs located in the Han River basin were identi-
1994). Lee et al. (2016) generated a gridded flash flood index
fied and omitted from further analysis to remove the effect of
using the gridded hydrologic components of the TOPLATS
surface runoff storage on threshold runoff (TR). The reser-
land surface model and a statistical flash flood index model.
voirs store surface runoff from the upstream area and reduce
Recent studies have focused on the accuracy and spatial dis-
the contributing area for surface runoff at downstream lo-
tribution of FFG.
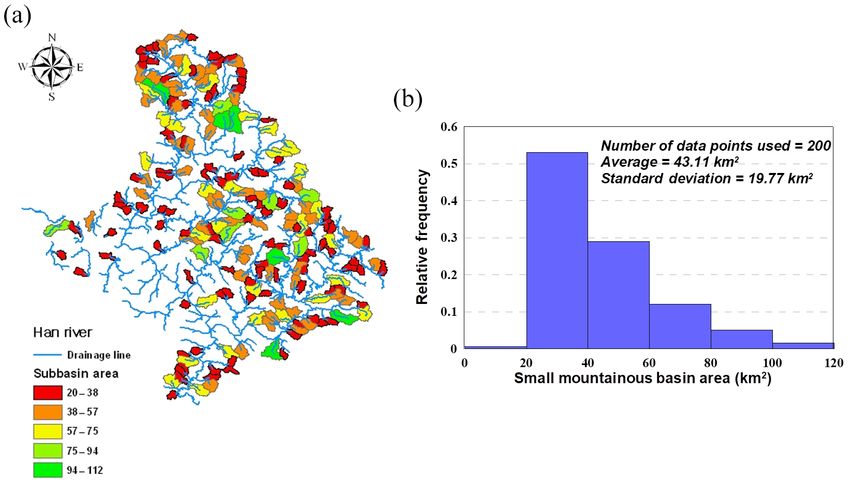
cations. Among the 660 sub-basins, we selected headwater
However, South Korea has recently suffered many flash
basins and mountainous basins and removed artificial river
flood events in the mountainous regions. More than 64 % of
basins. A total of 200 sub-basins were selected, as shown in
South Korea is mountainous and prone to flash floods with
Fig. 3a. Figure 3b shows the relative frequencies of the ar-
very short rainfall durations. Recent heavy rainfalls in South
eas of the selected sub-basins. The average area of a selected
Korea have triggered flash floods and landslides that caused
basin was 43.1 km2 , with a standard deviation of 19.8 km2 .
severe damage to infrastructure and resulted in dozens of
Rainfall and soil moisture were the main datasets used
deaths. Notably, the heavy rainfall events have resulted in
to estimate FFG. Rainfall data were obtained at 96 loca-
several flash floods since 2000, such as events in 2005, 2006,
tions from the Ministry of Land, Infrastructure and Transport
2008 and 2012 at several locations in South Korea. In par-
(MOLIT) and at 25 locations from the Korean Meteorologi-
ticular, the hourly maximum rainfall exceeded 50 mm h−1 in
cal Administration (KMA). Rain gauges recorded data at 114
2006 and 2011, most of the flash flood events in South Korea
locations, and the resolution of each station was about ap-
were caused by short rainfall duration of less than 1 h. It is
proximately 217 km2 (approximately 15 × 15 km). The aver-
difficult to capture these flash flood cases using the methods
age annual precipitation was 1390 mm, and the annual mean
presented in previous studies. Therefore, prompt flash flood
temperature was 11.5 ◦ C over the 30 years of weather data
warnings are necessary for citizens and decision-makers.
from 1980 to 2009. More than 70 % of the annual precipita-
It is less important to estimate the soil moisture or runoff in
tion occurs during the flood season (June, July, August and
the regions where flash floods occur frequently with short du-
September). The probability rainfalls for 1 h at Seoul station
ration because the response time for a flash flood is limited. It
are 52, 74 and 91 mm h−1 for 3-, 10- and 30-year return peri-
is necessary to develop the criteria for intuitively judging the
ods, respectively. A digital elevation model with a 30 × 30 m
likelihood of flash flood occurrence with short duration. Al-
resolution and soil maps on a scale of 1 : 25 000 were ob-
though FFG-based methods provide useful mechanisms for
tained from the Water Resources Management Information
flash flood warning, the real-time estimates of soil moisture
System (WAMIS) of South Korea. The soil moisture con-
required in some regions are often challenging to acquire
ditions were estimated using the Sejong University Rainfall
prior to rapid response against flash floods. In this study, we
Runoff (SURR) hydrologic rainfall–runoff model.
proposed quantitative criteria using a precipitation–area (P –
Nat. Hazards Earth Syst. Sci., 18, 171–183, 2018 www.nat-hazards-earth-syst-sci.net/18/171/2018/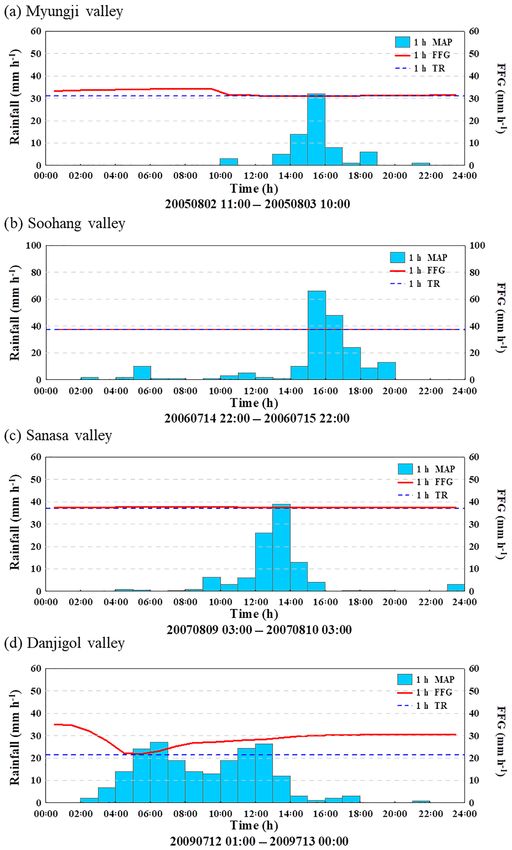
D.-H. Bae et al.: Development of a precipitation–area curve                                                                        173

Figure 1. Study area.

Figure 2. (a) The 660 sub-basins in the Han River basin and (b) the relative frequency of their areas.

   In addition to the observed weather and flow datasets, data           3     Methods
were collected for actual flash flood events. The actual flash
flood information was obtained from various sources, includ-             3.1    quantitative precipitation criteria (QPC)
ing print and electronic media, covering an 8-year period                       computation
(2005–2012). Table 1 presents the locations, dates, times and
maximum rainfall intensities of flash flood events in the Han            This study presents a method for deriving a P –A curve
River basin. Flash floods are common in the study area and               that represents the rainfall thresholds occurring during flash
occur almost every year. In 2011, several flash flood events             floods. The method is based on FFG analysis to avoid the
occurred with different areas and dates.                                 need to estimate soil moisture conditions. Figure 4 presents
                                                                         the overall procedure used to evaluate the QPC for flash
                                                                         flood warning. First, the mean areal precipitation and FFG

www.nat-hazards-earth-syst-sci.net/18/171/2018/                                     Nat. Hazards Earth Syst. Sci., 18, 171–183, 2018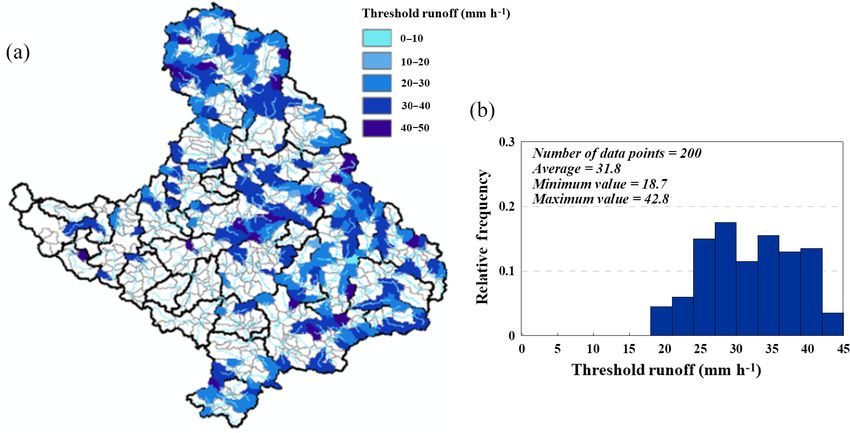
174                                                                D.-H. Bae et al.: Development of a precipitation–area curve

Table 1. Flash flood records collected in the Han River basin.

            No.     Time              Location                        Area    Longitude     Latitude   Maximum rainfall
                    (yyyy/mm/dd)                                     (km2 )                               (mm h−1 )
            1       2005.08.03        Mt. Myungji valley,             40.06    37.9447     127.4949           32.1
                    02:00             Gapyeong-gun, Gyeonggi-Do
            2       2006.07.15        Soohang valley,                 27.79    37.5619     128.6087           66.0
                    13:00             Pyeongchang-gun, Gangwon-Do
            3       2007.08.09        Sanasa valley,                  26.83    37.5353     127.5292           42.0
                    16:00             Yangpyeong-gun, Gyeonggi-Do
            4       2009.07.12        Danjigol valley,                40.58    37.3974     128.1232           27.2
                    06:00             Hoengseong-gun, Gangwon-Do
            5       2010.09.11        Yongchoo valley,                44.92    37.8561     127.4832           37.0
                    19:00             Gapyeong-gun, Gyeonggi-Do
            6       2011.07.27        Uidong valley,                  36.96    37.6711     127.0060           57.5
                    05:00             Gangbuk-Gu, Seoul-Si
            7       2011.07.26        Madangbawii valley,             46.95    37.7039     127.1008           49.2
                    17:00             Namyangju-Si, Gyeonggi-Do
            8       2011.07.27        Mt. Namhan valley,              33.99    37.4786     127.1887           52.1
                    08:00             Gwangju-Si, Gyeonggi-Do
            9       2011.08.03        Noksoo valley,                  37.63    37.7764     127.3954           38.1
                    12:00             Gapyeong-gun, Gyeonggi-Do
            10      2011.08.09        Sadam valley,                   60.98    36.6253     127.8312           22.1
                    13:00             Goesan-gun, Chungbuk
            11      2011.08.14        Gogiri valley,                  40.45    37.3599     127.0560           23.2
                    13:00             Yongin-Si, Gyeonggi-Do
            12      2012.07.15        Byeongjibangri valley,          90.18    37.6080     128.0762           21.5
                    08:00             Gapyeong-gun, Gyeonggi-Do

Table 2. ROC analysis for quantitative precipitation criteria.       currence criteria for virtual flash floods (e.g., VR > FFG or
                                                                     VR < FFG) and the occurrence criteria for actual flash floods
                                          Observed event             (e.g., OR > FFG or OR < FFG) are used to obtain ROC scores
                                      Positive       Negative        for rainfall rates of 1–100 mm h−1 in each sub-basin, as pre-
                                    (OR > FFG)      (OR < FFG)       sented in Table 1. The VR values that produce the maximum
                                                                     ROC score are selected in each sub-basin. Finally, a gener-
                      Positive         Hit            False          alized precipitation–area curve (P –A curve) is obtained us-
                    (VR > FFG)         (H)             (F)           ing selected rainfall rates that produce maximum ROC scores
    Virtual event
                     Negative         Missing       Negative hit
                                                                     as a function of the relevant area of each basin. For a de-
                    (VR < FFG)         (M)             (N)
                                                                     tailed description of TR, FFG, SURR and the estimation of
                                                                     the ROC score refer to Sect. 3.2 and 3.3.

were calculated by using topographic meteorological data             3.2   Flash flood guidance
for the sub-basins in the study area. To obtain FFG at cur-
rent time (t), which is a summation of TR and soil moisture          The method used to compute FFG involves procedures op-
deficit, TR at each sub-basin is estimated. The soil moisture        posite to those of a rainfall–runoff model. In other words,
conditions from actual rainfalls are simulated by using SURR         FFG is defined as the depth of rainfall over a given dura-
model, and we can decide whether a flash flood occurred at           tion needed to initiate flooding at the outlet of a small stream
certain basin by comparing this FFG value and that from 1 h          basin. It is generally estimated for 1, 3 and 6 h durations. In
prior to the actual rainfall. In this experiment, it is assumed      FFG, a specific amount of rain is required to produce a given
that if the observed mean area precipitation (MAP) is larger         amount of runoff based on estimates of current soil mois-
than the FFG, a flash flood occurs.                                  ture conditions, which are derived from soil moisture mod-
   ROC (receiver operating characteristic) analysis is used to       els. Two quantitative products are needed to compute FFG:
obtain the QPC for the flash flood warning, and a virtual            (1) threshold runoff and (2) rainfall–runoff curves.
rainfall (VR) of 1–100 mm h−1 with a 1 mm h−1 increment                 The TR value represents an amount of excess rainfall over
is used for comparison with observed rainfall (OR). The oc-          a given duration TR required to induce flooding in small

Nat. Hazards Earth Syst. Sci., 18, 171–183, 2018                              www.nat-hazards-earth-syst-sci.net/18/171/2018/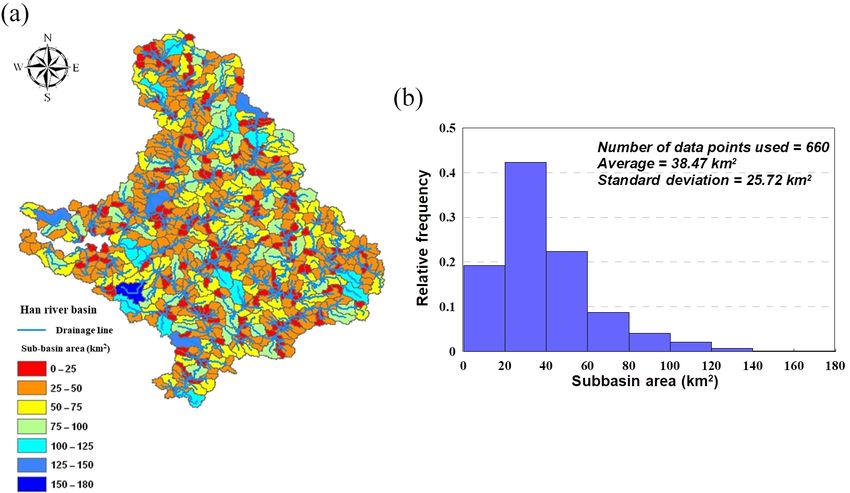
D.-H. Bae et al.: Development of a precipitation–area curve                                                                     175

Figure 3. (a) Selected 200 sub-basins in the Han River basin and (b) the relative frequency of their areas.

Figure 4. Overall methodology used to estimate the quantitative precipitation criteria.

www.nat-hazards-earth-syst-sci.net/18/171/2018/                                     Nat. Hazards Earth Syst. Sci., 18, 171–183, 2018
176                                                                 D.-H. Bae et al.: Development of a precipitation–area curve

streams. Assuming that catchments respond linearly to ex-             and hydrological component changes based on precipitation
cess rainfall, TR (R) can be estimated by equating the peak           and potential evapotranspiration changes:
catchment runoff determined from the catchment unit hydro-
                                                                      dSW(t)
graph over a given duration to the streamflow at the basin                   = P (t)−AET (t)−Qsur (t)−Qlat (t)−Qgw (t), (3)
outlet associated with flooding, which is expressed mathe-              dt
matically as follows:                                                 where SW(t)is the soil water content (mm), P (t) is the mean
                                                                      areal precipitation (mm) and AET(t) is actual evapotranspi-
                               Qp
Qp = qpR × R × A or R =              ,                       (1)      ration (mm). Qsur (t), Qlat (t) and Qgw (t) denote the runoff
                             A × qpR                                  components of surface flow (mm), lateral flow (mm) and
where Qp is the flood flow (cms or cfs), qpR is the unit hydro-       groundwater flow (mm), respectively. Additional detailed
graph peak (cfs mi−2 in.−1 ) for a specific duration tr, A is the     mathematical descriptions of the components were provided
catchment area (km2 or mi2 ) and R is the TR (centimeters or          by Bae and Lee (2011). Bae and Lee (2011) showed that the
inches).                                                              SURR simulations are well fitted to observations, and Nash
   The flood flow Qp can be defined either physically as              and Sutcliffe model efficiencies in the calibration and veri-
bankfull discharge Qbf or statistically as the 2-year return pe-      fication periods which are in the ranges of 0.81 to 0.95 and
riod flow, Q2 . In this study, the TR criterion for small streams     0.70 to 0.94, respectively. Additionally, the behavior of soil
is a 0.5 m water level increase, as measured from the chan-           moisture depending on the rainfall and the annual loadings
nel bottom, which is the level that mountain climbers and             of simulated hydrologic components is rational. From these
campers successfully escape from during natural flood dam-            results, an SURR model can be used for simulation of soil
age. The discharge (Q0.5wi ) that causes a 0.5 m water level          moisture.
increase is defined. It was computed from channel geometry
                                                                      3.3   Receiver operating characteristics
and roughness characteristics using Manning’s formula for
steady, uniform flow (Chow et al., 1988):                             The ROC approach, or the ROC curve method, was origi-
                 5/3                                                  nally proposed to analyze the classification accuracy asso-
Q0.5wi = B0.5wi D0.5wi Sc0.5 /n,                             (2)
                                                                      ciated with differentiating signals from noise in radar de-
where B0.5wi is the channel width at 0.5 m water level (m),           tection. This type of analysis is now widely used in several
D0.5wi is the hydraulic depth at 0.5 m water level (m), Sc is         domains to assess the performance of statistical models that
the local channel slope (dimensionless) and n is Manning’s            classify values into one of two categories. A ROC curve plots
roughness. To obtain the peak catchment runoff, the unit hy-          the hit rate (HR) against the false alarm rate (FAR), which is
drograph can be derived using various methods, such as Sny-           computed using Eqs. (4) and (5) and a contingency table or
der’s synthetic unit hydrograph approach (Chow et al., 1988)          confusion matrix, as presented in Table 1. H and M represent
or the GIUH method (Rodríguez-Iturbe et al., 1979). In this           hits and misses for predictions of when a flash flood will oc-
study, we used the GIUH method to obtain peak catchment               cur (OR > FFG). F and N represent false and negative hits for
runoff.                                                               when a flash flood does not occur (OR < FFG).
   To derive the rainfall–runoff curve which represents soil                 H
conditions during a flash flood event, it is necessary to esti-       HR =                                                       (4)
                                                                           H+M
mate soil moisture. Soil moisture data are obtained via direct                F
measurements with tensiometers or indirect methods such as            FAR =                                                      (5)
                                                                            F+N
rainfall–runoff models. In this study, the SURR model was
used to estimate soil moisture. This model was developed              Several contingency tables can be obtained based on vary-
based on the storage function model (SFM) (Kimura, 1961)              ing decision thresholds associated with dichotomous events.
and improved hydrological components such as potential                The resulting point pairs (FAR, HR) from the contingency
evapotranspiration, surface flow, lateral flow and groundwa-          tables are plotted and connected by line segments. Addi-
ter flow based on the physical properties of these components         tionally, they are connected to the point (0, 0), which cor-
(Bae and Lee, 2011). Moreover, this model uses estimates              responds to never forecasting the event, and to the point (1,
soil moisture continuously to determine time-dependent soil           1), which corresponds to always forecasting the event. The
moisture conditions. The soil profile is separated into ad-           perfect forecast yields values of FAR = 0 and HR = 1, i.e.,
sorbed water, tension water and free water components. The            the ROC curve consists of two line segments that coincide
soil water characteristics that distinguish these water compo-        with the left boundary and upper boundary of the ROC di-
nents include the wilting point, field capacity and saturated         agram. The upper-left point of the graph represents perfect
soil moisture conditions. The free water component in the             prediction. At the other extreme of performance forecasting,
soil profile contributes to lateral flow and percolation, while       random forecasts based on sampled climatological probabil-
the tension water component contributes to actual evapotran-          ities can exhibit FAR = HR, and the ROC curve consists of
spiration. Equation (3) represents the soil water variations          a 45◦ diagonal line connecting the points (0, 0) and (1, 1).

Nat. Hazards Earth Syst. Sci., 18, 171–183, 2018                               www.nat-hazards-earth-syst-sci.net/18/171/2018/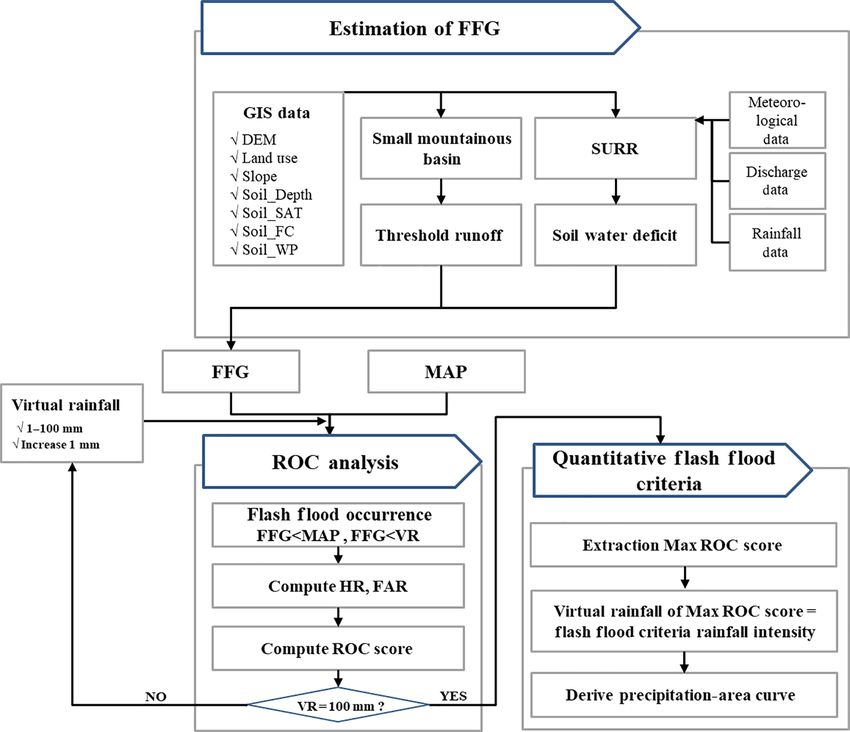
D.-H. Bae et al.: Development of a precipitation–area curve 177
Table 3. Regression analysis for parameter estimation using basin area, stream length and slope in the Han River basin.
Parameter Best-fit regression Coefficient of determination, No. of
R2 cases
B = 15.776A0.369 S −0.0080 0.76 46
H = 2.39A−0.920 L1.174 S 0.748 0.37 46
Sc = 2.443A−0.278 L−0.769 0.53 46
Units: B [ft], H [ft], S [ft mi−1 ], Sc [ft mi−1 ], A [mi2 ] and L [mi].
Table 4. Validation of flash flood guidance criteria (FFGC) using observed flash flood (FF) cases. The and × indicate yes and no,
respectively.
No. Time Area MAP FFGC FF occurrence
(km2 ) (mm h−1 ) (mm h−1 ) using FFGC
1 2005.08.03 02:00 40.1 32.1 31.9
2 2006.07.14 13:00 27.8 66.0 37.2
3 2007.08.09 16:00 26.8 42.0 37.7
4 2009.07.12 06:00 40.6 27.2 31.7 ×
5 2010.09.11 19:00 44.9 37.0 30.3
6 2011.07.27 05:00 37.0 57.5 33.1
7 2011.07.26 17:00 47.0 49.2 29.6
8 2011.07.27 08:00 34.0 52.1 34.3
9 2011.08.03 12:00 37.6 38.1 32.8
10 2011.08.09 13:00 61.0 22.1 25.9 ×
11 2011.08.14 13:00 40.5 23.2 31.8 ×
12 2012.07.15 08:00 90.2 21.5 20.2
ROC curves that plot near the upper-left corner of the ROC are not possible on a continuous spatial scale. Therefore, re-
diagram reflect better discrimination performance. Addition- gional regression relationships are established between chan-
ally, the area under a ROC curve can be used to summarize nel cross-section properties and the geometric characteristics
a ROC diagram, with the value of 1 representing a perfect of the upstream catchment to obtain cross-sectional infor-
forecast and 0.5 a random forecast. However, a ROC curve mation for un-surveyed streams. These regression relation-
cannot be clearly indicated for objects that are more accu- ships are established using stream survey data. The dataset
rate than other objects. Wilks (2006) suggested an ROC score includes channel width (B), hydraulic depth (H ) and local
which is the area of ROC curves. An ROC score can be cal- channel slope (Sc ) from on-site measurements. These data
culated by using HR and FAR, as shown in Eq. (6). were collected at 46 locations. Initially, the relationships be-
tween these parameters and the catchment area (A) were in-
1 1
vestigated using a power regression equation as follows:
(HRi + 0.0) (FARi − 0.0) +
X n 2 2
ROC score = i=1
(HRi+1 + HRi ) (FARi+1 − FARi ) (6) X = αAβ , (7)
1
+· · ·, + (1 + HRi+n ) (1 − FARi+n )
2 where X represents B, H or Sc and parameters α and β are
determined by the regression of X on A. Then, additional pa-
4 Results and analysis rameters such as stream length (L) and average basin slope
(S) were investigated and included in the regression equa-
4.1 Regional regression relationships based on channel tion. The regression relationship can then be expressed as
geometry follows:
X = αAβ Lγ S δ , (8)
TR values are based on the flood flow QP , unit hydrograph
peak qpR and catchment area A. The discharge (Q0.5wi ) that where α, β, γ and δ are regression coefficients. A correlation
causes 0.5 water level increase is used as a flood flow in this analysis was performed to analyze the relationship between
study. The calculations of Q0.5wi and qpr require the channel the parameters (B, H and Sc ) and basin characteristics (A, L
cross-section parameters. Direct measurements of channel and S). As shown in Table 3, the channel width B was pos-
cross sections, which are performed through local surveys, itively correlated with the catchment area A but exhibited a
www.nat-hazards-earth-syst-sci.net/18/171/2018/ Nat. Hazards Earth Syst. Sci., 18, 171–183, 2018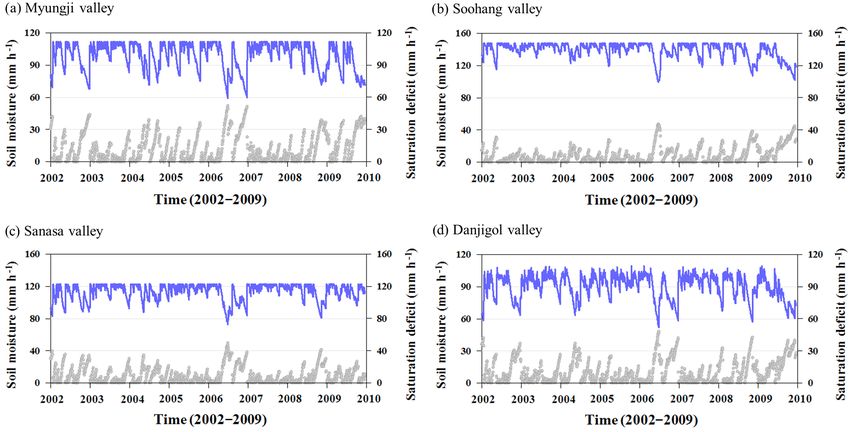
178                                                                     D.-H. Bae et al.: Development of a precipitation–area curve

Figure 5. (a) Threshold runoff and (b) its relative frequency.

Figure 6. Soil moisture and soil moisture deficit in selected sub-basins. The blue and grey lines represent soil moisture and saturation deficit,
respectively.

significant negative correlation with the average basin slope              4.2   TR and FFG
S. Conversely, the hydraulic depth H was negatively corre-
lated with A but positively correlated with L and S. The lo-
                                                                           The TR values were computed for effective rainfall durations
cal channel slope Sc was negatively correlated with A and L.
                                                                           of 1 h in the 200 selected sub-basins by using Manning equa-
The derived regression equations are also shown in Table 3,
                                                                           tion and GIUH method as mentioned in Sect. 2.2. Figure 5a
and the determination coefficients of the regression equation
                                                                           and b show the estimated TR and its relative frequency in
were 0.76, 0.37 and 0.53 (Cho et al., 2011). The determina-
                                                                           different ranges, respectively. Overall, the TR ranged from
tion coefficient of hydraulic depth (H ) is lower than the other
                                                                           18.7 to 42.8 mm h−1 with a mean of 31.8 mm h−1 . In addi-
variables. If additional data regarding river cross section are
                                                                           tion, a large number of basins had TR values of 25–30 and
available, the regression equation will be improved.
                                                                           35–40 mm h−1 .
                                                                              Figure 6 presents the soil moisture contents and deficits
                                                                           simulated using a continuous rainfall–runoff model, SURR,
                                                                           during the flooding season, i.e., July, August and September,
                                                                           from 2002 to 2009 for four selected sub-basins. In each fig-

Nat. Hazards Earth Syst. Sci., 18, 171–183, 2018                                     www.nat-hazards-earth-syst-sci.net/18/171/2018/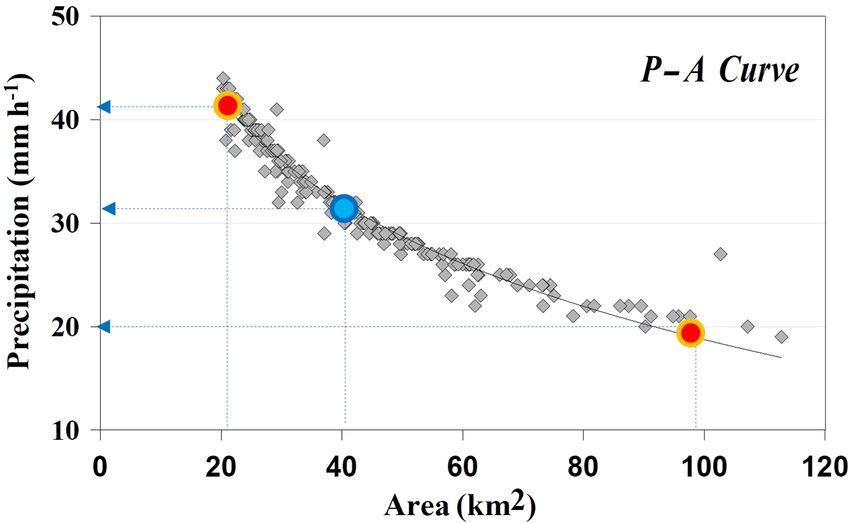
D.-H. Bae et al.: Development of a precipitation–area curve                                                                    179

ure, the upper blue line represents the change in the soil mois-
ture content based on the precipitation amount, while the
grey dots represent the soil moisture deficit below saturation.
The total soil moisture varied by sub-basin based on the soil
conditions and basin characteristics. The soil moisture values
were approximately 100–150, 110, 150, 120 and 105 mm in
the Myungji, Soohang, Sanasa and Danjigol valleys, respec-
tively. The soil moisture deficit generally ranged from 0 to
50 mm but was approximately 0–5 mm during 42 % of the
entire flood period. These values represent near-saturated soil
conditions.
   The MAP, estimated TR and FFG values for actual flash
flood events that occurred in 2005, 2006, 2007 and 2009
in the Myungji, Soohang, Sanasa and Danjigol valleys, re-
spectively, are presented in Fig. 7. As shown in each fig-
ure, the values and trends of FFG, which is the sum of
TR and the soil moisture deficit, differ by location. The
values at Soohang valley and Sanasa valley are constant
and indicate that the soil is already saturated due to an-
tecedent precipitation, while the values at Myungji valley
and Danjigol valley vary as precipitation inputs affect the
soil moisture deficit. The time of flash flood occurrence
was estimated based on when the hourly MAP exceeded
the 1 h FFG. Therefore, the time of flash flood occurrence
was 02:00 UTC on 3 August 2005 in the Myungji valley
(32 mm MAP), 13:00 UTC on 15 July 2006 in Soohang val-
ley (66 mm MAP), 16:00 UTC on 9 August 2007 in Sanasa
valley (42 mm MAP) and 06:00 UTC on 12 July 2009 in
Danjigol valley (27 mm MAP). As shown in Table 2 and
Fig. 7, the timing of the flash flood occurrence computed
from the FFG model exhibited satisfactory agreement with
those from the observed flash flood record.

4.3   Quantitative threshold of flash flood guidance
                                                                   Figure 7. Threshold runoff (TR), mean areal precipitation (MAP)
Figure 8 shows the ROC scores of the four selected sub-            and estimated FFG (flash flood guidance) for selected flash flood
basins estimated against VR values of 1–100 mm h−1 with            events.
an interval of 1 mm h−1 . The VR value associated with the
peak ROC score was selected as the optimum rainfall. As
expected, the minimum ROC score was 0.50, which rep-               tion of a P –A curve that represents whether a flash flood will
resents random forecasting, while the maximum score and            occur based on a given rainfall intensity and basin area:
corresponding VR were 0.90 and 32 mm h−1 in basin num-             P = 85.02 − 14.39 ln(A),                                     (9)
ber 165, 0.91 and 30 mm h−1 in basin number 200, 0.87 and
22 mm h−1 in basin number 293 and 0.90 and 33 mm h−1 in            where A is the sub-basin area (km2 ) and P is the hourly pre-
basin number 442.                                                  cipitation intensity (mm h−1 ) that represent the quantitative
   Similarly, the maximum ROC scores and corresponding             flash flood criteria (QFFC). Thus, a flash flood will occur in
optimum rainfall values were obtained in all other sub-            a sub-basin with area A if the rainfall intensity exceeds the
basins. Figure 9 shows the ROC scores of all 200 sub-basins        P –A curve; however, a flash flood will not occur if the rain-
based on optimum rainfall values. The results show that the        fall intensity is below the curve. Note that the 1 h precipita-
optimum rainfall values for flash flood warning criteria fall      tion intensity required to cause a flash flood decreases as a
between 19 and 44 mm h−1 , with ROC scores of 0.85–0.98.           function of A.
An analysis of the selected optimum values and correspond-            In general, the P –A curve shows that a rainfall rate higher
ing sub-basin areas revealed that the flash flood warning          than 42 mm h−1 may trigger a flash flood in any sub-basin
threshold could be best represented as a function of sub-basin     in the study area with an area greater than 22 km2 . We can
area, as shown in Fig. 10. Equation (9) is a regression equa-      further suggest the information of the flash flood threshold

www.nat-hazards-earth-syst-sci.net/18/171/2018/                             Nat. Hazards Earth Syst. Sci., 18, 171–183, 2018
180 D.-H. Bae et al.: Development of a precipitation–area curve
Figure 8. ROC score estimated for selected sub-basins using virtual rainfalls of 1–100 mm h−1 .
Figure 10. Derived QPC curve for quantitative flash flood condi-
tions. Circles represent the categories of criteria according to basin
Figure 9. Relationship between maximum ROC and uniform vir- area.
tual rainfall for all the sub-basins. Shaded areas represent the range
(maximum to minimum) of virtual rainfall and ROC score.
diction exceeded the QFFC when an actual flash flood event
based on fieldwork in different sub-basins to refine the flash occurred in the basins. If the prediction exceeded the QFFC,
flood criteria. Flash flood warning thresholds were estab- a flash flood warning would be issued. According to the re-
lished for rainfall rates of 42, 32 and 20 mm h−1 in sub-basins sults, the flash flood occurrence was captured for 9 out of 12
with areas greater than 20 km2 , between 40 and 100 km2 and events when the criteria were evaluated (Table 4). Figure 11
greater than 100 km2 , respectively. shows a detailed interpretation of the proposed criteria ob-
tained from the P –A curve for the four selected actual flash
4.4 Validation flood events in the Myungji, Soohang, Sanasa and Danjigol
valleys in 2005, 2006, 2007 and 2009. The 1 h MAP and 1 h
For the validation of the performance of the P –A curve, the criteria in the selected sub-basins with different areas were
QFFC for actual flash flood events were applied. This ex- provided in the figures. The estimated values of 1 h crite-
periment assumed the gauged mean areal precipitation as a ria were 31.9, 37.2, 37.7 and 31.7 mm for sub-basins area
prediction. The experiments were assessed whether the pre- of 40.1, 27.8, 26.8 and 40.6 km2 , respectively. The 1 h MAP
Nat. Hazards Earth Syst. Sci., 18, 171–183, 2018 www.nat-hazards-earth-syst-sci.net/18/171/2018/D.-H. Bae et al.: Development of a precipitation–area curve 181
5 Discussion
5.1 Uncertainty of flash flood forecasting method
There are many flash flood forecasting methods. The meth-
ods can be divided into three categories: flow comparison
methods, rainfall comparison methods and flash flood sus-
ceptibility assessment. The proposed P –A curve is rainfall
threshold that included with the rainfall comparison meth-
ods like FFG. The rainfall comparison method is a popu-
lar tool for warning about flash floods, and this method is
commonly used for flash flood forecasting. However, the
previous rainfall threshold method has some limitations; re-
cent studies tried to improve warning accuracy by using dis-
tributed physical hydrological modeling (Kobold and Brilly,
2006; Reed et al., 2007; Norbiato et al., 2009). Hapuarachchi
and Wang (2008) suggested that physically based distributed
hydrological models are more appropriate than data-driven
models and conceptual hydrological models for flash flood
forecasting. However, the most important thing of flash flood
forecasting is providing the warning information to decision-
makers or citizens with relatively simple, clear and immedi-
ate. It means that not only the sophistication but also prompt-
ness with reasonable accuracy also is necessary for flash
flood forecasting. In this respect, this study proposed quanti-
tative criteria using P –A curve for flash flood warning based
on FFG. The key advantage of this method is that it does
not need any further calculation compared to the other rain-
fall comparison method. In other words, the proposed criteria
and methodology will serve as an important tool for issuing
flash flood warnings based on only rainfall information.
However, this study has some assumptions and limitations.
The P –A curve is based on the FFG and not real observed
flash flood events because there is lack of observed flash
Figure 11. Validation of quantitative flash flood criteria. flood events. In addition, the proposed P –A curve has some
uncertainties from lots of sources such as soil moisture es-
timation (SURR), TR estimation method, finding the opti-
exceeded the 1 h criteria during the first three actual events, mal P –A curve by using ROC method, collection of actual
but the 1 h MAP at Danjigol valley in 2009 event did not ex- flash flood events, etc. However, these problems are not con-
ceed the 1 h criteria due to differences in the rainfall pattern fined to this study because the phenomena triggering flash
and characteristics, as the precipitation distribution at Dan- flood are very complex. Any flash flood forecast method has
jigol valley was continuous with double peaks, while those of also large uncertainties due to input data errors and model-
other events were short periods with single peaks. Therefore, ing errors. Thus, it is necessary for understanding of the un-
the flash flood occurrence at Danjigol valley was the effect of certainty from all these sources for decision-making in flood
3 h cumulative rainfall rather than 1 h rainfall. Thus, the flash warning because good uncertainty estimates of flash flood
flood occurred because the 3 h maximum MAP (70.4 mm) forecasts can add credibility to the forecast system.
was greater than the 3 h FFG (67.5 mm). These results sug-
gest that the proposed criteria derived from the P –A curve 5.2 Utilization of a P –A curve for flash flood
captured the flash flood occurrence effectively in each sub- forecasting
basin.
Some flood forecasting systems have been developed and
operated in some countries (Mogil et al., 1978; Sweeney,
1992; Mason, 1982; Alfieri et al., 2012). North America has
a flash flood forecasting system using GFFG. This system
uses multi-sensor precipitation estimates and forecasts based
www.nat-hazards-earth-syst-sci.net/18/171/2018/ Nat. Hazards Earth Syst. Sci., 18, 171–183, 2018182 D.-H. Bae et al.: Development of a precipitation–area curve
on NEXRAD (Next Generation Weather Radar), rain gauges sensitive to the soil moisture condition and have response
and NWP (numerical weather prediction) model outputs. time. Therefore, the development of the coupled flash flood
The European Flood Forecasting System (EFFS) used the forecasting system which is divided with short (less than 1 h)
LISFLOOD-FF for generating river flow and LISFLOOD-FP and long duration (greater than 3 h) is necessary for manag-
to model the overbank flows and inundation areas, and they ing flash flood efficiently.
use gauged rainfall, radar rainfall and NWP model outputs
(Roo et al., 2003). ALERT in Australia uses a hydrological
model with real-time rainfall and water level data. They also Data availability. Data used in this study can be found in the Wa-
assess the severity of flooding using simple manual guides ter Resources Management Information System (WAMIS), South
(look-up tables). Thus, the ideal flash flood system needs to Korea. It is publicly available, but the hourly rainfall data can
combine two approaches. It must present the criteria used be downloaded from the Korean version of the web page (http:
//www.wamis.go.kr/wkw/rf_dubrfobs.aspx).
to judge flash floods in an intuitive way for very short-term
flash floods (less than 1 h). It must also make predictions with
sophisticated modeling using a physical distributed model
Competing interests. The authors declare that they have no conflict
for flash floods with greater than a 3 h duration. Therefore,
of interest.
the flash flood guidance criteria are used for short-term flash
floods.
This study focused on using a P –A curve, and it assessed Acknowledgements. This work was supported by a subproject of
the outcome when using only gauged rainfall data. However, the “Development of HPC-based management systems against
the quality of flash flood forecasting depends on the qual- national-scale disasters” project of Korea Institute of Science
ity of the rainfall data. Additionally, reliable rainfall fore- and Technology Information (KISTI) and a grant (17AWMP-
casts with adequate lead time and accuracy are essential for B083066-04) from the Advanced Water Management Research
flash flood forecasting. In general, the gauged rainfall, radar Program which was funded by the South Korean Ministry of Land,
data (Sinclair and Pegram, 2005; Mazzetti and Todini, 2009) Infrastructure and Transport.
and satellite data (Sorooshian et al., 2000; Kubota et al.,
2007) have been used for quantitative precipitation estimates, Edited by: Thomas Glade
Reviewed by: two anonymous referees
and some studies have used multiple precipitation sources
(Sokol, 2006; Chiang et al., 2007). Therefore, this method is
necessary for assessing the applicability of using rainfall data
obtained from various sources. References
Alfieri, L., Salamon, P., Pappenberger, F., Wetterhall, F., and Thie-
6 Conclusion len, J.: Operational early warning systems for water-related haz-
ards in Europe, Environ. Sci. Policy, 21, 35–49, 2012.
In this study, quantitative criteria for flash flood warning were Bae, D. H. and Kim, J. H.: Development of Korea flash flood guid-
developed and assessed for sub-basins of the Han River in ance system: (I) theory and system design, J. Korea Society of
South Korea. Flash flood guidance based on threshold runoff Civil Engineers, 27, 237–243, 2007.
Bae, D. H. and Lee, B. J.: Development of continuous rainfall-
was estimated for 200 sub-basins. The optimum rainfall val-
runoff model for flood forecasting on the large-scale basin, J.
ues were obtained for each sub-basin by comparing FFG, vir-
Korea Water Resour. Assoc., 44, 51–64, 2011.
tual rainfall and observed rainfall values using a ROC anal- Beven, K., Quinn, P., Romanowicz, R., Rreer, J., Fisher, J., and
ysis. The optimal rainfall values for the flash flood warning Lamb, R.: TOPMODEL and GRIDDATB, A users guide to the
threshold were between 19 and 44 mm h−1 , with a ROC score distribution versions (94.03), CRES Technical Report TR110/94,
of 0.85–0.98. The flash flood warning threshold can be best Lancaster University, Lancaster, UK, 1994.
represented as a function of sub-basin area. A generalized Carpenter, T., Sperfslage, J., Georgakakos, K. P., Sweeney, T., and
precipitation–area curve of P = 85.02−14.39 ln(A) was pro- Fread, D.: National threshold runoff estimation utilizing IS in
posed to the Han River basin in South Korea. The results support of operational flash flood warning systems, J. Hydrol.,
showed that it could be effectively estimated as a function 224, 21–44, 1999.
of the corresponding sub-basin area. These results mean that Carpenter, T. M. and Georgakakos, K. P.: GIS-Based Procedures
in Support of Flash Flood Guidance. Iowa Institute of Hydraulic
the threshold for 1 h flash flood prediction can be classified
Research, University of Iowa, Iowa City, IA, 1993.
according to sub-basin area.
Chiang, Y. M., Hsu, K. L., Chang, F. J., Hong, Y., and Sorooshian,
The key advantage of this method is possible to issue S.: Merging multiple precipitation sources for flash flood fore-
flash flood warnings without the need to run entire hydro- casting, J. Hydrol., 340, 183–796, 2007.
meteorological model chains in the region where the flash Cho, B. G., Ji, H. S., and Bae, D. H.: Development and Evaluation
floods with less than 1 h duration are frequently occurred. of Computational Method for Korean Threshold Runoff, J. Korea
However, flash floods with more than a 3 h duration may be Water Resour. Assoc., 44, 875–887, 2011.
Nat. Hazards Earth Syst. Sci., 18, 171–183, 2018 www.nat-hazards-earth-syst-sci.net/18/171/2018/D.-H. Bae et al.: Development of a precipitation–area curve 183 Chow, V. T., Maidment, D. R., and Mays, L. W.: Applied Hydrol- Montesarchio, V., Ridolfi, E., Russo, F., and Napolitano, F.: Rain- ogy, McGraw-Hill, New York, 1988. fall threshold definition using an entropy decision approach Collier, C. G. and Fox, N. I.: Assessing the flooding susceptibility and radar data, Nat. Hazards Earth Syst. Sci., 11, 2061–2074, of river catchments to extreme rainfall in the Kingdom, Int. J. https://doi.org/10.5194/nhess-11-2061-2011, 2011. River Basin Management, 1, 1–11, 2003. Norbiato, D., Borga, M., Esposti, S. D., Gaume, E., and Anquetin, Gourley, J. J., Erlingis, J. M., Hong, Y., and Wells, E. B.: Evaluation S.: Flash flood warning based on rainfall thresholds and soil of tools used for monitoring and forecasting flash floods in the moisture conditions: an assessment for gauged and ungauged United States, Weather Forecast., 27, 158–173, 2012. basins, J. Hydrol., 362, 274–290, 2008. Gregory, J. M. and Mitchell, J. F. B.: Simulation of daily variabil- Norbiato, D., Borga, M., and Dinale, R.: Flash flood warning in ity of surface temperature and precipitation over Europe in the ungauged basins by use of the flash flood guidance and model- current and 2 × CO2 climates using the UKMO high-resolution based runoff thresholds, Meteorol. Appl., 16, 65–75, 2009. Climates model, Q. J. Roy. Meteor. Soc., 121, 1451–1476, 1995. Palmer, T. N. and Raisanen, J.: Quantifying the risk of extreme sea- Hapuarachchi, H. A. P. and Wang, Q. J.: A review of methods and sonla precipitation events in a changing climate?, Nature, 415, systems available for flash flood forecasting, CSIRO: Water for a 512–514, 2002. Healthy Country National Research Flagship, Bureau of Meteo- Reed, S., Schaake, J., and Zhang, Z.: A distributed hydrologic rology, Australia, 2008. model and threshold frequency-based method for flash flood Hapuarachchi, H. A. P., Wang, Q. J., and Pagano, T. C.: A review forecasting at ungauged locations, J. Hydrol., 337, 402–420, of advances in flash flood forecast, Hydrol. Process., 25, 2771– 2007. 2784, 2011. Rodríguez-Iturbe, I., Devoto, G., and Valdés, J. B.: Discharge re- Jonkman, S. N.: Global perspectives on loss of human life caused sponse analysis and hydrologic similarity: the interrelation be- by floods, Nat. Hazards, 34, 151–175, 2005. tween the geomorphologic IUH and the storm characteristics, Kimura, T.: The Flood Runoff Analysis Method by the Storage Water Resour. Res., 15, 1435–1444, 1979. Functional Model, Public Works Research Institute, Japanese Roo, P. J. D., Gouweleeuw, B., Thielen, J., Bartholmes, J., Cerlini, Ministry of Construction, Japan, 1961. P. B., Todini, E., Bates, P. D., Horritt, M., Hunter, N., Beven, K., Kobold, M. and Brilly, M.: The use of HBV model for flash Pappenberger, F., Heise, E., Rivin, G., Hils, M., Hollingsworth, flood forecasting, Nat. Hazards Earth Syst. Sci., 6, 407–417, A., Holst, B., Kwadijk, J., Reggiani, P., Dijk, M. V., Sattler, K., https://doi.org/10.5194/nhess-6-407-2006, 2006. and Sprokkereef, E.: Development of a European flood forecast- Kubota, T., Shige, S., Hashizume, H., Aonashi, K., Takahashi, N., ing system, Intl. Jour. River Basin Management, 1, 49–59, 2003. Seto, S., Takayabu, Y. N., Ushio, T., Nakagawa, K., Iwanami, Schmidt, J. A., Anderson, A. J., and Paul, J. H.: Spatially-variable, K., Kachi, M., and Okamoto, K.: Global precipitation map us- physically-derived flash flood guidance, in: Paper 6B.2, Proceed- ing satelliteborne microwave radiometers by the GSMaP Project: ings of the 21st Conference on Hydrology, 87th Meeting of the production and validation, IEEE T. Geosci. Remote, 45, 2259– AMS, San Antonio, Texas, 15–18 January 2007. 2275, 2007. Sinclair, S. and Pegram, G.: Combining radar and rain gauge rainfall Lee, B. J., Choi, S. M., Yoon, S. S., and Choi, Y. J.: The evaluation estimates using conditional merging, Atmos. Sci. Lett., 6, 19–22, of TOPLATS land surface model application for forecasting flash 2005. flood in mountainous areas, J. Korea Water Resour. Assoc., 49, Sokol, Z.: Nowcasting of 1-h precipitation using radar and NWP 19–28, 2016. data, J. Hydrol., 328, 200–211, 2006. Mason, I. B.: “A model for assessment of weather forecasts, Aust. Sorooshian, S., Hsu, K. L., Gao, X., Gupta, H. V., Imam, B., Meteorol. Mag., 30, 291–303, 1982. and Braithwaite, D.: Evaluation of PERSIANN system satellite- Miao, Q., Yang, D., Yang, H., and Li, Z.: Establishing a rainfall based estimates of tropical rainfall, B. Am. Meteorol. Soc., 81, threshold for flash flood warnings in China’s mountainous areas 2035–2046, 2000. based on a distributed hydrological model, J. Hydrol., 541, 371– Sweeney, T. L.: Modernized Areal Flash Flood Guidance, NOAA 386, 2016. Technical Memorandum NWS HYDRO, Vol. 44, U.S. Depart- Mogil, H. M., Monro, J. C., and Groper, H. S.: NWS’s flash flood ment of Commerce, National Oceanic and Atmospheric Admin- warning and disaster preparedness programs, B. Am. Meteorol. istration, National Weather Service, Office of Hydrology, US, Soc., 59, 690–699, 1978. 1992. Mazzetti, C. and Todini, E.: Combining weather radar and rain Wilks, D. S.: Statistical Methods in the Atmospheric Sciences, Aca- gauge data for hydrologic applications, in: Flood Risk Manage- demic Press, London, UK, 293–298, 2006. ment: Research and Practice, edited by: Samuels, P., Huntington, S., Allsop, W., and Harrop, J., Taylor & Francis Group, London, 2009. www.nat-hazards-earth-syst-sci.net/18/171/2018/ Nat. Hazards Earth Syst. Sci., 18, 171–183, 2018
You can also read