Rainfall Variability and Trend Analysis of Rainfall in West Africa (Senegal, Mauritania, Burkina Faso) - MDPI
←
→
Page content transcription
If your browser does not render page correctly, please read the page content below
water
Article
Rainfall Variability and Trend Analysis of Rainfall in
West Africa (Senegal, Mauritania, Burkina Faso)
Zeineddine Nouaceur 1 and Ovidiu Murarescu 2, *
 1   UMR IDÉES CNRS 6266, Rouen University, 76821 Mont Saint Aignan CEDEX, France;
     zeineddine.nouaceur@univ-rouen.fr
 2   Department of Geography, Valahia University, 130001 Târgovişte, Romania
 *   Correspondence: ovidiu.murarescu@valahia.ro

 Received: 13 May 2020; Accepted: 12 June 2020; Published: 19 June 2020

 Abstract: This study concerns the West African Sahel. The Sahelian climate is characterized by a
 long dry season and a rainy season which starts in June and ends in September–October. This latter
 season is associated with the process of oceanic moisture transfer to the mainland (the West African
 Monsoon). This movement is governed by an overall moving of the meteorological equator and its
 low-pressure corridor (Intertropical Convergence Zone, ITCZ) towards the north, under the effect
 of the attraction of the Saharan thermal depressions and a greater vigor of the anticyclonic nuclei.
 This study was conducted on 27 Sahelian climatic stations in three countries (Burkina Faso, Mauritania,
 and Senegal). The method used to determine the modes of this variability and the trends of rainfall is
 the chronological graphic method of information processing (MGCTI) of the “Bertin Matrix” and
 continuous wavelets transform (CWT). Results show a rain resumption observed in the recent years
 over the Sahelian region and a convincing link with the surface temperature of the Atlantic Ocean.

 Keywords: West Africa; climate change; rainfall variability

1. Introduction
     If, on a global scale, the rise in temperatures is a certainty, the evolution of global rainfall is much
more contrasting, as it is subject to a strong spatiotemporal variability [1].
     Increased power of evaporation will lead to a greater availability of water vapors. An increase
in the quantity of the humidity in the lower layers of the atmosphere might be the cause of an
intensification of rainfall in a torrential form [2]. Using a climate simulation model, it was proved
that a 22% rise in air humidity may be brought towards continents by maritime flows [3]. The results
of various studies regarding rainfall evolution also show that climate changes have entailed an
intensification of precipitation and a repetition of extreme events [4–8].
     Given this climate change, a likely increase in extreme events, particularly floods, is to be expected.
According to the World Meteorological Organization, floods are the most frequent extreme phenomenon
that occurred in the 2001–2010 decade [9]. This phenomenon affected several regions of the World,
producing hundreds or even thousands of victims. In 2016, almost 23.5 million people were dislocated
because of natural disasters related to extreme meteorological events—mainly storms and floods in the
Asia-Pacific region [10]. In Europe, a significant change in the flood calendar due to current climate
changes [11] was highlighted. Some researchers have pointed out increasing trends of extreme rainfall
in more than 8326 weather stations worldwide [12]. Furthermore, they have been able to prove a
significant statistical association between the average temperature and the meridian variation (the
highest sensitivity occurs in the tropics and at high elevations, whereas the highest uncertainty is near
the Equator, owing to a limited number of sufficiently long recordings on precipitation). The Sahelian
climate is characterized by a long dry season and a rainy season which starts in June and ends in

Water 2020, 12, 1754; doi:10.3390/w12061754                                       www.mdpi.com/journal/water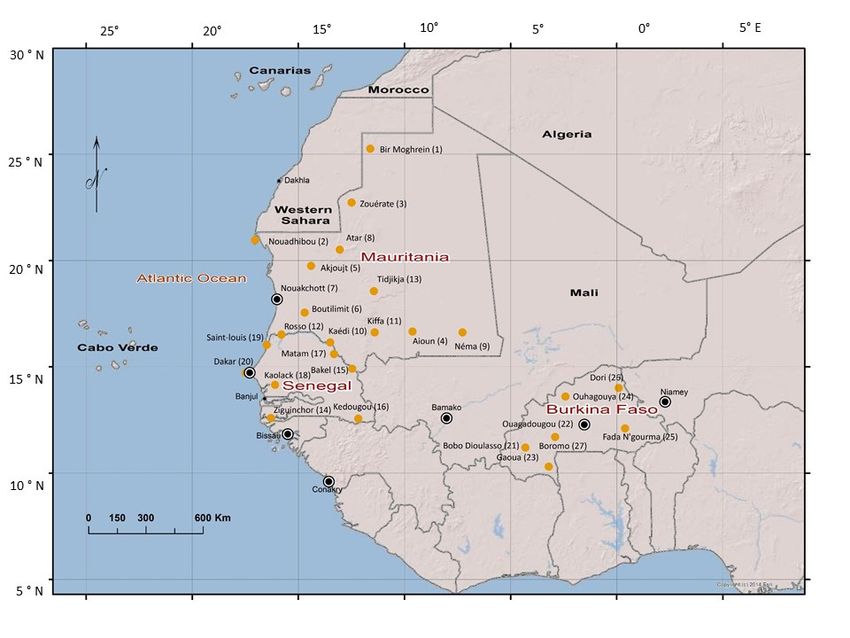
Water 2020, 12, 1754                                                                                 2 of 18

September–October. The latter season is associated with the oceanic moisture transfer to the mainland
(the West African monsoon). This movement is governed by an overall translation of the meteorological
Equator and its low-pressure corridor (Intertropical Convergence Zone—ITCZ) towards the north,
under the effect of the attraction of the Saharan thermal depressions and the intensification of the
anticyclonic nuclei in the southern hemisphere in winter. The Sahelian climate is subject to a very high
rainfall variability. In the 1970s–1980s, the scientific world mobilized to conduct studies on climatic
droughts, which was one of the most inter-decade powerful signals ever observed on the planet.
Researchers are currently focusing on the African monsoon in order to elucidate the complexity of
mechanisms related to its spatiotemporal variability. The international program, African Monsoon
Multidisciplinary Analysis (AMMA) illustrates this approach [13].
     The Eastern Equatorial Atlantic is the region of the tropical Atlantic basin where the seasonal cycle
of ocean surface temperatures is most marked (a drop of 5 to 7 ◦ C is observed in spring). This anomaly
called “cold water tongue” [14] appears around 10◦ W and extends to the area south of the equator
between the African coasts and 20◦ W. Under the effect of this contrast, the southeast trade winds cross
the equator, pivot in a southwest wind, and penetrate the continent where they form the monsoon flow
in the lower layers of the atmosphere.
     It was the presence of abnormally cold waters in the North Atlantic and abnormally warm waters
in the South tropical Atlantic that was first associated with Sahelian rainfall deficits, leading to a
reduced rise in rainfall to the north [15]. Another research suggests that this Atlantic dipole structure
was part of a global inter-hemispheric structure linked to the strongest warming of the tropical ocean
recorded in the last century [16].
     Regarding the research of the role of sea surface temperature (SST), Tropical Southern Atlantic
(TSA), and Tropical Northern Atlantic (TNA), this is frequently highlighted as a source for decadal
variability of rainfall in West Africa [17,18]. Atlantic multidecadal variability has been given much
attention, particularly regarding the interhemispheric pattern of SST and Atlantic multidecadal
oscillation (AMO) [19–24].
     In terms of the surface temperature of the oceans, predicting the onset of this climatic phenomenon
and knowing its intra-seasonal and annual variability is crucial for local populations. It is known
this region is vulnerable to drought on a large scale, because some of its economy is based on an
agricultural system dependent on precipitation. The Sahelian economy is in its infancy with a human
development index (HDI, this index varies from the highest value 0.954 for Norway to the lowest value
0.354 for Niger) calculated for all countries in the studied region of 0.43 (Mauritania 0.52; Senegal 0.50;
Mali and Burkina Faso 0.42; Chad 0.40; and Niger 0.35).

2. Data and Working Methods
     This study relies on data from 27 Sahelian weather stations in three countries (Burkina Faso,
Mauritania, and Senegal). Annual data for the period between 1947 and 2014 has been used for the
chronological graphic method of information processing (MGCTI) of “Bertin matrix” (this choice was
prompted by data availability—Figure 1). The mean monthly values were available only for stations
in Senegal and Burkina Faso. Available monthly rainfall data were extracted between 1948 and 2017
for each country for the continuous wavelets transform (CWT) analysis. The data used have not
been interpolated but come from measurements from observation stations that appear on the map in
Figure 1.
     The data were collected from the weather services in Senegal (ANACIM) (http://www.anacim.sn/
meteorologie/), Mauritania (http://www.onm.mr/). Rainfall data from Burkina Faso were collected from
the KNMI Climate Explorer (http://climexp.knmi.nl/selectstation.cgi?id=someone @somewhere). Some
missing data were found on “TuTiempo.net” (https://fr.tutiempo.net/climat/afrique.html). This site
uses the National Climatic Data Center’s Global Database (NCDC—https://www.ncdc.noaa.gov/data-
access/quick-links).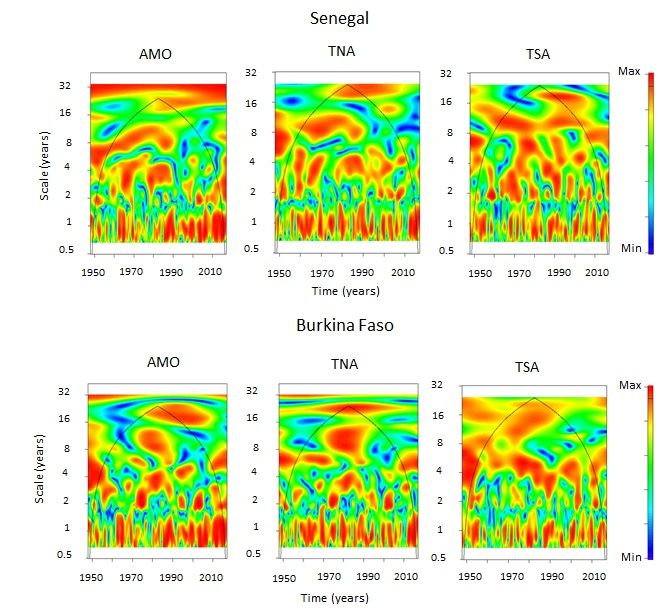
Water 2020, 12, 1754 3 of 18
Water 2020, 12, 1754 3 of 19
Figure 1. Geographical position of the 27 weather stations cited. The number between the brackets
indicates the 1.
Figure position of stations
Geographical positioninofthe
thechronological graphic
27 weather stations cited.method of information
The number between the processing
brackets
(MGCTI)indicates the position
of “Bertin of stations
matrix” type (Figurein 2).
the chronological graphic method of information processing
(MGCTI) of “Bertin matrix” type (Figure 2)
Three regionalized indices of surface temperatures of the North Atlantic and South Atlantic
The accessible
Tropical, freely data were collected
on the from the weather services in Senegal (ANACIM)
site (https://www.esrl.noaa.gov/psd/data/climateindices), were used:
(http://www.anacim.sn/meteorologie/),
◦ ◦ Mauritania (http://www.onm.mr/).
The AMO index (25–60 N, 7–75 W), the TNA anomaly of the average of the monthly SST from Rainfall data from5.5◦
Burkina
◦ Faso
◦ were◦ collected from the KNMI Climate Explorer
N to 23.5 N and 15 W to 57.5 W), and the TSA anomaly of the average of the monthly SST from
(http://climexp.knmi.nl/selectstation.cgi?id=someone @somewhere). Some missing data were found
Eq-20◦ S and 10◦ E–30◦ W).
on “TuTiempo.net” (https://fr.tutiempo.net/climat/afrique.html). This site uses the National Climatic
The analysis
Data ofGlobal
Center’s rainfall variability
Database employs two working methods:
(NCDC—https://www.ncdc.noaa.gov/data-access/quick-links).
Three regionalized indices of surface temperatures of the North Atlantic and South Atlantic
- The chronological graphic method of information processing of “Bertin matrix” type. The MGCTI
Tropical, freely accessible on the site (https://www.esrl.noaa.gov/psd/data/climateindices), were
is an analytical method based on a statistical analysis and on a graphical representation of results.
used: The AMO index (25–60° N, 7–75° W), the TNA anomaly of the average of the monthly SST from
This
5.5°method
N to 23.5°was used
N and 15°for
W to the first
57.5° W),time
and in
the2013 [25,26]. of
TSA anomaly ThetheMGCTI
average ofis the
developed to facilitate
monthly SST from
the interpretation of
Eq-20° S and 10° E–30° W).the statistical results for the Mediterranean rainfall analysis, due to the
high variability
The analysisaffecting
of rainfallthis parameter.
variability Thetwo
employs Bertin matrix
working was introduced to harmonize and
methods:
consolidate information after the statistical treatment. The Bertin matrix is a manual and visual
- The chronological graphic method of information processing of “Bertin matrix” type. The
method of classification
MGCTI of information
is an analytical method based based on data. analysis
on a statistical This matrix
and onis used to group
a graphical the data that
representation
have similarities according
of results. This method was to allused
the for
criteria studied.
the first time inIt2013
provides
[25,26].aThe
simple
MGCTI andiseffective
developed way
to to
establish a multivariate
facilitate typology
the interpretation ofbased on observations
the statistical results forof thethe user. This provides
Mediterranean the concordant
rainfall analysis, due
resultsto(even
the highrainfall character
variability affectingforthis
allparameter.
stations studied
The Bertin inmatrix
the same year) but toalso
was introduced identifies
harmonize
and consolidate information after the statistical treatment. The Bertin
conflicting information (different characters between stations for the same year). The MGCTI matrix is a manual andand
visual method of classification of information based on data. This matrix
its graphic representation allow a chronological reading and a spatial analysis of the phenomenon. is used to group the
data thathas
This method have similarities
been according
successfully to allin
tested the criteria
many studied.
North It provides
African a simple
regions and effective
[27–30], and in the
way to establish a multivariate typology based on observations of the user. This provides the
Sahel [31]. A comparative study with the Standard Precipitation Index (SPI) method for detecting
concordant results (even rainfall character for all stations studied in the same year) but also
climateidentifies
droughtconflicting
was conducted in 2015 [32]. This study showed the simplicity and clarity of the
information (different characters between stations for the same year). The
results obtained with the MGCTI method. One of the aims of this article is to show the trend of
rainfall over nearly half a century and to detect the date of changes of cycles.
The First Stage. An annual data precipitation (cumulative rainfall over a calendar year) hierarchy
in terms of limit values (Q1, Q2, Median, Q3, and Q4) is done for all stations and for the entire series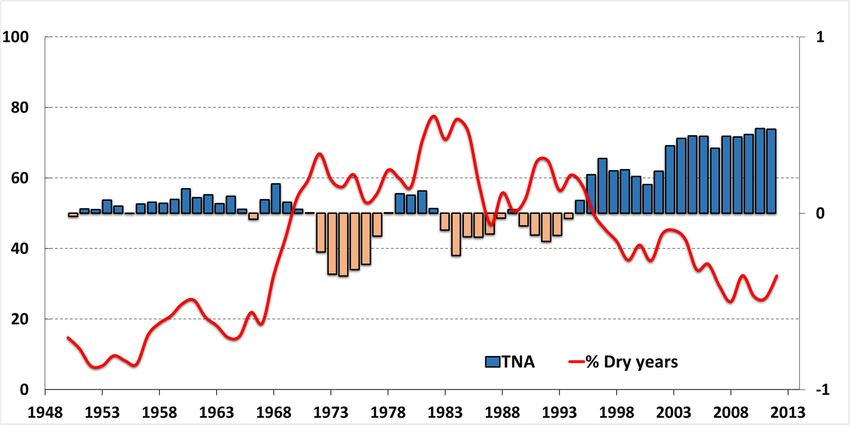
Water 2020, 12, 1754 4 of 18
(Table 1). Depending on data position in relation to limit values, the years are considered as very dry,
dry, normal, rainy, very rainy (Table 2):
(i) very dry, below the first quintile;
(ii) dry, between the first and the second quintile;
(iii) normal with trends towards drought, between the second quintile and the third quintile;
(iv) rainy, between the third and the fourth quintile;
(v) very rainy, above the fourth quintile.
Table 1. Distribution and hierarchization of annual rainfall according to the quintiles.
Mauritania Q1 Q2 ME Q3 Q4
Aioun 146 209.4 221.1 256.6 325.6
Akjoujt 32.6 54.7 72.8 84.8 137.5
Atar 38.9 68.3 76.9 90.4 127.8
Bir Moghrein 8.8 21.7 27 37.1 70.5
Boutilimit 96 135.2 159.5 170.8 227.4
Kaédi 218.8 251.1 288.9 319.9 415
Kiffa 176.1 264.1 281 319.2 422.9
Néma 164.5 220.4 231.5 258.2 331.5
Nouadhibou 4.9 12.5 19.9 24.3 45.6
Nouakchott 45.4 81.7 95.4 119 189.7
Rosso 163.3 239.2 258.5 297.3 338.9
Tidjikja 53 95.5 110.2 130.2 171.7
Zouérate 21.3 38 47.2 56.7 85
Senegal
Bakel 397.1 468.7 503.4 542.3 670
Dakar 274.3 382.8 421.6 477.2 624.3
Ziguinchor 1105.3 1281.5 1383.2 1531.4 1677.3
Saint Louis 188.7 240.6 278.9 300 373.5
Kedougou 1062 1154.5 1186.3 1264 1375.8
Kaolack 510.5 590.2 636.6 716.5 849
Matam 292.7 368.9 412.2 452.4 522.5
Burkina Faso
Bobo Dioulas 888.8 972 1037.7 1085 1246
Boromo 773 884 930 963 1051
Dori 397 455 476 531 625
Fada N’gourma 699.5 789 824.5 907 999.5
Gaoua 954 1024 1059 1096 1207
Ouagadougou 675 738.87 765 803 928
Ouhagouya 536 612 649 709 767
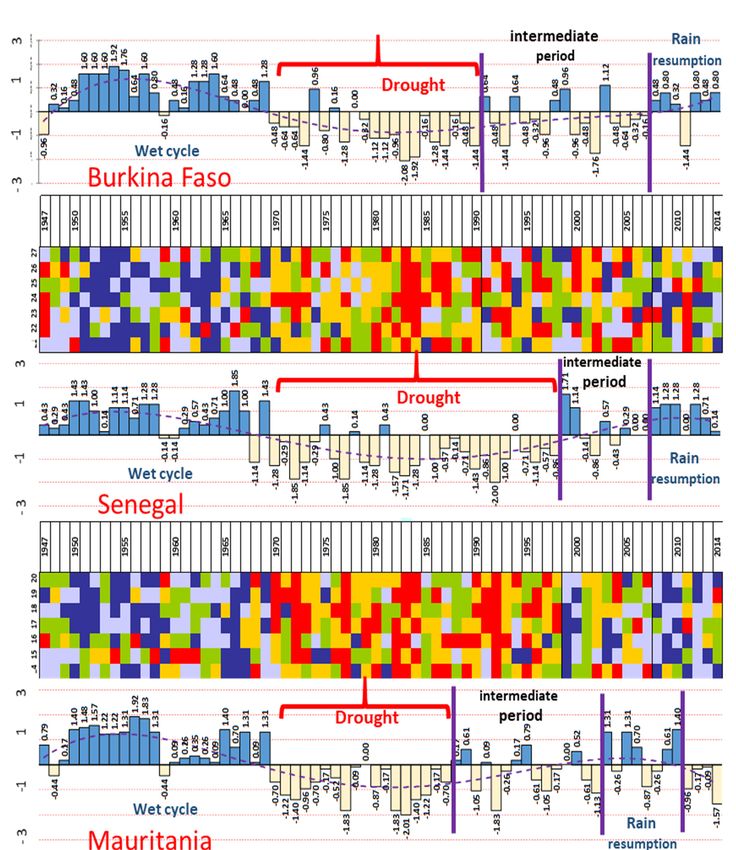
The Second Stage. A recoding of values is made by means of a range of colors (the color varying
in terms of the annual cumulative rainfall position in relation to limit values). This first processing is
followed by a reordering procedure (permutations of columns) in order to get a ranking that allows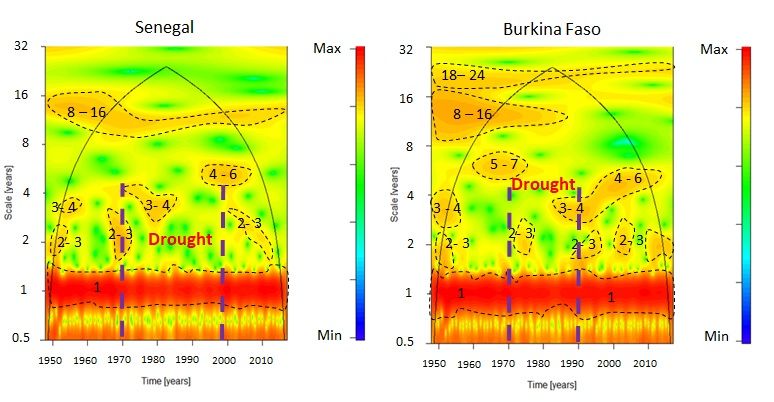
Water 2020, 12, 1754                                                                                      5 of 18

the visualization of a homogenous colored structure (Bertin matrix) (Figure 2). This procedure allows
Water 2020, 12, 1754                                                                            6 of 19
for the visualization of the climate parameter evolution in terms of two dimensions (time and space).

           Figure 2.
           Figure 2. Chronological
                     Chronological graphical
                                   graphical matrix of data
                                             matrix of data processing
                                                            processing applied
                                                                       applied to
                                                                               to rainfall
                                                                                  rainfall (1947–2014).
                                                                                           (1947–2014).

     The Third Stage. To determine the typical breaks and periods, a second procedure is conducted.
It consists in assigning a number ranging from one (very dry year) to five (very wet year) according
to the already determined features assigned to each year. The sum of numbers of all stations for each
year is centered and reduced, thus getting a regional index (RI) varying from +∞ for a very wet year
to −∞ for a very dry year. The “RI” is calculated as follows: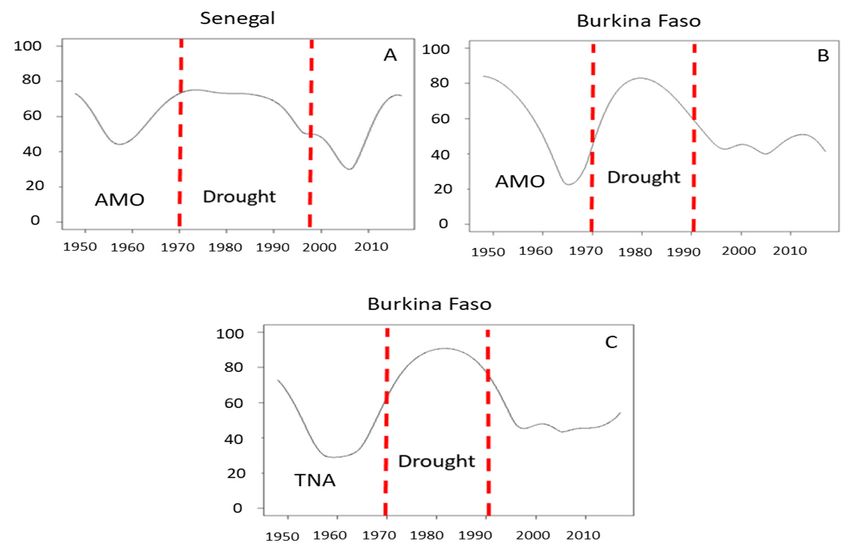
Water 2020, 12, 1754                                                                                         6 of 18

                              Table 2. Trend of annual rainfall according to the quintiles.

             Thresholds                Q1             Q2             Median              Q3         Q4
                                                                   Q2–Median
       Distribution of values         0–Q1         Q1–Q2            (40–50%)           Q3–Q4        >Q4
                (%)                 (0–20%)       (20–40%)         Median –Q3         (60–80%)   (80–100%)
                                                                    (50–60%)
           Annual rainfall          Very dry          Dry            Median              Wet     Very wet
           Trend at station
           Regional trend                                         Not expressed

     The Third Stage. To determine the typical breaks and periods, a second procedure is conducted.
It consists in assigning a number ranging from one (very dry year) to five (very wet year) according to
the already determined features assigned to each year. The sum of numbers of all stations for each
year is centered and reduced, thus getting a regional index (RI) varying from +∞ for a very wet year to
−∞ for a very dry year. The “RI” is calculated as follows:

                                                   RI = (Xi − X)/S                                              (1)

where Xi is yearly value. X is the series average, and S is standard deviation. The projection of the
result on a graph allows for the visualization of the evolution of the phenomenon on a regional scale in
a first stage and. in a second stage for the determination of data on breaks and trend change.

-     The continuous wavelets analyses allow a temporal location of the variability of a given signal.
      It breaks down the signal, both, in time and in frequency, which can correctly describe these
      hydrological or climatic fluctuations, periodic or not [33] introducing the transformation into
      wavelets that, unlike the Fourier’s transformation, breaks down the signal into a sum of finite-sized
      functions located over time for each frequency detected in the signal. For this, a mother wavelet
      is dissociated into girl waves to find the given frequency and is then translatable to analyze the
      neighboring frequencies. So, these analyses were developed to compensate for the disadvantages
      of conventional Fourier analysis. The girl wavelets have the result of the decomposition of the
      reference wavelet (mother wavelet). Each wavelet has a finite length (a ladder) and is highly
      localized over time. The mother wave has two parameters for time-frequency exploration: A scale
      a and a time location b:                                    !
                                                         1    t−b
                                              ψa,b (t) = √ ψ                                             (2)
                                                          a    a

     The setting in scales and the translation of the girl wavelets allow the detection of the different
frequencies that make up the signal. In addition, these frequency components can be detected and
studied over time, allowing for a better description of non-stationary processes [34]. The continuous
wavelet of an S(t) signal produces a local wave spectrum, as defined by (Equation (2)):

                                                 +∞
                                                 Z                  !
                                                          1     t−b
                                       S(a, b) =   s(t) × √ × ψ       × dt                                      (3)
                                                           a     a
                                                 −∞

      The convolution of the filtered monthly signal (Rainfall, AMO, TNA, and TSA) by a non-orthogonal
wavelet basis was applied to define the continuous wavelet time-scale spectrum, which is able to
identify the spectral components assigned to the dominant mode of variability of the total signal.
      The rainfall signal was analyzed using CWT to identify the dominant modes of variability
characterizing the Sahelian rainfall (Figure 3). Furthermore, the convolution of this signal with the
wavelet basis generates a contour diagram having three variables: (1) the time graduation on the x-axis,
(2) the time scale of wavelet on the y-axis, and (3) the power or variance of variability on the z-axis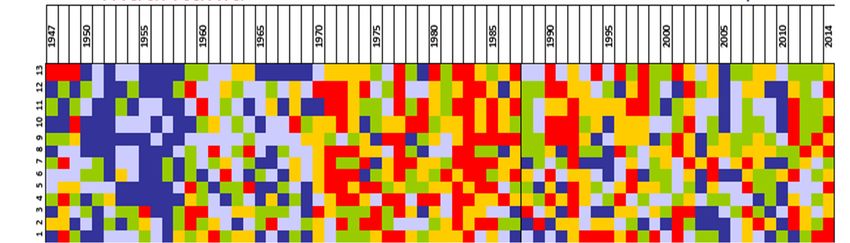
Continuous wavelet coherence can be defined as the estimate of the temporal evolution of
linearity and of the relationship between two signals on a given scale [34,37]. Wavelet consistency is
calculated using smoothed wavelet spectra of the SWxx(a, τ) and SWyy(a, τ) series and a smoothed
crossed wavelet spectrum SWxy(a, τ) [38].
Water 2020, 12, 1754 7 of 18
SWxy (a, )
WC(a, Ƭ) = (5)
SW
( a, ) . SW yy (a, )
xy
which can also can be explained by the correlation degrees between the signal and the wavelet basis.
Consistency
Such representation is definedeventual
illustrates as being the modulus
changes inofthethevariance
crossed spectrum,
based onnormalized of the same signals.
the non-stationary
Distribution of the power (expressed as normalized decibels, i.e., maximum power = 0 bd
spectrum, having values between zero and one, and represents the degree of linear between twofor each
processes. A value of 1 means a linear correlation between the two signals at a time T on the scale a
scale) in the wavelet contour diagram is assigned by a variation of color from dark blue, that represents
and a value of 0 that indicates a zero correlation [34,39].
the low power (variance), to dark red, which represents the increasing power observed.
FigureFigure 3. Continuous
3. Continuous wavelet
wavelet ofofprecipitation
precipitation regime
regimein in
Senegal and and
Senegal Burkina Faso. Faso.
Burkina
This method therefore makes it possible, in our case, to be able to assess and describe the links
Then, correlation between the index of climate AMO, TNA, TSA, and rainfall signal was computed
existing between rainfall variability in the Sahel and climatic (represented by the AMO, TNA, and
by the coherence diagram (WCO) for different modes of variability.
TSA indices), both for the different scales (frequencies) and according to the evolution of relationships
To over
compare
time. the time series with each other, cross-correlation analysis is used.
By analogy to the spectra
The statistical crossed
significance by Fourierobserved
of the fluctuations transform, the
by the spectrum
wavelet in crossed
transform wavelets
is evaluated by is a
methodcomparing
which makesthe local wavelet spectra
it possible against randomly
to evaluate distributed
the correlation theoretical
between twospectra.
signalsMore details to the
according
various on these(frequencies)
scales statistical tests during
are indicated
timeand discussed in the associated literature [38,39].
[35,36].
In this article we consider that the percentages of consistency express a weak relationship when
The spectrum by crossed wavelets Wxy (a, τ) between two signals x(t) and y(t) is calculated
this percentage is less than 50%. The relationship is average when the percentages are greater than
according
50%toandthe
lessequation
than 70%. below, where becomes
The relationship CX (a, τ)strong
and when
C*Y (a,
theτ) are the wavelet
percentages coefficient
are between 70% and of the
continuous signal
90% and veryx(t) andifthe
strong the conjugate of the wavelet
percentage exceeds 90%. coefficient of y (t), respectively:
3. Results Wxy (a, τ) = cx (a, τ) × C*y (a, τ) (4)
3.1. Sahelian Rainfall Trend
Continuous wavelet coherence can be defined as the estimate of the temporal evolution of linearity
The results ofbetween
and of the relationship statistical two
processing
signalsshow
on aangiven
evolution
scalemarked by Wavelet
[34,37]. various cycles structuredisinto
consistency calculated
three main periods (Figure 2).
using smoothed wavelet spectra of the SWxx (a, τ) and SWyy (a, τ) series and a smoothed crossed wavelet
The period of the fat cow, called as such in reference to the abundance of pastures, is visible
spectrum SWxy (a, τ) [38].
between 1947 and 1969. This period is considered wet, as shown by the matrix carried out for the
SWxy (a, τ) |
WC(a, T ) = qh i (5)
SWxy (a, τ) | . SW yy (a, τ) |
Consistency is defined as being the modulus of the crossed spectrum, normalized of the same
spectrum, having values between zero and one, and represents the degree of linear between two
processes. A value of 1 means a linear correlation between the two signals at a time T on the scale a
and a value of 0 that indicates a zero correlation [34,39].
This method therefore makes it possible, in our case, to be able to assess and describe the links
existing between rainfall variability in the Sahel and climatic (represented by the AMO, TNA, and
TSA indices), both for the different scales (frequencies) and according to the evolution of relationships
over time.Water 2020, 12, 1754 8 of 18
The statistical significance of the fluctuations observed by the wavelet transform is evaluated by
comparing the local wavelet spectra against randomly distributed theoretical spectra. More details on
these statistical tests are indicated and discussed in the associated literature [38,39].
In this article we consider that the percentages of consistency express a weak relationship when
this percentage is less than 50%. The relationship is average when the percentages are greater than 50%
and less than 70%. The relationship becomes strong when the percentages are between 70% and 90%
and very strong if the percentage exceeds 90%.
3. Results
3.1. Sahelian Rainfall Trend
The results of statistical processing show an evolution marked by various cycles structured into
three main periods (Figure 2).
The period of the fat cow, called as such in reference to the abundance of pastures, is visible
between 1947 and 1969. This period is considered wet, as shown by the matrix carried out for the three
countries. The number of rainfall-challenged years, with a negative index, is very small. Two years of
deficit were observed in Mauritania (1948 and 1959) and in Burkina Faso (1947, 1959). Three years
were observed for Senegal (1959, 1960, and 1968).
Starting with the 1970s, it was noted that a period of severe drought occurred throughout the
entire Sahelian region (1970–1987—Mauritania; 1970–1990—Burkina Faso; and 1970–1998—Senegal):
In Mauritania, the succession of dry years was interrupted between 1970 and 1987. The drought
was severe in 1977 and 1982–1983. During these years, the regional index exceeded −1.5.
For Burkina Faso, this long period is marked by a succession of years of deficit for two decades
(except for 1974 [0.96] and 1976 [0.16]). Drought was severe during 1982, 1983, 1987, and 1997 when
regional indices reached −2.08, −1.92, −1.44, and −1.44, respectively.
As for Senegal, the dry climatic phase extended over almost 30 years.
The period of the return of precipitations is marked by two clearly identified cycles.
The first period is characterized by a break in the dry conditions of the past (we observe an
alternation of wet and dry years on the matrix). This trend may be interpreted as an intermediate
period which started in Mauritania in 1988, in Burkina Faso in 1990, and in Senegal in 1999. This cycle,
which overlaps the climatic conditions of the previous years, announces the major climate changes
currently noticed in the West African region.
The second period is identified by a higher frequency of wet years (positive indices). As regards
Mauritania, it was visible starting with 2003, with several wet years exceeding the +1 threshold (2003,
2005, and 2010). In Senegal, this trend was noted as early as 2008 with a succession of wet years
that exceeded the index +1 (2008–2011), interrupted in 2011, which is considered to be a “normal”
climatologic year. In Burkina Faso, the conditions are similar to those in Senegal. The last years of
the pluviometric series (starting with 2008) marked the return to favorable conditions for rainfall.
Except 2011, just like in Senegal, a negative index of −1.4 was recorded. The situation was the same
in Mauritania as well, with an index of −0.96, which points to the aridity conditions of this Sahelian
area in West Africa. This rainfall variability, which marked the entire region, was more pronounced in
Mauritania, due to the geographical position of this country in relation to the West African Monsoon
movement to the northern areas of Sahelian Africa.
We can note two normal years with a dryness trend in 2012 and 2013, for Mauritania, whereas
throughout the rest of the area studied this interval is considered to be wet, with an index of +1.28 in
Senegal and +0.80 in Burkina Faso. In 2013, rainfall quantities in these countries were relatively small,
falling under moisture conditions.
Thus, after almost three decades of drought, a large part of Sahelian West Africa recorded a return
of rains. This trend is subject to a differentiated spatial distribution. The intermediate period (the
succession of wet and dry years) started in Senegal later. The wet cycle (higher frequency of wet years)Water 2020, 12, 1754 9 of 18
is less significant in Mauritania, even absent in the last years, namely 2012 and 2013 (this last year
recorded a drought tendency). In 2014, there was a −1.57 index in Mauritania, whereas in Senegal and
Burkina Faso there were wet conditions of +0.14 and +0.80, respectively.
3.2. Rainfall Variability in Senegal and Burkina Faso
The continuous wavelets transform is a good method to study the relation between rainfall
and the climate index AMO, TNA, and TSA. This method was used by some authors to identify the
non-stationary behavior of North Atlantic Oscillation (NAO) evolution. Similar researches were carried
out by [34,40–46].
In this research, CWT was performed on monthly dataset aiming to identify the spectral
components of the signals which can be assigned to different modes of variability characterizing the
geophysical signal and, eventually, the time scales involved. The mean monthly values were available
only for stations of Senegal and Burkina Faso used in the first part of this research (Rainfall, 1948–2017).
Available monthly rainfall data were extracted between 1948 and 2017 for each country. These data
vary from 697.27 mm for Senegal and 839.84 mm for Burkina Faso. We do not have monthly data for
Mauritania and it is for this reason that this country is not associated with this analysis.
The CWT of the monthly data of precipitation was simulated (Figure 3). This analysis shows
several variability scales for the two countries: Seasonal (6 months–1 year), interannual (2–3, 3–4, 4–6
and 5–7 years), quasi-decadal (QDO: 8–16), and multi-decadal (MDO: 18–24 only for Burkina Faso),
as shown by Figure 3.
As for the annual band, it is of strong power for the two countries. The signal has no visible
discontinuity. Seasonal variability is linked to the contrast between the dry seasons (November–March)
and the wet seasons (April–October). Seasonal patterns normally weaken in arid years and only get
stronger in wet years. This is not visible in Figure 3 and probably comes from the fact that we have
used the monthly averages of the different stations in each country (a test carried out on the data of the
Dakar station confirm this particularity).
The 2–3-year inter-annual band was present in both countries at specific dates. At the start of
the series, we find it in 1950 for both countries. It was also present in 1969 in Senegal and in 1975
in Burkina Faso. In the 1990s, this band disappeared in Senegal and reappeared in the early 2010s,
spreading to the 3–4 year mode. In Burkina Faso, this band reappeared between 1988 and 1995 then
between 1998 and 2003 and finally, between 2008 and 2017.
The 3–4 year band is visible between 1950 and 1955 in Senegal and from 1948 to 1955 in Burkina
Faso; it was also found between 1985 and 1995.
The 4–6 year band is present at the end of the series between 1995 and 2005 in Senegal and from
1995 until 2010.
The 5–7 year band was only present in Burkina Faso, between 1962 and 1972.
The quasi-decadal 8–16-year mode was present for the two countries studied. It was more spread
out for Senegal but from 1975, it weakens and turns into 10–14-year-old fashion. In Burkina Faso, it
was more powerful and concerns the period 1947–1985. There is a loss of energy after this last date.
The multi-decade mode does not appear on the wavelet of Senegal. It was present in Burkina
Faso (18–24-years) from 1947 and until 1995 with a weakening since this last year.
4. Discussion
Potential Relations between the Global Variability of AMO, TNA, TSA, and the Rainfall
The West African Monsoon is a coupled atmosphere-ocean-land system and the major phenomenon
of interest in the Sahelian zone in winter. Since the beginning of spring, temperatures increase, and a
cold zone is formed in the Gulf of Guinea. This first thermal contrast explains the oceanic moisture
transfer to the mainland in accordance with the trans-equatorial movement of trade winds in the
southern hemisphere [34,41]. In West Africa, this transfer is governed by an overall movement of theWater 2020, 12, 1754 10 of 18
meteorological Equator and its low-pressure corridor (ITCZ, Intertropical Convergence Zone) towards
the north, under the effect of the attraction of the Saharan thermal depressions and a greater vigor
of the anticyclonic nuclei in the southern hemisphere in winter. Rainfall variability in the Sahelian
area is a climate feature in this region. In the last years, real scientific progress has been made in
understanding climatic mechanisms in this region and on large part of the planet as well [14,42].
Today, this knowledge allows one to state that climate is subject to natural fluctuations overlapped
by some anthropic signals (global changes). The role of oceans in regulating convective flows has
been extensively studied by several specialists [14,47–49]. Thus, due to studies on pressure fields and
oceanic temperature, two natural signals known as; multi-decadal signal (a signal occurring over a
period larger than 40 years—low frequency variability) and quasi-decadal signal (signal with a shorter
period, of 8–14 years. low-frequency variability) have been identified [16,50–52].
According to these researches, the possible links between SST and rainfall conditions are very
complex and should be investigated separately for each frequency by the use of high statistical methods
as the wavelets. The correlation between the index climate AMO, TNA, TSA, and rainfall signal
was computed
Water 2020, 12,by the coherence diagram for the different modes of variability. Wavelet11consistency
1754 of 19
analyses identify significant common oscillations between two signals (precipitation/Atlantic TSM) at
certainwavelet with the
variability global
scales formode of variability
certain (1, 2–4,
time intervals 4–8,The
[53]. 8–16,result
18–24,ofand 20–24-year
coherence are shown
wavelet inthe
with the global
Figure 4 and Tables 3-5).
mode of variability (1, 2–4, 4–8, 8–16, 18–24, and 20–24-year are shown in the Figure 4 and Tables 3–5).
4. Wavelet
FigureFigure coherence
4. Wavelet coherenceanalysis
analysisbetween averagemonthly
between average monthly rain
rain in Senegal
in Senegal and Burkina
and Burkina Faso Faso
(average of theofdifferent
(average stations
the different in each
stations incountry) and climate
each country) indices:
and climate Atlantic
indices: multidecadal
Atlantic oscillation
multidecadal
(AMO), Tropical(AMO),
oscillation Northern Atlantic
Tropical IndexAtlantic
Northern (TNA),Index
and (TNA),
Tropical Southern
and Tropical Atlantic
SouthernIndex (TSA).
Atlantic Index
(TSA).
The AMO shows moderate consistency with the monthly rainfall averages for the two countries
studied.
On an interannual scale, the contribution of AMO is variable, we observe however a loss of
coherence for the two countries between 1970 and 1980 (Table 3).Water 2020, 12, 1754 11 of 18
The AMO shows moderate consistency with the monthly rainfall averages for the two
countries studied.
On an interannual scale, the contribution of AMO is variable, we observe however a loss of
coherence for the two countries between 1970 and 1980 (Table 3).
Table 3. Percentage of consistency between precipitation and the AMO index (%).
Variability Mode 1 2–4 4–8 8–12 8–16 18–24 20–24
Senegal 68.36 65.74 61.26 62.45 60.05 63.60 69.20
Burkina Faso 67.83 65.32 62.73 62.10 62.21 61.21 59.34
The contribution of the TNA on rainfall shows moderate consistency if we consider the different
modes of variability studied (Table 4). The highest percentages are observed according to the modes of
multi-decadal variability (20–24-years).
Table 4. Percentage of consistency between precipitation and the TNA index (%).
Variability Mode 1 2–4 4–8 8–12 8–16 18–24 20–24
Senegal 67.69 67.68 61.26 63.12 57.51 68.53 69.99
Burkina Faso 72 59.08 64.25 55.72 57.80 72 81.62
The consistency is well distributed in the multi-annual mode during the dry period for the
two countries. In Burkina Faso, this strengthening was visible from the late 1960s to the mid-2000s,
according to the 18–24 age group. For the 20–24 age group, this consistency is strong and reaches
almost 82% (Table 4). Slightly offset in time, this reinforcement is also visible on the wavelet coherence
spectrum of Senegal. We can see it between 1970 and 2005 but according to a lower consistency
percentage of 72% for the 18–24-year mode (Table 4).
On a quasi-decadal scale (8–12 and 8–16 years), strong consistency is noted during the dry period.
It is located between 1970 and 1990 for Burkina Faso with a loss of consistency before and after this
date. In Senegal, this strengthening of coherence with TNA was visible between 1960 and 1985 and the
loss of coherence appeared after this last date.
TNA’s contribution to the interannual scale is variable. In Burkina Faso, the 4–8-year age group
was reinforced between 1947 and 1975 then between 2004 and 2017. Between these two periods, a loss
of power occurred. In Senegal, coherence is reinforced for this frequency band only between 1948
and 1952, there is an overall loss of power after this date. Despite the significant variability of the
2–4-year mode, we can nevertheless observe a structuring of this frequency band during the dry period.
A strengthening was noted between the early 1970s and the mid-1990s for Senegal. In Burkina Faso,
it was noted between the end of the 1970s and the mid-2000s. Reinforcement of consistency with the
TNA was noted punctually according to different years for Burkina Faso (mid-1950s and 1960s) and
for Senegal (early 1950s, mid 1960s, and early 2000s).
The consistency of the TNA on a 1-year interannual scale is very variable, however, there was a
loss of power for the two countries in 2010.
The contribution of TSA to Sahelian rainfall is moderate according to the different modes of
variability studied (Table 5). On a multiannual scale, this relationship is reinforced for the 18–24-year
mode in Burkina Faso between 1947 and the mid-1990s and corresponds to a consistency of almost
79% for the 18–24-year mode. In Senegal, this link is not convincing, we note it by the loss of the signal
observed on the wavelet graphs (Figure 4) but we find it quite intense according to the 16–20-year
mode with 60. 14% of coherence between the late 1970s and early 2000s.Water 2020, 12, 1754 12 of 18
Table 5. Percentage of consistency between precipitation and the TSA index (%).
Variability Mode 1 2–4 4–8 8–12 8–16 18–24 20–24
Sénégal 66.16 67.79 69.70 75.82 57.51 53 48.51
Burkina Faso 63.62 63.81 73.84 55.72 67.21 78.91 75.24
On a quasi–decennial scale, the TSA contributes to the rainfall of Burkina Faso with a little more
than 67% for the 8–16-year-old mode (Table 5). This frequency band is spread out over the entire period
studied. However, we note that this relationship is more present during the dry period (from the late
1960s to the early 1990s). In Senegal the consistency of TSA is very low with this frequency band.
However, there has been a strengthening of the 8–12-year-old mode (75.82%) (Table 5). This mode is
generally present throughout the period studied.
Consistency with TSA on an interannual scale for mode 4–8 reached in Burkina Faso almost 74%
(Table 5). It is reinforced at the start of the series and during the drought period (1970–2004) with a
loss of power between 1985 and 1990 and a spread over the 2–4-year mode. In the 2–4-year mode,
the consistency with TSA is close to 68% in Senegal and reaches 63.81% in Burkina Faso. In the latter
country, this link is variable and is only reinforced at the start of the series, in the mid-1980s, in 2000
and in 2010. In Senegal, the consistency linked to this frequency is not well structured. However, some
reinforcements occurred in the late 1960s, between 1960 and 1970, in the late 1970s, and late 1990 and
early 2000s.
Consistency on an annual scale is very variable in the two countries and seems to present the
same fluctuations.
A convincing link with the surface temperature of the oceans but difficult to define over time.
According to Caminade et al. [54] rainfall in the Sahel is characterized by a variability between
2 and 4 years in the Sahel, superimposed by slower oscillations (over 8–16 years) as well as a
multi-decade evolution [55]. The results obtained thanks to wavelet coherence show convincing but
different relationships according to the mode of variability and the geographic areas. We shall further
summarize the main significant results of this analysis.
In Senegal AMO and TNA contribute more to rainfall according to the multiannual mode of
variability (more than 69% for mode 20–24) while consistency with TSA is stronger according to the
quasi–decennial and interannual modes (69.70% on the scale of 4–8 years and 75.82% for the mode
8–12 years).
For Burkina Faso, the contribution to the multi-annual scale of the TNA (81.62% for the 20–24-year
mode) and the TSA (78.91% for the 18–24-year mode) is greater than that of the AMO (59.34% for the
20–24 mode). For the interannual and quasi-decennial scale the influence of TSA is stronger. It reaches
67.21% for the 8–16-year mode, 73.84% for the 4–8-year mode and 79.98% for the 4–6-year mode.
Mohino et al. [53] show that the climatic drought of the 1970s and 1980s corresponded to a
negative multi-decadal oscillation of the Atlantic, favorable to a low rise in the convergence zone over
Africa, whereas the 1950s and rainy 1960s, like the recent small rainfall recovery in the years 1990–2000,
corresponded to a multi-decennial Atlantic oscillation returning to the positive phase. When studying
the general rain trend, we have already highlighted the short periods of rainfall variability in the
regions studied. The cycle of climatic drought started from the year 1970. This period extended until
1998 in Senegal but did not exceed the beginning of the 1990s for Senegal (Figure 2). The search for the
impact of the surface temperature of the Atlantic Ocean over this period is illustrated in the graphs
presented for the two countries (Figure 5). The influence of AMO seems intensified over this period for
the 8–16-year mode for Senegal and Burkina Faso (even if for this last country we mentioned a weak
global relationship above). For the same mode, we also highlighted a strong link with TNA during the
dry period of the latter country (Figure 5). For the other modes this connection sometimes appears to
be time-shifted or not clearly established.Water 2020, 12, 1754 13 of 18
Water
Water 2020,
2020, 12, 1754
12, 1754 1419
14 of of 19
Figure 5. Percentage of consistency between precipitation and the AMO and TNA index for
Figure
Figure 5. Percentage
5. Percentage of consistency
of consistency between
between precipitation
precipitation andand
thethe
AMOAMO
andand
TNATNA index
index for for mode
mode 8– 8–
mode 8–16-years.
16-years.
16-years.
The connection between the drought period and ocean surface temperatures seems even more
TheThe
evident when connection
connection between
between
one considers the the drought
thepercentage
drought ofperiod
period
dry and and
years ocean
ocean surface
surface
extracted from temperatures
temperatures
the seems
graphic seems
matrix even
even more
more
(Figure 2).
evident
evident
Charts when
when of oneone
Figure considers
considers
6 showthe the
how percentage
percentage
the of dry
NorthofAtlantic
dry years
years extracted
extracted
Ocean surfacefromfromthethe graphic
graphic
temperature matrix
matrix
(TNA) (Figure
(Figure
and 2). 2).
the dry
Charts
years’Charts
index of of Figure
Figure
(percentage 6ofshow
6 show how how
stations thethe aNorth
North
with Atlantic
Atlantic
reduced Ocean
Ocean
centered surface
surface
index temperature
of temperature
cumulated (TNA)
(TNA) andand
precipitations thethe
drydry
lower
years’
years’the
than index
index (percentage
(percentage
fourth quintile of of stations
in stations with
with area)
the studied a reduced
a reduced centered
vary.centered index
index
Variation of cumulated
of cumulated
curves precipitations
show the precipitations lower
lower
reverse connection.
Drythan
than thethe
year fourth
fourth
indices quintile
quintile
are in the
in the
positive instudied
studied area)
area)
1970–1999, vary.
vary. Variation
Variation
whereas curves
curves
the Atlantic show show
Ocean the reverse
thesurface
reverse connection.
connection.
temperature hasDry
Dry
year indices
year indices
negative values are
are in positive
positive
1971–1994 in 1970–1999,
in 1970–1999, whereas
(the oceanwhereas the Atlantic Ocean surface temperature
the Atlantic Ocean surface temperature has negative
was colder). has negative
values
values in 1971–1994
in 1971–1994 (the(the ocean
ocean was was colder).
colder).
Figure
Figure 6.
Figure Evolution
6. Evolution of dry
6. Evolution
of dry years
of dry (%)(%)
years
years (%) and temperature
andand temperature
temperature of
of the Atlantic
of the
the Ocean
Atlantic
Atlantic (TNA)—moving
Ocean
Ocean average
(TNA)—moving
(TNA)—moving average
average
over
over five
over years
five and
five the 1948–2014
years
years interval;
andand data
the source:
the https://www.esrl.noaa.gov/psd/data/correlation/
1948–2014
1948–2014 interval;
interval; data
data source:
source:
tna.data.
https://www.esrl.noaa.gov/psd/data/correlation/tna.data.
https://www.esrl.noaa.gov/psd/data/correlation/tna.data.
In In
thethe
last period
In the last
last period ofofof
period thethe
the series
series
series studied, the
studied, the the
studied, trendtrendis is
trend reversed
reversed
is reversed again,
again,
again, and, asand,
and, as as ocean
thethe the ocean
ocean surface
surface
surface temperature
temperature increases,
increases, the the
indicesindices
of dry of dry
years years
decreasedecrease
in favor in
of favor
rainierof rainier
periods. periods.
Thus,
temperature increases, the indices of dry years decrease in favor of rainier periods. Thus, when quasi- whenThus,
quasi-
decadal
decadal oscillations
oscillations areare positive
positive andand marked
marked by by a higher
a higher amplitude
amplitude (warmer
(warmer ocean),
ocean), they
they correspond
correspond
to a return of rains after Sahelian droughts and to an intensification of the West African
to a return of rains after Sahelian droughts and to an intensification of the West African monsoonmonsoonWater 2020, 12, 1754 14 of 18
when quasi-decadal oscillations are positive and marked by a higher amplitude (warmer ocean),
they correspond to a return of rains after Sahelian droughts and to an intensification of the West
African monsoon rain cycle [54]. The graphical matrix (Figure 2) shows this return starting with 1990
in Burkina Faso, 1999-Senegal, and 2003-Mauritania. This explains the reverse connection with rainfall
cycles in the studied regions.
5. Conclusions
The analysis of rainfall trend evolution shows that, following a long Sahelian drought, rains
returned to this part of West Africa. The observations made in the entire Sahel region point to a major
change that occurred in the mid-1990s (brutal alternation of dry and wet years) [54,55], which made
some scientists use the term “ecologization” [56,57]. Debates on this issue are still underway within
the scientific community, as there is some hesitation in evoking large-scale climate changes in the Sahel
region. Therefore, regional contrasts have been clearly established, which is in line with the climate
predictions established by the GIEC (2013) [37] for this area as well [48,54]. On a finer scale, the spatial
organization described in numerous studies [58] shows a persistence of drought conditions in the
extreme west of the Sahel as compared to eastern and central zones (a situation also encountered in the
last years in other states such as Niger and Mali) [59,60].
The vulnerability of the area to these changes is, furthermore, acknowledged on a large scale,
since much of its economy relies on the precipitation. Some specialists [61–64] have pointed out
that the return of rains to the Sahel, even though they do not reach the wet cycle level of the 1950s,
is directly related to the current level of greenhouse gases in the atmosphere. At the same time, these
researchers minimize the impact of sea surface temperatures on local rainfalls. Another research shows,
however, a greater importance of the influence of the ocean in the West African and Sahelian rainfall
phenomena [14,65–67].
This connection with the ocean did not appear very strong according to the analysis that we
have conducted on the monthly precipitation recorded in Senegal and Burkina Faso. Thus, we have
highlighted the strongest coherences on a multi-annual scale with TNA and on an inter-annual scale for
TSA in Burkina Faso. In Senegal, on the other hand, the influence of the AMO seems stronger on the
pluviometry of this country, for the multi-annual and quasi-decennial modes. Finally, the relationship
with the Sahelian drought seems more evident in the quasi-decadal mode (8–16 years). This connection
is also very well illustrated in Figure 6.
Author Contributions: Each author has a half of contribution. Both authors have the same degree of contribution
in terms of research concepts and methodologies. Z.N. analyzes the statistical-mathematical data strings by the
Bertin type matrix method. It also has contributions in the comparative analysis and validation of AMO. TNA.
TSA data. O.M. contributed to the article also through concept and research methodology. The editing and
translation of this material have been reviewed and completed by O.M. Also, authors contributed to making the
changes required by the reviewers. All authors have read and agreed to the published version of the manuscript.
Funding: The payment for the publication was made yesterday, 17.06.2020, by the author of the correspondence.
The bank transfer was made, around 9.30 am, from Banca Transilvania to Credit Suisse (Switzerland). INVOICE
ID water-817749 was passed on the transfer order.
Conflicts of Interest: The authors declare no conflict of interest.
References
1. Organisation Météorologique Mondiale (OMM). Déclaration de l’OMM sur L’état du Climat en 2012; World
Meteorological Organization (WMO): Geneva, Switzerland, 2013; Volume 1108, p. 32. Available online:
https://library.wmo.int/doc_num.php?explnum_id=7811 (accessed on 14 June 2020).
2. Boé, J.; Terray, L.; Habets, F.; Martin, E. Statistical and dynamical downscaling of the Seine basin climate for
hydro-meteorological studies. Int. J. Clim. 2007, 27, 1643–1655. [CrossRef]
3. Tramblay, Y.; Neppel, L.; Carreau, J.; Sanchez-Gomez, E. Extreme value modelling of daily areal rainfall over
Mediterranean catchments in a changing climate. Hydrol. Process. 2012, 26, 3934–3944. [CrossRef]Water 2020, 12, 1754 15 of 18
4. Min, S.-K.; Zhang, X.; Zwiers, F.W.; Hegerl, G.C. Human contribution to more-intense precipitation extremes.
Nature 2011, 470, 378–381. [CrossRef]
5. Westra, S.; Fowler, H.J.; Evans, J.; Alexander, L.; Berg, P.; Johnson, F.; Kendon, E.J.; Lenderink, G.; Roberts, N.M.
Future changes to the intensity and frequency of short-duration extreme rainfall. Rev. Geophys. 2014, 52,
522–555. [CrossRef]
6. Panthou, G.; Vischel, T.; Lebel, T. Recent trends in the regime of extreme rainfall in the Central Sahel. Int. J.
Clim. 2014, 34, 3998–4006. [CrossRef]
7. Donat, M.G.; Lowry, A.L.; Alexander, L.; O’Gorman, P.A.; Maher, N. More extreme precipitation in the
world’s dry and wet regions. Nat. Clim. Chang. 2016, 6, 508–513. [CrossRef]
8. Biasutti, M. Rainfall trends in the African Sahel: Characteristics, processes, and causes. Wiley Interdiscip. Rev.
Clim. Chang. 2019, 10, e591. [CrossRef]
9. Organisation Météorologique Mondiale. Le Climat Dans le Monde 2001–2010, Une Décennie D’Extrêmes
Climatiques, Rapport de Synthèse; World Meteorological Organization (WMO): Geneva, Switzerland, 2013;
Volume 1119, p. 15. Available online: https://library.wmo.int/doc_num.php?explnum_id=7831 (accessed on
14 June 2020).
10. Organisation Météorologique Mondiale. Déclaration de l’OMM sur L’état du Climat Mondial en 2016; World
Meteorological Organization (WMO): Geneva, Switzerland, 2016; Volume 1189, p. 44. Available online:
https://library.wmo.int/doc_num.php?explnum_id=3500 (accessed on 14 June 2020).
11. Blöschl, G.; Hall, J.; Parajka, J.; Perdigão, R.A.P.; Merz, B.; Arheimer, B.; Aronica, G.T.; Bilibashi, A.; Bonacci, O.;
Borga, M.; et al. Changing climate shifts timing of European floods. Science 2017, 357, 588–590. [CrossRef]
12. Westra, S.; Alexander, L.; Zwiers, F.W. Global Increasing Trends in Annual Maximum Daily Precipitation.
J. Clim. 2013, 26, 3904–3918. [CrossRef]
13. Fontaine, B.; Roucou, P.; Camara, M.; Vigaud, N.; Konare, A.; Sanda, S.; Diedhiou, A.; Janicot, S. Variabilité
pluviométrique, changement climatique et régionalisation en région de mousson africaine; La Météorologie Météo et
climat: Paris, France, 2012; pp. 41–48, ISSN 0026-1181.
14. Caniaux, G.; Giordani, H.; Redelsperger, J.-L.; Wade, M.; Bourles, B.; Bourras, D.; De Coëtlogon, G.; Du
Penhoat, Y.; Janicot, S.; Key, E.; et al. Les avancées d’AMMA sur les interactions océan-atmosphère.
Météorologie 2012, 8, 17–24. [CrossRef]
15. Lamb, P.J. Large-scale tropical Atlantic surface circulation patterns associated with sub-saharan weather
anomalies. Tellus 1978, 30, 240–251. [CrossRef]
16. Folland, C.K.; Palmer, T.N.; Parker, D.E. Sahel rainfall and worldwide sea temperatures, 1901–1985. Nature
1986, 320, 602–607. [CrossRef]
17. Folland, C.K.; Parker, D.E.; Kates, F.E. Worldwide marine temperature fluctuations 1856–1981. Nature 1984,
310, 670–673. [CrossRef]
18. Hastenrath, S. The Relationship of Highly Reflective Clouds to Tropical Climate Anomalies. J. Clim. 1990, 3,
353–365. [CrossRef]
19. Zhang, R.; Delworth, T.L. Impact of Atlantic multidecadal oscillations on India/Sahel rainfall and Atlantic
hurricanes. Geophys. Res. Lett. 2006, 33, 1–5. [CrossRef]
20. Ting, M.; KushniriD, Y.; Seager, R.; Li, C. Forced and Internal Twentieth-Century SST Trends in the North
Atlantic. J. Clim. 2009, 22, 1469–1481. [CrossRef]
21. Tourre, Y.M.; Paz, S.; Kushnir, Y.; White, W.B. Low-frequency climate variability in the Atlantic basin during
the 20th century. Atmos. Sci. Lett. 2010, 11, 180–185. [CrossRef]
22. Martin, E.R.; Thorncroft, C. Sahel rainfall in multimodel CMIP5 decadal hindcasts. Geophys. Res. Lett. 2014,
41, 2169–2175. [CrossRef]
23. Martin, E.R.; Thorncroft, C.D. The impact of the AMO on the West African monsoon annual cycle. Q. J. R.
Meteorol. Soc. 2013, 140, 31–46. [CrossRef]
24. Dittus, A.J.; Karoly, D.J.; Donat, M.G.; Lewis, S.C.; Alexander, L. Understanding the role of sea surface
temperature-forcing for variability in global temperature and precipitation extremes. Weather Clim. Extrem.
2018, 21, 1–9. [CrossRef]
25. Nouaceur, Z.; Murarescu, O.; Mură Rescu, O. Rainfall Variability and Trend Analysis of Annual Rainfall in
North Africa. Int. J. Atmos. Sci. 2016, 2016, 1–12. [CrossRef]Water 2020, 12, 1754 16 of 18
26. Nouaceur, Z.; Laignel, B.; Turki, I. Changements climatiques au Maghreb: Vers des conditions plus humides
et plus chaudes sur le littoral algérien? PhysioGéo 2013, 7, 307–323. [CrossRef]
27. Nouaceur, Z. Evaluation des changements climatiques au Maghreb. Etude du cas des regions du quart
nord-est algerien. In Proceedings of the 23rd Colloque de l’Association Internationale de Climatologie,
‘Risques et Changements Climatiques’ 2010, Rennes, France, 1–4 September 2010; pp. 463–468.
28. Amyay, M.; Nouaceur, Z.; Tribak, A.; Okba, K.; Taous, A. Caracterisation des evenements pluviometriques
extremes dans le Moyen Atlas marocain et ses marges. In Proceedings of the XXV eme Colloque International
de Climatologie 2012, Grenoble, France, 5–8 September 2012; pp. 75–80.
29. Laignel, B.; Nouaceur, Z.; Jemai, H.; Abida, H.; Ellouze, M.; Turki, I. Vers un retour des pluies dans le nord-est
tunisien? In Proceedings of the XXVIIe Colloque de l’Association Internationale de Climatologie 2014, Dijon,
France, 2–5 July 2014; pp. 727–732.
30. Nouaceur, Z.; Laignel, B.; Turki, I. Changement climatique en Afrique du Nord: vers des conditions plus
chaudes et plus humides, dans le Moyen Atlas Marocain et ses marges. In Proceedings of the Actes du XXVII
Colloque International de Climatologie 2014, Dijon, France, 2–5 July 2014; pp. 399–405.
31. Nouaceur, Z.; Laignel, B.; Turki, I. Changement climatique au Sahel: des conditions plus chaudes et plus
humides en Mauritanie? Secheresse 2013, 24, 85–95.
32. Nouaceur, Z.; Laignel, B. Caracterisation des evenements pluviometriques extremes sur la rive Sud du bassin
mediterraneen: etude du cas du quart nord-est algerien. In Proceedings of the Actes du XXVIII Colloque
International de Climatologie 2015, Liege, Belgium, 1–4 July 2015; pp. 573–578.
33. Grossmann, A.; Morlet, J. Decomposition of Hardy Functions into Square Integrable Wavelets of Constant
Shape. SIAM J. Math. Anal. 1984, 15, 723–736. [CrossRef]
34. Labat, D. Recent Advances in Wavelet Analyses: Part 1. A Review of Concepts. J. Hydrol. 2005, 314, 275–288.
[CrossRef]
35. Rossi, A. Analyse spatio-temporelle de la variabilité hydrologique du bassin versant du Mississippi: rôles
des fluctuations climatiques et déduction de l’impact des modifications du milieu physique. In Thèse de
Géologie–Hydrologie; Université de Rouen: Rouen, France, 2010; p. 329. Available online: https://tel.archives-
ouvertes.fr/tel-00690189/file/THESE_A._ROSSI_-_MISSISSIPPI.pdf (accessed on 14 June 2020).
36. Zamrane, Z. Recherche d’indices de variabilité climatique dans des séries hydroclmatiques au Maroc:
identification, positionnement temporel, tendances et liens avec les fluctuations climatiques: Cas des
grands bassins de la Moulouya, du Sebou et du Tensift. In Sciences de la Terre; Université Montpellier:
Montpellier, France, 2016; p. 197, NNT 2016MONTT181, HAL ID TEL 019690063. Available online:
https://tel.archives-ouvertes.fr/tel-01690063/document (accessed on 14 June 2020).
37. Maraun, D. What Can We Learn from Climate Data? Methods for Fluctuation, Time/Scale and Phase Analysis.
Ph.D. Thesis, Universität Potsdam, Potsdam, Germany, 2006.
38. Torrence, C.; Compo, G.P. A practical guide to wavelet analysis. Bull. Am. Meteorol. Soc. 1998, 79, 61–78.
[CrossRef]
39. Maraun, D.; Kurths, J. Cross wavelet analysis: significance testing and pitfalls. Nonlinear Process. Geophys.
2004, 11, 505–514. [CrossRef]
40. Anctil, F.; Coulibaly, P. Wavelet analysis of the interannual variability in southrn Quebec streamflow. J. Clim.
2004, 17, 163–173. [CrossRef]
41. Labat, D.; Ronchail, J.; Guyot, J.L. Recent advances in wavelet analyses: Part 2—Amazon, Parana, Orinoco
and Congo discharges time scale variability. J. Hydrol. 2005, 314, 289–311. [CrossRef]
42. Okonkwo, C. An Advanced Review of the Relationships between Sahel Precipitation and Climate Indices:
A Wavelet Approach. Int. J. Atmos. Sci. 2014, 2014, 1–11. [CrossRef]
43. Baidu, M.; Amekudzi, L.K.; Aryee, J.; Annor, T. Assessment of Long-Term Spatio-Temporal Rainfall Variability
over Ghana using Wavelet Analysis. Climate 2017, 5, 30. [CrossRef]
44. Dieppois, B.; Durand, A.; Fournier, M.; Massei, N.; Sebag, D.; Hassane, B. Variabilité des précipitations au
Sahel central et recherche du forcage climatique par analyse du signal: La station de Maïne-Soroa (SE Niger)
entre 1950 et 2005. Pangea 2010, 47/48, 27–35.You can also read