Formation of magnetized spatial structures in the Beta Lyrae system
←
→
Page content transcription
If your browser does not render page correctly, please read the page content below
Contrib. Astron. Obs. Skalnaté Pleso 50, 717 – 747, (2020)
                                               https://doi.org/10.31577/caosp.2020.50.4.717

                                                 Formation of magnetized spatial structures in
                                                           the Beta Lyrae system
                                                II. Reflection of magnetically controlled structures in the
                                                                    visible spectrum
arXiv:2008.08787v1 [astro-ph.SR] 20 Aug 2020

                                                                                 M.Yu. Skulskyy
                                                 Lviv Polytechnic National University, Department of Physics, 79013, Lviv,
                                                                 Ukraine, (E-mail: mysky@polynet.lviv.ua)

                                                               Received: April 13, 2020; Accepted: June 9, 2020

                                                  Abstract. This article proposes a picture of magnetized accretion structures
                                                  formed during the mass transfer in the Beta Lyrae system. It is shown that
                                                  the structure of the gaseous flows between the donor and the gainer is due to
                                                  the spatial configuration of the donor magnetic field. Its dipole axis is deviated
                                                  substantially from the line joining the centers of the components and is inclined
                                                  to the orbital plane of the binary system; the center of the magnetic dipole is
                                                  displaced from the donor center toward the gainer. The surface around the
                                                  donor magnetic pole, which is close to the gainer, is a region of an additional
                                                  matter loss from the donor surface. The effective collision of the magnetized
                                                  plasma with the accretion disk is enhanced by the fast counter-rotation of
                                                  this disk, especially in the secondary quadrature phases, in which the high-
                                                  temperature medium and the system of formed accretion flows are observed.
                                                      This concept is demonstrated, primarily, in the obvious correlations be-
                                                  tween the phase variability of the donor magnetic field and the corresponding
                                                  variability of the dynamic and energy characteristics of the various complex
                                                  lines. This refers to the behavior of the radial velocity curves of the emission-
                                                  absorption lines formed in the gaseous structures of type Hα , He I λ 7065, or
                                                  the variability of their equivalent width and intensity, and the variability of
                                                  conventional absorption lines of the donor atmosphere. This is true for the
                                                  phase variability of the absolute flux in the Hα emission line and the fast vary-
                                                  ing of the continuum in the Hα region as certain parameters, which reflect the
                                                  phase variability of the donor magnetic field. This approach made it possible
                                                  to determine the phase boundaries of the location of the magnetic polar region
                                                  on the donor surface above which the matter outflows are formed.
                                                  Key words: binaries: individual: Beta Lyrae – emission-line: magnetic field:
                                                  mass-transfer

                                               1. Introduction
                                               The previous article (Skulskyy, 2020) was intended to provide an overview and
                                               analysis of long-term observations needed to further highlight the questions
718                                                                   M.Yu. Skulskyy

aimed primarily on the study of magnetized gaseous structures. This thematics
was decisive and intensively developed on the basis of spectral observations
on large telescopes with the latest equipment in 1980-1995. Discoveries made in
original investigations, such as Skulskij (1985, 1992); Alexeev & Skulskij (1989);
Burnashev & Skulskij (1991); Skulskij & Malkov (1992); Skulskij & Plachinda
(1993), and others, have allowed us to create a certain picture of magnetized
gaseous structures until the mid-1990s. Along with a number of such studies over
the next decade, this picture has changed little. The following points should be
briefly noted. The analysis of all observations and studies of the donor magnetic
field showed that the systematic observations on the 6-m SAO telescope could be
considered decisive for the further study of the mass transfer and the formation
of accretion structures in the Beta Lyrae system. Based on these observations,
in Skulskij (1985) the first simulation of the donor magnetic field configuration
was conducted. The axis of the magnetic field is directed by the orbital phases
of (0.355-0.855) P. It is also important that the magnetic dipole axis is inclined
to the orbit plane of the binary system by an angle of 28◦ , and the center of the
magnetic dipole is displaced by 0.08 of the distance between centers of gravity of
both components from the donor center toward the gainer. It could be assumed
that the mass loss and its transfer from the donor to the gainer can occur not
only in the direction of the (0.5-1.0) P phases of the star-components gravity
axis, but also in the direction of the magnetic field axis. That is, in addition to
the gas flow that is directed from the deformed donor through a Lagrange point
to the gainer’s Roche cavity in a classical hydrodynamic picture (see Bisikalo
et al., 2000), there is the matter outflow channeled by the donor magnetic field
in the direction of its dipole axis from the donor surface and deflects along the
magnetic field lines toward the accretion disk. Moreover, the donor magnetic
pole in the 0.855 P phase is located on the donor surface slightly above the
orbital plane and approximated to the gainer. This presumes also the presence
of more effective shock collisions of the magnetized plasma in the phases of the
second quadrature (0.60-0.85) P at all heights of the accretion disk. The energy
effect of shock collisions of magnetized gas with the accretion disk is amplified in
these phases due to the rapid counter-rotation of this disk forming a hot arc on
the outer rim of the accretion disk facing the donor, (see Skulsky, 2015, 2018).
    These inferences, based on the spatial configuration of the donor magnetic
field, required a number of diverse observations and developed gradually. At the
same time, other scientists have also pointed out the need for such research.
Bahyl (1986), after having carefully studied the spectral absorption lines of the
donor atmosphere, noted: “the curve of the systems magnetic field variations is
similar in shape to the curves of the phase variations of the equivalent width
of the corresponding lines”. Aydin et al. (1988) also indicated that the presence
in the Beta Lyrae spectrum of the high-temperature resonance lines of N V,
Si IV, and C IV implies the existence of non-thermal sources in this system,
which cannot be matched by the radiation from stellar components; however,
this can be considered in the context of the discovery of a variable magnetic
Formation of magnetized spatial structures in the Beta Lyrae system 719
field by Skulskij (1985). Recently, Ignace et al. (2018), while studying the phase
variability of complex emission-absorption profiles of the Hα line, concluded
that in the explanation of the observation data “the magnetic field...could prove
relevant, e.g., Skulsky (2018)”.
Our analysis of known published observations has shown that the donor mag-
netic field is in some way reflected in infrared, optical and UV spectral regions.
This has stimulated the detailed investigation of the Beta Lyrae spectrum to
present it in the summarized work. This article focuses mainly on the extended
study of the continuum and complex lines in the visual spectrum with a view
of detecting, understanding, and explanation of the relationships between the
phase variability of the donor magnetic field and the characteristics of the phys-
ical processes occurring in moving gaseous structures between the donor and
the gainer.
It should be recalled that the longitudinal component of the donor’s magnetic
field changes significantly during the orbital period (which is close to 12.94 d);
phase changes in the range from zero to one, being tied to the main minimum of
this binary system in the visible spectral region when the more massive accretor
obscures of the bright donor; the schematic model of the Beta Lyrae system and
the picture of mass transfer are shown in Skulskyy (2020) in Figure 1, which is
needed to understand the physical processes in further analysis.
2. Magnetic field and physical processes in gaseous struc-
tures between donor and gainer
2.1. Magnetic field and the absolute flux in Hα emission line
The first among the most important results on the radiation of accretion flows
in the Beta Lyrae system was obtained by Burnashev & Skulskij (1991) on
the basis of their spectrophotometry that was carried out in 1974-1985. The
narrowband photometry was given in values of the monochromatic illuminance
at the top of the Earth’s atmosphere log E(λ) in erg · sec−1 · cm−2 at a 1-cm
wavelength interval. Along the continuous spectrum of this binary system the
wavelengths of the important selected working bands were λλ 6488, 6563, and
6637. The absolute flux in the Hα emission line above the continuous spectrum
in the band λ 6563 was considered as a certain physical parameter in view of
the interconnection to the variable magnetic field of the donor. Incidentally, the
monochromatic light curve reflecting the radiation flux in the band at λ 6488
showed that in the second quadrature the binary system is hotter than in the
first one. This brightening in the continuum correlates with such excess in the
far-ultraviolet (Kondo et al., 1994). However, the dependence of the absolute
radiation flux E(Hα ) on the orbital phase is more interesting (see Fig. 1) and
needs more careful consideration.
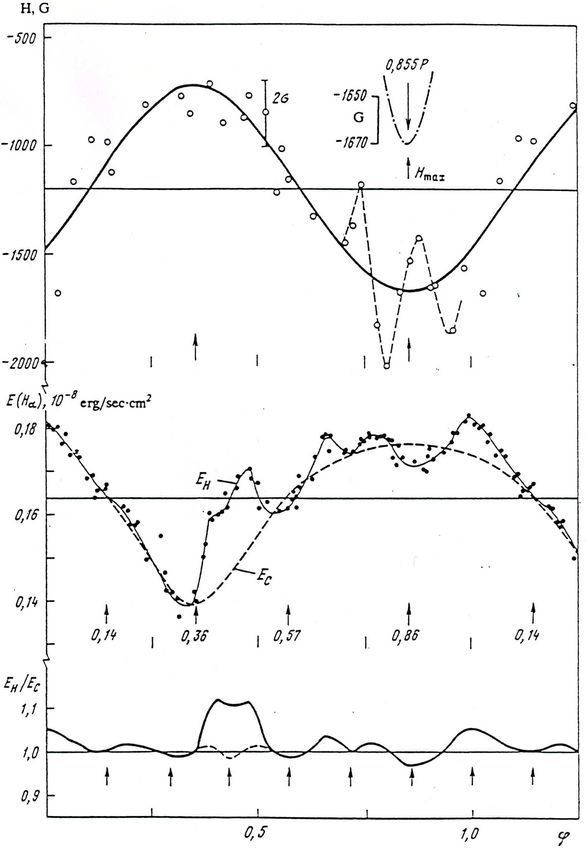
The upper box in Fig. 1 shows the variation of the effective magnetic field of
the donor as calculated from measurements made on Zeeman spectrograms in720 M.Yu. Skulskyy Figure 1. At the top - the variability over the orbital phase of the effective magnetic field strength of the donor; in the middle - the variability over the orbital phase of the absolute radiation flux in the Hα emission line; bottom - the 12% increase in the radiation flux in the Hα emission line in the phases round 0.43 P, which is interpreted as a result shock collisions of gaseous flows with the accretion disk. (Burnashev & Skulskij, 1991). 1980-88. This quasi sinusoidal curve shows the maximum value of the magnetic field of negative polarity at the phases around 0.855 P (the characteristic time of its secondary variations one also can see at these phases). The dipole axis in direction (0.355-0.855) P has the 0.145 P position-angle deviation (one-seventh
Formation of magnetized spatial structures in the Beta Lyrae system             721

of the orbital period) from the line joining the centers of stars in the binary
system in the direction (0.5-1.0) P. In the center of Fig. 1 the solid line, denoted
EH represents E(Hα ) as a function of phase. This dependence was derived from
the observation points obtained by moving the phase interval of 0.07 P in steps
of 0.01 P. The average error per point is less than σ = 0.03 · 10−8 erg/cm2 · sec.
Figure 1 clearly shows that the minimum and maximum values of the radia-
tion flux in the Hα line correspond to the two phases of the extreme values
of the magnetic field of the donor. It is seen that the phase variability of the
radiation flux of the Hα line has a narrow minimum coinciding in phase with
the magnetic field minimum, and the broad maximum of the radiation flux in
the Hα line matches with the phase of the maximum value of the magnetic
field. The phase intervals of the minimum ∆ Pmin =(0.57 P-0.14 P) and max-
imum ∆ Pmax = (1.14 P-0.57 P) of the radiation flux of the Hα line have the
ratio close to 3/4. The radiation flux in the Hα emission line between these ex-
tremes of the magnetic field increases 1.3 times, having some constant minimum
level in the phase of the minimum of the donor magnetic field.
    From this, it can be concluded that if the Roche cavity of the donor is filled,
as is generally accepted, it should be assumed that the outermost layers of the
donor surface easily lose matter in the direction of the dipole axis of (0.355-
0.855) P. However, this is observed mainly from the donor surface in the phase
region around 0.855 P, i.e., in phases of the observation of the magnetic field pole
facing the gainer. The radiating matter, as a material leaving the donor in the
form of a stellar wind along the lines of the magnetic field, deflects hereafter to
the gainer and forms a complex structure of accretion flows. And since initially
the gas moves perpendicularly to the donor surface, the Hα emission line is
generated close to the donor surface and its averaged radial velocities must first
have a thermal component, that is, they should not be very large Skulskij &
Malkov (1992). This is confirmed in section 2.3, where the radial velocity of the
Hα emission line as a whole shows the variability over the orbital period in the
range of ±45 km/s.
    Another non-trivial, but expected, result was obtained. The solid line mid-
dlemost in Fig. 1 shows, that there is the variable radiation flux of the Hα line
at the maximum of the magnetic field, but there is also its explicit excessively
outstanding part at the phases of (0.36-0.51) P that makes apparent the addi-
tional Hα line radiation flux (by 12 percent relative to the smoothed Ec curve;
see Fig. 1, bottom). The phase interval with the width of ∆ P=0.15 P can be
interpreted as the localization zone of direct collisions of gas flows with the ac-
cretion disk at the formation of a hot region on it. This is confirmed by numerous
polarimetric Beta Lyrae observations, including those of Appenzeller & Hiltner
(1967); Hoffman et al. (1998), and Lomax et al. (2012) where all polarization
curves show a pronounced minimum at the phases near 0.47 P, which is inter-
preted as a result of enhanced scattering by free electrons near the accretion
disk. This is also confirmed by the modeling of the light curve by Mennickent &
Djurašević (2013) with the detection at the phases around 0.40 P of the hotter
722 M.Yu. Skulskyy
region located on the accretion disk. However, the absolute spectrophotometry
by Burnashev & Skulskij (1991) identified clearly both the center and the phase
boundaries (0.43±0.06) P of the hotter region projected onto the accretion disk.
Hence, the absolute spectrophotometry of the Beta Lyrae system revealed
the fact of the apparent synchronous variability over the orbital phase of both
the effective magnetic field strength of the donor and the absolute radiation flux
in the Hα emission line. This indicates that the donor magnetic field directly
reflects the processes of radiation generation in the formed under its influence
spatial magnetized gaseous structures at the mass transfer in this binary system.
2.2. Magnetic field and the rapid variability of the spectrum in the
Hα emission region
The foregoing result is confirmed by a study of Alexeev & Skulskij (1989) of
the ultra-fast variability of the Beta Lyrae spectrum in the region of the Hα
emission line. Observations of this binary system were conducted for 8 nights
(over a 13-day orbital period) in August of 1981, using the 6-m SAO telescope
in conjunction with the dissector spectrophotometer. The spectral range inves-
tigated, centered on Hα for two dispersions amounting to 0.6 and 0.9 Å/channel
respectively, was 150 Å and 460 Å. The accumulation time for an individual
spectrum was equal to 10.48 and 5.24 seconds, respectively. All the data were
obtained with a spectral resolution of 0.6 Å/channel. Only at the 0.73 P phase
did we make observations using two different options. Based on processing over
700 individual spectra, one should focus on three original results.
The first important result is the detection of an unusually wide base emission
under the strong emission peak in the Hα line that is known to have a height
of several continuums and a total width of up to 700 km/s. This broad base
emission component has the total width above 6000 km/s, whereas photographic
spectral observations, for example by Batten & Sahade (1973), show that such
a broad component of the Hα emission is only of 1000 km/s. The highest dome-
shaped substrate of the broad emission component over 3000 km/s wide rises
at its center above the continuum to 25% in the 0.34 P phase, up to 30% in the
0.73 P phase, and up to 17% in the 0.87 P phase, that is in the phases of both
quadratures near observation phases of both poles of the magnetic field (see
Figure 2 as the fragment of Figure 13 from the article of Alexeev & Skulskij
(1989)). On the averaged spectrum with the spectral range of 460 Å at the
0.73 P phase (88 single spectra), in addition to the Hα line, the He I λ 6678
emission line was also present, which made it possible to more reliably mark
the continuum level. On the violet side of the broad emission component, the
narrow absorption with a radial velocity above -2000 km/s is observed in the
phase 0.73 P in the two averaged spectra with the spectral ranges 150 Å and
460 Å, respectively, and also the absorption at -1000 km/s in the phases 0.34 P
and 0.49 P. This may indicate high-velocity gas jets from a binary system that
are observed in phases near both poles of the magnetic field.Formation of magnetized spatial structures in the Beta Lyrae system 723
Figure 2. An average Beta Lyrae spectrum in relative intensities in the 0.73 P phase
(series of spectra with lower spectral resolution): the continuum level under Hα is
indicated by the dashed line.
The high speeds of motion of the radiating atoms, which follow from the
fact of the detection of intensive and broad wings of an Hα emission line in
quadratures, indicate that the space between the donor and the accretion disk
is the zone of the localization of the high-temperature hydrogen medium and
of the shock collisions of the speeded-up flows with this disk. The smallest
contribution to the continuum in the range of the broad emission component, in
particular their distant wings, is observed at phases 0.03 P, 0.11 P close to the
donor eclipse when the red wing is practically absent (in other words, the high-
temperature radiating gas is here almost completely obscured by the accretion
disk and only a small amount of this gas moves above this disk in the direction
of the gainer, i.e., toward the observer).
The second important result relates to the rapid variability of spectrum in
the Hα line region, which shows significant differences over the orbital phase.
The time intervals of this variability range from seconds to tens of minutes.
The least emission flux variability is observed in the main minimum at the
0.03 P phase. There is no appreciable variability in this flux at the 0.88 P and
0.11 P phases that are close and symmetric relative to the donor eclipse or the
primary minimum of the binary system. In these three phases, the observation
region of presumed collisions of the gaseous flows with the disk surrounding
the gainer is almost completely eclipsed by this accretion disk (see Figure 1 in
Skulskyy (2020)). However, shifting along the positional angle of the observation
of the binary system, in particular at the 0.34 P, 0.42 P, and 0.49 P phases, the
variability of the radiating flux in the Hα emission line increases substantially:
both in the shape and intensity of the central emission peak, as well as within724 M.Yu. Skulskyy
Figure 3. An example of quantitative estimates on single 10-second Hα line spectra
in the 0.49 P phase: the height of the continuum is shown on spectra 36 and 40; on
spectra 33, 34, and 38 there are indicated kinematic estimates of variable details of
the spectrum. (Alexeev & Skulskij, 1989)
the width of the emission component around this peak. At the 0.34 P phase,
when the space between the components of the binary system is still visible,
there is relatively little variability over the entire 15-minute observation. Here,
the monotonous variability of the central two-peak profile of the Hα emission
line was observed, with fast changes for several one-minute intervals. In the
next phase of 0.42 P, i.e., in the phase of observing the known hot region of
the accretion disk, the chaotic variability of the entire emission on 10-second
spectra increased very significantly, in both the central peak of the Hα emission
line and its broad emission component. However, the most intensive variability
of unusual modifications in the entire investigation region of the spectrum near
the Hα emission line is observed in the 0.49 P phase.
The evidence of obtained fast changes in the vicinity of the Hα line in the
0.49 P phase is shown in Fig. 3, which is a copy of Figure 23 from the article
of Alexeev & Skulskij (1989). Time intervals of the continuous variability of
different details in this spectrum diapason are observed from seconds to ten
minutes. This result is not simple to understand because at the 0.49 P phase the
donor should practically eclipse the known hot region on the accretion disk. At
the same time, from the space around this hot region, the gas outflow moves with
a great radial velocity of about -1000 km/s, which is recorded in the spectrum
by the appearance of absorption lines at phases from 0.34 P to 0.49 P. Then, it isFormation of magnetized spatial structures in the Beta Lyrae system 725
possible to assume the formation of the hot pulsating plasma at the upper disk
region, not obscured by the donor, as a result of the collision in this region of
ionized gas channeled toward the accretion disk due to the specific structure of
the donor magnetic field (the magnetic dipole axis is inclined to the orbit plane
of this binary system by an angle of 28◦ ). This may indicate that the moving
gas passing along the lines of the magnetic field in the direction of the gainer
collides with the accretion disk not so much in the plane of the orbit as the
entire height of the disk, forming in front of the disk some scattering structures,
which are clearly shown in Figure 1 as the hotter region on phases (0.39-0.51) P.
It should be considered that the visible height of the accretion disk in phases of
active shock collides may be observed above the donor surface.
The third result is similar to the phenomenon of the eruptive nature, which
consists of two components: “emission flare-up” and “traveling absorption”. It
was recorded in the set of 49 spectra at phase 0.81 P and is shown in Figures
24-28 of Alexeev & Skulskij (1989). The development of the central part of
this phenomenon is illustrated in Fig. 4, which is a copy of Figure 28 from
Alexeev & Skulskij (1989). Initially, from the first to the 31st single spectrum,
an unusually low ratio of the flux intensity in the central peak of Hα emission
line to the emission flux intensity in the continuum near the line of Il /Ic was
observed. This ratio gradually increased from 0.25 to 0.37, but in spectrum 32
reached sharply the value of 0.97, and in 33-49 spectra remained stable at the
level of 1.40. Such a sudden increase in the Il /Ic ratio in limits 31-33 spectra
looked like the “emission flare-up” phenomenon. Such a sharp transformation in
the intensity of the Hα emission line was parallel preceded by the phenomenon
of “traveling absorption”, which occurred suddenly within a minute in spectra
from 27 to 32. This event began in spectrum 27 with the occurrence of the violet
shift absorption at an averaged radial velocity of -2700 km/s from the center of
the Hα line. The core of this absorption, over 2000 km/s wide, reached a depth
of 16% in the spectrum 30 and lowered the entire Hα emission line almost under
the continuum. The rapid spectral shift of this absorption along the continuum
reached the position of +1100 km/s on the red wing of the Hα emission line and
disappeared almost entirely in the spectrum 32.
The observed phenomenon has no analog, and it is difficult to unambiguously
interpret. Its initial stage was fixed at the moment when the spectral region with
the central emission peak of the Hα line had an unusually small contrast with
respect to the close continuum (Il /Ic = 0.25 for the first 2-3 minutes from all
8 minutes observations) and was practically imperceptible unlike the formation
region of the broad emission component of this line. It is unknown how long this
situation lasted before our observations began (it can be noted that it took at
least 5 minutes to verify the correctness of the spectral region identification due
to the unusualness of the spectrum near Hα line). The emergence, development,
and disappearance of this peculiar “traveling absorption” at its motion along
the continuum (within one minute) can be a reflection of a certain mechanism of
the matter ejection in the direction of the observer and the reverse movement of726 M.Yu. Skulskyy
Figure 4. Detailed illustration and quantitative characteristics of “traveling absorp-
tion” and “emission flare-up” phenomena (dashed lines indicate the behavior of con-
tinuum; the zeros of the continuums coincide with the maxima of the lower spectra).
(Alexeev & Skulskij, 1989)
this matter of smaller density to the donor surface. This was accompanied by the
“emission flare-up” phenomenon, i.e., the sudden (within half a minute) increase
in the Il /Ic ratio from 0.37 to 1.40 in the central emission peak. However, the
characteristic time scale of the variability in the radiation flux of these emissions
does not reflect the large-scale motion of gaseous structures commensurate with
the Beta Lyrae system.
The aforementioned phenomenon as the event of the eruptive nature may
be related to the spatial configuration of the donor magnetic field. Indeed, this
phenomenon was detected at the 0.81 P phase when the pole of the magnetic
field on the donor surface is directed towards the observer (incidentally, Skulskij
(1982) observed the maximum of the magnetic field of the donor on the 6-m SAO
telescope the same night in August of 1981). This phenomenon is more likely to
have local spatial and temporal characteristics close to the donor surface. Such
an event may be a reflection of the ejection of a matter directly from the donor
surface, on which the location of the magnetic field pole, close to the gainer, isFormation of magnetized spatial structures in the Beta Lyrae system 727
clearly visible in this phase. That is, this event may reflect the motion of mag-
netically controlled matter, which can be directed outward from the magnetic
polar region on the donor surface, as suggested by Shore & Brown (1990) for
helium stars. This is also just one of the possible spatiotemporal events of differ-
ent durations recorded by different observers, for example, Bless et al. (1976);
Skulskij (1980). It is confirmed by Kondo et al. (1994) owing to the observed
outburst fixed on the 965 Å band light curve in the same second quadrature.
The physical nature of such events may be similar. It can be assumed that the
ionized plasma, which is channeled by the magnetic field of the donor from its
surface and subsequently collides with the accretion disk, is not laminar, but is
accompanied by sometimes significant non-stationary ejections.
2.3. Magnetic field, dynamics of the Hα emission line and other
emission-absorption lines
From foregoing convincing correlations between the variability of the radiation
flux in the Hα line and the effective magnetic field strength of the donor, the
logical task was to investigate such causal relationships based on the dynamics
and structure of the complex Hα emission line. It should be noted that our
long-term studies of strong hydrogen and helium emission lines, starting with
Skulskij (1972), have shown that the variability of these lines required obtain-
ing better spectral material. The exact emission-absorption profiles of the Hα
lines, represented on a dynamic scale as “relative intensity versus radial veloc-
ity” according to Figure 2 of Skulskij & Malkov (1992), were obtained using
high-dispersion 3 and 6 Å/mm CCD spectrograms for 20 nights 1985-1990 on
the 2.6-m CrAO telescope. This article confirmed the reality of both the rare
sharp fluctuations in the Hα flux at intervals of up to 10 minutes and some
of the seasonal changes noted in previous studies. More importantly, this arti-
cle presented the new results of reliable measurements of the Doppler shifts of
the structural components of the Hα -profile, as well as the factors affecting the
profile and dynamics of the Hα emission line as a whole.
The Hα emission line, as the strongest emission line of the visible spec-
trum of the Beta Lyrae, exhibits two emission peaks above the continuum and
the absorption feature between these emission peaks. The radial velocities of
these three variable structural components are traditionally measured. Skulskij
& Malkov (1992) measured these line components based on the hypothesis that
the Hα emission line as a whole is of a common nature and that the absorp-
tion component, which cuts through this emission, originates as self-absorption
in this emission line. Under this hypothesis of Skulskij & Malkov (1992), the
radial velocities of the Gaussian center of the total emission as a whole were
also measured. The measurements of the radial velocities of structural compo-
nents of the Hα line showed that all four radial-velocity curves are in one way
or another correlated with the effective magnetic field curve of the donor over
the orbital period (see Figure 5 of Skulskij & Malkov (1992)). Two types of the728 M.Yu. Skulskyy
Vr -curves are identified: 1) those that more clearly correlated with the radial
velocity curves of the components of the binary system, i.e., related in space
to the line of their centers, which passes through the direction of the phases of
(0.5-1.0) P; and 2) those that more clearly correlated with extrema of the effec-
tive magnetic field of the donor, i.e., with the spatial direction of the dipole axis
of its magnetic field of (0.355-0.855) P (see Figure 1). The first type of curve is
the radial velocity curve of the absorption feature, which shows negative radial
velocities at all phases reflecting the gas flows motion. The radial velocity curve
for the Gaussian center of the Hα emission is definitely of the other type: both
its maxima clearly match extrema of the effective magnetic field strength of the
donor. Hence, such an approach to the measurement of Doppler shifts of the
characteristic features of the Hα emission-absorption line as a function of the
orbital phase has revealed two major factors forming its shape and dynamics.
The more important one reflects the Doppler phase shifts of the Hα emission
profile as a whole. It follows that the generation of the radiation flux in the Hα
emission line and the formation of the emission-absorption profile of this line
can be formed under the certain influence of the donor magnetosphere.
These results changed the understanding of the formation of gas structures
and required confirmation. Therefore, in the following year, 1991, the intensive
CCD observations of the Beta Lyrae in the red spectral range were extended.
They included the simultaneous detailed study of general regularities in the
phase variability of the parameters of emission-absorption lines Hα , He I λλ
6678, 7065 and Si II λλ 6347, 6371. The investigation of circumstellar structures
and mass transfer in the presence of the donor magnetic field, which was based
on a study of the dynamical and energy characteristics of these lines, is given
by Skulskij (1993a). Figure 5, which is presented here as Figure 3 from Skulskij
(1993a), shows quite sufficient statistical reliability of the four radial velocity
curves of the components of the Hα emission line, which were obtained with the
incorporation of the data from Skulskij & Malkov (1992). Figure 5 illustrates
also the phase coordination of these radial velocity curves with the curve of the
effective magnetic field of the donor (see Fig.1) that needs careful consideration.
First of all, in Fig. 5, the measurements of the Doppler shifts of the Hα
profile components are presented separately for 1985-89 and 1990-91. In the
later period, clear differences in the radial velocity curves of the blueshifted
(or violet) peak are revealed, indicating certain long-term changes in the gas
emitting structures directed mainly to the observer. These changes are observed
in phases (0.0-0.15) P, but especially in phases from 0.50 P to 0.75 P of the second
quadrature (see Fig. 5, bottom). The shape of this curve is clearly changed
in 1990-91 at a virtually invariable shape of the radial velocity curve of the
absorption component that points out the independence of the moving plasma
radiated in the violet emission peak. Indeed, the minimum value of negative
radial velocity fell from -100 km/s to -50 km/s diminishing accordingly the
distance in radial velocities between the violet and red emission peaks, and the
width of the Hα emission as a whole. Moreover, the violet emission peak shiftedFormation of magnetized spatial structures in the Beta Lyrae system 729 Figure 5. Radial-velocity curves of structural components of the Hα emission profile based on CCD observations in 1990-91 (dots) and 1985-89 (circles) for: a) the redshifted peak; b) the center of the Gaussian profile Hα emission (the solid curve is the Vr curve for the gainer); c) the absorption feature cutting through the emission; d) the blueshifted peak (the mean error ≈ 2σ of an individual measurement is shown by a vertical bar). The dashed curves were drawn by hand. The zero points on the vertical axis coincide with the zero velocity of the binary system’s center of mass. Two extrema of the curve of the effective magnetic field strength are marked by arrows and vertical lines at the phases 0.355 P and 0.855 P. (Skulskij, 1993a)
730                                                                  M.Yu. Skulskyy

to the phases of (0.55-0.60) P, reflecting a certain direction perpendicular to the
direction of the axis of the donor magnetic field of (0.35-0.85) P. It is important
that during all the years at the 0.85 P phase, which corresponds to the phases
of the maximum magnitude of the donor magnetic field and the visibility of the
magnetic field (see also Fig. 1), this violet peak shows the maximum value of the
negative radial velocity of -200 km/s. It could be interpreted as the additional
matter outflow from the region of the magnetic field pole of the donor surface,
facing the gainer, along the direction of the magnetic field axis of (0.35-0.85) P.
    A clear correlation is observed between the radial velocity curves of the star-
components of the binary system and the radial velocity curve of the absorption
on Hα emission profile. This almost symmetric Vr -curve with the shape of a
dome around the 0.55 P phase shows here the minimum radial velocity of -15
km/s of matter in the direction from the binary system. This is close to the
thermal velocity from the surface of the bright donor that reaches to its Roche
cavity. At the phases of both quadratures, the radial velocity of the outflowing
matter reaches -80 km/s. The radial velocity curve becomes slightly asymmetric
at the 0.85 P phase of the magnetic field maximum and shows the maximum of
negative velocities near -115 km/s (close to the parabolic velocity of the moving
gas) at the 0.05 P phase when the stellar wind is converted into the fast flow up
to the backside of the accretion disk. Both lower Vr -curves in Fig. 5 reflect also
the spatial structure of the binary system: they are almost symmetrical about
the line of centers of its components, which passes through the phases of 0.5 P
and 1.0 P. However, the two extrema of these curves reproduce the direction of
the phases close to (0.6-1.1) P, i.e., the spatial line that is turned on a quarter
of the orbital period relative to the dipole axis of the donor magnetic field. This
factor should also be taken into account in the study of moving magnetized
accretional structures.
    The radial velocity curves for the Gaussian center of Hα emission for 1985-
89 and 1990-91 are definitely of the other type: both maxima of this sine curve
clearly correspond to two maxima of the curve of the effective magnetic field
strength of the donor (see also Fig. 1), indicating that these two curves are
physically related. The radial velocity curve of the Hα emission center is clearly
shifted by 0.1 P from the radial velocity curve of the gainer (see Fig. 5). The
radial velocity curve for the more intense red emission peak has also maxima
at those phases. It should be noted that the low local maximum in the Vr -
curve of this red peak at the 0.85 P phase becomes dominant if one constructs
the dependence ∆Vr = f (P ), where ∆Vr is the difference between the radial
velocities of the long-wavelength peak and the center of Hα emission (see Skulskij
& Malkov (1992)). Both upper Vr -curves in Fig. 5 reflect the phase variability
of the donor magnetic field, whose dipole axis is directed along the line of the
(0.355-0.855) P phases, i. e., the general emission as a whole and the red peak
as components of the Hα emission-absorption line are essentially formed in the
agreement with the spatial configuration of the donor magnetic field.
    The foregoing should be considered in conjunction with the careful work of
Formation of magnetized spatial structures in the Beta Lyrae system 731
Sahade et al. (1959). The Beta Lyrae spectrum in λλ 3680-4580 was studied on
the basis of spectrograms obtained on the Mount Wilson 100-inch reflector. The
radial velocities of red emission peaks have been measured in lines of He I λλ
3888, 4472 and Hγ line. They are plotted in Figures 18, 19 and 20 of Sahade
et al. (1959). These radial velocity curves are in good agreement with the radial
velocity curve of the red peak in the Hα line that is shown in Fig. 5. This is
especially true of the two maxima in the radial velocity curve of the strong red
peak in the He I λ 3888 line. They clearly correspond to the phases of the two
extrema on the curve of the effective magnetic field strength of the donor and
phases of the visibility centers of two magnetic poles on the donor surface. Such
coincidence factors are logical. Their interconnection seems indisputable.
Similar conclusions can be drawn from the consideration of Fig. 6, repro-
duced from Figure 4 in Skulskij (1993a), as to analogous components in the
emission-absorption lines of He I λλ 6678, 7065 and Si II λλ 6347, 6371 (mainly
based on CCD observations in 1991). Indeed, these Vr -curves have extremal val-
ues near certain phases of the orbital period: 0.0 P and 0.5 P, as well as 0.35 P
and 0.85 P, i. e., are related to the geometry of the eclipsing binary system and
the dipole structure of the donor magnetic field. The orbitally modulated Vr -
curves of these absorption features have practically sinusoidal symmetry with
regard to the axis of the gravity centers of both components. Only such Vr -
curve for the He I λ 7065 line is shifted somewhat to the left, to the 0.35 P
phase, which coincides with the phase of the observation of the donor mag-
netic pole. Reaching a positive radial velocity of more than +15 km/s here, this
Vr -curve remains positive within (0.3-0.6) P. This new fact indicates that the
outflows of the radiating plasma with the thermal velocity from the donor sur-
face along the donor axis from the observer is observed here, i.e., beginning in
the direction of the 0.85 P phase of the second magnetic pole and with the next
deviation to the gainer. Such matter outflows showed also in the triplet helium
line and are probably raised above a denser stream of mainly hydrogen plasma,
but reflected primarily in the absorption feature of the Hα line. The influence of
the magnetic field at the 0.85 P phase is clearly visible both on the shape of all
absorption Vr -curves in Fig. 6 and in the absorption feature of the Hα emission
line in Fig. 5.
Comparing Fig. 5 and 6, one should note good agreement between the av-
erage Vr -curves for the emission centers of the Hα line and lines He I λλ 6678,
7065 and Si II λλ 6347, 6371. The He I λ 6678 line exhibits the greatest uncer-
tainty when measuring radial velocities due to the substantial asymmetry of the
emission profile. However, the radial velocities of the powerful He I λ 7065 line,
whose double-peaked emission, like that of Hα line, is observed considerably
above the continuum over the orbital period, are measured reliably. Together
with the radial velocities of the emission centers of the red silicon doublet lines
(their values were taken from Skulskij (1992)) they mimic well the average Vr -
curve of the center of Hα emission as a whole. Thus, two sinusoidal extrema of
these dependences Vr = f (P ) coincide (see Fig. 5b and Fig. 6a) with the phases732 M.Yu. Skulskyy
of passing through the meridian of both poles of the magnetic field on the donor
surface (see also Figure 1 in Skulskyy (2020)). In general, it reasonably suggests
that the emission and absorption components of these studied lines are produced
with almost the same dynamics in gaseous structures between components of
this binary system, correlating clearly in orbital phases with the variability of
the donor magnetic field.
In view of the above, it is worth noting the thorough work of Harmanec
et al. (1996), which, in particular, presents the results of the processing of the
electronic spectra obtained in 1992 and 1994 on the reflectors of Ondrejov and
Dominion Astrophysical Observatories in the red spectral range 6100-6700Å. Us-
ing also the data of our publications (Skulskij, 1972, 1993a; Skulskij & Malkov,
1992), they presented statistically better radial velocity curves of the Hα emis-
sion line for all four of its components (see Figures 8 and 9 in Harmanec et al.
(1996)). Their behavior of Vr = f (P ) or “RV curves”, as expected, are in full
agreement with the corresponding radial velocity curves in Fig. 5 and 6 of this
paper. Their “RV curves of the Hα and He I λ 6678 absorption cores versus or-
bital phase” show also the minimum -15 km/s and maximum -113 km/s of the
negative velocities near the 0.55 P and 0.05 P phases, respectively. The extrema
of their RV curves for both emission peaks of the Hα line clearly correspond
to the phases of the observation of the poles of the donor magnetic field or the
direction (0.355-0.855) P. Incidentally, the same maximum negative velocity of
-200 km/s was shown for the violet emission peak (or “V-peak”) in the 0.855 P
phase. These investigators indicate that “the Hα emission as whole moves al-
most in anti-phase” to the donor, such that for the radial velocity curve of this
emission “the RV minimum is 0.853 P (instead of 0.75 P for the donor)”. This
coincides with the maximum of the donor magnetic field at the 0.855 P phase
(see Fig. 1), as it follows from the solution of the magnetic field variability curve
by Burnashev & Skulskij (1991). And this corresponds to the phase meridian of
the passage of the magnetic field pole on the donor surface. It should be noted
that in interpreting the Beta Lyrae system Harmanec et al. (1996) do not use
such a clear match in these results and the studies of the donor magnetic field
as a whole. They concluded: “the bulk of the Hα and He I λ 6678 emission seems
to originate in jets of material perpendicular to the orbital plane of the binary”.
Here these jets are associated mainly with the gainer and also “probably em-
anate from the hot spot in the disk, i.e. the region of the interaction of the
gas stream flowing from the Roche-lobe filling” of the donor. On the contrary,
Ignace et al. (2018) are hopeful that the magnetic field “could prove relevant”.
Based on the study and simulating of Hα line profile variations in the Beta
Lyrae spectrum, they have shown that “a circumbinary envelope, a hot spot on
the accretion disk, or accretion stream” non-satisfactory explain the observation
data. They even presume: “evaluating the detailed radiative transfer for a model
involving both a disk and a jet is unlikely to help”.
An important conclusion that the emission as a whole is produced mainly
in structures that are affected by the magnetic field, that is, they are largelyFormation of magnetized spatial structures in the Beta Lyrae system 733 Figure 6. Radial-velocity curves of a) the center of the Gaussian emission profile in the Si II λλ 6347, 6371 doublet lines (dots), the He I λ 6678 line (circles), and the He I λ 7065 line (×), supplemented by the 1992 observations (crosses); c) absorption features in the same helium lines (1992 observations in the He I λ 7065 line are represented by crosses and the He I λ 5875 line are represented by dots); the solid curve here corresponds to the Vr -curve of the absorption feature in the Hα line from Fig. 5; b) the IV /IR = f (P ) curve for emission in the He I λ 7065 line, supplemented by the 1992 observations (crosses). Two extrema of the curve of the effective magnetic field are indicated (at the top) by arrows at the phases 0.355 P and 0.855 P. (Skulskij, 1993a). generated near the donor surface, was given by Skulskij (1993b,c). This was also based on variations of Vr -curves of the emission center Si II λλ 6347, 6371 lines in 1990-92. There are two irrefutable facts to such conclusion: a shift near 0.1 P in the phase of the Vr -curve of this emission as a whole, and a shift of about +10 km/s of the center of the radial velocity of this Vr -curve relative to the
734                                                                  M.Yu. Skulskyy

radial velocity of the mass center of the binary system. These factors should be
considered based on Fig. 5 and 6. First, a clear difference of 10 km/s between
the radial velocity of the mass center of the binary system and the velocity of the
emission center of all Vr -curves implies a constant outflow of matter from the
binary system. Then it is necessary to associate this outflow of matter not with
the gainer but with the bright donor, which is “constantly expanding” toward
its inner Roche cavity. The matter drains essentially and along the magnetic
field lines from the donor surface near the magnetic pole facing the gainer, i.e.,
near the 0.85 P phase (see Figure 1 of Skulskyy (2020)). The maximum negative
shift of radial velocities of -45 km/s in the Vr -curves of the emission centers of
all the investigated lines is detected at just those phases (i. e., the motion from
the surface of the donor toward the observer). The maximum positive shift of
these radial velocities of +45 km/s is recorded in the vicinity of the opposite
magnetic field pole around the 0.35 P phases, i.e., the emitting gas moves from
the observer (probably along the magnetic field lines), but in the same direction
as its the motion registered around the 0.85 P phases. That confirms that gas
outflows are produced mainly on the donor surface near the donor’s magnetic
pole, which is close to the massive gainer and observes near the 0.85 P phase.
At the same time, the Vr -curves of the emission centers of all the investigated
lines are shifted in phase by 0.1 P relative to the Vr -curve of the gainer, and
the sinusoidal maxima of these Vr -curves coincide with such maxima on the
curve of the donor magnetic field (see also Fig. 1). This is strong evidence of
the physical relationship between the regions of spatial formation of the total
emission and the structure of the donor magnetic field. One can also consider as
reasonable the picture, in which the magnetized plasma, moving from the donor
surface mainly in the 0.85 P phases and deflecting afterward to the gainer, forms
a system of gas flows directed toward the accretion disk (this is also seen from
the radial velocity curve of the absorption component of the Hα emission line).
    Hence, it should be stressed that the variability of the complex profiles of
the emission-absorption lines over the orbital period, in terms of their dynamic
characteristics, is essentially synchronous with such variability of the magnetic
field of the donor. The reflection of accretion flows in the spectrum of this
interacting binary system during the mass transfer from the donor to the gainer
is largely determined by the existing spatial structure of the magnetic field of
the donor.

2.4. Magnetic field and investigation of energy characteristics of spec-
     tral lines formed near and in the atmosphere of the donor
From the above it follows that the donor magnetic field significantly influences
the overall picture of the localization and formation of developed gaseous struc-
tures. A more active region of the outflow of matter from the donor surface is
the region of the magnetic pole facing the gainer. A mass-losing donor with the
decentered magnetic dipole has a deformed surface, reaching its Roche cavity.
Formation of magnetized spatial structures in the Beta Lyrae system 735
This stimulated a parallel study of the phase variability in the energy character-
istics of different lines, which are formed in both the conditions of this peculiar
atmosphere and the neighborhood of the donor surface. This applies, above all,
to spectral observations made in the red spectral region in 1985-1992 using a
CCD detector on the 2.6-m CrAO telescope and, in particular, a comprehensive
study of all components of the complex structure of the Si II λλ 6347, 6371 lines
(Skulskij, 1993b). The phase variability of the equivalent width Wλ = f (P ) and
Il /Ic = f (P ), i.e., the emission intensity ratio in the line to the continuum,
in the emission component of Si II λλ 6347, 6371 lines shows that there is a
well-defined modulation of these Si II emission curves by the donors magnetic
field.
The phase dependence of the intensity ratio of the violet to red emission
peaks Iv /Ir = f (P ) in the He I λ 7065 line (see Fig. 6) was also investigated by
Skulskij (1993a). The emission of the He I λ 7065 line is interesting because its
emission peaks are comparable in intensity, and this is the only line where its
violet peak even slightly exceeds the red peak over a considerable phase range
close to the 0.35 P phase, that is in the range of phase visibility of the donor’s
magnetic field pole. The minimum ratio of their intensity (i.e., when the red
peak dominates) coincides with phases of visibility of the opposite pole of the
donor facing the gainer, i.e., of 0.85 P. Thus, the dependence of Iv /Ir = f (P )
is also clearly modulated by the spatial structure of the donor’s magnetic field.
It also means that the emission in both the strong He I λ 7065 line and Si II
λλ 6347, 6371 lines, with their relatively not high emission, is produced largely
in some medium in the immediate vicinity of the donor. In addition, Skulskij
(1993a) also investigated the phase dependence of the ratio ∆Wλ /Wλ , i.e., of the
equivalent width of the absorption component in a range of the total emission to
the total emission under the Gaussian profile in Hα and He I λ 7065 lines, which
can explain the variability of the self-absorption in this emission. For both lines,
this parameter has maxima in phases that coincide with the phases of the two
magnetic field poles visibility. In this article, phase variations of the equivalent
width of the He I λλ 3867, 4120 absorption lines of the donor’s atmosphere and
the total emission in the He I λ 7065 as lines of one helium triplet were also
studied. Phase cyclic changes in the equivalent width inherent in the He I λλ
3867, 4120 absorption lines of the helium triplet, mainly being synchronized
with such Wλ -curve for the He I λ 7065 emission line, are found, that is, they
have much in common, which is related to the structure of the donor magnetic
field.
The investigation of complex Si II λλ 6347, 6371 lines also revealed the ap-
parent correlation between the phase variability of the equivalent width of Si II-
emissions and such Wλ -curves of absorption lines of this doublet in the donor
atmosphere (Skulskij, 1993b). In addition to the effects of the orbital modulation
and eclipses, there is a well-defined modulation of these curves by the magnetic
field. One also concluded that the formation of emissions in these silicon lines
should be localized in the immediate vicinity of the donor surface. This finding736 M.Yu. Skulskyy
was supported by a new fact: the deep minimum was found on the W -curves of
these Si II emissions in a narrow phase range of 0.02 P duration before the main
eclipse of the donor at the phase of 0.96 P in 1991 and 0.93 P in 1992 (Skulskij,
1993b,c). At these phases, the satellite disk, as the outer part of the accretion
disk, is projected onto the magnetic pole region on the donor surface facing the
gainer, significantly eclipsing the source of the emission in the red Si II doublet
(see Figure 1 in Skulskyy (2020)). This can also be interpreted as an eclipse of
the hot region of the donor surface or near this surface, i. e., in the direction of
the donor magnetic field pole close to the gainer.
The unusual behavior of the equivalent widths of both absorption lines in
the red Si II doublet of the donor’s atmosphere led to a detailed study of the
phase variations of more than 100 absorption lines of this atmosphere in the
blue spectral range, published by Skulskij & Vovchik (1971) in the ten main
phases of the orbital period. As it turned out, the equivalent widths of the lines
of the magnetized and simultaneously outflowing atmosphere of the donor ex-
hibit a special kind of cyclic variations over the orbital period (Skulskij, 1993b).
The Wλ -curves of these lines are modulated to varying degrees both by gravi-
tational and magnetic fields. Dozens of the Wλ -curves look like the result of the
superposition of harmonic oscillations with different amplitudes and frequencies
that are multiples of the orbital frequency. We tried to classify the Wλ -curves in
terms of their external form, taking into account the patterns of splitting in the
magnetic field and the value of the Lande factors, the total angular momentum
of the atoms and the relative intensity of lines in their multiplets, the degree
of excitation and ionization. No definite regularities have been discerned, but
virtually all absorption lines can be grouped into three types. The first type
includes the lines whose Wλ -curves are more definitely subject to orbital mod-
ulation. These are more excited or resonance lines, e. g., more intense lines of
dominant FeII and TiII multiplets, for which the maxima of their equivalent
widths occur, as a rule, at phases around 0.0 P and 0.5 P, i.e., related in space
to the line on star-components. It may seem that this group of lines originates
in the upper layers of the donor atmosphere, which is extended to its Roche
cavity and has a somewhat elongated surface, especially in the gainer direction.
The equivalent widths of the second group lines are more clearly correlated with
the phase variability of the donor magnetic field, i.e., with the direction of the
dipole axis of its magnetic field passing through the 0.35 P and 0.85 P phases.
This group includes, as a rule, not very strong absorption lines and lines of
a higher degree of excitation and ionization, i.e., lines originating in the rela-
tively deeper layers of the atmosphere. The third, intermediate, group of lines
demonstrates the variations in their equivalent widths as a reflection of possible
simultaneous actions of the gravitational and magnetic fields.
It is most likely that the demonstrated diagrams of phase variations of the
equivalent width and intensity of the different lines of visual spectrum reflect
real changes in the physical conditions, both with the depth of the donor at-
mosphere and above the atmosphere level. However, this occurs both under theFormation of magnetized spatial structures in the Beta Lyrae system 737
conditions of the specific spacial structure of the donor magnetic field and its
deformed surface close to its Roche cavity. This can be seen, for example, from
gradual changes in the profiles of lines of the Balmer series. The first members
of the series, as shown in the previous sections, are formed above the surface
of the donor and further in the moving gaseous structures. They exhibit strong
emission components that gradually decrease in intensity and fall under the
continuous spectrum close to H7. The high terms of the Balmer series, which
are undistorted by emission, according to Figure 6 in Skulskij (1993b), show the
notable systematic change of the Wλ -curves from line to line over the orbital
period from H9 to H21. In particular, in Wλ -curves of lines H11 - H16 there
are here definite narrow local maxima. At the same time, equivalent widths of
lines H17 - H20 show here very deep local minima; moreover, during the orbital
turning of the donor from the 0.5 P phase to the phase of 0.85 P, the equivalent
widths of lines H17 - H19 decreased to one-third of their initial widths. All this
going out that the behavior of the spectral lines of the Balmer series, from its
high terms up to the Hα line, reflects a certain change in physical conditions in
the donor atmosphere and above its surface. These data also indicate the most
pronounced stratification of these conditions in the phase range (0.85 ± 0.15) P
at the passing of the observer above the donor surface magnetic pole. It could
be indicated that similar phase diagrams of variations of the equivalent widths
for these hydrogen lines are shown in Bahyl (1986), where there also were noted
coordinated phase variations of the equivalent widths for some spectral lines of
metals and neutral helium in the donor’s atmosphere with phase variations of
the donor magnetic field. Hence, this can be seen as a confirmation of our un-
derstanding and interpreting mass transfer processes in the Beta Lyrae system
based on the concept of the formation of magnetized accretion structures at the
presence of a certain spatial configuration of the donor magnetic field.
2.5. Magnetic field and the identification of the donor magnetic pole
facing the gainer
In view of the above, the next important task was, on the basis of different
observations, to attempt to directly identify on the donor surface the range
phase visibility of the magnetic pole facing the gainer.
It should draw attention in this regard the accurate infrared photometry of
the Beta Lyrae system in 5 bands from J (1.2 µm), H (1.6 µm), K (2.2 µm) to
L (3.5 µm) and M (4.6 µm) that was carried out by Zeilik et al. (1982) in 1977-
1982 on the 1.3-m telescope at the Kitt Peak National Observatory. In these
observational data, several points that need more attention are apparent. The
general shape of these light curves is similar to the visual light curves. The data,
collected in Figures 1-5 pursuant to the J, H, K, L, and M filters as for obser-
vations in different years (they are demonstrated as magnitude differences of (β
Lyr - α Lyr) at statistical errors per point that are typically less than the symbol
size), have a good convergence. As expected (according to the previous article ofYou can also read