SNOWFALL-ALBEDO FEEDBACKS COULD HAVE LED TO DEGLACIATION OF SNOWBALL EARTH STARTING FROM MID-LATITUDES - MPG.PURE
←
→
Page content transcription
If your browser does not render page correctly, please read the page content below
ARTICLE
                  https://doi.org/10.1038/s43247-021-00160-4                OPEN

                  Snowfall-albedo feedbacks could have led to
                  deglaciation of snowball Earth starting from
                  mid-latitudes
                  Philipp de Vrese         1 ✉,   Tobias Stacke        2,   Jeremy Caves Rugenstein              3,   Jason Goodman4 & Victor Brovkin                1,5

                  Simple and complex climate models suggest a hard snowball – a completely ice-covered
                  planet – is one of the steady-states of Earth’s climate. However, a seemingly insurmountable
                  challenge to the hard-snowball hypothesis lies in the difficulty in explaining how the planet
1234567890():,;

                  could have exited the glaciated state within a realistic range of atmospheric carbon dioxide
                  concentrations. Here, we use simulations with the Earth system model MPI-ESM to
                  demonstrate that terminal deglaciation could have been triggered by high dust deposition
                  fluxes. In these simulations, deglaciation is not initiated in the tropics, where a strong
                  hydrological cycle constantly regenerates fresh snow at the surface, which limits the dust
                  accumulation and snow aging, resulting in a high surface albedo. Instead, comparatively low
                  precipitation rates in the mid-latitudes in combination with high maximum temperatures
                  facilitate lower albedos and snow dynamics that – for extreme dust fluxes – trigger degla-
                  ciation even at present-day carbon dioxide levels.

                  1 Max Planck Institute for Meteorology, The Land in the Earth System, Hamburg, Germany. 2 Helmholtz-Zentrum Geesthacht, Institute of Coastal Research,

                  Geesthacht, Germany. 3 Colorado State University, Department of Geosciences, Fort Collins, CO, USA. 4 Wheaton College, Department of Physics and
                  Astronomy, Norton, MA, USA. 5 University of Hamburg, Center for Earth System Research and Sustainability, Hamburg, Germany. ✉email: philipp.de-
                  vrese@mpimet.mpg.de

                  COMMUNICATIONS EARTH & ENVIRONMENT | (2021)2:91 | https://doi.org/10.1038/s43247-021-00160-4 | www.nature.com/commsenv                              1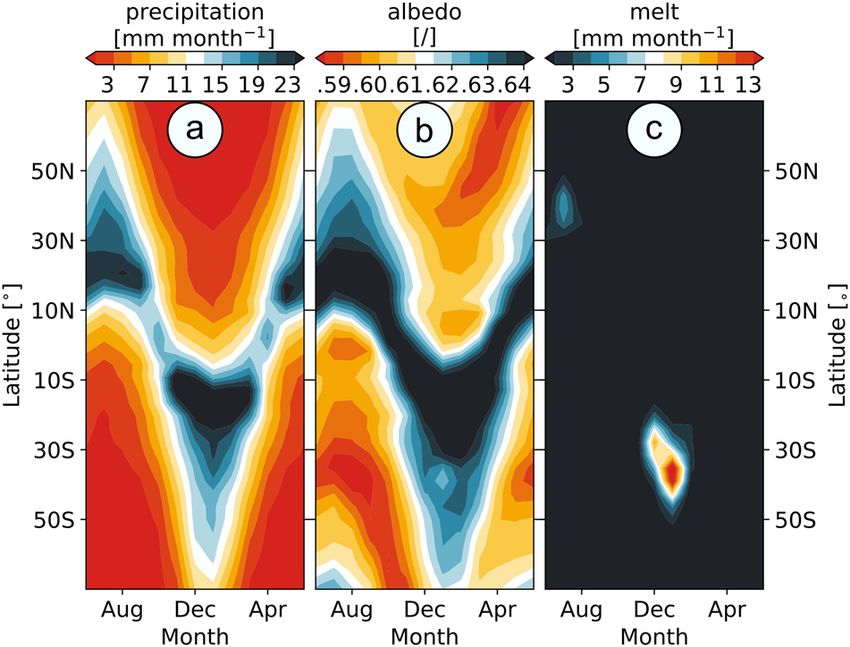
ARTICLE                                                 COMMUNICATIONS EARTH & ENVIRONMENT | https://doi.org/10.1038/s43247-021-00160-4

W
             hether our planet has ever been completely ice-                    albedo on an ice-covered planet (“Snowball albedo”), before using
             covered has long fascinated geologists and climate                 the MPI-ESM with interactive surface albedos--based on an
             modelers. Geological evidence suggests that Earth’s                adapted snow-albedo-scheme—to investigate if these mechanisms
past featured ice ages, during which the polar ice caps grew                    could have sustained sufficiently low albedos to deglaciate an HSB
beyond the ice-albedo-instability threshold, triggering a runaway               (“Thawing the snowball”). The key modifications to the MPI-
feedback that resulted in global glaciation—a state termed                      ESM’s snow-albedo-scheme enable the representation of a sus-
“snowball Earth”1,2. Two extraordinary glacial periods are                      tained dust accumulation due to variable deposition fluxes and
thought to have occurred during the Neoproterozoic Era1–8, but it               separate the snowpack into a main layer and a top layer, each
remains a matter of debate whether these would have featured a                  possessing its own thickness, cover fraction, age, and albedo
complete ice cover, a so called “hard” snowball (HSB), or whether               (“Methods—Snow-albedo-scheme”). This allows a more accurate
parts of the oceans remained ice free—a state often referred to as              representation of the surface albedo of an HSB, where the
a “waterbelt”9–12. On one hand, certain factors—such as the                     reflectivity would have partly been determined by a thin layer of
survival of photoautotrophic organisms or large-scale basin-filling              comparatively fresh snow, which partially covers a thicker layer of
sedimentary patterns—are harder to explain in the context of a                  perennial snow, and whose optical properties and extent can vary
complete glaciation2. On the other hand, energy balance models,                 substantially on short timescales. Our simulations with this
as well as intermediate- and full-complexity climate models agree               adapted model confirm previous studies, showing that a sustained
that an HSB is indeed one of Earth’s equilibrium states13–17,                   dust accumulation at the surface could indeed have allowed to
whereas it is vastly more difficult to maintain an extreme icehouse              escape the snowball state30–33. However, in contrast to previous
state that retains open ocean surfaces17–22.                                    findings our results indicate that deglaciation would not have
   Possibly the largest obstacle for the HSB hypothesis lies in the             been triggered in the tropics, where a strong hydrological cycle
difficulty in explaining how Earth could have left the snowball                  constantly regenerates fresh bright snow at the surface, but in the
state once it had been established. Deglaciation is thought to have             midlatitudes, where snowfall rates are notably lower.
eventually occurred as the ice cover prevented silicate weathering
and photosynthesis, causing volcanic emissions to raise the
atmospheric CO2 concentration (pCO2) to a level that allowed the                Results and discussion
planet to leave the icehouse state1. However, it has been extremely             Dependency of ablation rates on albedo and CO2. Plausible
difficult to simulate the onset of deglaciation under plausible                  albedos on an HSB range between roughly 0.9, the albedo of fresh
conditions. This can partly be attributed to the specific char-                  snow and precipitated salt, and 0.45, the albedo of sea ice34–37. In
acteristics of the atmosphere of snowball Earth, such as the nearly             agreement with previous studies17,21,27,38, our simulations with
isothermal structure during winter and a low water vapor content                prescribed surface albedos show that ablation rates, and hence the
that leads to a comparatively weak greenhouse effect23–28. But the              CO2-threshold for deglaciation, are very sensitive to this surface
most fundamental challenge for initiating the deglaciation of an                property, especially for higher values that are representative of
ice-covered planet is posed by its surface albedo. The high                     extensive snow covers (Fig. 1). For albedos > 0.65, a tenfold
reflectivity of ice and snow, which would have enabled snowball                  increase in pCO2 hardly increases the maximum ablation rates,
Earth in the first place, may have also prevented its surface from               while an albedo reduction of 1000 mm year−1. This is
CO2”). Then, we briefly discuss the processes that modulate the                  sufficient to degrade even a thick ice cover within a matter of

Fig. 1 Dependency of maximum ablation rates on surface albedo and atmospheric CO2 concentrations. Simulated annual mean net ablation rates, that is
the sum of sublimation and melt minus precipitation, as a function of atmospheric CO2 concentration (pCO2) and surface albedo (α). Rates show the
average over the 18.75°-wide latitudinal band (~2000 km), in which maximum ablation rates were simulated. Values are interpolated between 10 simulations
with the MPI-ESM1.2 (ref. 29), in which the reflectively of the surface was prescribed (“Methods—Model configuration, Simulations” and Supplementary
Fig. 1). Red circles mark combinations of α and pCO2 that resulted in simulated surface temperatures reaching the melting point, which is often considered
the onset of deglaciation23. The dashed line shows a simple fit for albedo values that resulted in melt: αmelt  0:0059  lnðpCO2 Þ1:65 þ 0:57. Open circles to
the far right show albedo values for which no deglaciation was simulated for CO2 concentrations ≤ 400 mbar.

2             COMMUNICATIONS EARTH & ENVIRONMENT | (2021)2:91 | https://doi.org/10.1038/s43247-021-00160-4 | www.nature.com/commsenv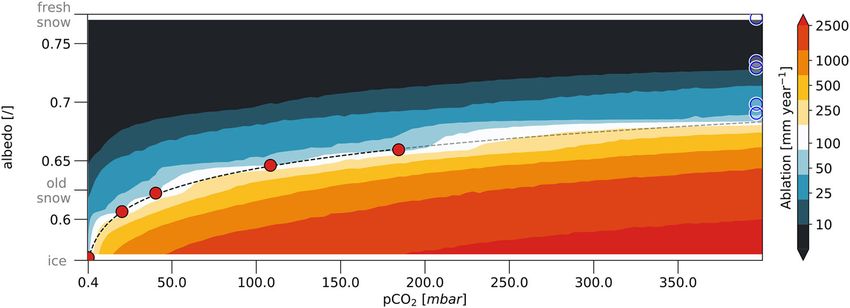
COMMUNICATIONS EARTH & ENVIRONMENT | https://doi.org/10.1038/s43247-021-00160-4                                                         ARTICLE

millennia, given that meltwater escapes the surface via (hydro-)
fractures, moulins and supraglacial stream networks39–43. Trigger-
ing deglaciation within the geologically feasible pCO2 range (⪅100
mbar2,44) requires surface albedos of

ARTICLE COMMUNICATIONS EARTH & ENVIRONMENT | https://doi.org/10.1038/s43247-021-00160-4
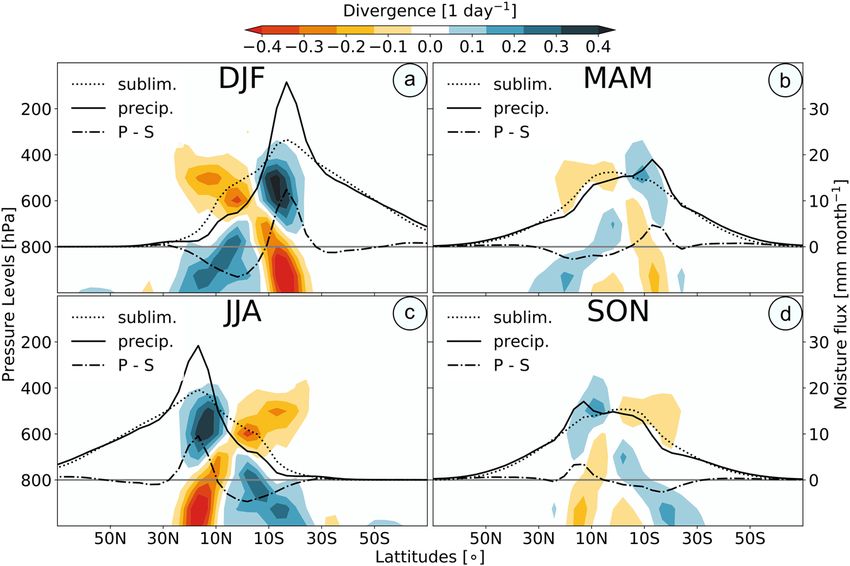
Fig. 3 Atmospheric dynamics on an HSB approaching deglaciation. a Zonal mean divergence, precipitation (thick solid line), sublimation (dotted line),
and precipitation–sublimation rates (dashdotted line) averaged over the the period December—February, simulated with a prescribed surface albedo of
0.66 and atmospheric CO2 concentrations of 100 mbar. b Same as a but for March–May. c Same as a but for June–August. d Same as a but for
September–November. When simulated with ECHAM6, the atmospheric dynamics of an HSB are comparable to those simulated with other GCMs28,
hence the resulting precipitation minus sublimation (P − S) patterns are also very similar. The center of the tropics, roughly between 10.0° N–10.0° S,
constitutes a predominantly descending region and the sublimation fluxes are larger than the precipitation rates, while they are much smaller than the
precipitation rates in the ascending regions between 10.0° N–20.0° N and 10.0° S–20.0° S. This results in the typical P − S pattern with the tropical
ablation zone located between 10.0° N–10.0° S and the main accumulation regions located between 10.0° N–20.0° N and 10.0° S and 20.0° S.
high (Supplementary Fig. 2). Consequently, the intensification of
the hydrological cycle does not lower the snow cover fraction—
which remains steady at ~85–90% (Fig. 5c)—but increases the
renewal rate of the snow at the top of the snowpack. This limits
the aging process because it constrains snow grain growth and
reduces the amount of dust that accumulates at the snowpack’s
surface. As a result of the increasingly short residence time of
snow on the ground in combination with the large snow cover
fraction, tropical surface albedos remain too high to initiate
deglaciation and become increasingly independent of the dust
accumulation rate and the properties of the material underlying
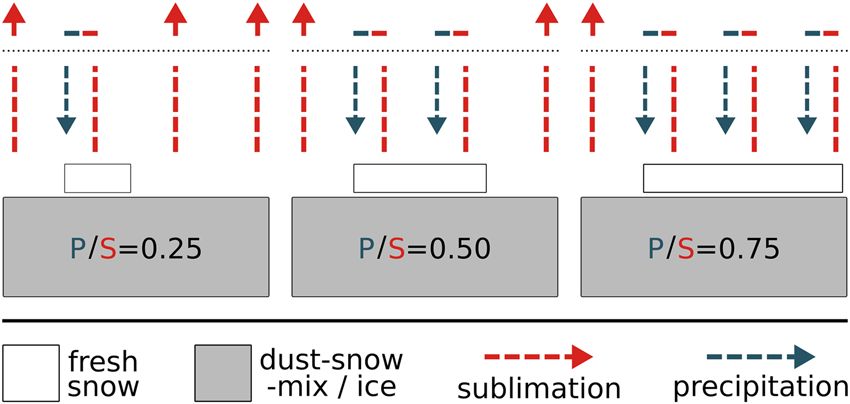
Fig. 4 Regenerative snow layer. Sublimation (S; dashed red lines),
the (fresh) snow layer.
precipitation (P; dashed blue lines) fluxes, and the resulting fresh-snow-
In contrast, the simulated snow dynamics in the extratropics—
layer (white boxes) for three different P/S ratios. On short timescales the
between roughly 30° and 50°—allow for deglaciation well with in
extent of a partial snow cover depends strongly on the orography and the
a feasible pCO2 range (Fig. 5b and Supplementary Fig. 3), and for
near-surface winds. However, on longer timescales the snow cover
extreme dust deposition rates snow and ice melt are simulated
converges to a state, in which the mass loss due to sublimation is balanced
even at present-day pCO2s (Fig. 6c). In the midlatitudes, the
by the gain in mass due to snowfall. On an HSB, snow-covered as well as
average sublimation and precipitation rates are lower than in the
snow-free surfaces sublimate, while all precipitation adds to the snowpack.
tropics, allowing more dust to accumulate on the snowpack. In
Thus, larger areas can exhibit a stable snow cover fraction even if overall
addition, the daily-averaged solar irradiance peaks in the
sublimation exceeds precipitation. As long as temperatures stay below the
midlatitudes—during summer and winter, respectively—and the
melting point, the corresponding equilibrium extent is roughly proportional
annual maximum temperatures are higher than in the tropics.
to the ratio of precipitation and sublimation. Thus, if precipitation is
The latter accelerate the snow aging process and the combination
frequent enough, the surface will not be completely snow free, even in the
of large (near-) surface dust concentrations and high maximum
ablation zones. In these regions, the net mass loss is proportional to
temperatures results in albedos that are notably lower than in the
sublimation from snow-free areas.
tropics (compare Fig. 5a, b). Even the comparatively high peak
snowfall rates at the onset of melting—of up to 20 mm month−1
sustain deglaciation, as (sea) glacier flow from the accumulation —do not regenerate the snow cover fast enough to maintain a
zones would have been fast enough to balance the glacier high enough surface albedo to prevent deglaciation (Fig. 6a, b).
degradation in the main ablation zone28,47. In the tropics, Furthermore, with maximum temperatures close to the melting
deglaciation is inhibited by an extensive, regenerative snow cover point, an increase in surface net radiation does not increase
that prevents the albedo from decreasing to low enough values, sublimation but instead initiates snow and ice melt, with the
even raising it with increasing pCO2s. When more radiation is meltwater draining from the surface without raising snowfall
absorbed at the surface due to rising pCO2s, sublimation and rates. Thus, for high dust deposition fluxes, the midlatitudes lack
precipitation increase similarly and the P/S ratio remains very the snowfall-albedo feedback that dominates the tropics, resulting
4 COMMUNICATIONS EARTH & ENVIRONMENT | (2021)2:91 | https://doi.org/10.1038/s43247-021-00160-4 | www.nature.com/commsenv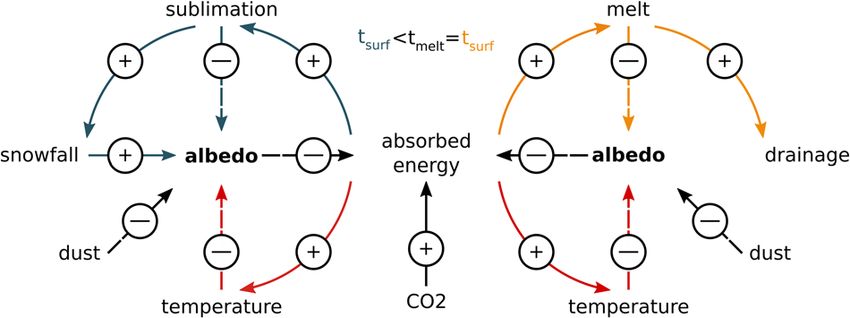
COMMUNICATIONS EARTH & ENVIRONMENT | https://doi.org/10.1038/s43247-021-00160-4                                                         ARTICLE

Fig. 5 Surface dynamics for varying dust deposition rates and CO2 levels. a Simulated annual mean ablation rates in the tropical ablation zone as a
function of pCO2, prescribed dust deposition fluxes and the resulting annual mean albedo. The values are representative for a 18.75°-wide latitudinal band
in the equatorial regions between roughly 10.0° N and 10.0° S. b Same as a, but showing values representative of a latitudinal band in the midlatitudes
roughly between 30° S and 50° S. c Same as a, but showing the simulated annual mean snow cover. d Same as b, but showing the simulated annual mean
snow cover. Symbols indicate the assumed dust deposition rates relative to the present-day global-mean dust flux (GDF): down-pointing triangle = no dust
depositions, left-pointing triangle = 0.03 × GDF, right-pointing triangle = 0.16 × GDF, up-pointing triangle = 0.33 × GDF, circles = 0.66 × GDF, squares =
GDF, hexagons = 1.33 × GDF, and diamonds = 2 × GDF. The simulations were carried out using the MPI-ESM1.2 (ref. 29) with an adapted snow-albedo-
scheme that estimates the albedo based on snow age and surface temperatures, and separates the snowpack into a top layer and a main layer (“Methods
—Model configuration and Simulations”). Note that in subfigures c and d, an annual mean snow cover fraction of
ARTICLE                                             COMMUNICATIONS EARTH & ENVIRONMENT | https://doi.org/10.1038/s43247-021-00160-4

have been consumed by the phase transition of ice and snow. This           deglaciation process. If an HSB existed and its deglaciation was
would require entire regions to have been largely covered by               triggered by the accumulation of a thick tropical dust layer, large
meltwater, which is a similarly extreme assumption as all                  bursts of material would have been flushed into the equatorial
meltwater draining from the surface instantly—and even then,               ocean and the resulting clay layers should be a common feature
the turbulent exchange in the boundary layer and small-scale               beneath the cap carbonates in the tropical ablation zones30.
circulations between the inundated and non-inundated areas                 However, if the dust was constantly redistributed, the (near-)
would have likely maintained the average temperatures close to             surface concentrations would have been lower, more uniform
the melting point. As our model does not explicitly represent the          across the latitudes and would not have lead to distinguishable
effects of melt ponds, we can not assess how the deglaciation              depositions upon deglaciation. Thus, a widespread presence of
would have progressed once it was triggered. From a slow                   clay layers exclusively in the tropical ablation zone would provide
degradation of the midlatitude ice cover at comparatively low              strong evidence against the deglaciation history proposed in the
pCO2s and temperatures to a rapid warming that triggers a                  present study. The observational record is far from conclusive;
degradation of ice sheets across a wide latitudinal range, many            however, most of the known (paleo-) tropical snowball Earth field
deglaciation trajectories are conceivable. An investigation of the         sites do not feature clay deposits at the glacial–postglacial
deglaciation process will require not only an improved snow-               boundary, while carbonate topped clay layers have been observed
                                                                           as far poleward as (roughly) 45° (Supplementary Fig. 4 and
albedo-scheme—as proposed in the present study—but also a
                                                                           Supplementary Table 1). Thus, while the observations can not
scheme for melt ponds, as well as fully coupled sea ice and ice-
                                                                           confirm a deglaciation that started in the midlatitudes, they do
sheet models.
                                                                           not disprove our hypothesis. Further, a spatially variable
   Finally, it should be noted that we assumed melting to start at
                                                                           deglaciation could manifest in a unique sea-level rise fingerprint,
0° C, which may be an overly conservative estimate. When sea ice
                                                                           observable in the succession of sediments that preserve the
sublimates, it is plausible that salt accumulates at the surface,
                                                                           deglaciation. Though few sea-level curves for the deglaciation
lowering the melting point substantially37. Thus, the positive
                                                                           have been published, tropical sites often show an immediate
feedback due to the formation of surface-water bodies, and hence
                                                                           transgression. In contrast, extra-tropical sites appear to record an
deglaciation, could have been triggered at lower CO2 concentra-
                                                                           initial regression, not necessarily unique to but consistent with
tions than estimated in this study. In general, the CO2-threshold
                                                                           deglaciation starting in the midlatitudes and progressing to the
of deglaciation is very sensitive to a number of parameterizations
                                                                           tropics (Supplementary Fig. 5). A number of factors will modify
used in the model and our simulations can only provide order-of-
                                                                           when and where sea-level rises during the deglaciation—
magnitude estimates rather than exact values. Here, we were
                                                                           including the length of the deglaciation and the size of the
conservative in the setup of our simulations, especially with
                                                                           continental ice sheets, among other factors—and the geological
respect to the albedo of snow and ice, as well as the treatment of
                                                                           evidence is far from conclusive. However, additional work
meltwater (“Methods—Model configuration”), to not overesti-
                                                                           constraining the relative timing of transgressive and regressive
mate the potential of HSB deglaciation. Furthermore, the present
                                                                           sequences may be able to test the hypotheses put forward here.
version of the MPI-ESM possesses a comparatively low climate
                                                                              The modeling results presented here suggest that escape from
sensitivity amongst the CMIP6 participants54,55. The high climate
                                                                           an HSB is possible within a reasonable range of atmospheric CO2,
sensitivity of some of the CMIP6-models may be an
                                                                           demonstrating that the theoretical implausibility of an HSB
overestimation56; in contrast, the MPI-ESM is among the best
                                                                           deglaciation is no longer a reason to reject such a possibility in
models in reproducing observed temperature trends57. None-
                                                                           Earth history. These results also hold implications for other solar
theless, it is likely that the pCO2-threshold for deglaciation is—to
                                                                           systems—the outer-edge of the habitable zone, for example, is
a degree—model dependent, and that a higher climate sensitivity
                                                                           characterized by snowball-like states on rocky, water-rich
or lower snow and ice albedos reduce the pCO2s required for
                                                                           planets63. Depending upon the tectonic mode of the planet and
deglaciation, which would make HSB deglaciation even more
                                                                           its volcanic CO2 rates, the potential for a midlatitude deglaciation
plausible.
                                                                           —shown by our result—may expand the outer limit upon which
                                                                           life-bearing planets can be found.
Origin of high dust depositions. What, on a completely ice-
covered planet, could have been the origin of the high dust fluxes
required to trigger deglaciation? Volcanism provides one dust              Methods
                                                                           Model configuration. For our study, we used the land and the atmospheric com-
source that would have been present even on an HSB, and                    ponent of the MPI-ESM1.2 (ref. 29), the latest release of the Max-Planck-Institute for
postglacial mantle decompression could have increased volcanic             Meteorology’s Earth system model. We ran these models in a terra-planet config-
activity substantially58,59. However, this would serve only as a           uration with a global ice cover and in all grid boxes the land model is used to
                                                                           simulate the (near-) surface processes, with the parametrizations corresponding to
feedback subsequent to the initiation of deglaciation. Another             those of glacier points. Thus, the setup does not account for the soil, bedrock, or
dust source could be from terrestrial areas that may have                  ocean underlying the ice cover and the modeled surface consists of a 10-m-column
remained ice free2,60. The climatic conditions in these areas              of ice at the bottom of which a zero-flux condition is assumed. With the model
would likely have produced large eolian erosion rates, resulting in        configuration, we can simulate the complex atmospheric dynamics on a moderate
dust deposition fluxes similar to those of the last glacial max-            spatiotemporal resolution with a reasonable amount of computational resources, as
                                                                           the simulated climate adapts to changes in the forcing comparatively quickly and the
imum, which were likely an order-of-magnitude larger than                  simulations come to an equilibrium within a spin-up period of
COMMUNICATIONS EARTH & ENVIRONMENT | https://doi.org/10.1038/s43247-021-00160-4 ARTICLE
found that the snow-albedo-dynamics, and the respective feedbacks, indeed characteristics. Treating the snow cover as vertically uniform is the most common
determine the behavior of the snowball system and while the ablation rates and approach in large-scale models, including the ones that were used in previous
deglaciation thresholds change slightly with varying parameters, the key findings snowball studies28,32,33,49; however, this is especially problematic for a snowball setup
remain unchanged, namely that the negative snow albedo feedback prohibits the in which large areas on the globe retain a thick, perennial snow cover.
onset of deglaciation in the tropics within the plausible CO2 range, while For the second set of simulations, we adapted the snow-albedo-scheme and
deglaciation could have occurred in the extratropics, provided that dust fluxes were separated the snowpack into a main layer and a top layer, each possessing its own
high enough. Furthermore, it should be noted that the atmospheric component thickness, cover fraction, age, and albedo. Falling snow is added to the top layer,
shares certain shortcomings with other models which affect the performance at increasing the layer’s thickness, cover fraction, which is a function of the snow depth,
extreme atmospheric CO2 concentrations24. For example, the radiation scheme and albedo while reducing the layer’s age. The main layer’s characteristics, however,
does not account for the effects of pressure broadening on the opacity of the are not affected by new snow. In our scheme, we assume that the top layer forms
atmospheric greenhouse gases. However, within the geologically feasible CO2 above the main layer and that the top layer’s cover fraction is necessarily smaller than
range, these effects would still have been comparatively small and even for the that of the main layer. This allows us to calculate the two layer’s contributions to melt,
maximum CO2 concentrations investigated in this study (400 mbar) neglecting sublimation and surface (mean) albedo simply by the fraction of the layer that is
them is still tolerable. In addition, for a spatially well mixed atmosphere, the exposed to the atmosphere relative to the snow-covered fraction. Whenever the top
respective effects would be similar for the tropics and the extratropics, hence they layer covers >95% of the main layer, the snow contained in the top layer is added to
wouldn’t change the main finding—that the onset of deglaciation would have the main layer, increasing the latter’s albedo, depth and cover fraction (if not already
occurred in the midlatitudes before it started in the tropics. at 100%), while decreasing its age. After the top layer has been added to the main layer
Our investigations did not require a great number of changes to the models’ or has disappeared as a result of ablation, a new top layer, which is initiated with the
code and we ran them largely with the same parametrizations that are being used albedo corresponding to that of fresh snow and a zero age, forms whenever there is
for the sixth phase of the Coupled Model Intercomparison Project54. One fresh snowfall. The result is a thick darker main layer whose extent is relatively stable
important exception pertains to the land component’s snow-albedo-scheme, which and whose albedo continuously decreases (to the point when the snow contained in
we adapted to the specific requirements of a snowball Earth, and which we will the top layer is added or the minimum albedo is reached), on top of which a thin,
describe in the following. brighter top layer is located, whose extent and albedo quickly varies depending on
snowfall, melt, and sublimation rates.
Dust deposition rates are one of the key factors determining the snow albedo,
Snow-albedo-scheme. JSBACH, the land component of the MPI-ESM, employs
but our model setup does not allow us to explicitly account for the factors that
two schemes to calculate the reflectivity of snow and the model’s radiation scheme
determine the respective fluxes. Dust particles are not a standard tracer in the
receives a weighted average of the resulting two albedos (usually an equal weight is
atmospheric component of the model, but most importantly explicitly modeling
applied)64. The first scheme is purely temperature based and in the range between
dust sources on an ice-covered planet, such as volcanic eruptions, potentially
−5 and 0 °C, the snow albedo decreases linearly between its maximum value—
exposed terrestrial areas or a tropical surface dust layer, goes beyond the scope of
representing cold, dust-free snow—and its minimum value—representing snow
containing dust at the melting point. Here, the snow albedos in the near-infrared this study and the abilities of our model. Consequently, we prescribe globally
uniform dust deposition rates (as is the current standard in the MPI-ESM) and use
αnir and in the visible range αvis are calculated as follows.
them as an input variables similar to the atmospheric CO2 concentrations. More
T precisely we prescribe τD in Eq. (10)—e.g., 0.3 for present-day dust fluxes and 0.6
αnir ¼ αnir;min þ ðαnir;max αnir;min Þ for 5 < T½ C < 0; with ð1Þ
5 for a doubling of the dust depositions.
In JSBACH, the dust concentrations within the snowpack are not simulated
αnir;min ¼ 0:3 and ð2Þ explicitly and the impact of impurities is only accounted for in the snow’s age and
represented by a factor for the dust deposition rates in the respective calculations.
αnir;max ¼ 0:7 and ð3Þ Thus, in order to simulate the effect of dust accumulation due to ablation, we allow
the main layer to age at the same rate as the top layer, even though the main layer is
T not (fully) exposed to the surface dust deposition flux as it is (partly) covered by the
αvis ¼ αvis;min þ ðαvis;max αvis;min Þ for 5 < T½ C < 0; with ð4Þ top layer. Consequently, whenever the top layer disappears, as a result of snow melt
5
or sublimation, and more of the main layer is exposed, the main layer has already
αvis;min ¼ 0:5 and ð5Þ received the same amount of dust as was embedded in the top layer and has aged
accordingly. Here, it should be noted that this approach potentially overestimates
αvis;max ¼ 0:9: ð6Þ the dust accumulation under the circumstances that ablation is mainly the result of
melt. Whenever ablation is driven by sublimation, it can be assumed that the
The second scheme calculates the snow albedo depending on the snow age, which embedded particles remain at the surface, darkening the underlying snow, but
is a function of the duration the snow has been on the ground, the snowfall rate, when temperatures reach the melting point it is unclear how much of the dust
the surface temperature, and the dust deposition rate. Here, the albedo reduction would remain on top of the snowpack and which fraction would be washed away
due to the snow age fage is described by the following function: with the meltwater33. However, even the assumption that all the dust would be
τ age washed away with the meltwater would not change our results fundamentally. This
f age ¼ f age;max ð7Þ is because the simulated melt rates are so large that melt does not only degrade the
1 þ τ age
top layer, but also reduces the main layer substantially and in most simulations, in
where f age;max constitutes the maximum albedo decrease due to aging, given by: which melt is triggered the snow cover largely disappears during the snow melt
season. And under the circumstances that also the main layer disappears it is
f age;max;nir ¼ 0:5 for the near infrared range; and ð8Þ assumed that the dust is removed from the surface.
Besides these major structural changes, we made some minor adaptations
f age;max;vis ¼ 0:3 for the visible range: ð9Þ mostly in the form of parameter modifications. Instead of using the weighted
average of the temperature- and the age-based snow albedo, we use the minimum
τage represents the snow age which increases during a timestep Δt according to the of the two, but at the same time we raised the maximum albedo of fresh snow to
following function: 0.95 for visible and 0.75 for near-infrared radiation. In addition, we changed the
Δt threshold above which the snow albedo is sensitive to surface temperature from −5
Δτ age ¼ ðτ T þ minðτ 10
T ; 1Þ þ τ D Þ ð10Þ to −1 °C (corresponding to the temperature threshold employed for snow-covered
τt
sea ice in MPIOM, the MPI-ESM’s ocean component), but at the same time, we
where τT represents temperature effects on snow grain growth, τD effects of dust changed the formulation so that increasing temperatures can only lower the albedo,
accumulation and τt a scaling factor: while decreasing temperatures do not increase it. Furthermore, we removed the
factor representing the snowfall rate from the snow age calculation. This was done
1 1
τ T ¼ exp 5000 and ð11Þ because our scheme is designed in a way that snowfall does not affect the
t melt t surf
characteristics of the main layer, while the characteristics of the top layer are
calculated as a weighted average (based on the snow water equivalent) between the
τ D ¼ 0:3 for present day dust depositions; and ð12Þ snow within the top layer and the snow that falls within any given timestep. The
latter is possible because the top layer is necessarily so thin that the entire snow
τ t ¼ 106 : ð13Þ contained within the layer has an effect on the layer’s optical properties.
Note that, in the standard model, snowfall decreases the snow age. However, in the Finally, it should be noted that we prescribe the ice albedo and, as a
snow-albedo-scheme used in this study (see below) this term is no longer needed, consequence, we neglect certain processes which lower the ice albedo in the
hence we do not provide the respective equations here. ablation regions. Most importantly, we do not consider the effect of melt ponds and
The main shortcoming of the MPI-ESM’s snow-albedo-scheme lies in the fact that lakes on the albedo, as the meltwater flux in JSBACH is immediately removed from
it treats the properties of snow at the surface as vertically uniform, and derives the the surface. With seasonal meltwater fluxes of several hundred mm, the resulting
albedo based on the characteristics of the entire snowpack, while in reality the snow puddles, ponds and lakes would substantially darken the surface before draining
albedo is determined only by the near-surface (usually only a few centimetres) snow from the ice cover. This would have increased the amount of absorbed radiation,
COMMUNICATIONS EARTH & ENVIRONMENT | (2021)2:91 | https://doi.org/10.1038/s43247-021-00160-4 | www.nature.com/commsenv 7ARTICLE COMMUNICATIONS EARTH & ENVIRONMENT | https://doi.org/10.1038/s43247-021-00160-4
raising surface temperatures, which in turn promotes the extension and formation the atmosphere and the surface to adapt to the increase in CO2 concentrations.
of ponds. The presence of standing water would have also lowered the impact of These steps were repeated until CO2 levels of 160 mbar were reached (with
fresh snow on the surface albedo, weakening the snowfall-albedo feedback. intermediate CO2 concentrations of 20, 40, and 80 mbar).
Furthermore, an accumulation of salt could have lowered the freezing point, which
would have lead to the formation of surface-water bodies at sub-zero temperatures.
However, simulating the mechanisms that lead to standing water at the surface of a Data availability
snowball Earth is beyond the capabilities of most large-scale models and we are The primary data are available via the German Climate Computing Center’s long-term
only aware of one attempt, by Wu et al.53, to explicitly account for the formation of archive for documentation data (https://cera-www.dkrz.de/WDCC/ui/cerasearch/entry?
melt ponds. Here, one major problem is the uncertainty with respect to the acronym=DKRZ_LTA_231_ds00002).
drainage of these ponds, which could happen extremely fast once connected flow
pathways have formed. Another problem is the estimation of the spatial extent of Code availability
inundated areas, which strongly depends on the small (subgrid) scale orography. The model and scripts used in the analysis and other supplementary information that
Wu et al. deal with the respective uncertainties, by assuming that there is no
may be useful in reproducing the authors’ work are archived by the Max Planck Institute
drainage of meltwater (even though they limit the maximum pond depth) and by
for Meteorology and can be obtained by contacting publications@mpimet.mpg.de. The
determining the area of melt ponds purely based on a subgrid scale distribution of
code is subject to the license terms of the MPI-ESM license version 2 and will be made
the surface temperatures. Here, the assumption is that, even below the melting
available to individuals and institutions for the purpose of research.
point, random temperature fluctuations can trigger melt, while negative deviations
do not cause an immediate refreezing of liquid water. This, allows melt ponds to
persist at sub-zero temperatures, covering up to 80% of the grid cell before Received: 9 September 2020; Accepted: 6 April 2021;
temperatures reach the melting point. These assumptions are no less extreme than
neglecting melt ponds altogether, but risk an overestimation of the respective
impact on the deglaciation process. For the present study, we decided not to
include the above effects of melt ponds for the following reason. The formation of
surface-water bodies provides a positive feedback that necessarily raises the
likelihood of deglaciation—once melting is triggered—and the uncertainty involved
in the respective parametrizations only increases the risk of overestimating the
References
1. Kirschvink, J. L. in The Proterozoic Biosphere: a Multidisciplinary Study, Chp.
potential for exiting the icehouse state. Thus, the most robust estimation of the
2.3, 51–52 (Cambridge University Press, 1992).
deglaciation potential is obtained by neglecting all of the above processes.
Another shortcoming of our model is that we only account for the 2. Hoffman, P. F. et al. Snowball earth climate dynamics and cryogenian geology-
accumulation of dust within the snowpack, but not at the snow-ice-interface. geobiology. Sci. Adv. 3, e1600983 (2017).
Whenever the snowpack is completely melted, the dust is assumed to be washed 3. Evans, D. A., Beukes, N. J. & Kirschvink, J. L. Low-latitude glaciation in the
away completely. However, when snow and ice melt in reality, a given fraction of Palaeoproterozoic era. Nature 386, 262–266 (1997).
the dust is not washed away with the runoff and drained from the surface, but may 4. Hoffman, P. F., Halverson, G. P., Schrag, D. P. & Kaufman, A. J. A
remain behind, e.g., within cryoconite holes2,33. It is exceedingly difficult to neoproterozoic snowball earth. Science 281, 1342–1346 (1998).
estimate the fraction of dust that would remain behind after the melting period and 5. Macdonald, F. A. et al. Calibrating the cryogenian. Science 327, 1241–1243
how long the cryoconite holes could last before they also drain, as this is (2010).
determined by a variety of factors that we do not account for in the model. To 6. Evans, D. A. D. & Raub, T. D. Chapter 7 neoproterozoic glacial
counteract the absence of these effects in the model, we prescribe a comparatively palaeolatitudes: a global update. Geol. Soc. Lond. Mem. 36, 93–112 (2011).
low surface albedo, i.e., 0.53, that best represents sea ice, even though the near- 7. Li, Z.-X., Evans, D. A. & Halverson, G. P. Neoproterozoic glaciations in a
surface ice would most likely have consisted of brighter meteoric ice33,35,65. Here, it revised global palaeogeography from the breakup of rodinia to the assembly of
can be argued, that sea ice, especially when partly covered in dust, would have had gondwanaland. Sediment. Geol. 294, 219–232 (2013).
an even lower albedo. Similar arguments can be made about our minimum snow 8. Rooney, A. D., Strauss, J. V., Brandon, A. D. & Macdonald, F. A. A cryogenian
albedo of ~0.5935. In fact, we performed explorative simulations, in which we set chronology: two long-lasting synchronous neoproterozoic glaciations. Geology
these parameters to the lower end of the plausible range. This decreased the 43, 459–462 (2015).
simulated deglaciation thresholds, but did not change the outcome that 9. Bruce, R. Loophole for snowball Earth. Nature 405, 403–404 (2000).
deglaciation would have been triggered in the extra—rather than in the tropics. 10. Olcott, A. N. Biomarker evidence for photosynthesis during neoproterozoic
Nonetheless, for the study, we only used simulations with higher albedo values to glaciation. Science 310, 471–474 (2005).
ensure that our findings are valid for a broader range of assumptions—that is not 11. Richard, P. W., Yonggang, L. & Crowley, J. W. Snowball Earth prevention by
only for albedo values at the lower end of the plausible range. dissolved organic carbon remineralization. Nature 450, 813 (2007).
This complex approach to determine the albedo was only required for the 12. Allen, P. A. & Etienne, J. L. Sedimentary challenge to Snowball Earth. Nat.
second set of simulations (“Thawing the snowball”) and for the first set Geosci. 1, 817–825 (2008).
(“Dependency of ablation rates on albedo and CO2”) we simply included the option 13. Ghil, M. Climate stability for a sellers-type model. J. Atmos. Sci. 33, 3–20
to prescribe a fixed albedo value for the snow cover, as well as for the underlying (1976).
ice. This allowed us to set the overall surface albedo independent of the simulated 14. Marotzke, J. & Botzet, M. Present-day and ice-covered equilibrium states in a
snow dynamics. comprehensive climate model. Geophys. Res. Lett. 34, L16704 (2007).
15. Ferreira, D., Marshall, J. & Rose, B. Climate determinism revisited: multiple
equilibria in a complex climate model. J. Clim. 24, 992–1012 (2011).
Simulations. In all simulations, the model was run using a temporal resolution of 16. Voigt, A. & Abbot, D. S. Sea-ice dynamics strongly promote snowball earth
450 s and a vertical resolution of 47 atmospheric model levels and 5 vertical sub- initiation and destabilize tropical sea-ice margins. Clim. Past 8, 2079–2092
surface layers. The horizontal resolution of the simulations was T31 (3.75° × 3.75°), (2012).
which corresponds to a grid-spacing of ~415 km in tropical latitudes. To facilitate 17. Amber, W., Thomas, B. & M., S. D. Extreme sensitivity in Snowball Earth
the comparability of our results, the setup of our simulations is very similar to that formation to mountains on PaleoProterozoic supercontinents. Sci. Rep. 9,
of previous studies, in that we removed the orography and reduced the solar 2349 (2019).
constant to 94% of its present-day value28. Note that otherwise the orbital para- 18. Hyde, W. T., Crowley, T. J., Baum, S. K. & Richard, P. W. Neoproterozoic
meters were prescribed using present-day values. ‘snowball Earth’ simulations with a coupled climate/ice-sheet model. Nature
For the first set of experiments, we initiated the model with an pCO2 of 0.4 405, 425–429 (2000).
mbar and an ice-covered but snow-free surface. During the 10-year spin-up period, 19. Lewis, J. P., Weaver, A. J. & Eby, M. Snowball versus slushball earth: Dynamic
in which we gradually reduced the orography, the state of the atmosphere, (sub-) versus nondynamic sea ice? J. Geophys. Res. Oceans 112, C11014 (2007).
surface temperatures and precipitation rates adapted very quickly to the prescribed
20. Abbot, D. S., Voigt, A. & Koll, D. The jormungand global climate state and
surface albedo and a complete snow cover was established (note that in the first set
implications for neoproterozoic glaciations. J. Geophys. Res. Atmos. 116,
of simulations the snow cover has no effect on the surface albedo). After the spin-
D18103 (2011).
up period, we ran the model for a 100-year-period during which we gradually
21. Pierrehumbert, R., Abbot, D., Voigt, A. & Koll, D. Climate of the
increased the pCO2 to 400 mbar. For the second set of experiments, we started our
simulations from the states that were simulated at the end of the spin-up period for neoproterozoic. Annu. Rev. Earth Planet. Sci. 39, 417–460 (2011).
a prescribed surface albedo of 0.66. Here, we removed the snow cover and ran the 22. Rose, B. E. J. Stable “waterbelt” climates controlled by tropical ocean heat
simulations for a 20-year period with a constant pCO2 of 0.4 mbar, an ice albedo of transport: a nonlinear coupled climate mechanism of relevance to snowball
0.53 and the snow-albedo-dynamics, resulting from a given dust deposition rate. earth. J. Geophys. Res. Atmos. 120, 1404–1423 (2015).
The first 10 years of this period were required for the snow cover and the surface 23. Pierrehumbert, R. T. High levels of atmospheric carbon dioxide necessary for
albedo to come to an equilibrium and the second 10 years were used in the analysis. the termination of global glaciation. Nature 429, 646–649 (2004).
After this period, we removed the snow cover, increased the CO2 concentration, 24. Pierrehumbert, R. T. Climate dynamics of a hard snowball earth. J. Geophys.
and continued the simulation for another 20 years, again with 10 years required for Res. Atmos. 110, D01111 (2005).
8 COMMUNICATIONS EARTH & ENVIRONMENT | (2021)2:91 | https://doi.org/10.1038/s43247-021-00160-4 | www.nature.com/commsenvCOMMUNICATIONS EARTH & ENVIRONMENT | https://doi.org/10.1038/s43247-021-00160-4 ARTICLE
25. Hir, G. L., Ramstein, G., Donnadieu, Y. & Pierrehumbert, R. T. Investigating 55. Zelinka, M. D. et al. Causes of higher climate sensitivity in CMIP6 models.
plausible mechanisms to trigger a deglaciation from a hard snowball earth. C. Geophys. Res. Lett. 47, e2019GL085782 (2020).
R. Geosci. 339, 274–287 (2007). 56. Zhu, J., Poulsen, C. J. & Otto-Bliesner, B. L. High climate sensitivity in
26. Abbot, D. S. et al. Clouds and snowball earth deglaciation. Geophys. Res. Lett. CMIP6 model not supported by paleoclimate. Nat. Clim. Change 10, 378–379
39, L20711 (2012). (2020).
27. Hu, Y., Yang, J., Ding, F. & Peltier, W. Model-dependence of the co 2 57. Beusch, L., Gudmundsson, L. & Seneviratne, S. I. Crossbreeding CMIP6 earth
threshold for melting the hard snowball earth. Clim. Past 7, 17–25 (2011). system models with an emulator for regionally optimized land temperature
28. Abbot, D. S. et al. Robust elements of snowball earth atmospheric circulation projections. Geophys. Res. Lett. 47, e2019GL086812 (2020).
and oases for life. J. Geophys. Res. Atmos. 118, 6017–6027 (2013). 58. Mason, B. G., Pyle, D. M. & Oppenheimer, C. The size and frequency of the
29. Mauritsen, T. et al. Developments in the mpi-m earth system model version largest explosive eruptions on earth. Bull. Volcanol. 66, 735–748 (2004).
1.2 (mpi-esm1.2) and its response to increasing co2. J. Adv. Model. Earth Syst. 59. Huybers, P. & Langmuir, C. Feedback between deglaciation, volcanism, and
11, 998–1038 (2019). atmospheric co2. Earth Planet. Sci. Lett. 286, 479–491 (2009).
30. Abbot, D. S. & Pierrehumbert, R. T. Mudball: surface dust and snowball earth 60. Ewing, R. C. et al. New constraints on equatorial temperatures during a late
deglaciation. J. Geophys. Res. 115, D03104 (2010). neoproterozoic snowball earth glaciation. Earth Planet. Sci. Lett. 406, 110–122
31. Hir, G. L., Donnadieu, Y., Krinner, G. & Ramstein, G. Toward the snowball (2014).
earth deglaciation…. Clim. Dyn. 35, 285–297 (2010). 61. Claquin, T. et al. Radiative forcing of climate by ice-age atmospheric dust.
32. Li, D. & Pierrehumbert, R. T. Sea glacier flow and dust transport on snowball Clim. Dyn. 20, 193–202 (2003).
earth. Geophys. Res. Lett. 38, L17501 (2011). 62. Abbot, D. S. & Halevy, I. Dust aerosol important for snowball earth
33. Goodman, J. C. & Strom, D. C. Feedbacks in a coupled ice-atmosphere-dust deglaciation. J. Clim. 23, 4121–4132 (2010).
model of the glacial neoproterozoic “mudball earth”. J. Geophys. Res. Atmos. 63. Abbot, D. S. Analytical investigation of the decrease in the size of the habitable
118, 11,546–11,557 (2013). zone due to a limited co2 outgassing rate. Astrophys. J. 827, 117 (2016).
34. Brandt, R. E., Warren, S. G., Worby, A. P. & Grenfell, T. C. Surface albedo of 64. Engels, J. The Impact of Black Carbon Aerosol Induced Snow Darkening on the
the antarctic sea ice zone. J. Clim. 18, 3606–3622 (2005). Radiation Balance in ECHAM6: Quantifying the Contribution of Wildfires for
35. Dadic, R., Mullen, P. C., Schneebeli, M., Brandt, R. E. & Warren, S. G. Effects Present and Future Conditions. Ph.D. thesis, Universität Hamburg Hamburg
of bubbles, cracks, and volcanic tephra on the spectral albedo of bare ice near (2016).
the transantarctic mountains: implications for sea glaciers on snowball earth. 65. Goodman, J. C. Through thick and thin: marine and meteoric ice in a
J. Geophys. Res. Earth Surf. 118, 1658–1676 (2013). “snowball earth” climate. Geophys. Res. Lett. 33, L16701 (2006).
36. Zatko, M. C. & Warren, S. G. East antarctic sea ice in spring: spectral albedo of
snow, nilas, frost flowers and slush, and light-absorbing impurities in snow.
Ann. Glaciol. 56, 53–64 (2015). Author contributions
37. Light, B., Carns, R. C. & Warren, S. G. The spectral albedo of sea ice and salt P.d.V. designed the experiments, performed model adaptations, conducted simulations,
crusts on the tropical ocean of snowball earth: 1. laboratory measurements. J. and analysis and prepared the manuscript. T.S. performed model adaptations and was
Geophys. Res. Oceans 121, 4966–4979 (2016). involved in the analysis. J.C.R. and J.G. analyzed the observational evidence. V.B. con-
38. Lewis, J. P., Weaver, A. J. & Eby, M. Deglaciating the snowball earth: tributed to the analysis and the preparation of the manuscript. All authors reviewed and
sensitivity to surface albedo. Geophys. Res. Lett. 33, L23604 (2006). contributed to the manuscript.
39. Fountain, A. G., Jacobel, R. W., Schlichting, R. & Jansson, P. Fractures as the
main pathways of water flow in temperate glaciers. Nature 433, 618–621 (2005). Funding
40. Das, S. B. et al. Fracture propagation to the base of the greenland ice sheet Open Access funding enabled and organized by Projekt DEAL.
during supraglacial lake drainage. Science 320, 778–781 (2008).
41. Krawczynski, M. J., Behn, M. D., Das, S. B. & Joughin, I. Constraints on the
lake volume required for hydro-fracture through ice sheets. Geophys. Res. Lett. Competing interests
36, L10501 (2009). The authors declare no competing interests.
42. Simkins, L. M. et al. Anatomy of a meltwater drainage system beneath the
ancestral East Antarctic ice sheet. Nat. Geosci. 10, 691–697 (2017).
43. Smith, L. C. et al. Direct measurements of meltwater runoff on the greenland
Additional information
Supplementary information The online version contains supplementary material
ice sheet surface. Proc. Natl Acad. Sci. 114, E10622–E10631 (2017).
available at https://doi.org/10.1038/s43247-021-00160-4.
44. Huiming, B., Lyons, J. R. & Chuanming, Z. Triple oxygen isotope evidence for
elevated CO2 levels after a Neoproterozoic glaciation. Nature 453, 504–506
Correspondence and requests for materials should be addressed to P.d.V.
(2008).
45. Wiscombe, W. J. & Warren, S. G. A model for the spectral albedo of snow. i: Peer review information Primary handling editor: Joseph Aslin.
Pure snow. Journal of the Atmos. Sci. 37, 2712–2733 (1980).
46. Dang, C., Fu, Q. & Warren, S. G. Effect of snow grain shape on snow albedo. J. Reprints and permission information is available at http://www.nature.com/reprints
Atmos. Sci. 73, 3573–3583 (2016).
47. Goodman, J. C. & Pierrehumbert, R. T. Glacial flow of floating marine ice in Publisher’s note Springer Nature remains neutral with regard to jurisdictional claims in
“snowball earth”. J. Geophys. Res. Oceans 108, 3308 (2003).
published maps and institutional affiliations.
48. Hoffman, P. F. & Schrag, D. P. Considering a neoproterozoic snowball earth:
reply. Science 284, 1087–1087 (1999).
49. Pollard, D., Kasting, J. F. & Zugger, M. E. Snowball earth: asynchronous
coupling of sea-glacier flow with a global climate model. J. Geophys. Res. Open Access This article is licensed under a Creative Commons
Atmos. 122, 5157–5171 (2017). Attribution 4.0 International License, which permits use, sharing,
50. Roesch, A., Wild, M., Gilgen, H. & Ohmura, A. A new snow cover fraction adaptation, distribution and reproduction in any medium or format, as long as you give
parametrization for the echam4 gcm. Clim. Dyn. 17, 933–946 (2001). appropriate credit to the original author(s) and the source, provide a link to the Creative
51. Roesch, A. & Roeckner, E. Assessment of snow cover and surface albedo in the Commons license, and indicate if changes were made. The images or other third party
echam5 general circulation model. J. Clim. 19, 3828–3843 (2006). material in this article are included in the article’s Creative Commons license, unless
52. Dadic, R., Mott, R., Lehning, M. & Burlando, P. Wind influence on snow indicated otherwise in a credit line to the material. If material is not included in the
depth distribution and accumulation over glaciers. J. Geophys. Res. Earth Surf. article’s Creative Commons license and your intended use is not permitted by statutory
115, F01012 (2010). regulation or exceeds the permitted use, you will need to obtain permission directly from
53. Wu, J., Liu, Y. & Zhao, Z. How should snowball earth deglaciation start. J. the copyright holder. To view a copy of this license, visit http://creativecommons.org/
Geophys. Res. Atmos. 126, e2020JD033833 (2021). licenses/by/4.0/.
54. Eyring, V. et al. Overview of the coupled model intercomparison project phase
6 (CMIP6) experimental design and organization. Geosci. Model Dev. 9,
1937–1958 (2016). © The Author(s) 2021
COMMUNICATIONS EARTH & ENVIRONMENT | (2021)2:91 | https://doi.org/10.1038/s43247-021-00160-4 | www.nature.com/commsenv 9You can also read