MIT Joint Program on the Science and Policy of Global Change - Potential Climatic Impacts and Reliability of Very Large Scale Wind Farms
←
→
Page content transcription
If your browser does not render page correctly, please read the page content below
MIT Joint Program on the
Science and Policy of Global Change

    Potential Climatic Impacts and Reliability
       of Very Large Scale Wind Farms
               Chien Wang and Ronald Prinn

                   Report No. 175
                     June 2009
The MIT Joint Program on the Science and Policy of Global Change is an organization for research,
independent policy analysis, and public education in global environmental change. It seeks to provide leadership
in understanding scientific, economic, and ecological aspects of this difficult issue, and combining them into policy
assessments that serve the needs of ongoing national and international discussions. To this end, the Program brings
together an interdisciplinary group from two established research centers at MIT: the Center for Global Change
Science (CGCS) and the Center for Energy and Environmental Policy Research (CEEPR). These two centers
bridge many key areas of the needed intellectual work, and additional essential areas are covered by other MIT
departments, by collaboration with the Ecosystems Center of the Marine Biology Laboratory (MBL) at Woods Hole,
and by short- and long-term visitors to the Program. The Program involves sponsorship and active participation by
industry, government, and non-profit organizations.
To inform processes of policy development and implementation, climate change research needs to focus on
improving the prediction of those variables that are most relevant to economic, social, and environmental effects.
In turn, the greenhouse gas and atmospheric aerosol assumptions underlying climate analysis need to be related to
the economic, technological, and political forces that drive emissions, and to the results of international agreements
and mitigation. Further, assessments of possible societal and ecosystem impacts, and analysis of mitigation
strategies, need to be based on realistic evaluation of the uncertainties of climate science.
This report is one of a series intended to communicate research results and improve public understanding of climate
issues, thereby contributing to informed debate about the climate issue, the uncertainties, and the economic and
social implications of policy alternatives. Titles in the Report Series to date are listed on the inside back cover.
   Henry D. Jacoby and Ronald G. Prinn,
   Program Co-Directors

                            For more information, please contact the Joint Program Office
                                 Postal Address: Joint Program on the Science and Policy of Global Change
                                                   77 Massachusetts Avenue
                                                   MIT E19-411
                                                   Cambridge MA 02139-4307 (USA)
                                         Location: 400 Main Street, Cambridge
                                                   Building E19, Room 411
                                                   Massachusetts Institute of Technology
                                           Access: Phone: +1(617) 253-7492
                                                   Fax: +1(617) 253-9845
                                                   E-mail: gl o ba l ch a n ge @mi t .e du
                                                   Web site: h t t p://gl o ba l ch a n ge .m i t .e du /

                                                                                                     Printed on recycled paper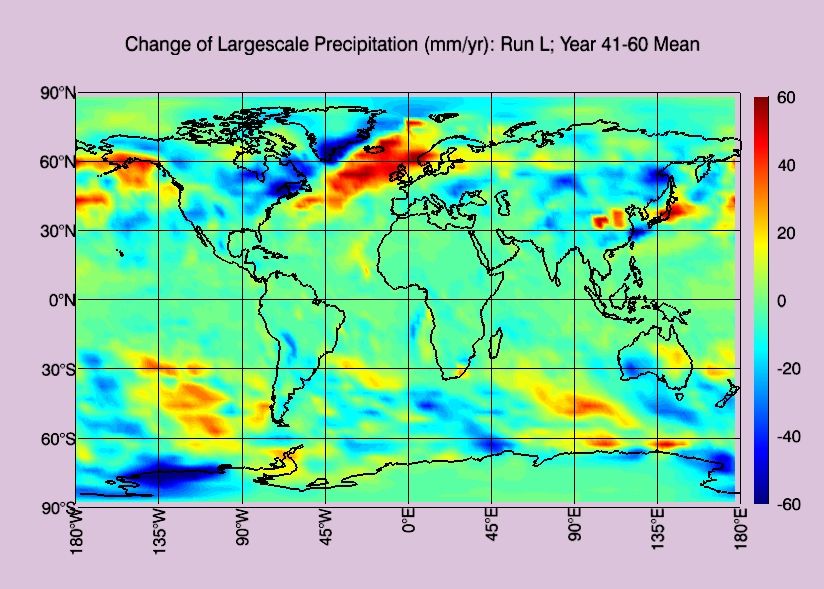
Potential Climatic Impacts and Reliability of Very Large-Scale Wind Farms
                                                   Chien Wang* and Ronald G. Prinn
                                                                           Abstract
              Meeting future world energy needs while addressing climate change requires large-scale
          deployment of low or zero greenhouse gas (GHG) emission technologies such as wind energy. The
          widespread availability of wind power has fueled legitimate interest in this renewable energy source
          as one of the needed technologies. For very large-scale utilization of this resource, there are
          however potential environmental impacts, and also problems arising from its inherent intermittency,
          in addition to the present need to lower unit costs. To explore some of these issues, we use a three-
          dimensional climate model to simulate the potential climate effects associated with installation of
          wind-powered generators over vast areas of land or coastal ocean. Using windmills to meet 10% or
          more of global energy demand in 2100, could cause surface warming exceeding 1oC over land
          installations. In contrast, surface cooling exceeding 1oC is computed over ocean installations, but
          the validity of simulating the impacts of windmills by simply increasing the ocean surface drag needs
          further study. Significant warming or cooling remote from both the land and ocean installations, and
          alterations of the global distributions of rainfall and clouds also occur. These results are influenced
          by the competing effects of increases in roughness and decreases in wind speed on near-surface
          turbulent heat fluxes, the differing nature of land and ocean surface friction, and the dimensions of
          the installations parallel and perpendicular to the prevailing winds. These results are also
          dependent on the accuracy of the model used, and the realism of the methods applied to simulate
          windmills. Additional theory and new field observations will be required for their ultimate
          validation. Intermittency of wind power on daily, monthly and longer time scales as computed in
          these simulations and inferred from meteorological observations, poses a demand for one or more
          options to ensure reliability, including backup generation capacity, very long distance power
          transmission lines, and onsite energy storage, each with specific economic and/or technological
          challenges.

                                                                          Contents
             1. INTRODUCTION ................................................................................................................. 1
             2. METHODS ............................................................................................................................ 2
             3. RESULTS.............................................................................................................................. 5
             4. CONCLUSIONS ................................................................................................................. 14
             5. REFERENCES .................................................................................................................... 15

1. INTRODUCTION
   World energy demand is predicted to increase from ~430 EJ/year (14 TW) in 2002 to ~1400
EJ/year (44 TW) in 2100 [Reilly and Paltsev, 2007]. Any effective energy contributor needs to
be implemented on a very large scale (e.g., provide 10% of the year 2100 demand). Among the
current energy technologies with low or zero greenhouse gas (GHG) emissions, electrical
generation using windmills is percentage-wise the fastest growing energy resource worldwide. In
the US, it has grown from 1.8 GW of capacity in 1996 to more than 11.6 GW (~ 0.37 EJ/year) in
2006, but this is still negligible compared to future energy demand.
   The solar energy absorbed by the Earth is converted into latent heat (by evaporation),
gravitational potential energy (by atmospheric expansion), internal energy (by atmospheric and

*
    Center for Global Change Science and Joint Program of the Science and Policy of Global Change
     Massachusetts Institute of Technology Cambridge, MA 02139. (Email: wangc@mit.edu)

                                                                                1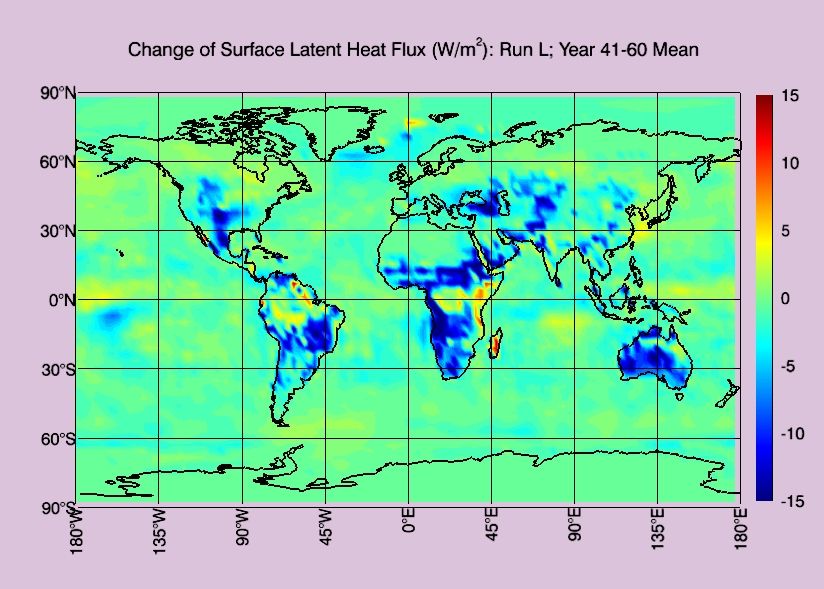
oceanic warming, condensation), or kinetic energy (e.g., by convective and baroclinic
instabilities) [Lorenz, 1967]. Averaged globally, internal energy, gravitational potential energy,
latent heat, and kinetic energy comprise about 70.4, 27.05, 2.5, and 0.05% respectively of the
total atmospheric energy [Peixoto and Oort, 1992]. However, only a small fraction of the already
scarce kinetic energy is contained in the near surface winds that then produce small-scale
turbulent motions due to surface friction. Eventually the turbulent motions downscale to
molecular motions, thus converting bulk air kinetic energy to internal energy.
   However, it is not the size of these energy reservoirs, but the rate of conversion from one to
another, that is more relevant here. The global average rate of conversion of large-scale wind
kinetic energy to internal energy near the surface is about 1.68 W/m2 (860 TW globally) in our
model calculations. This is only about 0.7% of the average net incoming solar energy of 238
W/m2 (122 PW globally) [Lorenz, 1967; Peixoto and Oort, 1992]. The magnitude of this rate
when windmills are present is expected to differ from this, but not by large factors. The
widespread availability of wind power has fueled legitimate interest in harnessing it for energy
production [e.g., Carter, 1926; Hewson, 1975; Archer and Jacobson, 2003]. Windmills convert
wind power into electrical power. However, the turbulence near the surface, which also feeds on
wind power, is critical for driving the heat and moisture exchanges between the surface and the
atmosphere that play an important role in determining surface temperature, atmospheric
circulation and the hydrological cycle.
   Because of the low output (~MW) of individual wind turbines, one needs to install a large
number of the devices to generate a substantial amount of energy. For example, presuming these
turbines are effectively generating at full capacity only 1/3 of the time, about 13 million of them
are needed to meet an energy output of 140 EJ/year (4.4 TW), and they would occupy a
continental-scale area. While the amount of energy gained from global deployment of surface
wind power may be small relative to the 860 TW available globally, the accompanying climate
effects may not be negligible. A previous study using atmospheric general circulation models
with fixed sea surface temperatures suggests that the climatic perturbation caused by a large-
scale land installation of windmills can spread well beyond the installation regions [Keith et al.,
2004].
2. METHODS
   To explore the potential climate impacts of very large-scale windfarms, we use, for the first
time, a fully coupled atmosphere-ocean-land system model, specifically the Community Climate
Model Version 3 of the U.S. National Center for Atmospheric Research with a mixed layer
ocean [Kiehl et al., 1998]. In order to isolate the climate effects of windmills from those due to
greenhouse gas increases, all runs were carried out with current greenhouse gas levels. The
chosen T42 spatial spectral resolution provides an approximately 2.8 by 2.8 degree grid point
spacing in the horizontal, and there are 18 vertical layers.
   Seven model runs with 60-year durations were carried out and are reported here. Each run
takes about 40 years to reach climatic steady states that approximately repeat annually after that.

                                                 2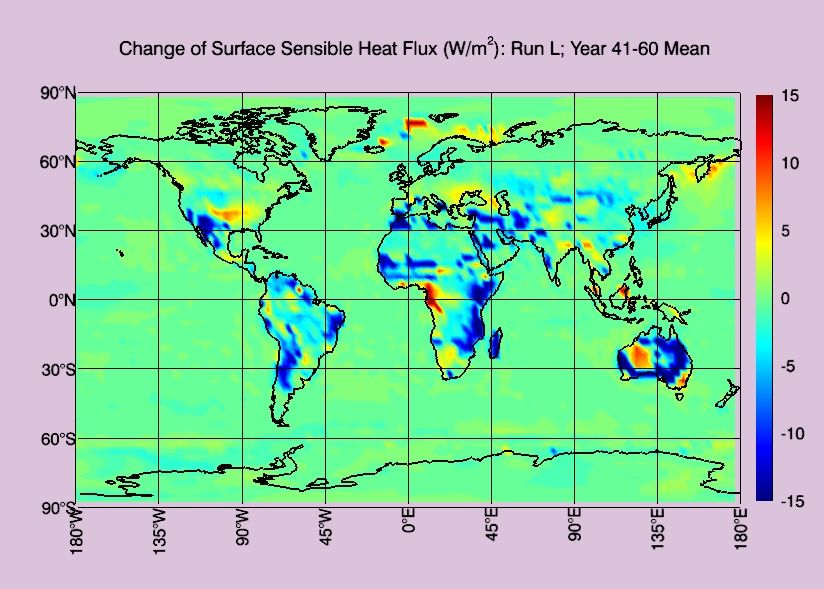
Four of the five runs (denoted VL, L, H, and VH) used different schemes to simulate the
windmill effects over land, while another run (REF) excludes any windmill effects and thus
serves as the control or reference. Besides the land installation simulations, we have also
conducted two additional runs (denoted OL and OH) in which we simulate installing windmills
over all coastal regions between 60oS and 74oN in latitude where the ocean depth is shallower
than 200 meters. As before, comparisons of the oceanic windmill runs with the REF run serve to
isolate the climate effects of the windmills. Unless otherwise indicated, the means of the last 20
years (years 41-60) of each of the model integrations are used in the analyses.
   Previous model studies of wind farms of various scales have used methods to increase the
surface roughness to simulate the aerodynamic effect of windmills [Baidya Roy et al., 2004;
Keith et al., 2004; also see the review by Crespo et al., 1999]. We adopt the same general
approach, but use model-provided parameters for objects similar to windmills. We selected the
global land regions covered by grass (including cold C3 and warm C4) and shrub (including
evergreen and deciduous) to be the sites for installation of the windmills over the land. This
choice is influenced by the generally lower economic value and high wind speeds over such
lands, but future studies might investigate alternative strategies. The windmill farm effect is
simulated specifically by modifying the model surface roughness and/or displacement height
coefficients over the global grass and shrub regions in the land model of the CCM3 system. The
selected roughness and displacement height in the four windmill runs are: Run VL, 0.12m
(double the original value) and 0.34m (unchanged); Run L, 0.16m (arbitrary) and 0.34m; Run H,
0.75m (arbitrary, close to the value of 0.77m of the needle leaf deciduous tree in the model) and
0.34m; and Run VH, 2.62m and 23.45m (based on the evergreen forest in the model). In the
ocean-based experiments, an additional surface drag of 0.007 and 0.001 over the installed
regions has been applied in the Runs OH and OL, respectively, to simulate the windmill effect on
wind power extraction. The former value is about the same as a reported measurement over
mesoscale windfarms (see Keith et al., 2004) while the latter is about double the average sea
surface roughness (Peixoto and Oort, 1992). Note that the equations describing the atmosphere-
ocean interfacial interactions in the model are highly parameterized and defining a formulation to
mimic windmills with equivalent realism to the one used for the land-based experiments is
difficult. Therefore, the two ocean experiments are for exploratory purposes only.
   Except for the changes made to the surface roughness or displacement height described
above, we keep all other surface properties in these regions identical to their standard CCM3
settings. The model calculates the actual surface properties based on weighted values over all
surface types in a given grid. Our method for land installations avoids changing uniformly the
above two surface properties of a given model grid to those of a modeled windmill farm unless
one or both of the two selected surface types (grass, shrub) dominate the grid.
   The rate of conversion of large-scale kinetic energy to turbulent kinetic energy can be
described by a term in the equation for the change in the mean flow kinetic energy per unit
volume of air (KE) with time t [Stull, 1988]:

                                                3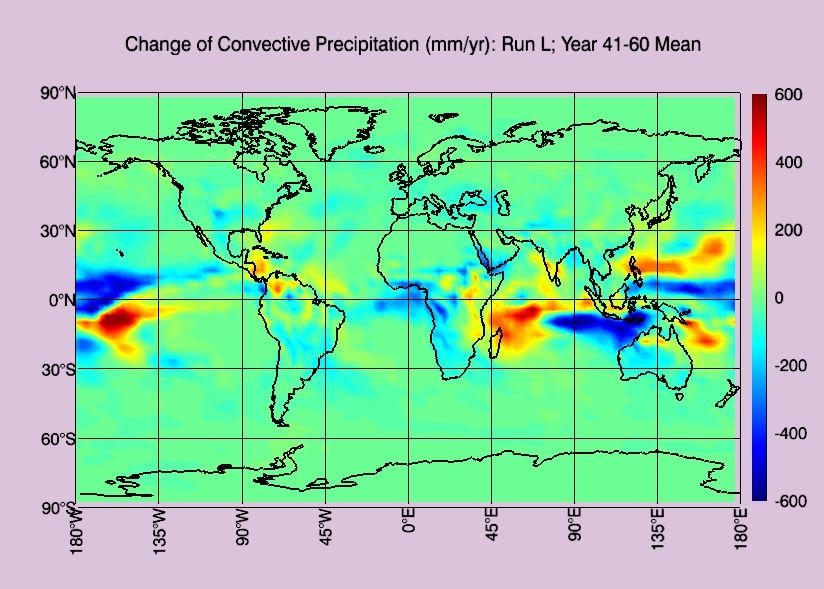
dKE              ∂U i          ∂U i
        = −ρ u'i u'j      = τ i, j      .                                                       (1)
     dt              ∂x j          ∂x j
   Here, i, j = 1, 2, 3 are the three directions of the spatial coordinates, x, U is the mean wind
speed, u´ is the deviation of the actual wind from the mean (so that it reflects the turbulent
motions), ρ is the air density, and τ is the surface stress. The same term exists in the equation of
change of turbulent kinetic energy but with an opposite sign. The surface stress is derived in the
land surface model (LSM) or the mixed-layer ocean model of CCM3 as a function of surface
properties including roughness and displacement height. The change in the rate of downward
transport of cascaded kinetic energy due to the simulated windmill effects are calculated
continuously at each model time step (20 minutes) by comparing the surface stress values
derived with and without the perturbed surface roughness and/or displacement, respectively.
These calculated changes are then used to calculate the uptake of wind power by the simulated
windmills which is then partially converted to the actual electrical power output.
   The various changes in surface properties lead to an increase of surface momentum drag and a
decrease of local near-surface wind speed. The changes in surface momentum drag in Run L
were up to 0.0025, depending on the dominance of the grass and shrub types in the given model
grid (Figure 1). This effect is enhanced in Runs H and VH, and reduced in VL. We install the
windmills over 58 million km2 of shrub and grass lands in the major continents, or over 10
million km2 of the global coastal oceans where the depths are less than 200 meters (Figure 1).
The relevant model parameters were changed to remove the amount of near-surface atmospheric
kinetic energy needed to match various energy production targets. We make no specific
assumptions about the type and spacing of these windmills; our interest is only in determining
the impacts of removing the kinetic energy from the near-surface atmosphere needed to drive
them.

  Figure 1. Locations of land installations are indicated by the modeled change of surface
      drag coefficient (non-dimensional) averaged over the final 20 years of the 60-year
      Run L (see color code on right hand side). The drag values have been scaled by a
      factor of 1000. Also shown are the locations of offshore installation regions where the
      ocean depth is shallower than 200 meters (blue shading).

                                                 4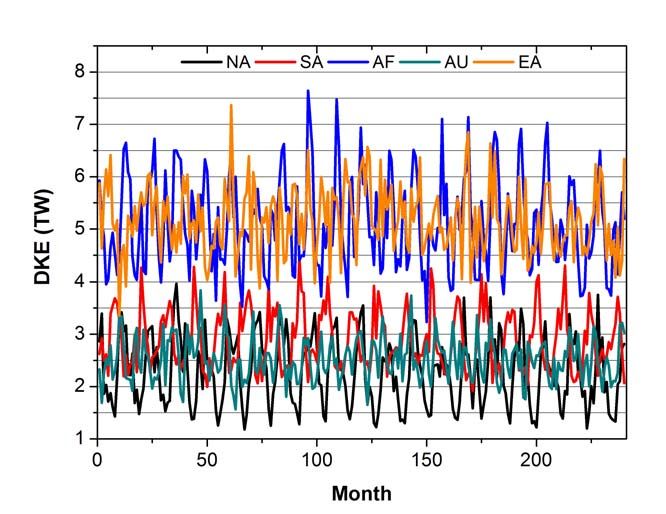
3. RESULTS
    In Run L with a moderate change in the surface roughness over the installed land regions, the
reduction of wind power due to the windmills is about 20 TW, or 630 EJ/yr, which is about 2.3%
of the total rate of conversion of mean flow to turbulent kinetic energy at the Earth’s surface and
23% of the conversion rate over the actual areas of the windmill installation. No more than 59%
of the kinetic energy contained in an air-stream tube having the same cross section as a disc-
shaped obstacle can be converted to useful work by the disc (the Lanchester–Betz–Joukowsky
limit) [Kulk, 2007]. The actual conversion efficiency of this kinetic energy to electric power is
likely to be lower than 30% [Dodson et al., 2005]. With a conversion efficiency of 25%, the
windmills in Run L would provide about 158 EJ/yr (5 TW). In three other numerical
experiments, the kinetic energy extracted by the windmills was either reduced or enhanced
compared to Run L (e.g. reflecting the effects of lowering or raising the windmill spatial
density). The computed electrical energy outputs are about 72, 344, and 603 EJ/yr (2.3, 11 and
19 TW) in Run VL, H, and VH, respectively. The offshore shallow ocean installations provide
about 96 and 30 EJ/yr (3.0 and 0.95 TW) in Run OH and OL, respectively.
    The computed air temperature over the installation regions in Run L is elevated by more than
  o
1 C in the lowest model layer (~30m thick at sea level) in many regions (Figure 2), but the
increase, averaged over the entire global land surface, is only about 0.15 oC. Although the
surface air temperature change is dominated by the increase over the windmill-installed areas
(Figure 1), the changes go well beyond these areas (Figure 2). The frequency distributions for
temperature changes for Run L and the other three land-based runs, are also shown in Figure 2.
The global land-average temperature changes are 0.05, 0.16, and 0.73oC, respectively, for these
three other land-based runs (VL, H and VH). In all these runs, except for Run VL, the global
patterns of these changes are consistent with Run L (Figure 2). These patterns also have some
similarities to the previous study by Keith et al. [2004] over land, but not over the oceans, since
that study assumed fixed ocean temperatures.

                                                 5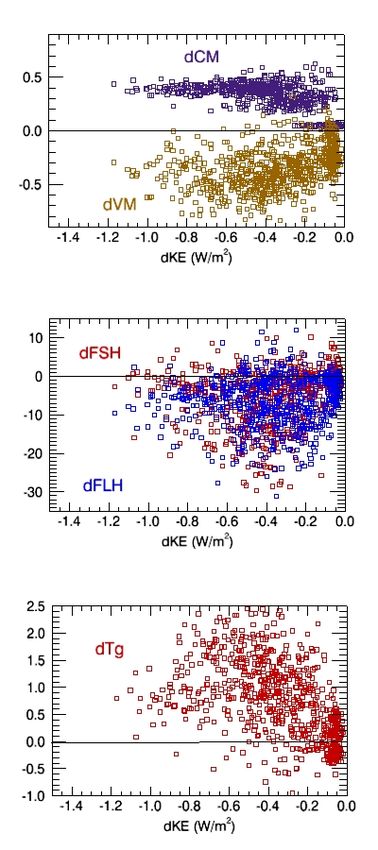
Figure 2. Temperature changes (Run L minus reference, REF) in the lowest model layer
    resulting from large-scale deployment of windmills over land sufficient to generate
    158EJ/year of electric power (upper panel); and normalized frequency of temperature
    changes over the installation regions in Runs VH, H, L, and VL (lower panel). Both
    refer to averages over years 41-60.

                                          6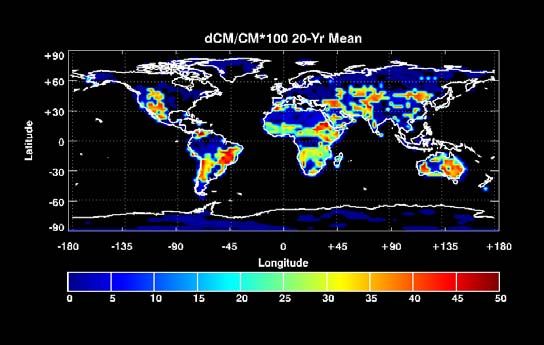
The warming caused by the windmills is limited to the lowermost atmospheric layers (Figure
3). Above the planetary boundary layer, a compensating cooling effect is expected and observed
in many regions, because the turbulent transfer of heat from the surface to these higher layers is
reduced. This should be contrasted to the relatively uniformly distributed warming throughout
the troposphere induced by rising greenhouse gases [IPCC, 2007].

  Figure 3. Horizontally averaged temperature changes (relative to the reference, REF)
      over land in the 4 windmill installation runs. All data are 20-year means from year 41
      to 60.

   Increasing surface roughness (to simulate the windmills) without significantly lowering the
near-surface wind speed should increase near-surface turbulent latent and sensible heat transport
and thus cool the surface. However, changes in surface roughness over a region with a very large
width in the prevailing wind direction indeed cause a significant reduction in the wind speed
based on our results that weakens the near-surface turbulent transport, and thus warms the
surface (Figure 4). Our results suggest that the latter effect prevails over the majority of the
installation regions. Note that, like the effects on temperature, the effects of these windmill
installations on surface heat fluxes, spread well beyond the installation regions and often have
opposite signs to those in the installation regions (Figure 5). These long-range effects are likely
to be very model-dependent. Dynamical mechanisms involving Rossby waves for long-range
effects of large-scale changes in land surface friction have been proposed [Kirk-Davidoff and
Keith, 2008]. Long-range effects are also computed in climate model simulations where regional
energy budgets are altered by aerosols [Wang, 2007].

                                                 7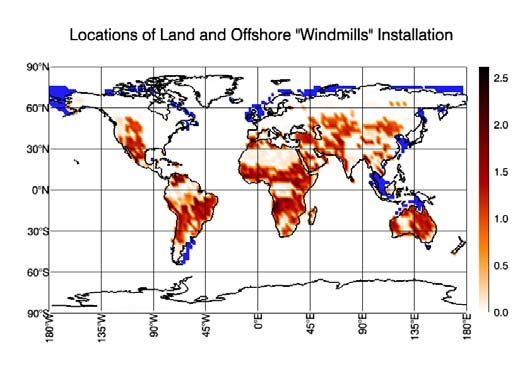
Figure 4. Changes in surface momentum drag coefficient (dCM; unit-less), wind
    magnitude (dVM; m/s), sensible (dFSH; W/m2) and latent (dFLH; W/m2) heat fluxes,
    and surface air temperature (dTg; K) over the model grids where the kinetic energy
    losses (dKE; W/m2) due to windmills occur. Results shown are year 41-60 means of
    Run L minus Run REF.

                                          8
Figure 5. Surface heat flux changes for Run L (Run L minus Run REF) for latent heat
(upper panel) and sensible heat (lower panel) fluxes. Both panels are in W/m2 and
averaged over years 41-60.
9Note that that the fractional changes of surface drag in our two ocean-based runs are very high
compared to the land cases, owing to the much higher intrinsic surface roughness over land than
over ocean (Figure 6). Therefore, in contrast to the land-based experiments, this substantial
increase in surface drag in the ocean-based experiments creates much stronger turbulence that
substantially opposes the wind reduction effect due to the roughness change. This leads to an
enhancement in ocean-atmosphere heat fluxes, particularly latent heat fluxes, and thus to local
cooling over almost all of the installation regions (Figure 7). As in the land-based runs, the
temperature changes in the coastal ocean-based runs also occur well beyond the installation
regions with similar vertical profiles (not shown) to Figure 3, but with opposite signs. Note that
these results in these two ocean runs are likely not reliable, since they are dependent on the
single CCM3 model option available to us for making the changes to ocean surface properties
necessary to simulate the drag effects of windmills over water.
Figure 6. Percentage changes of surface momentum drag coefficient (dCM/CM*100) due
to the simulated windmills over the land (upper panel); and surface momentum
coefficients (CDN10) without (black line) and with (Run OL, blue line; Run OH, red
line) the simulated windmills over the ocean (lower panel).
10Figure 7. Same as Figure 2 (upper panel) but for Run OH.
The spatially extensive changes in temperatures and surface heat fluxes for the land
installations are sufficient to affect the global distributions of cloud cover, especially the lower
clouds (not shown), and precipitation (Figure 8). The rates of convective precipitation (Figure 8)
are generally reduced in the Northern Hemisphere and enhanced in the Southern Hemisphere,
symptomatic of a shift in the atmospheric Hadley Circulation [Wang, 2007]. In the mid-latitudes,
especially in the Northern Hemisphere, changes in large-scale precipitation also appear (Figure
8), indicating an impact on mid-latitude weather systems. Although the changes in local
convective and large-scale precipitation exceed 10% in some areas, the global average changes
are not very large.
11Figure 8. Precipitation changes (Run L minus Run REF) for: convective precipitation
(upper panel), and large-scale precipitation (lower panel). Both are in mm/yr and
averaged over years 41-60.
To investigate the issue of wind variability leading to intermittency in wind power generation,
we show in Figure 9 the average and standard deviation of the monthly-mean wind power
consumption (DKE=dKE/dt in TW, see eqn. 1) for each month of the year and for each continent
over the last 20 years of Run L. Also shown is the time series of these monthly-means over the
last 20 years. Dividing DKE by 4 for a 25% conversion efficiency, the 20-year average generated
electrical power over each continent is 0.57 (North America), 0.72 TW (South America), 1.28
TW (Africa/Middle East), 0.63 TW (Australia), and 1.29 TW (Eurasia). However, quite apart
from the well-known day-to-night and day-to-day intermittency of windmills, from Figure 9
12there are very large (up to a factor of 2) and geographically extensive seasonal variations
especially over North and South America and Africa/Middle East. Unfortunately the months of
minimum generation usually coincide with maximum demand for air conditioning. In an
electrical generation system dominated by windmills, reliability of supply cannot therefore be
achieved simply by long-distance power transmission over these continents.
Figure 9. Twenty-year (years 41-60) averages and standard deviations (upper panel),
and all values (lower panel), of the monthly mean wind power consumption
(DKE=dKE/dt, equation 1) by simulated windmills installed in various continents:
North America (NA), South America (SA), Africa and Middle East (AF), Australia (AU),
and Eurasia (EA).
134. CONCLUSIONS
Meeting future world energy needs while addressing climate change requires large-scale
deployment of low or zero GHG emission technologies such as wind energy. We used a three-
dimensional climate model to simulate the potential climate effects associated with installation of
wind-powered generators over vast areas of land and ocean. Using windmills to meet 10% or
more of global energy demand in 2100 could cause surface warming exceeding 1oC over land
installations. Significant warming and cooling remote from the installations, and alterations of
the global distributions of rainfall and clouds also occur.
Our ocean results indicating cooling over the installation regions and warming and cooling
elsewhere are interesting, but suspect due to the unrealistic increases in surface drag needed to
extract the target wind power. Specific new and realistic parameterizations for simulating the
effects of windmills over the ocean will need to be developed and applied in general circulation
models before reliable conclusions can be reached.
Installation of windmills over land areas that have alternative spatial extents, topographies and
hydrological properties would produce different, but presumably still significant, climate effects.
Due to the computed nonlinearity between the changes in surface roughness and the climate
response, defining the optimal deployment of windmills is challenging. Environmental effects
increase with power generated and decrease with conversion efficiency. Also, for the widely
spaced windmills simulated in our runs, the environmental effects appear small when they are
generating less than 1 TW globally even with current technologies.
Our results should be fairly robust to assumptions about the specific windmill technologies
utilized. Increasing their efficiencies from 25% to 35% helps to lower, but does not remove the
calculated climate effects. Our results are dependent upon the realism of the land surface and
atmospheric boundary layer in our chosen climate model, and investigations with alternative
models, including higher-resolution climate models with fully dynamical three-dimensional
oceans are warranted. Appropriate field experiments to test our conclusions, and to explore better
ways for simulating windmills in models, are also required.
Finally, intermittency of wind power on daily, monthly and longer time scales as computed in
these simulations and inferred from meteorological observations, poses a demand for one or
more options to ensure reliability, including backup generation capacity, very long distance
power transmission lines, and on-site energy storage, each with specific economic and/or
technological challenges.
145. REFERENCES
Archer, C.L. and M.Z. Jacobson, 2003: Spatial and temporal distributions of U.S. winds and
wind power at 80 m derived from measurements. J. Geophys. Res., 108(4289),
doi:10.1029/2002JD002076.
Baidya Roy, S., S.W. Pacala and R.L. Walko, 2004: Can large wind farms affect local
meteorology?. J. Geophys. Res., 109(D19101).
Carter, H. G., 1926: Wind as motive power for electrical generators. Mon. Wea. Rev., 54: 374-
376.
Crespo, A., J.H. Hernandez and S. Frandsen, 1999: Survey of modeling methods for wind
turbine wakes and wind farms. Wind Energy., 2: 1-24.
Dodson, L., K. Busawon, and M. Jovanovic, 2005: Estimation of the power coefficient in a wind
conversion system, Proc. 44th IEEE Conf. on Decision and Control, and the European
Control Conf. 2005, Seville, Spain, December 12-15, 2005.
Hewson, E.W., 1975: Generation of power from the wind, Bull. Amer. Meteor. Soc., 56: 660-
675.
IPCC, 2007: Climate Change 2007: The Physical Science Basis. Contribution of Working
Group I to the Fourth Assessment Report of the Intergovernmental Panel on Climate Change
[Solomon, S., D. Qin, M. Manning, Z. Chen, M. Marquis, K.B. Averyt, M. Tignor and H.L.
Miller (eds.)]. Cambridge University Press, Cambridge, United Kingdom and New York,
NY, USA, 996 pp.
Keith, D.W., J.F. DeCarolis, D.C. Denkenberger, D.H. Lenschow, S.L. Malyshev, S.n Pacala,
and P.J. Rasch, 2004: The influence of large-scale wind power on global climate, PNAS, 101:
16115-16120.
Kiehl, J.T., J.J. Hack, G.B. Bonan, B.A. Boville, D.L. Williams, and P.J. Rasch, 1998: The
National Center for Atmospheric Research Community Climate Model: CCM3. J. Climate,
11: 1131-1149.
Kirk-Davidoff, D.B. and D.W. Keith, 2008: On the Climate Impact of Surface Roughness
Anomalies, J. Atmos. Sci., 65: 2215-2234, doi: 10.1175/2007JAS2509.1.
Kulk, G. A.M. van, 2007: The Lanchester–Betz–Joukowsky limit, Wind Eneryg, 10: 289-291.
Lorenz, E.N., 1967: The Nature and Theory of the General Circulation of the Atmosphere,
WMO, Geneva, 161 pp.
Peixoto, J.P., and A.H. Oort, 1992: Physics of Climate, Amer. Inst. Phys., New York, 520 pp.
Reilly, J. and S. Paltsev, 2007: Biomass Energy and Competition for Land, Report No. 145, MIT
Joint Program on the Science and Policy of Global Change, Cambridge, MA. Available at:
http://web.mit.edu/globalchange/www/MITJPSPGC_Rpt145.pdf.
Stull, R.B., 1988: An Introduction to Boundary Layer Meteorology, Kluwer Acad. Pub.,
Dordrecht, 666 pp.
Wang, C., 2007: Impact of direct radiative forcing of black carbon aerosols on tropical
convective precipitation. Geophys. Res. Lett., 34(L05709), doi:10.1029/2006GL028416.
15REPORT SERIES of the MIT Joint Program on the Science and Policy of Global Change
1. Uncertainty in Climate Change Policy Analysis 28. Transient Climate Change and Net Ecosystem
Jacoby & Prinn December 1994 Production of the Terrestrial Biosphere
2. Description and Validation of the MIT Version of the Xiao et al. November 1997
GISS 2D Model Sokolov & Stone June 1995 29. Analysis of CO2 Emissions from Fossil Fuel in Korea:
3. Responses of Primary Production and Carbon Storage 1961–1994 Choi November 1997
to Changes in Climate and Atmospheric CO2 30. Uncertainty in Future Carbon Emissions: A Preliminary
Concentration Xiao et al. October 1995 Exploration Webster November 1997
4. Application of the Probabilistic Collocation Method 31. Beyond Emissions Paths: Rethinking the Climate Impacts
for an Uncertainty Analysis Webster et al. January 1996 of Emissions Protocols Webster & Reiner November 1997
5. World Energy Consumption and CO2 Emissions: 32. Kyoto’s Unfinished Business Jacoby et al. June 1998
1950-2050 Schmalensee et al. April 1996 33. Economic Development and the Structure of the
6. The MIT Emission Prediction and Policy Analysis Demand for Commercial Energy Judson et al. April 1998
(EPPA) Model Yang et al. May 1996 (superseded by No. 125) 34. Combined Effects of Anthropogenic Emissions and
7. Integrated Global System Model for Climate Policy Resultant Climatic Changes on Atmospheric OH
Analysis Prinn et al. June 1996 (superseded by No. 124) Wang & Prinn April 1998
8. Relative Roles of Changes in CO2 and Climate to 35. Impact of Emissions, Chemistry, and Climate on
Equilibrium Responses of Net Primary Production Atmospheric Carbon Monoxide Wang & Prinn April 1998
and Carbon Storage Xiao et al. June 1996 36. Integrated Global System Model for Climate Policy
9. CO2 Emissions Limits: Economic Adjustments and the Assessment: Feedbacks and Sensitivity Studies
Distribution of Burdens Jacoby et al. July 1997 Prinn et al. June 1998
10. Modeling the Emissions of N2O and CH4 from the 37. Quantifying the Uncertainty in Climate Predictions
Terrestrial Biosphere to the Atmosphere Liu Aug. 1996 Webster & Sokolov July 1998
11. Global Warming Projections: Sensitivity to Deep Ocean 38. Sequential Climate Decisions Under Uncertainty: An
Mixing Sokolov & Stone September 1996 Integrated Framework Valverde et al. September 1998
12. Net Primary Production of Ecosystems in China and 39. Uncertainty in Atmospheric CO2 (Ocean Carbon Cycle
its Equilibrium Responses to Climate Changes Model Analysis) Holian Oct. 1998 (superseded by No. 80)
Xiao et al. November 1996 40. Analysis of Post-Kyoto CO2 Emissions Trading Using
13. Greenhouse Policy Architectures and Institutions Marginal Abatement Curves Ellerman & Decaux Oct. 1998
Schmalensee November 1996 41. The Effects on Developing Countries of the Kyoto
14. What Does Stabilizing Greenhouse Gas Protocol and CO2 Emissions Trading
Concentrations Mean? Jacoby et al. November 1996 Ellerman et al. November 1998
15. Economic Assessment of CO2 Capture and Disposal 42. Obstacles to Global CO2 Trading: A Familiar Problem
Eckaus et al. December 1996 Ellerman November 1998
16. What Drives Deforestation in the Brazilian Amazon? 43. The Uses and Misuses of Technology Development as
Pfaff December 1996 a Component of Climate Policy Jacoby November 1998
17. A Flexible Climate Model For Use In Integrated 44. Primary Aluminum Production: Climate Policy,
Assessments Sokolov & Stone March 1997 Emissions and Costs Harnisch et al. December 1998
18. Transient Climate Change and Potential Croplands of 45. Multi-Gas Assessment of the Kyoto Protocol
the World in the 21st Century Xiao et al. May 1997 Reilly et al. January 1999
19. Joint Implementation: Lessons from Title IV’s Voluntary 46. From Science to Policy: The Science-Related Politics of
Compliance Programs Atkeson June 1997 Climate Change Policy in the U.S. Skolnikoff January 1999
20. Parameterization of Urban Subgrid Scale Processes 47. Constraining Uncertainties in Climate Models Using
in Global Atm. Chemistry Models Calbo et al. July 1997 Climate Change Detection Techniques
21. Needed: A Realistic Strategy for Global Warming Forest et al. April 1999
Jacoby, Prinn & Schmalensee August 1997 48. Adjusting to Policy Expectations in Climate Change
22. Same Science, Differing Policies; The Saga of Global Modeling Shackley et al. May 1999
Climate Change Skolnikoff August 1997 49. Toward a Useful Architecture for Climate Change
23. Uncertainty in the Oceanic Heat and Carbon Uptake Negotiations Jacoby et al. May 1999
and their Impact on Climate Projections 50. A Study of the Effects of Natural Fertility, Weather
Sokolov et al. September 1997 and Productive Inputs in Chinese Agriculture
24. A Global Interactive Chemistry and Climate Model Eckaus & Tso July 1999
Wang, Prinn & Sokolov September 1997 51. Japanese Nuclear Power and the Kyoto Agreement
25. Interactions Among Emissions, Atmospheric Babiker, Reilly & Ellerman August 1999
Chemistry & Climate Change Wang & Prinn Sept. 1997 52. Interactive Chemistry and Climate Models in Global
26. Necessary Conditions for Stabilization Agreements Change Studies Wang & Prinn September 1999
Yang & Jacoby October 1997 53. Developing Country Effects of Kyoto-Type Emissions
27. Annex I Differentiation Proposals: Implications for Restrictions Babiker & Jacoby October 1999
Welfare, Equity and Policy Reiner & Jacoby Oct. 1997
Contact the Joint Program Office to request a copy. The Report Series is distributed at no charge.REPORT SERIES of the MIT Joint Program on the Science and Policy of Global Change
54. Model Estimates of the Mass Balance of the 80. Uncertainty in Atmospheric CO2 Predictions from a
Greenland and Antarctic Ice Sheets Bugnion Oct 1999 Global Ocean Carbon Cycle Model
55. Changes in Sea-Level Associated with Modifications Holian et al. September 2001
of Ice Sheets over 21st Century Bugnion October 1999 81. A Comparison of the Behavior of AO GCMs in
56. The Kyoto Protocol and Developing Countries Transient Climate Change Experiments
Babiker et al. October 1999 Sokolov et al. December 2001
57. Can EPA Regulate Greenhouse Gases Before the 82. The Evolution of a Climate Regime: Kyoto to
Senate Ratifies the Kyoto Protocol? Marrakech Babiker, Jacoby & Reiner February 2002
Bugnion & Reiner November 1999 83. The “Safety Valve” and Climate Policy
58. Multiple Gas Control Under the Kyoto Agreement Jacoby & Ellerman February 2002
Reilly, Mayer & Harnisch March 2000 84. A Modeling Study on the Climate Impacts of Black
59. Supplementarity: An Invitation for Monopsony? Carbon Aerosols Wang March 2002
Ellerman & Sue Wing April 2000 85. Tax Distortions and Global Climate Policy
60. A Coupled Atmosphere-Ocean Model of Intermediate Babiker et al. May 2002
Complexity Kamenkovich et al. May 2000 86. Incentive-based Approaches for Mitigating
61. Effects of Differentiating Climate Policy by Sector: Greenhouse Gas Emissions: Issues and Prospects for
A U.S. Example Babiker et al. May 2000 India Gupta June 2002
62. Constraining Climate Model Properties Using 87. Deep-Ocean Heat Uptake in an Ocean GCM with
Optimal Fingerprint Detection Methods Forest et al. Idealized Geometry Huang, Stone & Hill
May 2000 September 2002
63. Linking Local Air Pollution to Global Chemistry and 88. The Deep-Ocean Heat Uptake in Transient Climate
Climate Mayer et al. June 2000 Change Huang et al. September 2002
64. The Effects of Changing Consumption Patterns on the 89. Representing Energy Technologies in Top-down
Costs of Emission Restrictions Lahiri et al. Aug 2000 Economic Models using Bottom-up Information
65. Rethinking the Kyoto Emissions Targets McFarland et al. October 2002
Babiker & Eckaus August 2000 90. Ozone Effects on Net Primary Production and Carbon
66. Fair Trade and Harmonization of Climate Change Sequestration in the U.S. Using a Biogeochemistry
Policies in Europe Viguier September 2000 Model Felzer et al. November 2002
67. The Curious Role of “Learning” in Climate Policy: 91. Exclusionary Manipulation of Carbon Permit
Should We Wait for More Data? Webster October 2000 Markets: A Laboratory Test Carlén November 2002
68. How to Think About Human Influence on Climate 92. An Issue of Permanence: Assessing the Effectiveness of
Forest, Stone & Jacoby October 2000 Temporary Carbon Storage Herzog et al. December 2002
69. Tradable Permits for Greenhouse Gas Emissions: 93. Is International Emissions Trading Always Beneficial?
A primer with reference to Europe Ellerman Nov 2000 Babiker et al. December 2002
70. Carbon Emissions and The Kyoto Commitment in the 94. Modeling Non-CO2 Greenhouse Gas Abatement
European Union Viguier et al. February 2001 Hyman et al. December 2002
71. The MIT Emissions Prediction and Policy Analysis 95. Uncertainty Analysis of Climate Change and Policy
Model: Revisions, Sensitivities and Results Response Webster et al. December 2002
Babiker et al. February 2001 (superseded by No. 125) 96. Market Power in International Carbon Emissions
72. Cap and Trade Policies in the Presence of Monopoly Trading: A Laboratory Test Carlén January 2003
and Distortionary Taxation Fullerton & Metcalf March ‘01 97. Emissions Trading to Reduce Greenhouse Gas
73. Uncertainty Analysis of Global Climate Change Emissions in the United States: The McCain-Lieberman
Projections Webster et al. Mar. ‘01 (superseded by No. 95) Proposal Paltsev et al. June 2003
74. The Welfare Costs of Hybrid Carbon Policies in the 98. Russia’s Role in the Kyoto Protocol Bernard et al. Jun ‘03
European Union Babiker et al. June 2001 99. Thermohaline Circulation Stability: A Box Model Study
75. Feedbacks Affecting the Response of the Lucarini & Stone June 2003
Thermohaline Circulation to Increasing CO2 100. Absolute vs. Intensity-Based Emissions Caps
Kamenkovich et al. July 2001 Ellerman & Sue Wing July 2003
76. CO2 Abatement by Multi-fueled Electric Utilities: 101. Technology Detail in a Multi-Sector CGE Model:
An Analysis Based on Japanese Data Transport Under Climate Policy Schafer & Jacoby July 2003
Ellerman & Tsukada July 2001 102. Induced Technical Change and the Cost of Climate
77. Comparing Greenhouse Gases Reilly et al. July 2001 Policy Sue Wing September 2003
78. Quantifying Uncertainties in Climate System 103. Past and Future Effects of Ozone on Net Primary
Properties using Recent Climate Observations Production and Carbon Sequestration Using a Global
Forest et al. July 2001 Biogeochemical Model Felzer et al. (revised) January 2004
79. Uncertainty in Emissions Projections for Climate 104. A Modeling Analysis of Methane Exchanges
Models Webster et al. August 2001 Between Alaskan Ecosystems and the Atmosphere
Zhuang et al. November 2003
Contact the Joint Program Office to request a copy. The Report Series is distributed at no charge.REPORT SERIES of the MIT Joint Program on the Science and Policy of Global Change
105. Analysis of Strategies of Companies under Carbon 130. Absolute vs. Intensity Limits for CO2 Emission
Constraint Hashimoto January 2004 Control: Performance Under Uncertainty
106. Climate Prediction: The Limits of Ocean Models Sue Wing et al. January 2006
Stone February 2004 131. The Economic Impacts of Climate Change: Evidence
107. Informing Climate Policy Given Incommensurable from Agricultural Profits and Random Fluctuations in
Benefits Estimates Jacoby February 2004 Weather Deschenes & Greenstone January 2006
108. Methane Fluxes Between Terrestrial Ecosystems 132. The Value of Emissions Trading Webster et al. Feb. 2006
and the Atmosphere at High Latitudes During the 133. Estimating Probability Distributions from Complex
Past Century Zhuang et al. March 2004 Models with Bifurcations: The Case of Ocean
109. Sensitivity of Climate to Diapycnal Diffusivity in the Circulation Collapse Webster et al. March 2006
Ocean Dalan et al. May 2004 134. Directed Technical Change and Climate Policy
110. Stabilization and Global Climate Policy Otto et al. April 2006
Sarofim et al. July 2004 135. Modeling Climate Feedbacks to Energy Demand:
111. Technology and Technical Change in the MIT EPPA The Case of China Asadoorian et al. June 2006
Model Jacoby et al. July 2004 136. Bringing Transportation into a Cap-and-Trade
112. The Cost of Kyoto Protocol Targets: The Case of Regime Ellerman, Jacoby & Zimmerman June 2006
Japan Paltsev et al. July 2004 137. Unemployment Effects of Climate Policy Babiker &
113. Economic Benefits of Air Pollution Regulation in the Eckaus July 2006
USA: An Integrated Approach Yang et al. (revised) Jan. 2005 138. Energy Conservation in the United States:
114. The Role of Non-CO2 Greenhouse Gases in Climate Understanding its Role in Climate Policy Metcalf Aug. ‘06
Policy: Analysis Using the MIT IGSM Reilly et al. Aug. ‘04 139. Directed Technical Change and the Adoption of CO2
115. Future U.S. Energy Security Concerns Deutch Sep. ‘04 Abatement Technology: The Case of CO2 Capture and
116. Explaining Long-Run Changes in the Energy Storage Otto & Reilly August 2006
Intensity of the U.S. Economy Sue Wing Sept. 2004 140. The Allocation of European Union Allowances:
117. Modeling the Transport Sector: The Role of Existing Lessons, Unifying Themes and General Principles
Fuel Taxes in Climate Policy Paltsev et al. November 2004 Buchner et al. October 2006
118. Effects of Air Pollution Control on Climate 141. Over-Allocation or Abatement? A preliminary
Prinn et al. January 2005 analysis of the EU ETS based on the 2006 emissions data
119. Does Model Sensitivity to Changes in CO2 Provide a Ellerman & Buchner December 2006
Measure of Sensitivity to the Forcing of Different 142. Federal Tax Policy Towards Energy Metcalf Jan. 2007
Nature? Sokolov March 2005 143. Technical Change, Investment and Energy Intensity
120. What Should the Government Do To Encourage Kratena March 2007
Technical Change in the Energy Sector? Deutch May ‘05 144. Heavier Crude, Changing Demand for Petroleum
121. Climate Change Taxes and Energy Efficiency in Fuels, Regional Climate Policy, and the Location of
Japan Kasahara et al. May 2005 Upgrading Capacity Reilly et al. April 2007
122. A 3D Ocean-Seaice-Carbon Cycle Model and its 145. Biomass Energy and Competition for Land
Coupling to a 2D Atmospheric Model: Uses in Climate Reilly & Paltsev April 2007
Change Studies Dutkiewicz et al. (revised) November 2005 146. Assessment of U.S. Cap-and-Trade Proposals
123. Simulating the Spatial Distribution of Population Paltsev et al. April 2007
and Emissions to 2100 Asadoorian May 2005 147. A Global Land System Framework for Integrated
124. MIT Integrated Global System Model (IGSM) Climate-Change Assessments Schlosser et al. May 2007
Version 2: Model Description and Baseline Evaluation 148. Relative Roles of Climate Sensitivity and Forcing in
Sokolov et al. July 2005 Defining the Ocean Circulation Response to Climate
125. The MIT Emissions Prediction and Policy Analysis Change Scott et al. May 2007
(EPPA) Model: Version 4 Paltsev et al. August 2005 149. Global Economic Effects of Changes in Crops,
126. Estimated PDFs of Climate System Properties Pasture, and Forests due to Changing Climate, CO2
Including Natural and Anthropogenic Forcings and Ozone Reilly et al. May 2007
Forest et al. September 2005 150. U.S. GHG Cap-and-Trade Proposals: Application of a
127. An Analysis of the European Emission Trading Forward-Looking Computable General Equilibrium
Scheme Reilly & Paltsev October 2005 Model Gurgel et al. June 2007
128. Evaluating the Use of Ocean Models of Different 151. Consequences of Considering Carbon/Nitrogen
Complexity in Climate Change Studies Interactions on the Feedbacks between Climate and
Sokolov et al. November 2005 the Terrestrial Carbon Cycle Sokolov et al. June 2007
129. Future Carbon Regulations and Current Investments 152. Energy Scenarios for East Asia: 2005-2025 Paltsev &
in Alternative Coal-Fired Power Plant Designs Reilly July 2007
Sekar et al. December 2005 153. Climate Change, Mortality, and Adaptation:
Evidence from Annual Fluctuations in Weather in the U.S.
Deschênes & Greenstone August 2007
Contact the Joint Program Office to request a copy. The Report Series is distributed at no charge.REPORT SERIES of the MIT Joint Program on the Science and Policy of Global Change
175. Potential Climatic Impacts and Reliability of Very
154. Modeling the Prospects for Hydrogen Powered Large Scale Wind Farms Wang & Prinn June 2009
Transportation Through 2100 Sandoval et al.
February 2008
155. Potential Land Use Implications of a Global Biofuels
Industry Gurgel et al. March 2008
156. Estimating the Economic Cost of Sea-Level Rise
Sugiyama et al. April 2008
157. Constraining Climate Model Parameters from
Observed 20th Century Changes Forest et al. April 2008
158. Analysis of the Coal Sector under Carbon
Constraints McFarland et al. April 2008
159. Impact of Sulfur and Carbonaceous Emissions from
International Shipping on Aerosol Distributions and
Direct Radiative Forcing Wang & Kim April 2008
160. Analysis of U.S. Greenhouse Gas Tax Proposals
Metcalf et al. April 2008
161. A Forward Looking Version of the MIT Emissions
Prediction and Policy Analysis (EPPA) Model
Babiker et al. May 2008
162. The European Carbon Market in Action: Lessons
from the first trading period Interim Report
Convery, Ellerman, & de Perthuis June 2008
163. The Influence on Climate Change of Differing
Scenarios for Future Development Analyzed Using
the MIT Integrated Global System Model Prinn et al.
September 2008
164. Marginal Abatement Costs and Marginal Welfare
Costs for Greenhouse Gas Emissions Reductions:
Results from the EPPA Model Holak et al. November 2008
165. Uncertainty in Greenhouse Emissions and Costs of
Atmospheric Stabilization Webster et al. November
2008
166. Sensitivity of Climate Change Projections to
Uncertainties in the Estimates of Observed Changes
in Deep-Ocean Heat Content Sokolov et al. November
2008
167. Sharing the Burden of GHG Reductions Jacoby et al.
November 2008
168. Unintended Environmental Consequences of a
Global Biofuels Program Melillo et al. January 2009
169. Probabilistic Forecast for 21st Century Climate
Based on Uncertainties in Emissions (without Policy)
and Climate Parameters Sokolov et al. January 2009
170. The EU’s Emissions Trading Scheme: A Proto-type
Global System? Ellerman February 2009
171. Designing a U.S. Market for CO2 Parsons et al.
February 2009
172. Prospects for Plug-in Hybrid Electric Vehicles in the
United States & Japan: A General Equilibrium Analysis
Karplus et al. April 2009
173. The Cost of Climate Policy in the United States
Paltsev et al. April 2009
174. A Semi-Empirical Representation of the Temporal
Variation of Total Greenhouse Gas Levels Expressed
as Equivalent Levels of Carbon Dioxide Huang et al.
June 2009
Contact the Joint Program Office to request a copy. The Report Series is distributed at no charge.You can also read