APPENDIX D Acoustic and Explosive Concepts - Atlantic Fleet Training and Testing Final EIS/OEIS - Defense.gov
←
→
Page content transcription
If your browser does not render page correctly, please read the page content below
Atlantic Fleet
Training and Testing Final EIS/OEIS                                       September 2018

                                    APPENDIX D
                            Acoustic and Explosive Concepts

                                                Appendix D Acoustic and Explosive Concepts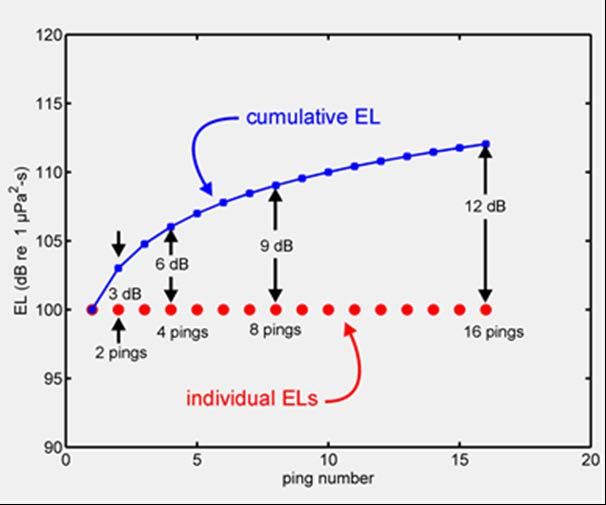
Atlantic Fleet
Training and Testing Final EIS/OEIS                                                          September 2018

                                      This page intentionally left blank.

                                                                   Appendix D Acoustic and Explosive Concepts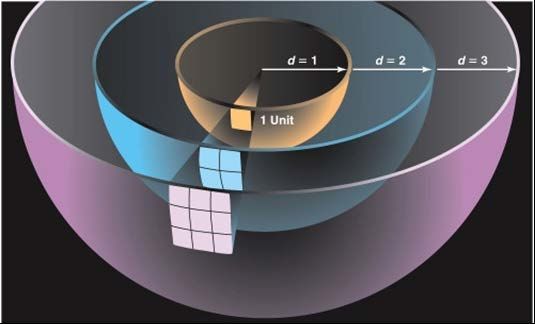
Atlantic Fleet
Training and Testing Final EIS/OEIS                                                                                             September 2018

                                      Final
  Environmental Impact Statement/Overseas Environmental Impact Statement
                 Atlantic Fleet Training and Testing Activities

                                                   TABLE OF CONTENTS
APPENDIX D                ACOUSTIC AND EXPLOSIVE CONCEPTS _______________________________ D-1
      D.1      Terminology ............................................................................................................. D-1
               D.1.1      Sound .................................................................................................................... D-1
               D.1.2      Signal versus Noise................................................................................................ D-1
               D.1.3      Frequency and Wavelength .................................................................................. D-2
               D.1.4      Sound Amplitude .................................................................................................. D-2
               D.1.5      Impulsive versus Non-Impulsive Sounds............................................................... D-3
               D.1.6      Acoustic Impedance .............................................................................................. D-3
               D.1.7      Duty Cycle ............................................................................................................. D-3
               D.1.8      Resonance ............................................................................................................. D-3
      D.2      Sound Metrics .......................................................................................................... D-4
               D.2.1      Pressure ................................................................................................................ D-4
               D.2.2      Sound Pressure Level ............................................................................................ D-4
               D.2.3      Sound Exposure Level ........................................................................................... D-5
               D.2.4      Particle Motion ..................................................................................................... D-7
               D.2.5      Impulse.................................................................................................................. D-7
      D.3      Predicting How Sound Travels ................................................................................... D-7
               D.3.1      Speed of Sound ..................................................................................................... D-8
               D.3.2      Source Directivity .................................................................................................. D-9
               D.3.3      Sound Attenuation ................................................................................................ D-9
                          D.3.3.1        Geometrical Spreading Loss ............................................................... D-10
                          D.3.3.2        Absorption .......................................................................................... D-11
                          D.3.3.3        Refraction ........................................................................................... D-11
                          D.3.3.4        Reflection and Multipath Propagation ............................................... D-12
                          D.3.3.5        Diffraction, Scattering, and Reverberation ......................................... D-13
                          D.3.3.6        Surface and Bottom Effects ................................................................ D-13
                          D.3.3.7        Air-Water Interface ............................................................................. D-14
      D.4      Auditory Perception................................................................................................ D-15
      D.5      Explosives ............................................................................................................... D-17
               D.5.1      Explosions in Air .................................................................................................. D-18
                          D.5.1.1        Fragmentation .................................................................................... D-19
               D.5.2      Explosions in Water ............................................................................................ D-19

                                                                       i
                                                                                                                               Table of Contents
Atlantic Fleet
Training and Testing Final EIS/OEIS September 2018
List of Figures
Figure D-1: Various Sound Pressure Metrics for a Hypothetical (a) Pure Tone (Non-
Impulsive) and (b) Impulsive Sound..................................................................................... D-4
Figure D-2: Summation of Acoustic Energy from a Hypothetical, Intermittently Pinging,
Stationary Sound Source...................................................................................................... D-6
Figure D-3: Cumulative Sound Exposure Level under Realistic Conditions with a Moving,
Intermittently Pinging Sound Source ................................................................................... D-7
Figure D-4: Sound Velocity Profile (Sound Speed) Is Related to Temperature, Salinity, and
Hydrostatic Pressure of Seawater ....................................................................................... D-9
Figure D-5: Graphical Representation of the Inverse Square Relationship in Spherical
Spreading ........................................................................................................................... D-10
Figure D-6: Sound Propagation Showing Multipath Propagation and Conditions for Surface
Duct .................................................................................................................................... D-12
Figure D-7: Characteristics of Sound Transmission Through the Air-Water Interface ........................... D-15
Figure D-8: A-weighting for Human Hearing of Sounds in Air (OSHA).................................................... D-16
Figure D-9: Impulse Shown as a Function of Pressure over Duration at a Specific Location ................. D-18
List of Tables
This section does not contain tables.
ii
Table of ContentsAtlantic Fleet
Training and Testing Final EIS/OEIS September 2018
APPENDIX D ACOUSTIC AND EXPLOSIVE CONCEPTS
This section introduces basic principles and terminology for acoustics and explosives to help the reader
understand the analyses presented in this Environmental Impact Statement/Overseas Environmental
Impact Statement Draft (EIS/OEIS). This section briefly explains the transmission of sound and explosive
energy; introduces some of the basic mathematical formulas used to describe propagation; and defines
acoustical terms, abbreviations, and units of measurement. The difference between transmission of
sound in water and in air is also discussed. Finally, it discusses methods used to analyze what animals
may hear.
A number of other sources provide a more extensive background on acoustics and explosives than
presented in this overview and are recommended for further inquiry. These include, but are not limited
to:
• Marine Mammals and Noise (Richardson et al., 1995) for a general overview
• Principles of Underwater Sound (Urick, 1983), Fundamentals of Acoustical Oceanography
(Medwin & Clay, 1998), and Principles of Marine Bioacoustics (Au & Hastings, 2008) for
comprehensive explanations of underwater acoustics
D.1 TERMINOLOGY
The following terms are used in this document when discussing sound and the attributes of a sound
source.
D.1.1 SOUND
Sound is produced when an elastic medium (such as air or water) is set into motion, typically by a
vibrating object within the medium. As the object vibrates, its motion is transmitted to adjacent
“particles” of the medium. The motion of these particles is transmitted to adjacent particles, and so on.
The result is a mechanical disturbance (the “sound wave”) that moves away from the source and
propagates at a medium-dependent speed (the “sound speed”). As the sound wave travels through the
medium, the individual particles of the medium oscillate about their original positions but do not
actually move with the sound wave. As the particles of the medium move back and forth they create
small changes about the original values of the medium density, pressure, and temperature.
Sound may be described by both physical and subjective attributes. Physical attributes, such as sound
amplitude (Section D.1.4) and frequency (Section D.1.3), may be directly measured. Subjective (or
sensory) attributes like loudness and pitch depend on an animal’s perception of a sound. Physical
attributes of a sound at a particular point are usually obtained by measuring pressure changes as sound
waves pass.
D.1.2 SIGNAL VERSUS NOISE
When sound is purposely created to convey information, communicate, or obtain information about the
environment, it is often referred to as a signal. Examples of sounds that could be considered signals are
sonar pings, marine mammal vocalizations and echolocation clicks, tones used in hearing experiments,
and small sonobuoy explosions used for submarine detection.
Noise is undesired sound (American National Standards Institute, 1994). Sounds produced by naval
aircraft and vessel propulsion are considered noise because they represent possible inefficiencies and
increased detectability. Whether a sound is perceived as noise often depends on the receiver (i.e., the
D-1
Appendix D Acoustic and Explosive ConceptsAtlantic Fleet
Training and Testing Final EIS/OEIS September 2018
animal or system that detects the sound). For example, small explosives and sonar used to generate
sounds that can locate an enemy submarine produce signals that are useful to sailors engaged in anti-
submarine warfare, but are assumed to be noise when detected by marine mammals.
The combination of all sounds at a particular location, whether these sources are located near or far, is
ambient noise (American National Standards Institute, 1994). Ambient noise includes natural sources,
such as sound from crashing waves, rain, and animals (e.g., snapping shrimp), and anthropogenic
sources, such as seismic surveys and vessel noise.
D.1.3 FREQUENCY AND WAVELENGTH
Frequency is the physical attribute most closely associated with the subjective attribute “pitch”; the
higher the frequency, the higher the pitch. Frequency is defined by the number of oscillations in the
sound pressure or particle motion per second. One hertz (Hz) is equal to one oscillation per second, and
one kilohertz (kHz) is equal to 1,000 oscillations per second. Human hearing generally spans the
frequency range from 20 Hz to 20 kHz. The frequency range of a sound is called its bandwidth.
Pure tones have energy at a constant, single frequency. Complex tones contain energy at multiple,
discrete frequencies, rather than a single frequency. A harmonic of a sound at a particular frequency is a
multiple of that frequency (e.g., harmonic frequencies of a 2 kHz tone are 4 kHz, 6 kHz, 8 kHz, etc.). A
source operating at a nominal frequency may emit several harmonic frequencies, but at lower
amplitudes. Some sources may also emit subharmonics; however, these are typically many orders of
magnitude less powerful than at the center frequency. Sounds with large bandwidth (“broadband”
sounds) have energy spread across many frequencies.
In this document, sounds are generally described as either low- (less than 1 kHz), mid- (1 kHz–10 kHz),
high- (10 kHz–100 kHz), or very high- (greater than 100 kHz) frequency. Hearing ranges of marine
animals (e.g., fish, birds, sea turtles, and marine mammals) are quite varied and are species-dependent.
For example, some fish can hear sounds below 100 Hz and some species of marine mammals have
hearing capabilities that extend above 100 kHz. Acoustic impact analyses must therefore focus not only
on the sound amplitude (i.e., pressure or particle motion, see Section D.1.4), but on the sound
frequency and the hearing capabilities of the species being considered.
The wavelength of a sound is the distance between wave peaks. Wavelength decreases as frequency
increases. The frequency multiplied by the wavelength equals the speed of sound in a medium, as
shown in this equation:
Frequency (s-1) x wavelength (m) = sound speed (m/s)
The approximate speed of sound in sea water is 1500 m/s and in air is 340 m/s, although speed varies
depending on environmental conditions (e.g., pressure, temperature, and, in the case of sea water,
salinity; see Section D.3.1, Speed of Sound).
D.1.4 SOUND AMPLITUDE
Sound amplitude is the physical attribute most closely associated with the subjective attribute loudness.
Amplitude is related to the amount that the medium particles oscillate about their original positions and
can be thought of as the “strength” of a sound (as the amplitude increases, the loudness also increases).
As the sound wave travels, the particles of the medium oscillate but do not actually travel with the
wave. The result is a mechanical disturbance (i.e., the sound wave) that propagates away from the
sound source.
D-2
Appendix D Acoustic and Explosive ConceptsAtlantic Fleet
Training and Testing Final EIS/OEIS September 2018
Sound amplitude is typically characterized by measuring the acoustic pressure or particle motion (see
Section D.2, Sound Metrics).
D.1.5 IMPULSIVE VERSUS NON-IMPULSIVE SOUNDS
Although no standard definitions exist, sounds may be broadly categorized as impulsive or non-
impulsive. Impulsive sounds have short durations, rapid rise-times, broad frequency content, and high
peak sound pressures. Impulsive sounds are often produced by processes involving a rapid release of
energy or mechanical impacts (Hamernik & Hsueh, 1991). Explosions, air guns, weapon firing, and
impact pile driving are examples of impulsive sound sources analyzed in this document. In contrast,
sonars, vessel operation, vibratory pile driving, and underwater transducers lack the characteristics of
impulsive sources and are thus examples of non-impulsive sound sources. Non-impulsive sounds can be
essentially continuous, such as machinery noise, or intermittent, such as sonar pings.
D.1.6 ACOUSTIC IMPEDANCE
Acoustic impedance is a property of the propagation medium (air, water, or tissue) that can be simply
described as the opposition to flow of a pressure wave. Acoustic impedance is a function of the density
and speed of sound in a medium. Sound transmits more readily through materials of similar acoustic
impedance, such as water and animal tissue. When sound waves encounter a medium with different
acoustic impedance (for example, an air-water interface), they reflect and refract (see Sections D.3.3.3,
Refraction, and D.3.3.4 Reflection and Multipath Propagation), creating more complex propagation
conditions. For example, sound traveling in air (low impedance) encountering the water surface (high
impedance) will be largely reflected, preventing most sound energy in the air from being transmitted
into the water. The impedance difference at the tissue-air interface in animals with gas-containing
organs also makes these areas susceptible to damage when exposed to the shock wave near an
explosion, since the transmission from high-impedance to low-impedance can result in large motion at
the boundary.
D.1.7 DUTY CYCLE
Duty cycle describes the portion of time that a sound source actually generates sound. It is defined as
the percentage of time during which a sound is generated over a total operational time period. For
example, if a sonar source produces a one-second ping once every 10 seconds, the duty cycle is 10
percent. Duty cycles vary among different acoustic sources; in general, a low duty cycle could be
considered 20 percent or less and a high duty cycle 80 percent or higher.
D.1.8 RESONANCE
Resonance occurs when an object is vibrated at a frequency near its “natural frequency” or resonant
frequency. The resonant frequency can be considered the preferred frequency at which an object will
oscillate at a greater magnitude than when exposed to other frequencies. In this document, resonance is
considered in relation to the size of an air bubble or air cavity in an animal that is exposed to high
pressure waves and the potential for injury. The natural frequencies of dolphin and beluga lungs near
the surface are about 36 Hz and 30 Hz, respectively (Finneran, 2003), the natural frequency of lungs of a
large whale would be lower, while the natural frequency of small air bubbles would be much higher.
Resonant frequencies would tend to increase as an animal dives, since the increased water pressure
would compress an air-filled structure and reduce its size.
D-3
Appendix D Acoustic and Explosive ConceptsAtlantic Fleet
Training and Testing Final EIS/OEIS September 2018
D.2 SOUND METRICS
The sound metrics described here are used in this document to quantify exposure to a sound or
explosion.
D.2.1 PRESSURE
Sound pressure is the incremental variation in a medium’s static pressure as a sound wave travels
through it. Sound pressure is typically expressed in units of pascals (Pa) (1 Pa = 1 N/m2 = 10 µbar =
1.45×10⁻⁴ psi), although explosive overpressure may also be described in pounds per square inch (psi).
Various sound pressure metrics are illustrated in Figure D-1 for (a) a non-impulsive sound (a pure tone in
this illustration) and (b) an impulsive sound. As shown in Figure D-1, the non-impulsive sound has a
relatively gradual rise in pressure from static pressure (the ambient pressure without the added sound),
while the impulsive sound has a near-instantaneous rise to a high peak pressure. The peak pressure
shown on both illustrations is the maximum absolute value of the instantaneous sound pressure during
a specified time interval (“zero-to-peak” or “peak”), which accounts for the values of peak pressures
below the static (ambient) pressure (American National Standards Institute, 2013). “Peak-to-peak”
pressure is the difference between the maximum and minimum sound pressures. The root-mean-square
(rms) value is often used to describe the average sound pressure level of sounds, and sound pressure
levels provided in this EIS/OEIS are root-mean-square values unless otherwise specified. As the name
suggests, this method takes the square root of the average squared sound pressure values over a time
interval. The duration of this time interval can have a strong effect on the measured rms sound pressure
for a given sound, especially where pressure levels vary significantly, as during an impulsive sound
exposure. If the analysis duration includes a significant portion of the waveform after the sound
pressure has returned to zero, the rms pressure would be relatively low. If the analysis duration includes
only the highest pressures of the impulsive exposure, the rms value would be comparatively high. For
this reason, it is important to specify the duration used to calculate the rms pressure for impulsive
sounds.
Figure D-1: Various Sound Pressure Metrics for a Hypothetical (a) Pure Tone (Non-Impulsive) and
(b) Impulsive Sound
D.2.2 SOUND PRESSURE LEVEL
The most common sound level metric is sound pressure level (SPL). Because many animals can detect
very large pressure ranges and judge the relative loudness of sounds by the ratio of the sound pressures
(a logarithmic behavior), sound pressure level (SPL) is described by taking the logarithm of the ratio of
the sound pressure to a reference pressure. Use of a logarithmic scale compresses the wide range of
measured pressure values into a more useful scale.
D-4
Appendix D Acoustic and Explosive ConceptsAtlantic Fleet
Training and Testing Final EIS/OEIS September 2018
Sound pressure levels are normally expressed in decibels (dB). A dB is 1/10 of a bel, a unit of level when
the logarithm is to the base ten and the quantities concerned are proportional to power (American
National Standards Institute, 2013). Sound pressure level in dBs is calculated as follows:
where P is the sound pressure and Pref is the reference pressure. Unless stated otherwise, the pressure P
is the rms value of the pressure (American National Standards Institute, 2013). In some situations, SPL is
calculated for the peak pressure rather than the rms pressure. On the occasions when rms pressure is
not used, the pressure metric will be stated (e.g., peak SPL means an SPL calculated using the peak
pressure rather than the rms pressure).
When a value is presented in dBs, it is important to also specify the value and units of the reference
quantity. Normally the numeric value is given, followed by the text “re,” meaning “with reference to,”
and the numeric value and unit of the reference quantity. For example, a pressure of 1 Pa, expressed in
dBs with a reference of 1 micropascal (µPa), is written 120 dB re 1 µPa. The standard reference
pressures are 1 µPa for water and 20 µPa for air. The reference pressure for air, 20 µPa, is the
approximate lowest threshold of human hearing. It is important to note that because of the differences
in reference units, the same sound pressures would result in different SPL values for each medium (the
same sound pressure measured in water and in air would result in a higher SPL in water than in air, since
the in-air reference is larger). Therefore, sound pressure levels in air and in water should never be
directly compared.
D.2.3 SOUND EXPOSURE LEVEL
Sound exposure level (SEL) can be thought of as a composite metric that represents both the SPL of a
sound and its duration. Individual time-varying noise events (e.g., a series of sonar pings or an impulsive
sound) have two main characteristics: (1) a sound pressure that changes throughout the event and (2) a
period of time during which the source is exposed to the sound. SEL can be provided for a single
exposure (i.e., a single sonar ping or single explosive detonation) or for an entire acoustic event (i.e.,
multiple sonar pings or multiple explosive detonations). Cumulative SEL provides a measure of the net
exposure of the entire acoustic event, but it does not directly represent the sound level heard at any
given time. SEL is determined by calculating the dB level of the cumulative sum-of-squared pressures
over the duration of a sound, with units of dB re 1 micropascal squared seconds (re 1 µPa2-s) for sounds
in water and dB re (20 micropascal) squared seconds [dB re (20 µPa)2-s] for sounds in air.
Some rules of thumb for SEL are as follows:
• The numeric value of SEL is equal to the SPL of a 1-second sound that has the same total
energy as the exposure event. If the sound duration is 1 second, SPL and SEL have the same
numeric value (but not the same reference quantities). For example, a 1 second sound with
an SPL of 100 dB re 1 µPa has a SEL of 100 dB re 1 µPa2-s.
• If the sound duration is constant but the SPL changes, SEL will change by the same number
of dBs as the SPL.
• If the SPL is held constant and the duration (T) changes, SEL will change as a function of
10log10(T):
o 10 log10 (10) = 10, so increasing duration by a factor of 10 raises SEL by 10 dB.
D-5
Appendix D Acoustic and Explosive ConceptsAtlantic Fleet
Training and Testing Final EIS/OEIS September 2018
o 10 log10 (0.1) = -10, so decreasing duration by a factor of 10 lowers SEL by 10 dB.
o Since 10 log10 (2) ≈ 3, so doubling the duration increases SEL by 3 dB.
o 10 log10 (1/2) ≈ -3, so halving the duration lowers SEL by 3 dB.
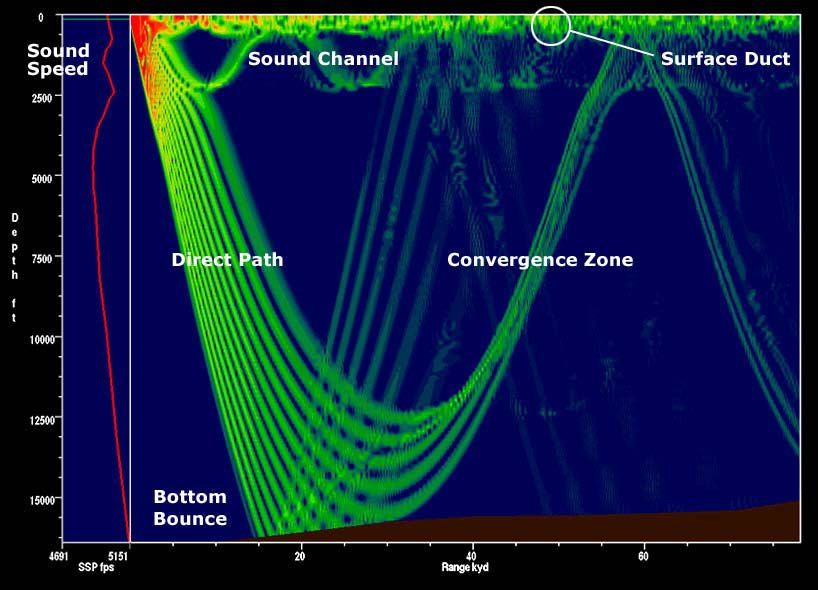
Figure D-2 illustrates the summation of energy for a succession of sonar pings. In this hypothetical case,
each ping has the same duration and SPL. The SEL at a particular location from each individual ping is
100 dB re 1 µPa2-s (red circles). The upper, blue curve shows the running total or cumulative SEL.
(EL = Exposure Level [i.e., Sound Exposure Level])
Figure D-2: Summation of Acoustic Energy from a Hypothetical, Intermittently Pinging, Stationary
Sound Source
After the first ping, the cumulative SEL is 100 dB re 1 µPa2-s. Since each ping has the same duration and
SPL, receiving two pings is the same as receiving a single ping with twice the duration. The cumulative
SEL from two pings is therefore 103 dB re 1 µPa2-s. The cumulative SEL from four pings is 3 dB higher
than the cumulative SEL from two pings, or 106 dB re 1 µPa2-s. Each doubling of the number of pings
increases the cumulative SEL by 3 dB.
Figure D-3 shows a more realistic example where the individual pings do not have the same SPL or SEL.
These data were recorded from a stationary hydrophone as a sound source approached, passed, and
moved away from the hydrophone. As the source approached the hydrophone, the received SPL from
each ping increased, causing the SEL of each ping to increase. After the source passed the hydrophone,
the received SPL and SEL from each ping decreased as the source moved farther away (downward trend
of red line), although the cumulative SEL increased with each additional ping received (slight upward
trend of blue line). The main contributions are from those pings with the highest individual SELs.
Individual pings with SELs 10 dB or more below the ping with the highest level contribute little (less than
0.5 dB) to the total cumulative SEL. This is shown in Figure D-3, where only a small error is introduced by
summing the energy from the eight individual pings with SEL greater than 185 dB re 1 µPa2-s (black line),
as opposed to including all pings (blue line).
D-6
Appendix D Acoustic and Explosive ConceptsAtlantic Fleet
Training and Testing Final EIS/OEIS September 2018
(EL = Exposure Level [i.e., Sound Exposure Level])
Figure D-3: Cumulative Sound Exposure Level under Realistic Conditions with a Moving,
Intermittently Pinging Sound Source
D.2.4 PARTICLE MOTION
The particles of a medium (e.g., water or air) oscillate around their original position as a sound wave
passes. This motion is quantified using average displacement (m or dB re 1pm), velocity (m/s or dB re 1
nm/s2), and acceleration (m/s2 or dB re 1 µm/s2) of the particles (Nedelec et al., 2016). Note that particle
velocity is not the same as sound speed, which is how fast a sound wave moves through a medium.
Particle motion is directional, whereas pressure measurement is not (Nedelec et al., 2016).
Far from a sound source and without any boundaries that could cause wave interference, particle
velocity is directly proportional to sound pressure. Closer to a sound source, particle velocity begins to
increase relative to sound pressure. Because this phenomena is related to wavelength, it may be
relevant only when very close to sound sources with extremely low frequencies.
D.2.5 IMPULSE
Impulse is a metric used to describe the pressure and time component of a pressure wave. Impulse is
typically only considered for high energy exposures to impulsive sources, such as exposures close to
explosives. Specifically, positive impulse is the time integral of the initial peak positive pressure with
units of Pascal-seconds (Pa-s). Impulse is a measured quantity that is distinct from the term “impulsive,”
which is not a measurement term, but rather describes a type of sound.
D.3 PREDICTING HOW SOUND TRAVELS
While the concept of a sound wave traveling from its source to a receptor is relatively simple, sound
propagation is quite complex because of the simultaneous presence of numerous sound waves of
different frequencies and source levels, and other phenomena such as reflections of sound waves and
subsequent constructive (additive) or destructive (cancelling) interferences between reflected and
incident waves. Other factors such as refraction, diffraction, bottom types, and surface conditions also
D-7
Appendix D Acoustic and Explosive ConceptsAtlantic Fleet
Training and Testing Final EIS/OEIS September 2018
affect sound propagation. While simple examples are provided here for illustration, the Navy Acoustic
Effects Model used to quantify acoustic exposures to marine mammals and sea turtles takes into
account the influence of multiple factors to predict acoustic propagation [see technical report
Quantifying Acoustic Impacts on Marine Mammals and Sea Turtles: Methods and Analytical Approach
for Phase III Training and Testing (U.S. Department of the Navy, 2018)].
D.3.1 SPEED OF SOUND
The speed of sound is not affected by the SPL or frequency of the sound, but rather depends wholly on
characteristics of the medium through which it is passing (e.g., the density and the compressibility).
Sound travels faster through a medium that is harder to compress. For example, water is more difficult
to compress than air, and sound travels approximately 340 m/s in air and 1,500 m/s in seawater.
The speed of sound in air is primarily influenced by temperature, relative humidity, and pressure,
because these factors affect the density and compressibility of air. Generally, the speed of sound in air
increases as air temperature increases.
The speed of sound in seawater also increases with increasing temperature and, to a lesser degree, with
increasing hydrostatic pressure and salinity. Figure D-4 shows an example of how these attributes can
change with depth. In seawater, temperature has the most important effect on sound speed for depths
less than about 300 m. Below 1,500 m, the increasing hydrostatic pressure is the dominant factor
because the water temperature is relatively constant. The variation of sound speed with depth in the
ocean is called a sound velocity profile.
D-8
Appendix D Acoustic and Explosive ConceptsAtlantic Fleet
Training and Testing Final EIS/OEIS September 2018
Source: http://blogs.oregonstate.edu/bioacoustics/2014/10/21/talk-weather/
Figure D-4: Sound Velocity Profile (Sound Speed) Is Related to Temperature, Salinity, and
Hydrostatic Pressure of Seawater
D.3.2 SOURCE DIRECTIVITY
Most sonar and other active acoustic sources do not radiate sound in all directions. Rather, they emit
sounds over a limited range of angles, in order to focus sound energy on a specific area or object of
interest. The specific angles are sometimes given as horizontal or vertical beam width. Some sources can
be described qualitatively as “forward-looking,” when sound energy is radiated in a limited direction in
front of the source, or “downward-looking,” when sound energy is directed toward the bottom.
D.3.3 SOUND ATTENUATION
As a sound wave passes through a medium, the sound level decreases with distance from the sound
source. This phenomenon is known as attenuation, which is described in terms of transmission loss (TL).
The transmission loss is used to relate the source SPL (SL), defined as the SPL produced by a sound
source at a distance of one meter, and the received SPL (RL) at a particular location, as follows:
RL = SL – TL
D-9
Appendix D Acoustic and Explosive ConceptsAtlantic Fleet
Training and Testing Final EIS/OEIS September 2018
The main contributors to sound attenuation are as follows (Urick, 1983):
• Geometric spreading of the sound wave as it propagates away from the source
• Sound absorption (conversion of sound energy into heat)
• Scattering, diffraction, multipath interference, and boundary effects
D.3.3.1 Geometrical Spreading Loss
Spreading loss is a geometric effect representing regular weakening of a sound wave as it spreads out
from a source. Spreading describes the reduction in sound pressure caused by the increase in surface
area as the distance from a sound source increases. Spherical and cylindrical spreading are common
types of spreading loss.
In the simple case of sound propagating from a point source without obstruction or reflection, the
sound waves take on the shape of an expanding sphere. An example of spherical spreading loss is shown
in Figure D-5. As spherical propagation continues, the sound energy is distributed over an ever-larger
area following the inverse square law: the pressure of a sound wave decreases inversely with the square
of the distance between the source and the receptor. For example, doubling the distance between the
receptor and a sound source results in a reduction in the pressure of the sound to one-fourth of its
initial value; tripling the distance results in one-ninth of the original pressure, and so on. Since the
surface area of a sphere is 4πr2, where r is the sphere radius, the change in SPL with distance r from the
source is proportional to the radius squared. This relationship is known as the spherical spreading law.
The transmission loss for spherical spreading between two locations is:
TL = 20 log10 (r2/r1)
where r1 and r2 are distances from the source. Spherical spreading results in a 6 dB reduction in SPL for
each doubling of distance from the sound source. For example, calculated transmission loss for spherical
spreading is 40 dB at 100 m and 46 dB at 200 m.
Figure D-5: Graphical Representation of the Inverse Square Relationship in Spherical Spreading
D-10
Appendix D Acoustic and Explosive ConceptsAtlantic Fleet
Training and Testing Final EIS/OEIS September 2018
In cylindrical spreading, spherical waves expanding from the source are constrained by the water surface
and the seafloor and take on a cylindrical shape. In this case the sound wave expands in the shape of a
cylinder rather than a sphere, and the transmission loss is:
TL = 10log10(r2/r1)
Cylindrical spreading is an approximation of sound propagation in a water-filled channel with horizontal
dimensions much larger than the depth. Cylindrical spreading predicts a 3 dB reduction in SPL for each
doubling of distance from the source. For example, calculated transmission loss for cylindrical spreading
is 30 dB at 1,000 m and 33 dB at 2,000 m.
The cylindrical and spherical spreading equations above represent two simple hypothetical cases. In
reality, geometric spreading loss is more spherical near a source and more cylindrical with distance, and
is better predicted using more complex models that account for environmental variables, such as the
Navy Acoustic Effects Model [see technical report Quantifying Acoustic Impacts on Marine Mammals
and Sea Turtles: Methods and Analytical Approach for Phase III Training and Testing (U.S. Department of
the Navy, 2018)].
However, when conducting simple spreading loss calculations in near shore environments, “practical
spreading loss” can be applied, where:
TL = 15log10(r2/r1)
Practical spreading loss accounts for other realistic losses in the environment, such as absorption and
scattering, which are not accounted for in geometrical spreading.
D.3.3.2 Absorption
Absorption is the conversion of acoustic energy to kinetic energy in the particles of the propagation
medium (Urick, 1983). Absorption is directly related to sound frequency, with higher frequencies having
higher rates of absorption. Absorption rates range from 0.07 dB/km for a 1 kHz sound to about 30
dB/km for a 100 kHz sound. Therefore, absorption is the cause of a significant amount of attenuation for
high and very high frequency sound sources, reducing the distance over which these sources may be
perceived compared to mid- and low-frequency sound sources with the same source level.
D.3.3.3 Refraction
When a sound wave propagating in a medium encounters a second medium with a different density
(e.g., the air-water boundary), part of the incident sound will be reflected back into the first medium
and part will be transmitted into the second medium (Kinsler et al., 1982). The propagation direction will
change as the sound wave enters the second medium; this phenomenon is called refraction. Refraction
may also occur within a single medium if the properties of the medium change enough to cause a
variation in the sound speed. Refraction of sound resulting from spatial variations in the sound speed is
one of the most important phenomena that affect sound propagation in water (Urick, 1983).
As discussed in Section D.3.1 (Speed of Sound), the sound speed in the ocean primarily depends on
hydrostatic pressure (i.e., depth) and temperature. Although the actual variations in sound speed are
small, the existence of sound speed gradients in the ocean has an enormous effect on the propagation
of sound in the ocean. If one pictures sound as rays emanating from an underwater source, the
propagation of these rays changes as a function of the sound speed profile in the water column.
Specifically, the directions of the rays bend toward regions of slower sound speed. This phenomenon
creates ducts in which sound becomes “trapped,” allowing it to propagate with high efficiency for large
D-11
Appendix D Acoustic and Explosive ConceptsAtlantic Fleet
Training and Testing Final EIS/OEIS September 2018
distances within certain depth boundaries. During winter months, the reduced sound speed at the
surface due to cooling can create a surface duct that efficiently propagates sound such as commercial
shipping noise (Figure D-6). Sources located within this surface duct can have their sounds trapped, but
sources located below this layer would have their sounds refracted downward. The deep sound channel,
or sound frequency and ranging (SOFAR) channel, is another duct that exists where sound speeds are
slowest deeper in the water column (600–1,200 m depth at the mid-latitudes).
Similarly, the path of sound will bend toward regions of lower sound speed in air. Air temperature
typically decreases with altitude, meaning sounds produced in air tend to bend skyward. When an
atmospheric temperature inversion is present, air is cooler near the earth’s surface. In inversion
conditions, sound waves near the earth’s surface will tend to refract downward.
[1 kiloyard (kyd) = 0.9 km]
Figure D-6: Sound Propagation Showing Multipath Propagation and Conditions for Surface Duct
D.3.3.4 Reflection and Multipath Propagation
In multipath propagation, sound may not only travel a direct path (with no reflection) from a source to a
receiver, but also be reflected from the surface or bottom multiple times before reaching the receiver
(Urick, 1983). Reflection is shown in Figure D-6 at the seafloor (bottom bounce) and at the water
surface. At some distances, the reflected wave will be in phase with the direct wave (their waveforms
add together) and at other distances the two waves will be out of phase (their waveforms cancel). The
existence of multiple sound paths, or rays, arriving at a single point can result in multipath interference,
D-12
Appendix D Acoustic and Explosive ConceptsAtlantic Fleet
Training and Testing Final EIS/OEIS September 2018
a condition that permits the addition and cancellation between sound waves, resulting in the fluctuation
of sound levels over short distances.
Reflection plays an important role in the pressures observed at different locations in the water column.
Near the bottom, the direct path pressure wave may sum with the bottom-reflected pressure wave,
increasing the exposure. Near the surface, however, the surface-reflected pressure wave may
destructively interfere with the direct path pressure wave, “cutting off” the wave and reducing exposure
(called the Lloyd mirror effect). This can cause the sound level to decrease dramatically within the top
few meters of the water column.
D.3.3.5 Diffraction, Scattering, and Reverberation
Diffraction, scattering, and reverberation are examples of what happens when sound waves interact
with obstacles in the propagation path.
Diffraction may be thought of as the change of direction of a sound wave as it passes around an
obstacle. Diffraction depends on the size of the obstacle and the sound frequency. The wavelength of
the sound must be larger than the obstacle for notable diffraction to occur. If the obstacle is larger than
the wavelength of sound, an acoustic shadow zone will exist behind the obstacle where the sound is
unlikely to be detected. Common examples of diffraction include sound heard from a source around the
corner of a building and sound propagating through a small gap in an otherwise closed door or window.
An obstacle or inhomogeneity (e.g., smoke, suspended particles, gas bubbles due to waves, and marine
life) in the path of a sound wave causes scattering as these inhomogeneities reradiate incident sound in
a variety of directions (Urick, 1983). Reverberation refers to the prolongation of a sound, after the
source has stopped emitting, caused by multiple reflections at water boundaries (surface and bottom)
and scattering.
D.3.3.6 Surface and Bottom Effects
Because the sea surface reflects and scatters sound, it has a major effect on the propagation of
underwater sound in applications where either the source or receiver is at a shallow depth (Urick 1983).
If the sea surface is smooth, the reflected sound pressure is nearly equal to the incident sound pressure;
however, if the sea surface is rough, the amplitude of the reflected sound wave will be reduced. Sound
waves reflected from the sea surface experience a phase reversal. When the surface-reflected waves
interact with the direct path waves near the surface, a destructive interference pattern is created in
which the received pressure approaches zero.
The sea bottom is also a reflecting and scattering surface, similar to the sea surface. Sound interaction
with the sea bottom is more complex, however, primarily because the acoustic properties of the sea
bottom are more variable and the bottom is often layered into regions of differing density. As sound
travels into the sea floor it reflects off of these different density layers in complex ways. For sources in
contact with the bottom, such as during pile driving or bottom-placed explosives, a ground wave is
produced that travels through the bottom sediment and may refract back into the water column.
For a hard bottom such as rock, the reflected wave will be approximately in phase with the incident
wave. Thus, near the ocean bottom, the incident and reflected sound pressures may add together
(constructive interference), resulting in an increased sound pressure near the sea bottom. Soft bottoms
such as mud or sediment absorb sound waves and reduce the level in the water column overall.
D-13
Appendix D Acoustic and Explosive ConceptsAtlantic Fleet
Training and Testing Final EIS/OEIS September 2018
D.3.3.7 Air-Water Interface
Sound from aerial sources such as aircraft and weapons firing may be transmitted into the water under
certain conditions. The most studied of these sources are fixed-wing aircraft and helicopters, which
create noise with most energy below 500 Hz. Noise levels in water are highest at the surface and are
highly dependent on the altitude of the aircraft and the angle at which the aerial sound encounters the
ocean surface. Transmission of the sound once it is in the water is identical to any other sound as
described in the sections above.
Transmission of sound from a moving airborne source to a receptor underwater is influenced by
numerous factors and has been addressed by Young (1973), Urick (1983), Richardson et al. (1995), Eller
and Cavanagh (2000), Laney and Cavanagh (2000), and others. Sound is transmitted from an airborne
source to a receptor underwater by four principal means: (1) a direct path, refracted upon passing
through the air-water interface; (2) direct-refracted paths reflected from the bottom in shallow water;
(3) evanescent transmission in which sound travels laterally close to the water surface; and
(4) scattering from interface roughness due to wave motion.
When sound waves in air meet the water surface, the sound can either be transmitted across the air-
water boundary or reflected off the water surface. When sound waves meet the water at a
perpendicular angle (e.g., straight down from an in-air source to a flat water surface), the sound waves
are both transmitted directly across the water surface in the same direction of travel and reflected 180°
back toward the original direction of travel. This can creates a localized condition at the water surface
where the incident and reflected waves sum, doubling the in-air overpressure (+ 6 dB). As the incident
angle of the in-air sound wave changes from perpendicular, this phenomena is reduced, ultimately
reaching the angle where sound waves are parallel to the water surface and there is no surface
reflection.
The sound that enters the water is refracted due to the difference in sound velocity between air and
water, as shown in Figure D-7. As the angle of the in-air incident wave moves away from perpendicular,
the direction of travel of the underwater refracted waves becomes closer to parallel to the water
surface. When the incident angle is reached where the underwater refracted sound wave is parallel to
the water surface, all of the sound is reflected back into the air and no sound enters the water. This
occurs at an angle of about 13-14°. As a result, most of the acoustic energy transmitted into the water
through a relatively narrow cone extending vertically downward from the in-air source. The width of the
footprint would be a function of the source altitude. Lesser amounts of sound may enter the water
outside of this cone due to surface scattering (e.g., from water surface waves that can vary the angle of
incidence over an area) and as evanescent waves that are only present very near the surface.
If a sound wave is ideally transmitted into water (that is, with no surface transmission loss, such as due
to foamy, wave conditions that could decrease sound entering the water), the sound pressure level
underwater is calculated by changing the pressure reference unit from 20 µPa in air to 1 µPa in water.
For a sound with the same pressure in air and water, this calculation results in a +26 dB sound pressure
level in water compared to air. For this reason, sound pressure levels in water and sound pressure levels
in air should never be directly compared.
D-14
Appendix D Acoustic and Explosive ConceptsAtlantic Fleet
Training and Testing Final EIS/OEIS September 2018
(Richardson et al. 1995)
Figure D-7: Characteristics of Sound Transmission Through the Air-Water Interface
D.4 AUDITORY PERCEPTION
Animals with an eardrum or similar structure, including mammals, birds, and reptiles, directly detect the
pressure component of sound. Some marine fish also have specializations to detect pressure changes,
although most invertebrates and many marine fish do not have anatomical structures that enable them
to detect the pressure component of sound and are only sensitive to the particle motion component of
sound. This difference in acoustic energy sensing mechanisms limits the range at which these animals
can detect most sound sources analyzed in this document. This is because far from a sound source (i.e.,
in the far field), particle velocity and sound pressure are directly proportional. But close to a source (i.e.,
in the near field), particle velocity increases relative to sound pressure and may become more
detectable to certain animals. As sound frequency increases, the wavelength becomes shorter, resulting
in a smaller near field.
Because mammalian ears can detect large pressure ranges and humans judge the relative loudness of
sounds by the ratio of the sound pressures (a logarithmic behavior), sound amplitude is described by the
SPL, calculated by taking the logarithm of the ratio of the sound pressure to a reference pressure (see
Section D.2.2, Sound Pressure Level). Use of a logarithmic scale compresses the wide range of pressure
values into a more usable numerical scale. On the dB scale, the smallest audible sound in air (near total
silence) to a human is 0 dB re 20 µPa. If the sound intensity increases by a factor of 10, the SPL would
increase to 10 dB re 20 µPa. If the sound intensity increases by a factor of 100, the SPL would increase to
20 dB re 20 µPa, and if the sound intensity increases by a factor of 1000, the SPL would be 30 dB re 20
D-15
Appendix D Acoustic and Explosive ConceptsAtlantic Fleet
Training and Testing Final EIS/OEIS September 2018
µPa. A quiet conversation has an SPL of about 50 dB re 20 µPa, while the threshold of pain is around
120–140 dB re 20 µPa.
As described in Section D.2.2 (Sound Pressure Level), SPLs under water differ from those in air because
they rely on different reference pressures in their calculation; therefore, the two should never be
directly compared.
While sound pressure and frequency are physical measure of the sound, loudness is a subjective
attribute that varies with not only sound pressure but also other attributes of the sound, such as
frequency. For example, a human listener would perceive a 60 dB re 20 µPa sound at 2 kHz to be louder
than a 60 dB re 20 µPa sound at 50 Hz, even though the SPLs are identical. This effect is most noticeable
at lower sound pressure levels; however, at very high sound pressure levels, the difference in perceived
loudness at different frequencies becomes smaller.
To account for differences in hearing sensitivity at various frequencies, acoustic risk analyses commonly
use auditory weighting functions — mathematical functions that adjust (or “weight”) received sound
levels across sound frequency based on how the listener’s sensitivity or susceptibility to sound changes
at different frequencies. For humans, the most common weighting function is called “A-weighting” (see
Figure D-8). A-weighted sound levels are specified in units of “dBA” (A-weighted decibels). For example,
if the unweighted received level of a 500 Hz tone at a human receiver was 90 dB re 20 µPa, the A-
weighted sound level would be 90 dB – 3 dB = 87 dBA because the A-weighting function amplitude at
500 Hz is -3 dB. Many measurements of sound in air appear as dBAs in the literature because the intent
of the authors is to assess noise impacts on humans.
The Numbers along the Curve Indicate How a Received Sound Level Would Be Adjusted at that Frequency.
Figure D-8: A-weighting for Human Hearing of Sounds in Air (OSHA).
D-16
Appendix D Acoustic and Explosive ConceptsAtlantic Fleet
Training and Testing Final EIS/OEIS September 2018
The auditory weighting concept can be applied to other species. When used in analyzing the impacts of
sound on an animal, auditory weighting functions adjust received sound levels to emphasize ranges of
best hearing and de-emphasize ranges of less or no sensitivity. Auditory weighting functions were
developed for marine mammals and sea turtles and are used to assess acoustic impacts. For more
information on weighting functions and their derivation for this analysis see technical report Criteria and
Thresholds for U.S. Navy Acoustic and Explosive Effects Analysis (U.S. Department of the Navy, 2017).
D.5 EXPLOSIVES
Explosive materials used in Navy testing and training activities are either (1) “high explosives,”
sometimes referred to as HE, which means that the explosive material has a very fast rate of detonation
(exceeding the speed of sound), or (2) low explosives, which exhibit a relatively slow burn, or
deflagration, such as black powder. Because low explosives are typically used in small quantities and
have less destructive power, the below discussion focuses on high explosives.
This rate of detonation of a high explosive is highly supersonic, producing a high pressure, steep
instantaneous shock wave front travelling through the explosive material. This shock front is produced
by the supersonic expansion of the explosive products, but as the shock front travels away from the
immediate area of the detonation, it begins to behave as an acoustic wave front travelling at the speed
of sound.
The near-instantaneous rise from ambient to an extremely high peak pressure is what makes the
explosive shock wave potentially damaging. The area under this positive pressure duration is calculated
as the positive impulse.
The positive pressure produced by an explosion is also referred to as the overpressure. As the shock
front passes a location, the positive pressure exponentially decays, as shown in Figure D-9. As the shock
front travels away from the detonation, the waveform is stretched – the peak pressure decreases while
the positive duration increases. The reduction in peak pressure reduces the rate at which the positive
impulse is received. Both the reduction in peak pressure and stretching of the positive impulse reduce
the potential for injury. In addition, absorption losses of higher frequencies over distance results in a
softening of the shock front, such that the rise to peak pressure is no longer near-instantaneous.
D-17
Appendix D Acoustic and Explosive ConceptsAtlantic Fleet
Training and Testing Final EIS/OEIS September 2018
Figure D-9: Impulse Shown as a Function of Pressure over Duration at a Specific Location
The peak pressure experienced by a receptor (i.e., an animal) is a function of the explosive material, the
net explosive weight, and the distance from the charge. Net explosive weight (NEW) is a way to classify
and compare quantities of different explosive compounds. The net explosive weight for a charge is the
energetic equivalent weight of trinitrotoluene (TNT). In general, shock wave effects near an explosive
charge increase in proportion to the cube root of the explosive weight (Young, 1991). For example,
shock wave impacts will double when the explosive charge weight is increased by a factor of eight (i.e.,
cube root of eight equals two). This relationship is known as the similarity principle, and the
corresponding similitude equations allow for prediction of various explosive metrics for a given charge
weight and material.
The similitude equations allow for a simple prediction of peak pressure in a uniform free field
environment, and sources are provided below for using these equations for estimating explosive effects
in air and in water. However, at longer distances or in more complex environments with boundaries and
variations in the propagation medium, explosive propagation modeling is preferred.
D.5.1 EXPLOSIONS IN AIR
Explosions in air produce an initial blast front that propagates away from the detonation. When
pressure waves from an explosion in air meet the water surface, the pressure wave can be transmitted
across the air-water boundary and reflected off the water surface. When pressure waves in air meet the
water at a perpendicular angle (e.g., straight down from an in-air source to a flat water surface), the
sound waves are both transmitted directly across the water surface in the same direction of travel and
reflected 180° back toward the original direction of travel. For acoustic waves, this can create a localized
condition at the water surface where the incident and reflected waves sum, doubling the in-air
overpressure (+ 6 dB). For shock waves with high incident pressures travelling at supersonic speeds, the
reflection from the water surface depends on the angle of incidence and the speed of the shock wave,
and the reflected shock wave pressure can be greater than the incident shock wave pressure (Kinney &
Graham, 1985; U.S. Department of the Navy, 1975).
D-18
Appendix D Acoustic and Explosive ConceptsAtlantic Fleet
Training and Testing Final EIS/OEIS September 2018
In certain explosive geometries, depending on the size of the explosive and its height of detonation, a
combined shock wave, called a Mach stem, can be created by the summing of the direct and reflected
shock waves at larger angles of incidence (Kinney & Graham, 1985). In instances where this specific
geometry does not occur, only the direct path wave is experienced because there is no surface
reflection (waves are parallel to or angled away from the water surface, such as would occur when an
explosive is detonated at the water surface), or separate direct and reflected pressure waves may be
experienced.
D.5.1.1 Fragmentation
Missiles, rockets, projectiles, and other cased weapons will produce casing fragments upon detonation.
These fragments may be of variable size and are ejected at supersonic speed from the detonation. The
casing fragments will be ejected at velocities much greater than debris from any target due to the
proximity of the casing to the explosive material. Unlike detonations on land targets, detonations during
Navy training and testing would not result in other propelled materials such as crater debris.
Fragment density can be simply assumed to follow an inverse-square law with distance, in which the
possibility of fragment strike is reduced by the square of the distance from the original detonation point.
The forces of gravity and drag will further reduce the likelihood of strike with increasing distance than is
accounted for in the inverse-square relationship (Zaker, 1975). The possible area of strike risk at any
given distance from the detonation point is limited to the surface area of produced fragments, with drag
and gravity reducing the number of produced fragments that travel to greater distances.
D.5.2 EXPLOSIONS IN WATER
At the instant of explosion underwater, gas byproducts are generated at high pressure and temperature,
creating a bubble. The heat causes a certain amount of water to vaporize, adding to the volume of the
bubble. This action immediately begins to force the water in contact with the blast front in an outward
direction, creating an intense, supersonic pressure shock wave. As the high-pressure wave travels away
from the source, it slows to the speed of sound and acts like an acoustic wave similar to other impulsive
sources that lack a strong shock wave (e.g., air guns). Explosions have the greatest amount of energy in
lower frequencies below 500 Hz, although energy is present in frequencies exceeding 10 kHz (Urick,
1983). The higher frequency components exhibit more attenuation with distance due to absorption (see
Section D.3.3.2, Absorption).
The shock wave caused by an explosion in deeper water may be followed by several bubble pulses in
which the explosive byproduct gases expand and contract, with correlated high and low pressure
oscillations. These bubble pulses lack the steep pressure front of the initial explosive pulse, but the first
bubble pulse may still contribute to the total energy released at frequencies below 100 Hz (Urick, 1983).
Subsequent bubble pulses contribute little to the total energy released during the explosion (Urick,
1983). If the detonation occurs at or just below the surface, a portion of the explosive power is released
into the air and a pulsating gas bubble is not formed.
The pressure waves from an explosive can constructively add or destructively cancel each other in ocean
environments with multi-path propagation, as described for acoustic waves in Section D.3.3.3
(Refraction) and Section D.3.3.4 (Reflection and Multipath Propagation). The received impulse is
affected by the depth of the charge and the depth of the receiving animal. Pressure waves from the
detonation may travel directly to the receiver or be reflected off the water surface before arriving at the
receiver. If a charge is detonated closer to the surface or if an animal is closer to the surface, the time
between the initial direct path arrival and the following surface-reflected tension wave arrival is
D-19
Appendix D Acoustic and Explosive ConceptsYou can also read