Air quality during the 2008 Beijing Olympics: secondary pollutants and regional impact
←
→
Page content transcription
If your browser does not render page correctly, please read the page content below
Atmos. Chem. Phys., 10, 7603–7615, 2010
www.atmos-chem-phys.net/10/7603/2010/                                                                      Atmospheric
doi:10.5194/acp-10-7603-2010                                                                                 Chemistry
© Author(s) 2010. CC Attribution 3.0 License.                                                              and Physics

Air quality during the 2008 Beijing Olympics: secondary pollutants
and regional impact
T. Wang1,2,3 , W. Nie1,2 , J. Gao3 , L. K. Xue1,2 , X. M. Gao1,2 , X. F. Wang1,2 , J. Qiu1 , C. N. Poon1 , S. Meinardi4 ,
D. Blake4 , S. L. Wang3 , A. J. Ding1 , F. H. Chai3 , Q. Z. Zhang2 , and W. X. Wang2,3
1 Department of Civil and Structural Engineering, The Hong Kong Polytechnic University, Hong Kong, China
2 Environment Research Institute, Shandong University, Jinan, China
3 Chinese Research Academy of Environmental Sciences, Beijing, China
4 Department of Chemistry, University of California at Irvine, Irvine, USA

Received: 9 April 2010 – Published in Atmos. Chem. Phys. Discuss.: 12 May 2010
Revised: 22 July 2010 – Accepted: 2 August 2010 – Published: 16 August 2010

Abstract. This paper presents the first results of the mea-         fate), carbon monoxide (CO), reactive aromatics (toluene
surements of trace gases and aerosols at three surface sites        and xylenes) sharply decreased (by 8–64%) in 2008, but no
in and outside Beijing before and during the 2008 Olympics.         significant changes were observed for the concentrations of
The official air pollution index near the Olympic Stadium           PM2.5 , fine sulfate, total odd reactive nitrogen (NOy ), and
and the data from our nearby site revealed an obvious as-           longer lived alkanes and benzene. We suggest that these re-
sociation between air quality and meteorology and different         sults indicate the success of the government’s efforts in re-
responses of secondary and primary pollutants to the control        ducing emissions of SO2 , CO, and VOCs in Beijing, but in-
measures. Ambient concentrations of vehicle-related nitro-          creased regional emissions during 2005–2008. More strin-
gen oxides (NOx ) and volatile organic compounds (VOCs)             gent control of regional emissions will be needed for sig-
at an urban site dropped by 25% and 20–45% in the first two         nificant reductions of ozone and fine particulate pollution in
weeks after full control was put in place, but the levels of        Beijing.
ozone, sulfate and nitrate in PM2.5 increased by 16%, 64%,
37%, respectively, compared to the period prior to the full
control; wind data and back trajectories indicated the con-
tribution of regional pollution from the North China Plain.         1   Introduction
Air quality (for both primary and secondary pollutants) im-
proved significantly during the Games, which were also as-          The air quality in Beijing has been of great concern to both
sociated with the changes in weather conditions (prolonged          the Chinese government and researchers, especially after the
rainfall, decreased temperature, and more frequent air masses       city won the bid to host the 29th Summer Olympic Games.
from clean regions). A comparison of the ozone data at three        To significantly improve the city’s air quality during the
sites on eight ozone-pollution days, when the air masses were       Games (8–24 August 2008), in addition to the long-term con-
from the southeast-south-southwest sector, showed that re-          trol measures (UNEP, 2009), the Chinese government took
gional pollution sources contributed >34–88% to the peak            drastic actions to reduce the emissions of air pollutants from
ozone concentrations at the urban site in Beijing. Regional         industry, road traffic, and construction sites (UNEP, 2009;
sources also contributed significantly to the CO concentra-         Wang et al., 2009a, 2010b). From 1 July, some 300 000
tions in urban Beijing. Ozone production efficiencies at two        heavily polluting vehicles (the so called yellow-label vehi-
sites were low (∼3 ppbv/ppbv), indicating that ozone forma-         cles) were banned from driving in the Beijing Municipality,
tion was being controlled by VOCs. Compared with data               which covers an area of 16 808 km2 , and starting from 20
collected in 2005 at a downwind site, the concentrations of         July, half of the city’s 3.5 million vehicles were taken off
ozone, sulfur dioxide (SO2 ), total sulfur (SO2 +PM2.5 sul-         the roads through the alternative day-driving scheme. In ad-
                                                                    dition, all construction activities were halted, power plants
                                                                    were asked to use cleaner fuels, and some polluting factories
                    Correspondence to: T. Wang                      were ordered to reduce their activity. Additional control was
                    (cetwang@polyu.edu.hk)                          implemented after the start of the Games in order to further

Published by Copernicus Publications on behalf of the European Geosciences Union.
7604                                                             T. Wang et al.: Air quality during the 2008 Beijing Olympics

reduce the emissions from vehicles and petrol-filling stations      With the aid of a chemical transport model or a statisti-
(Wang et al., 2009a). In addition to the strict controls on      cal model, some studies have attempted to examine the rel-
air pollution sources in Beijing, neighboring provinces also     ative role of meteorology and emission reduction in the im-
reduced their industrial output. A preliminary assessment        provement of the air qualities during the Olympics. Wang et
suggests that these emission-reduction measures reduced the      al. (2009c) attributed 55% of the ozone decrease at a rural
emissions of SO2 , NOx , CO, VOCs, and PM10 by 14%, 38%,         site during the Olympics from the same period in the previ-
47%, 30%, and 20% in the Beijing area, respectively (UNEP,       ous year to the change in meteorology during the two years.
2009). Much larger reductions of SO2 (41%), NOx (47%),           Wang et al. (2009a) suggested a more dominant role of me-
VOCs (57%), and PM10 (55%) are suggested in a more re-           teorological effects than the emission reductions in the varia-
cent study (Wang et al., 2010b).                                 tion in their observed particulate matter at an urban site. Cer-
   The large reductions in pollution emissions in the summer     mak and Kutti (2009) also suggested a more important role of
of 2008 in Beijing represents a human-perturbation experi-       the meteorology in explaining the decrease in aerosol optical
ment of unprecedented scale, and provides a rare opportunity     thickness. Mijling et al. (2009) attributed the 60% reduction
to study the impact of pollution emissions on the air quality    in tropospheric NO2 to the emission control.
and atmospheric chemistry of Beijing and the surrounding            Most of these published studies so far have focused on
regions. From an air-quality management point of view, it is     primary pollutants, and there are few results on the levels
of critical importance to know how the anticipated large re-     and variation of secondary pollutants and on the extent of
duction in emissions improved the city’s air quality. During     regional contribution during the drastic emission control in
the summer of 2008, we measured trace gases and aerosols         Beijing. In addition, little attention has been given to the
at three sites in and around Beijing before, during, and after   paradoxical response of secondary pollutants during the first
the Games. Here, we report the first results from the analy-     two weeks after the full traffic control. The present study
sis of this dataset, which provide new insights into the role    attempts to examine these important topics. We first show
of meteorology, the response of secondary pollutants to the      the relationship between weather and the general air qual-
pollution control, and the contribution of regional pollution    ity in Beijing as indicated by the official air pollution index
to the air quality in Beijing.                                   and our own measurements; we then estimate the regional
   A number of papers have been published on the results         contribution to ozone pollution on eight days when Beijing
of surface and satellite measurements during the Beijing         was influenced by air masses from the North China Plain in
Olympics, all indicating sharp decreases in the concentra-       the south; we also examine the ozone production efficien-
tions of the measured pollutants in Beijing during the period    cies, and lastly we compare the data collected at a downwind
of the Olympics. On-road measurements reported significant       site in 2005 and 2008 to gain insight into the changes in the
(12–70%) decreases in the ambient concentrations of CO,          composition of urban and regional plumes, and discuss the
NOx , SO2 , black carbon (BC), benzene, toluene, ethylben-       changes in Beijing and regional emissions during the past
zene, and xylenes (BTEX), and PM1 during the Olympics            several years.
(Wang et al., 2009a). Atmospheric measurements at other ur-
ban sites showed a decrease in the concentration of 35–43%
for fine and coarse particulate matter (Wang et al., 2009b),     2     Methodology
74% for BC (Wang et al., 2009c), 47–64% for BTEX (Liu
et al., 2009), and 35% for total non-methane hydrocarbons        2.1    Measurement sites
(Wang et al., 2010a). These results were based on a compari-
son of the data obtained during the Olympics with those from     Field studies were conducted at three sites in and outside the
non-Olympic periods (before and/or after the Olympics and        Beijing urban area that lie roughly on a south-north axis. The
Para-Olympics). The concentrations of O3 , CO, SO2 , and         three sites are shown in Fig. 1 and are described in the fol-
NOy in plumes from urban Beijing transported to a rural site     lowing.
deceased by 21–61% in August 2008 compared to the same              Xicicun (XCC) is situated near the border between Beijing
month in 2007 (Wang et al., 2009d). Analyses of satellite        and the Hebei province (39◦ 280 N, 116◦ 70 E), and is 53 km
data from GOME-2, OMI, and MODIS, by comparing the re-           southwest of the center of Beijing (Tiananmen). When the
sults obtained during August 2008 with those in the same pe-     winds come from the south or southwest, this site is upwind
riod in previous years, have shown a decrease of 43–59% in       of the Beijing urban area. The site is located in farmland
nitrogen dioxide (NO2 ) column over Beijing (Mijling et al.,     with few nearby sources of pollution. The ozone and CO data
2009; Witte et al., 2009), 13% in boundary-layer SO2 , 12%       from this site are reported in this paper. The measurements
in CO at the 700 hPa-level over a large region encompass-        were conducted between 20 July and 25 August.
ing Beijing and its southern neighboring provinces (Witte et        The Chinese Research Academy of Environmental Sci-
al., 2009), and 11% in aerosol optical thickness over Beijing    ences (CRAES) is located 4 km north of the 5th ring
(Cermak and Kutti, 2009).                                        road, 15 km from the city center, and 5.8 km from the Na-
                                                                 tional Olympic Stadium (the “Bird’s Nest”). This site is

Atmos. Chem. Phys., 10, 7603–7615, 2010                                              www.atmos-chem-phys.net/10/7603/2010/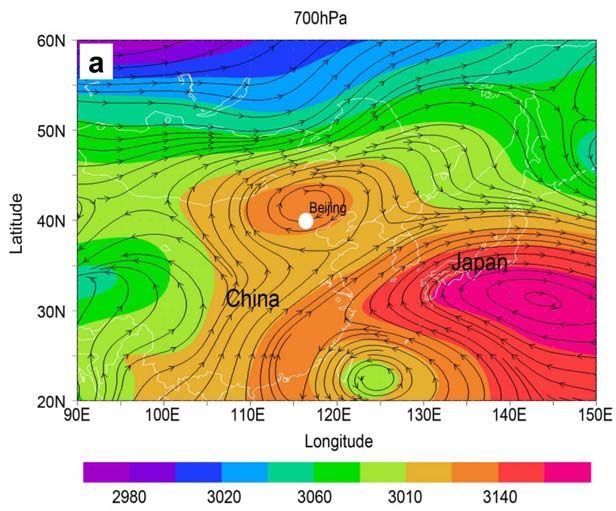
T. Wang et al.: Air quality during the 2008 Beijing Olympics 7605
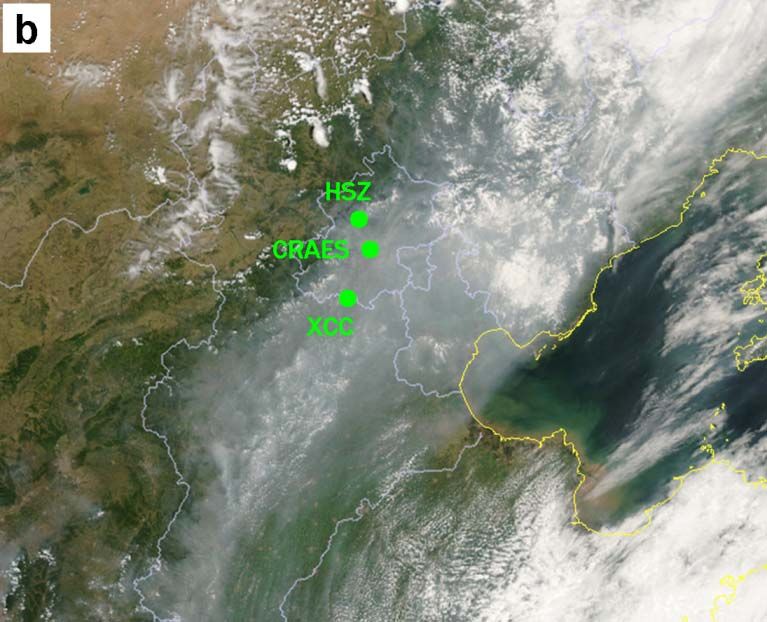
Fig. 1. Map showing the three measurement sites (XCC, CRAES, HSZ), the Beijing Municipality (the area within the white line), and
Figure 1. Map
the surrounding regions. showing the
Also shown are the three
location measurement sites (XCC,
of the “Bird’s Nest” National CRAES,
Olympic Stadium, HSZ),
a Beijing the
Municipal Beijing
Environmental
Protection Bureau’s air quality station and a Beijing Municipal Meteorological Bureau’s weather station whose data are used in this study.
Municipality (the area within the white line), and the surrounding regions. Also shown
immediately downwind of the maximum emissions from ur- analyzer (API model 300EU or API model 300E), and SO2
are the location of the “Bird’s Nest” National
ban Beijing, and is the most heavily instrumented of the three withOlympic
a pulsed UVStadium,
fluorescenceaanalyzer
Beijing (TEIMunicipal
model 43C).
sites. The site is located on the rooftop of a three-floor build- Nitric oxide (NO) and NOy were measured with a commer-
ing in the Academy. Data on ozone, CO, NOx , NOy , VOCs cial chemiluminescence analyzer fitted with an externally
Environmental
from canisters, real-time Protection Bureau’s
PM2.5 sulfate and nitrate takenair
be- quality station oxide
placed molybdenum and (MoO)a Beijing Municipal
catalytic converter (Wang
tween 10 July and 25 August are analyzed in this paper. et al., 2001). NOy is defined as the sum of NO, NO2 , HONO,
Heishanzhai (HSZ) is a rural mountainous area (40◦ 220 N, HO2 NO2 , NO3 , PAN, HNO3 , N2 O5 , aerosol nitrate, and
Meteorological
116◦ 180 E, 280 m above Bureau’s weather
sea level), station
approximately whoseother
50 km data are used
organic nitratesin
etc,this study.
including nitrate in PM2.5 . A pho-
north of the center of Beijing. This site was used in our previ- tolytic converter (Blue Light converter, Meteorologie Con-
ous study in the summer of 2005, when high concentrations sult Gubh) coupled to a commercial NO analyzer was used
of ozone and secondary aerosol were observed (Wang et al., to measure NO2 . The methods used to calibrate these instru-
2006; Pathak et al., 2009). In 2008, a different building was ments were the same as those reported by Wang et al. (2001).
used for the measurements due to renovation work in the pre- The NO2 conversion efficiencies were determined by the gas-
vious facility. This paper compares the O3 , CO, SO2 , NOy , phase titration method, and an average efficiency of 35% was
24-h PM2.5 mass, sulfate, nitrate, and NMHCs data during obtained.
10 July-August 25 2008 with the corresponding data from Methane, NMHC, and halocarbon concentrations were de-
July of 2005. termined by collecting whole-air samples in evacuated 2L
electro-polished stainless steel canisters each equipped with
2.2 Instrumentation
a bellows valve. Between one and seven samples were
A brief description of the methods used to measure the gases collected each day, with more samples being collected on
and aerosols is given in the following. The reader is referred episode days. The sampling duration was 2 min. The canis-
to relevant previous publications for further details. The lim- ters were shipped to the University of California at Irvine for
its of detections of the techniques are all sufficient to accu- chemical analysis using gas chromatography with flame ion-
rately measure the relatively high concentrations of gases and ization detection, electron capture detection, and mass spec-
aerosols at the study sites. trometer detection (Colman et al., 2001).
Trace gases: O3 was measured with a UV photometric an- Aerosols: At the HSZ site, 24-h PM2.5 samples were
alyzer (TEI model 49i), CO with a non-dispersive infrared collected using a Thermo Andersen Chemical Speciation
www.atmos-chem-phys.net/10/7603/2010/ Atmos. Chem. Phys., 10, 7603–7615, 2010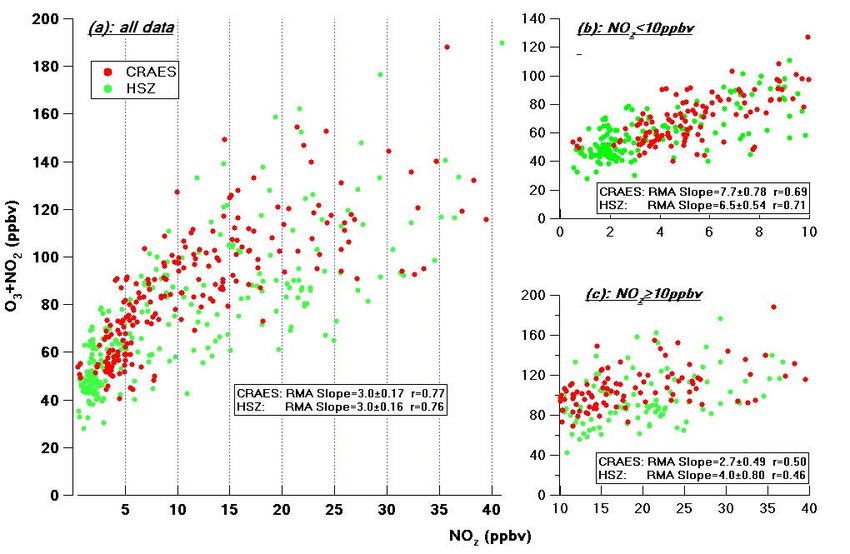
7606                                                                   T. Wang et al.: Air quality during the 2008 Beijing Olympics

Fig. 2. Time series of (a) Air Pollution Index at a Beijing Municipal Environmental Protection Bureau’s air-quality monitoring station
at the Chaoyang National Olympics Sports Center, (b) hourly concentration of ozone and PM2.5 sulfate measured at CRAES, (c) daily
precipitation amount, (d) four-hourly wind vectors, (e) daily mean temperature and relative humidity. The meteorological data were obtained
from a Beijing Municipal Meteorological Bureau’s weather station (see Fig. 1 for its location).

Monitor (RAAS2.5-400, Thermo Electron Corporation) with                 lent”, “good”, and “slightly polluted” condition, respectively
Teflon filters (Teflo™, 2 µm pore size and 47 mm diame-                 (UNEP, 2009).
ter, Pall Inc.) at a flow rate of 16.7 LPM (Wu and Wang,                   To help interpret the chemical data, we used surface me-
2007). The PM2.5 mass was determined using the standard                 teorological data on precipitation, temperature, relative hu-
gravimetric method, and the water soluble ions SO2−       −
                                                  4 , NO3 ,             midity, and wind speed and direction obtained from the Bei-
  −    −      −      +   +     +     2+        2+                       jing Municipal Meteorological Bureau (BJMB) weather sta-
F , Cl , NO2 , NH4 , K , Na , Mg , and Ca were ana-
lyzed using a Dionex ion chromatography 90 (Wu and Wang,                tion located to the west of the city center (Fig. 1). The wind
2007). At CRAES, real-time PM2.5 ions were measured us-                 data were collected four times a day (02:00, 08:00, 14:00,
ing an ambient ion monitor (URG 9000B, URG Corporation)                 and 20:00, local time), and the other data were daily aver-
(Wu and Wang, 2007). Another instrument (same model)                    ages. These data were obtained from Global Telecommu-
was used in 2008, however, the negative artifact reported in            nication Systems. In addition to surface winds, 48-h back-
the previous study was not observed.                                    ward trajectories were calculated to identify the origin and
                                                                        transport pathway of large-scale air masses. The trajec-
2.3    Air pollution index, meteorological data, and back               tories were calculated for four times a day (02:00, 08:00,
       trajectories                                                     14:00, and 20:00, local time) using the NOAA ARL HYS-
                                                                        PLIT model with GDAS (Global Data Assimilation System)
                                                                        data (http://ready.arl.noaa.gov/HYSPLIT.php), with the end-
In order to show the air quality at the main Olympic complex            point at the CRAES, and at an altitude of 100 m above ground
and its relationship with the secondary pollutants measured at          level.
our nearby CRAES, we obtained official Air Pollution Index
(API) data (http://www.bjepb.gov.cn) at the Beijing Munic-
ipal Environmental Protection Bureau (BJEPB)’s air-quality              3     Results and discussion
monitoring station at Chaoyang Olympics Sports Center, lo-
cated about 2 km south and southeast of the “Bird’s Nest”               3.1    Overall air quality and relation to weather
(Fig. 1). The API is calculated based on the highest index                     conditions
of 24-h average concentrations of PM10 , SO2 , and NO2 from
noon of the present day to noon of the pervious day. An                 Figure 2 shows the daily API, the hourly concentrations of
API of 0–50, 51–100, and 101–200 is classified as “excel-               ozone and sulfate at CRAES, and several meteorological

Atmos. Chem. Phys., 10, 7603–7615, 2010                                                    www.atmos-chem-phys.net/10/7603/2010/
T. Wang et al.: Air quality during the 2008 Beijing Olympics                                                                                  7607

Figure 3. Average concentration of secondary pollutants at CRAES: ozone (for the
      Fig. 3. Average concentration of secondary pollutants at CRAES:
11:00-18:00
      ozoneperiod),
            (for theNO y, PM2.5 sulfate and nitrate, during the three periods, namely
                     11:00–18:00    period), NOy , PM2.5 sulfate and ni-
before trate, during
        the full      the(July
                 control   three periods,
                               10-19), afternamely
                                             the full before
                                                      control the
                                                              (Julyfull control (10–
                                                                     20-August  8), and during
      19 July), after the full control (20 July–8 August), and during the
the Olympics (August
      Olympics  (9–249-24). Vertical
                       August).      bars arebars
                                  Vertical    halfare
                                                   standard deviations.
                                                      half standard  deviations.

      parameters from BJMB from July 11 to August 25. Dur-
      ing the observation period, PM10 was the dominant pollutant
      of the three reported pollutants (PM10 , SO2 , and NO2 ) at the
      BJEPB site. Thus the officially reported air quality repre-
      sented levels of coarse particulate matter. An API of 0–50,
      51–100, and 101–200 corresponds to 0–50, 52–150, 152–
      350 µg/m3 of PM10 , respectively (UNEP, 2009). However,
      because the computation of API does not include ozone, the
                                                                               Fig. 4. Mean concentration of vehicle-related primary pollutants
      API does not adequately reflect the situation of photochem-Figureduring    4. Mean
                                                                                       the concentration
                                                                                           three periods of   vehicle-related
                                                                                                                       (a) NOprimary
                                                                                                           at CRAES              x duringpollutants during
                                                                                                                                           rush hours, day-the three
      ical pollution. Thus the combined API and the secondary                  time and whole day and (b) individual and total C2 -C8 NMHCs.
      pollutants at our site shown in Fig. 2 better illustrate the vari-periodsVertical
                                                                                at CRAESbars    NO
                                                                                            (a)are  x during rush hours, daytime and whole day and (b) individual
                                                                                                   half standard deviations. The number of VOC sam-
      ations in air quality (for both primary and secondary pollu-             ples is 6, 14,  14  for period 1, are
                                                                                                                 2, and
                                                                        and total C2-C8 NMHCs. Vertical bars         half3,standard
                                                                                                                             respectively.
                                                                                                                                    deviations. The number of VOC
      tants) in the Olympics complex and the adjacent areas.
         The observation period can be divided into three parts:samples is 6, 14, 14 for period 1, 2, and 3, respectively.
      (1) before the full-scale control (11–19 July), (2) after the                Figure 2 reveals that while the API captured the day-to-
      full-scale control but before the Olympics (20 July to 8 Au-             day   variation of fine sulfate,33which can be explained by the
                                     32
      gust), and (3) during the Olympics (9–24 August). Moder-                 fact that sulfate is a part of PM10 , it did not adequately reflect
      ately high API (60–120) (and ozone and sulfate concentra-                the concentrations and variation of ozone: the three highest
      tions) was recorded in the first period. After the full traffic          ozone days on 22–24 July were not indicated by the API,
      control came into effect, two multi-day pollution episodes               illustrating the deficiency of the current API in representing
      occurred: one between 23 and 29 July, and one started three              photochemical pollution.
      day before the Olympic openings and lasted for five days (4–                 Figure 3 gives the average concentrations and half of the
      9 August). The highest readings of API, ozone, and sulfate               standard deviations in the three periods for ozone (11:00–
      occurred during this period: nine days had a maximum 1-                  18:00, local time), sulfate, nitrate, and NOy at CRAES. They
      h ozone exceeding China’s ambient air quality standard of                represent secondary gases and aerosols. In aged air masses
      100 ppbv, with the highest value of 190 ppbv being recorded              NOy contains a large fraction of oxidation products of NOx ,
      on 24 July; very high concentrations of sulfate (hourly values           such as in period 2 during which NOx was only ∼40% of
      of 80–140 µg/m3 ) were also observed. Good air quality was               NOy (see Figs. 3 and 4).
      recorded on most days during the Games, as indicated by the
                                                                                   The results shown in Figs. 2 and 3 are striking. The con-
      lowest API values and the concentrations of secondary pol-
                                                                               trol measures were expected to reduce significantly emis-
      lutants (see Fig. 2).
                                                                               sions from vehicles, power generation, and other activities
                                                                               (e.g, Wang et al., 2010b). Indeed, NOx measured at CRAES

      www.atmos-chem-phys.net/10/7603/2010/                                                            Atmos. Chem. Phys., 10, 7603–7615, 2010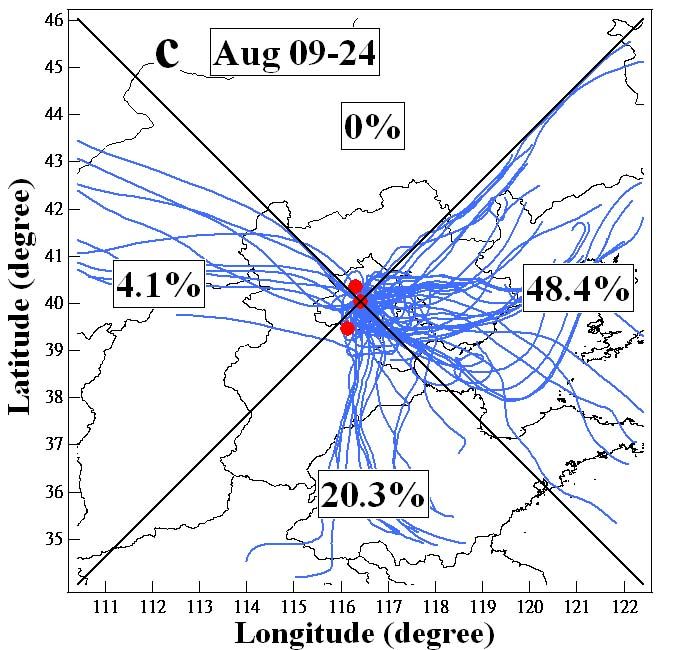
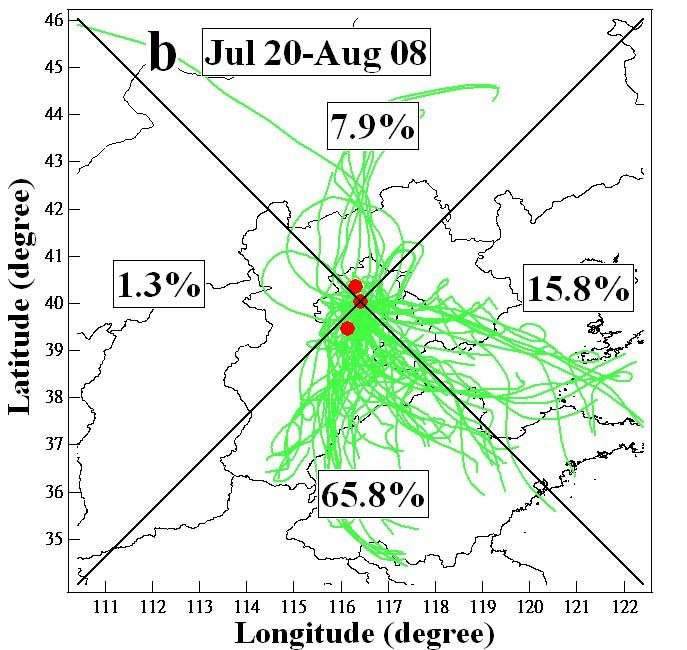
7608                                                                    T. Wang et al.: Air quality during the 2008 Beijing Olympics

Fig. 5. Forty-eight hour backward trajectories during (a) 10–19 July (b) 20 July–8 August and (c) 9–24 August. Numbers are the percentage
contributions from each of the four sectors. The percentage of non-defined (i.e. looping) trajectories is 2.5%, 9.2% and 27.2% for period 1,
2 and 3, respectively. The red points are the locations of the XCC, CRAES, and HSZ sites.

decreased by 20% and 25% in the morning (06:00–09:00,                      In contrast to the decreasing levels of NOx and the VOCs,
local time) and for the whole day, respectively (Fig. 4). Two-          the average concentration of ozone, NOy , PM2.5 sulfate
tailed t tests show that these differences are statistically sig-       and nitrate at CRAES increased by 16% (P
T. Wang et al.: Air quality during the 2008 Beijing Olympics                                                                     7609

                                                                                    erated the oxidation of SO2 to form sulfate. The hazy condi-
                                                                                    tions in the later phase of the episode may have suppressed
                                                                                    the production of ozone by reducing the rate of photolysis re-
                                                                                    actions and via uptake of radicals and NOx on moist aerosols.
                                                                                       Meteorological data shown in Fig. 2 (ambient temperature,
                                                                                    relative humidity, wind direction and speed, and daily rainfall
                                                                                    readings) reveal obvious impact of weather on the air qual-
                                                                                    ity. The increasing concentrations of secondary pollutants
                                                                                    after the full control was associated with a lack of rainfall
                                                                                    and the prevalence of southerly winds; the good air quality
                                                                                    from August 10 through to the end of the Games can be partly
                                                                                    explained by the persistent rain during 10–16 August, which
                                                                                    also lowered the temperatures by a few degrees. Back tra-
                                                                                    jectories during the three periods are shown in Fig. 5. They
                                                                                    indicate much more frequent transport of regional pollution
                                                                                    from the SE-S-SW directions (66%) during period 2 com-
                                                                                    pared to the period before the full control (33%) and the pe-
                                                                                    riod of Olympics (20%). It is known that there are a large
                                                                                    number of pollution sources in the North China Plain to the
                                                                                    south of Beijing. It is worth noting that the two episodes
                                                                                    on July 23-29 and August 4-9 are typical summertime pol-
                                                                                    lution cases, during which Beijing and the surrounding re-
                                                                                    gions are influenced by a weak high-pressure system over
                                                                                    the Hebei Province (Fig. 6a) that gave rise to hot and humid
                                                                                    “sauna” weather. Under such conditions, widespread pollu-
                                                                                    tion occurs not only in Beijing but also over a large part of
                                                                                    the North China Plain, as illustrated by the true-color image
                                                                                    from MODIS for July 24 (Fig. 6b) (http://rapidfire.sci.gsfc.
                                                                                    nasa.gov/subsets/?subset=FAS China4.2008206.aqua.1km).
                                                                                       In sum, the above results clearly show the effects of
                                                                                    weather and regional sources on the air quality during the
                                                                                    study period. Additional modeling studies are needed to re-
                                                                                    solve the complex interplay between the changing emissions
                                                                                    and meteorological conditions and to quantify local and re-
           Fig.Mean
Figure 6. (a)   6. (a)wind
                       Meanand geopotential
                             wind           height height
                                  and geopotential for a multi-day  pollution
                                                          for a multi-day pol- episode on
                                                                                    gional contributions.
           lution(b)
22-28 July 2008   episode
                     MODISon true-color
                              22–28 Julyimagery
                                          2008 (b)
                                                onMODIS
                                                   July 24. true-color imagery
           on 24 July.
                                                                                 3.2   Regional contribution to ozone pollution in Beijing

                                                                                 It has been recognized that neighboring Tianjin, Hebei,
           20 July. The control measures are expected to reduce the pro-         Shanxi, and Shandong can have an important impact on Bei-
           duction of ozone from Beijing, regardless whether the ozone           jing’s air quality (An et al., 2007; Chen et al., 2007; Streets et
                                          35
           formation is controlled by VOCs,      NOx , or both. Therefore,       al., 2007; Jia et al., 2008; Wang et al., 2008; Lin et al., 2009).
           the observed increasing (both mean and peak) ozone con-               Model calculation by Streets et al. (2007) suggested that 35–
           centrations must be mainly due to other reason(s). A 64%              60% of the simulated ozone at the Olympic Stadium site
           increase in the mean sulfate concentration in period 2 was            under July 2001 polluted conditions could be attributed to
           also in sharp contrast of an anticipated 40% decrease in SO2          sources outside Beijing. Lin et al. (2009) observed elevated
           emission from Beijing (c.f. Fig. 1a in Wang et al., 2010b).           concentrations of O3 , CO, SO2 , and NOx during summer at
           We show later in this section that regional pollution played a        a polluted rural site (Gucheng), which is 110 km southwest
           vital role in the air quality during 20 July–8 August.                of Beijing, and found that 80% of the northward trajectories
              The concurrent measurements of ozone and sulfate (Fig. 2)          from the site passed Beijing in August. Guo et al. (2010)
           reveal another interesting phenomenon: the highest ozone              compared particulate data at a site south of Beijing and an-
           concentrations preceded those of sulfate, indicating that             other site inside Beijing in the summer of 2006 and showed
           somewhat different meteorological conditions promoted the             that almost 90% fine sulfates were from regional contribu-
           formation of ozone and particulate sulfate. The high levels           tions.
           of ozone (and by inference other oxidants) may have accel-

           www.atmos-chem-phys.net/10/7603/2010/                                                    Atmos. Chem. Phys., 10, 7603–7615, 2010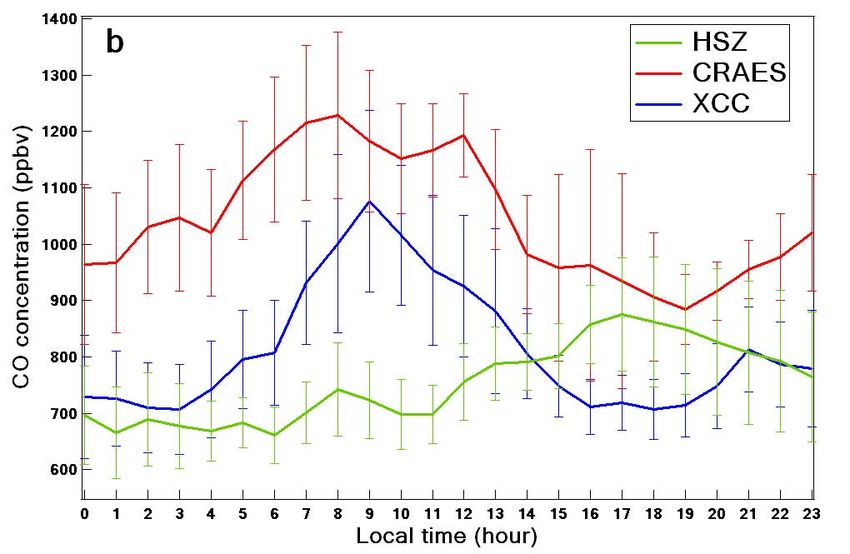
7610 T. Wang et al.: Air quality during the 2008 Beijing Olympics
should be pointed out that these estimates are likely to be the
lower limits of the regional contribution as additional ozone
was produced as the air was transported from the upwind site
and the urban site. Figure 7b shows the mean diurnal plot
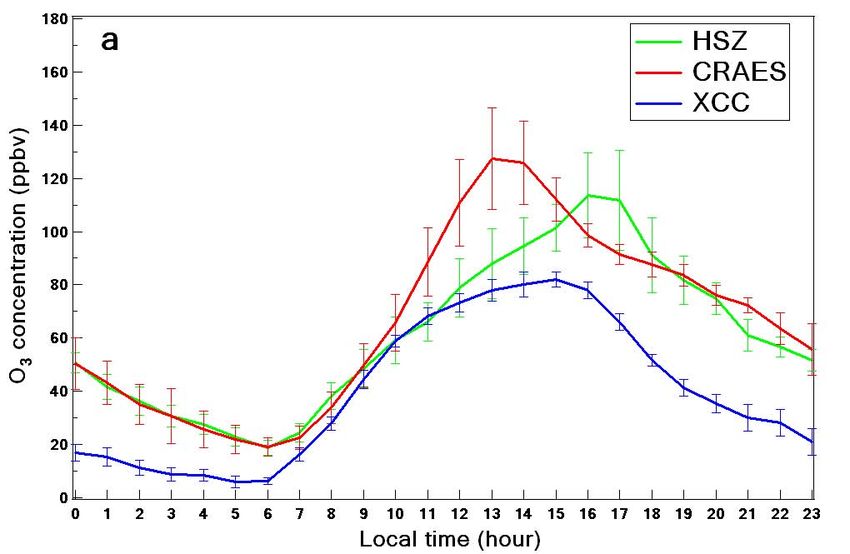
for CO for the eight cases. The mean CO concentration at
the upwind site was 69–91% of that at the urban site during
morning and early afternoon, indicating strong regional con-
tribution of CO (and possibly other ozone precursors). Emis-
sions from cities, townships, villages, and agriculture fields
in the North China Plain are believed to the sources.
Figure 7 shows that the ozone (and CO) peak at the down-
wind site lagged behind that at the urban site in time, which
indicates that regional and Beijing plumes were transported
to the mountain site in the afternoon (Wang et al., 2006). The
lower ozone peak values at the downwind site (except in two
cases) indicate that (1) ozone formation had reached maxi-
mum strength before reaching the site and/or (2) the ozone-
rich plumes had been subjected to dilution during transport.
3.3 Ozone production efficiencies in urban and down-
wind areas
Ozone is formed by the oxidation of VOCs in the presence
of NOx and sunlight. Ozone is produced when NOx is ox-
idized to various forms of NOy , such as nitric acid, aerosol
nitrate, and PAN. The ozone production efficiency (OPE),
defined as the number of O3 molecules produced for each
NOx molecule oxidized, can be expressed by the observed
O3 versus NOz (NOz =NOy -NOx ) (Trainer et al., 1993). In
polluted environments, O3 +NO2 versus NOz is often used to
Fig. 7. Average diurnal variation of (a) ozone and (b) CO at three consider the effect of NO titration. Figure 8 shows the scatter
sites for eight ozone-pollution days when southerly winds prevailed. plots at CRAES and HSZ for the hourly data collected in the
Vertical bars are half standard deviations.
afternoon (12:00–17:00, local time), which is when the max-
imum photochemistry occurs. (NOz was not measured at the
The concurrent observations of ozone at three sites in the southern site.) Expanding the period to include the data from
present study allow a direct examination of the regional con- 10:00 in the morning showed very similar regression slopes
tribution to ozone pollution in Beijing and the evaluation of with a smaller correlation coefficient (figure not shown).
Beijing plumes to downwind areas. To examine the regional Several interesting features were observed. First, the up-
contribution from the south, we selected days with ozone pol- per concentrations of ozone and NOz are comparable at the
lution (defined as 1-h ozone ≥100 ppbv at either of the three two sites despite the more remote location of HSZ, suggest-
sites) that met the following criteria: (1) a day on which all ing that both sites experienced serious photochemical pollu-
four backward trajectories were from the SE-S-SW sector tion. Second, a non-linear ozone-NOz relationship was ob-
and (2) surface winds were also from that sector through- served, with the slope ([O3 +NO2 ]/[NOz ]) at NOz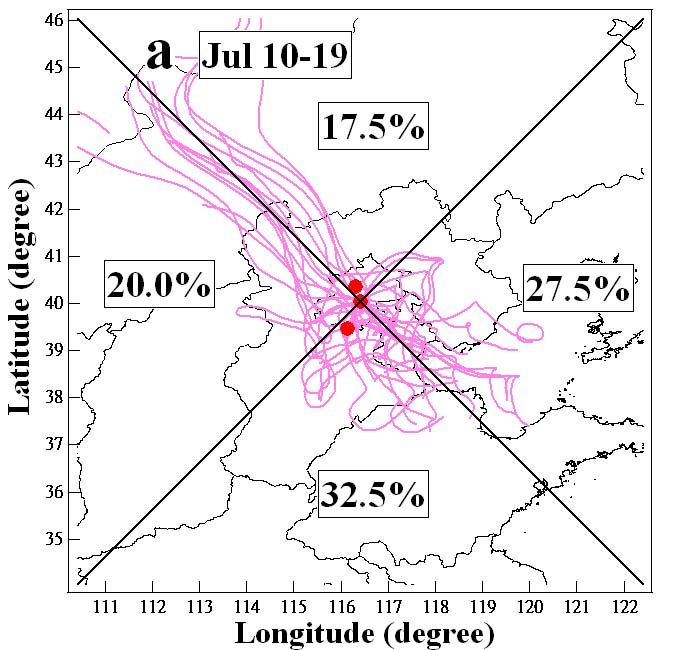
T. Wang et al.: Air quality during the 2008 Beijing Olympics                                                                       7611

Fig. 8. Scatter plots of O3 +NO2 versus NOz in the afternoon (12:00–17:00) at CRAES (red) and HSZ (green): (a) all data, (b) NOz
7612                                                                  T. Wang et al.: Air quality during the 2008 Beijing Olympics

Table 1. Comparison of chemical composition and meteorological parameters in plumes measured at a downwind site in north Beijing in
2005 and 2008.

                     Species/meteorological parameters             2005                2008           P (t-test)
                                                         Mean±stdev       n     mean±stdev      n
                     O3 (ppbv)                           59.4±30.5        212   54.5±28.4       446
T. Wang et al.: Air quality during the 2008 Beijing Olympics 7613
have decreased in the recent years, indicating reduced emis- tions of primary pollutants such as NOx and VOCs. How-
sions of these pollutants in Beijing (UNEP, 2009; Shao et ever, high levels of ozone (with hourly values up to 190 ppbv)
al., 2009). During the special control period, the emissions and secondary aerosols (with hourly sulfate up to 140 µg/m3 )
in Beijing of all the above pollutants have decreased (UNEP, still occurred at an urban site after the full control took ef-
2009; Wang et al., 2010b). Thus we believe the emissions fect, which was strongly associated with the transport of
of SO2 , CO, NOx , PM, most of VOCs in Beijing decreased chemically processed air masses from the North China Plain.
between the two data-collection periods in 2005 and 2008. Regional sources were shown to have significant contribu-
The emission trends in the North China Plain are less clear. tion to the concentrations of ozone and CO (approximately
National SO2 emission in China reached the peak in 2006 62% and 77%, on average, respectively) at the urban site un-
and decreased by 8.9% during 2005-2008 (NBSC, 2006- der southerly winds. Much improved air quality on most of
2009). The emission of NOx , on the other hand, is expected the days during the Olympics also had apparent relationship
to continue the recent upward trend (Zhang et al., 2009) due with weather changes (persistent rainfall, lower temperature,
to the slow implementation of advanced NOx control in coal- and easterly air flow). Further modeling studies are needed
fired power plants and to a relatively small decrease in NOx to quantify the relative role of the emission reduction and
emissions for new vehicles (Zhang et al., 2009; Zhao et al., weather changes and the contribution of local versus regional
2008). The CO emissions are thought to have stabilized due sources to the air quality changes.
to a sharp decrease in emissions from new cars (Zhang et al., By comparing with the data collected in July 2005 at the
2009), while the VOC emissions increased by 29% during plume-impacted downwind site, we found similar concen-
2001-2006. During the special control period, the emissions trations of PM2.5 mass, PM2.5 sulfate, total reactive nitrogen
of these pollutants are expected to have decreased, although and several long lived VOCs. We interpret this as evidence of
no information on the amount of the reduction is available. growing regional emissions during the past several years. On
With the consideration of the emission situation, we inter- the other hand, the sharp reductions in total CO, SO2 (and
pret the observed concentration changes in 2005 and 2008 total sulfur), and reactive aromatics suggest the success of
as follows. The decreases in the concentrations of SO2 (and the government’s efforts in reducing emissions in Beijing by
the total sulfur), CO, reactive aromatics in 2008 are mainly long-term and special measures. The increasing emissions
due to the long-term and special control measures imple- from regional sources could make the pollution control ef-
mented in Beijing: SO2 from control of emissions in coal- fects in Beijing less effective in mitigating ozone and fine
fired power plants, CO from reduced emissions from vehi- aerosol problems, which are regional in nature. Thus, more
cles and possibly also from open fires in the North China stringent controls of regional sources are needed to further
Plain, toluene, xylenes, and 1,2,4-trimethylbenzene from the improve the air quality in Beijing and the surrounding re-
control of emissions from vehicles and petrol stations and gions.
from solvent and paint use in the run up to and during the
Olympics. On the other hand, the insignificant changes in Acknowledgements. We thank Jing Wang, Rui Gao, Ravi Pathak,
aerosol (PM2.5 mass and sulfate), NOy , and longer lived Youping Shou, Linlin Wang, Chao Yuan, Pengju Xu, Zheng Xu,
NMHCs during the two periods imply increased emissions Yangchun Yu, Waishing Wu, Xuehua Zhou, Joe Cheung, and
Xuezhong Wang for their contributions to the field work. We
from sources outside Beijing and lacking stringent NOx con-
thank NOAA Air Resources Laboratory for the provision of the
trol in coal-fired power plants.
HYSPLIT model. This study was funded by the Research Grants
The increased regional emission during 2005–2008 in- Council of the Hong Kong Special Administrative Region (Project
ferred from the above analysis and the regional contribution No. PolyU 5294/07E), the National Basic Research Program of
to the very high concentrations of secondary air pollutants China (973 Project No. 2005CB422203), and the Hong Kong
after the drastic control measures in the summer of 2008 sug- Polytechnic University (Project No. 1-BB94).
gest that more stringent control of the regional emissions will
be needed in order to significantly improve the air quality Edited by: D. Parrish
(especially ozone and secondary aerosols) in Beijing and the
surrounding regions.
References
An, X., Zhu, T., Wang, Z., Li, C., and Wang, Y.: A modeling anal-
4 Summary and conclusions
ysis of a heavy air pollution episode occurred in Beijing, Atmos.
Chem. Phys., 7(12), 3103–3114, doi:10.5194/acp-7-3103-2007,
Atmospheric measurements from this work clearly demon- 2007.
strate the strong impact of regional sources and meteorology Cermak, J. and Knutti, R.: Beijing Olympics as an aerosol
on the variations of secondary pollutants (ozone, fine sulfate field experiment, Geophys. Res. Lett., 36, L10806,
and nitrate) in the summer of 2008 in Beijing. The pollution doi:10.1029/2009GL038572, 2009.
reductions measures for the Beijing Olympics in July and Chen, D. S., Cheng, S. Y., Liu, L., Chen, T., and Guo, X. R.: An
August were successful in reducing atmospheric concentra- integrated MM5-CMAQ modeling approach for assessing trans-
www.atmos-chem-phys.net/10/7603/2010/ Atmos. Chem. Phys., 10, 7603–7615, 20107614 T. Wang et al.: Air quality during the 2008 Beijing Olympics boundary PM10 contribution to the host city of 2008 Olympic X.Y., Zhang, Y. H., Wang, Z. F., Li, Z. P., Zhang, Q., Wang, L. summer games – Beijing, China, Atmos. Environ., 41 (6), 1237– T., Wang, B. Y., and Yu, C.: Air quality during the 2008 Beijing 1250, 2007. Olympic Games, Atmos. Environ., 41(3), 480-492, 2007. Chou, C. C. K., Tsai, C. Y., Shiu, C. J., Liu, S. C., and Zhu, T.: Mea- Trainer, M., Parrish, D. D., Buhr, M. P., Norton, R. B., Fehsenfeld, surement of NOy during Campaign of Air Quality Research in F. C., Anlauf, K. G., Bottenheim, J. W., Tang, Y. Z., Wiebe, H. Beijing 2006 (CAREBeijing-2006): Implications for the ozone A., Roberts, J. M., Tanner, R. L., Newman, L., Bowersox, V. production efficiency of NOx , J. Geophys. Res.-Atmos., 114, C., Meagher, J. F., Olszyna, K. J., Rodgers, M. O., Wang, T., D00G01, doi:10.1029/2008JD010446, 2009. Berresheim, H., Demerjian, K. L., and Roychowdhury, U. K.: Colman, J. J., Swanson, A. L., Meinardi, S., Sive, B. C., Blake, Correlation of ozone with NOy in photochemically aged air, J. D. R., and Rowland, F. S.: Description of the analysis of a Geophys. Res.-Atmos., 98(D2), 2917–2915, 1993. wide range of volatile organic compounds in whole air samples UNEP, United Nations Environmental Programme: Indepen- collected during PEM-Tropics A and B, Anal. Chem., 73 (15), dent Environmental Assessment Beijing 2008 Plympic Games, 3723–3731, 2001. Nairobi, Kenya, 2009, online available at: http://www.unep.org/ Daum, P. H., Kleinman, L. I., Springston, S. R., Nunnermacker, L. pdf/BEIJING REPORT COMPLETE.pdf, last access: March J., Lee, Y. N., Weinstein-Lloyd, J., Zheng, J., and Berkowitz, C. 2010. M.: Origin and properties of plumes of high ozone observed dur- Wang, B., Shao, M., Lu, S. H., Yuan, B., Zhao, Y., Wang, M., ing the Texas 2000 Air Quality Study (TexAQS 2000), J. Geo- Zhang, S. Q. and Wu. D.: Variation of ambient non-methane hy- phys. Res.-Atmos., 109, D17306, doi:10.1029/2003JD004311, drocarbons in Beijing city in summer 2008, Atmos. Chem. Phys., 2004. 10, 5911–5923, doi:10.5194/acp-10-5911-2010, 2010a. Guo, S., Hu, M., Wang, Z. B., and Zhao, Y. L.: Size-resolved Wang, L. T., Hao, J. M., He, K. B., Wang, S. X., Li, J. H., Zhang, Q., aerosol water-soluble ionic compositions in the summer of Bei- Streets, D. G., Fu, J. S., Jang, C. J., Takekawa, H., and Chatani, jing: implication of regional secondary formation, Atmos. Chem. S.: A modeling study of coarse particulate matter pollution in Phys., 10, 947–959, doi:10.5194/acp-10-947-2010, 2010. Beijing: Regional source contributions and control implications Hirsch, R. M. and Gilroy, E. J.: Methods of fitting a straight line for the 2008 Summer Olympics, J. Air & Waste Manage. Assoc., to data: examples in water resources, Water Res. Bull., 20(5), 58 (8), 1057-1069, 2008. 705–711, 1984. Wang, M., Zhu, T., Zheng, J., Zhang, R. Y., Zhang, S. Q., Xie, Jia, Y. T., Rahn, K. A., He, K. B., Wen, T. X., and Wang, Y. S.: A X. X., Han, Y. Q., and Li, Y.: Use of a mobile laboratory to novel technique for quantifying the regional component of urban evaluate changes in on-road air pollutants during the Beijing aerosol solely from its sawtooth cycles, Geophys. Res. Lett., 113, 2008 Summer Olympics, Atmos. Chem. Phys., 9, 8247–8263, D21309, doi:10.1029/2008JD010389, 2008. doi:10.5194/acp-9-8247-2009, 2009a. Lin, W. L., Xu, X. B., and Zhang, X. C.: Characteristics of gaseous Wang, S. X., Zhao, M., Xing, J., Wu, Y., Zhou, Y., Lei, Y., He, K. B., pollutants at Gucheng, a rural site southwest of Beijing, J. Geo- Fu, L. X., Hao, J. M.: Quantifying the Air Pollutants Emission phys. Res.-Atmos., 114, D00G14, doi:10.1029/2008JD01 0339, Reduction during the 2008 Olympic Games in Beijing, Environ. 2009. Sci. Technol., 44(7), 2490–2496, 2010b. Liu, J. F., Mu, Y. J., Zhang, Y. J., Zhang, Z. M., Wang, X. K., Liu, Wang, T., Cheung, V. T. F., Anson, M., and Li, Y. S.: Ozone and Y. J., and Sun, Z. Q.: Atmospheric levels of BTEX compounds related gaseous pollutants in the boundary layer of eastern China: during the 2008 Olympic Games in the urban area of Beijing, Overview of the recent measurements at a rural site, Geophys. Sci. Total Environ., 408, 109–116, 2009. Res. Lett., 28(12), 2373–2376, 2001. Mijling, B., van der A, R. J., Boersma, K. F., Van Roozendael, M., Wang, T, Ding, A. J., Gao, J., and Wu, W. S.: Strong ozone produc- De Smedt, I., and Kelder, H. M.: Reductions of NO2 detected tion in urban plumes from Beijing, China, Geophys. Res. Lett., from space during the 2008 Beijing Olympic Games, Geophys. 33, L21806, doi:10.1029/2006GL027689, 2006. Res. Lett., 36, L13801, doi:10.1029/2009GL038943, 2009. Wang, W. T., Primbs, T., Tao, S., and Simonich, S. L. M.: At- NBSC, National Bureau of Statistics of China: China Statistical mospheric Particulate Matter Pollution during the 2008 Beijing Yearbook, 2006–2009, China Statistics Press: Beijing, 2006– Olympics, Environ. Sci. Technol., 43(14), 5314–5320, 2009b. 2009. Wang, X., Westerdahl, D., Chen, L.C., Wu, Y., Hao, J. M., Pan, Nunnermacker, L. J., Imre, D., Daum, P. H., Kleinman, L., Lee, Y. X. C., Guo, X. B., and Zhang, K. M.: Evaluating the air qual- N., Lee, J. H., Springston, S. R., Newman, L., Weinstein-Lloyd, ity impacts of the 2008 Beijing Olympic Games: On-road emis- J., Luke, W. T., Banta, R., Alvarez, R., Senff, C., Sillman, S., sion factors and black carbon profiles, Atmos. Environ., 43(30), Holdren, M., Keigley, G. W., and Zhou, X.: Charaterization of 4535–4543, 2009c. the Nashville urban plume on July 3 and July 18, 1995, J. Geo- Wang, Y., Hao, J., McElroy, M. B., Munger, J. W., Ma, H., Chen, phys. Res., 103(D21), 28129–28148, 1998. D., and Nielsen, C. P.: Ozone air quality during the 2008 Beijing Pathak, R. K., Wu, W. S, and Wang, T.: Summertime PM2.5 ionic Olympics-effectiveness of emission restrictions, Atmos. Chem. species in four major cities of China: nitrate formation in an Phys., 9, 5237–5251, doi:10.5194/acp-9-5237-2009, 2009d. ammonia-deficient atmosphere, Atmos. Chem. Phys., 9, 1711– Witte, J. C., Schoeberl, M. R., Douglass, A. R., Gleason, J. F., 1722, doi:10.5194/acp-9-1711-2009, 2009. Krotkov, N. A., Gille, J. C., Pickering, K. E., and Livesey, N.: Shao, M.,Wang, B., Lu, S. H., Liu, S. C., and Chang, C. C.: Satellite observations of changes in air quality during the 2008 Trends in summertime non-methane hydrocarbons in Beijing Beijing Olympics and Paralympics, Geophys. Res. Lett., 36, City, 2004–2009, IGACtivity News Letter, 42, 18–25, 2009. L17803, doi:10.1029/2009GL039236, 2009. Streets, D. G., Fu, J. S., Jang, C. J., Hao, J. M., He, K. B., Tang, Wood, E. C., Herndon, S. C., Onasch, T. B., Kroll, J. H., Cana- Atmos. Chem. Phys., 10, 7603–7615, 2010 www.atmos-chem-phys.net/10/7603/2010/
T. Wang et al.: Air quality during the 2008 Beijing Olympics                                                                       7615

  garatna, M. R., Kolb, C. E., Worsnop, D. R., Neuman, J.              Zhang, Q., Streets, D. G., Carmichael, G. R., Huo, H., Kannari, A.,
  A., Seila, R., Zavala, M., and Knighton, W. B.: A case                 Klimont, Z., Park, I. S., Reddy, S., Fu, J. S., Chen, D., Duan,
  study of ozone production, nitrogen oxides, and the radical            L., Lei, Y., Wang, I. T., and Yao, Z. L.: Asian emissions in 2006
  budget in Mexico City, Atmos. Chem. Phys., 9, 2499–2517,               for the NASA INTEX-B mission, Atmos. Chem. Phys., 9 (14),
  doi:10.5194/acp-9-2499-2009, 2009.                                     5131–5153, doi:10.5194/acp-9-5131-2009, 2009.
Wu, W. S. and Wang, T.: On the performance of a semi-continuous        Zhao, Y., Wang, S. X., Duan, L., Lei, Y., Cao, P. F., and Hao, J.
  PM2.5 sulphate and nitrate instrument under high loadings of           M.: Primary air pollutant emissions of coal-fired power plants
  particulate and sulphur dioxide, Atmos. Environ., 41(26), 5442–        in China: Current status and future prediction, Atmos. Environ.,
  5451, 2007.                                                            42(36), 8442–8452, 2008.
Zaveri, R. A., Berkowitz, C. M., Kleinman, L. I., Springston, S.
  R., Doskey, P. V., Lonneman, W. A., and Spicer, C. W.: Ozone
  production efficiency and NOx depletion in an urban plume: In-
  terpretation of field observations and implications for evaluating
  O3 -NOx -VOC sensitivity, J. Geophys. Res.-Atmos., 108(D19),
  4436, doi:10.1029/2002JD003144, 2003.

www.atmos-chem-phys.net/10/7603/2010/                                                    Atmos. Chem. Phys., 10, 7603–7615, 2010
You can also read