Personal Air Pollution Monitoring Technologies: User Practices and Preferences - UIC HCI
←
→
Page content transcription
If your browser does not render page correctly, please read the page content below
Personal Air Pollution Monitoring Technologies: User
 Practices and Preferences

 Nina Sakhnini1, Ja Eun Yu1, Rachael M. Jones2, and Debaleena Chattopadhyay1*
 1 University of Illinois at Chicago, Chicago, USA
 2 The University of Utah, Utah, USA

 * debchatt@uic.edu

 Abstract. Long-term exposure to air pollution can cause adverse health effects.
 Many efforts are underway to develop affordable, portable, and accurate tech-
 nologies to help people monitor air pollution regularly. Although personal,
 wearable air pollution monitoring technologies are popular among some tech-
 nology enthusiasts and citizen scientists, we know little about air pollution
 monitoring practices and preferences of lay individuals. We conducted a se-
 quential explanatory mixed-methods study (n = 321) to understand people's cur-
 rent air pollution monitoring practices and their requirements for personal air
 pollution monitoring technologies. Although concerned about the adverse ef-
 fects of air pollution (94%), less than 10% reported checking the levels of air
 pollution at least once a week. Respondents were more likely to carry a moni-
 toring device as a bag accessory (74%) or wear it on their wrist (42%), than
 around their shoes, waist, or neck. If monitoring were available, however, it was
 unclear how much that would manifest behavior changes in individuals. We
 discuss how our findings can inform future technology design.

 Keywords: Air Pollution Monitoring, Wearable, User Survey, Ubiquitous
 Computing, User Requirements, Design.

1 Introduction

 Long-term exposure to air pollution is a well-established risk factor for several
chronic diseases [1, 2, 3]. The World Health Organization attributes about 7 million
premature deaths globally to air pollution [4]. Most recently, an increase of 1 /
in PM2.5 exposure was reported to be associated with an 8% increase in the COVID-
19 (coronavirus disease) death rate [5]. Air pollution exposure accumulates over time,
as individuals repeatedly come in contact with air pollutants, such as Carbon Monox-
ide (CO), Nitrogen Dioxide (NO2), Ozone (O3), or Particulate Matter (PM).
 Traditionally, air pollution exposure is assessed retrospectively, at the population
level, using kriging or land-use regression modeling based on highly sophisticated
monitoring networks that collect data over time [6, 7]. In recent years, many low-cost
air quality sensors have emerged. While there are some limitations to their perfor-
mance, including sensitivity to relative humidity and aerosol composition [8, 9, 10],
the latest generation of sensors have been found to have good long-term performance
2

[9] and reasonable accuracy and precision with calibration [11, 12]. These sensing
advances have inspired many ubiquitous computing solutions to better understand the
air pollution landscape of urban areas—via mobile measurement stations [13, 14, 15]
or participatory urban sensing [16, 17].
 The advances in low-cost air quality sensors have also made personal air pollution
monitoring feasible, i.e., directly monitoring one’s own exposure to air pollution over
time. While the traditional air quality sensors (found in governmental monitoring
stations) are large, expensive (> $20,000), stationary, and needs routine maintenance,
the latest sensors are small (~ 5 cm), mobile, low-cost ($50 – $500), and do not re-
quire domain expertise to use when paired with appropriate data processing algo-
rithms. Systems utilizing these low-cost air quality sensors can now (reasonably)
accurately measure different air pollutants—from volatile organic compounds, like
CO and O3, to particulate matters, like PM10 and PM2.5 [17, 18, 19, 20].
 Nevertheless, the design and development of personal air pollution monitoring sys-
tems have just begun. Although portable and stationary indoor air quality monitoring
devices have garnered some popularity among mainstream consumers [21], wearable
environmental monitoring systems [22] still largely cater to citizen science and scien-
tific research [17, 20, 23, 24]. Only a few, introduced most recently, target the general
public [25, 26]; the extent of their acceptance, challenges, or use, however, remains
unexplored.
 Although prior research has repeatedly demonstrated the technological feasibility
of affordable and accurate personal air pollution monitoring wearables [18, 19, 27],
we know little about how people currently monitor air pollution around them or their
preferences in personal air pollution monitoring technologies. To address this gap in
the human-computer interaction (HCI) literature, we conducted a mixed-methods
study to understand people’s current air pollution monitoring practices and elicit their
requirements for personal air pollution monitoring technologies. Drawing on empiri-
cal data, this paper contributes user requirements and design tradeoffs for personal air
pollution monitoring technologies.

2 Methods

We adopted a sequential explanatory mixed-methods design to examine air pollution
monitoring practices and preferences [28]. A mixed-methods design combine quanti-
tative and qualitative methods to complement each other and allow for a more robust
analysis than using only either one of the methods. A sequential explanatory mixed-
methods design include two distinct phases: collecting and analyzing quantitative data
followed by collecting and analyzing qualitative data. The quantitative phase informs
the research questions of the qualitative phase. In turn, the qualitative data provides
refinement and explanation of the statistical results in the quantitative data.
 In our study, a set of qualitative interviews with technology probes (n = 7) fol-
lowed an online survey (n = 314). Next, we discuss the quantitative results from the
survey in Section 3 and the qualitative interviews in Section 4.
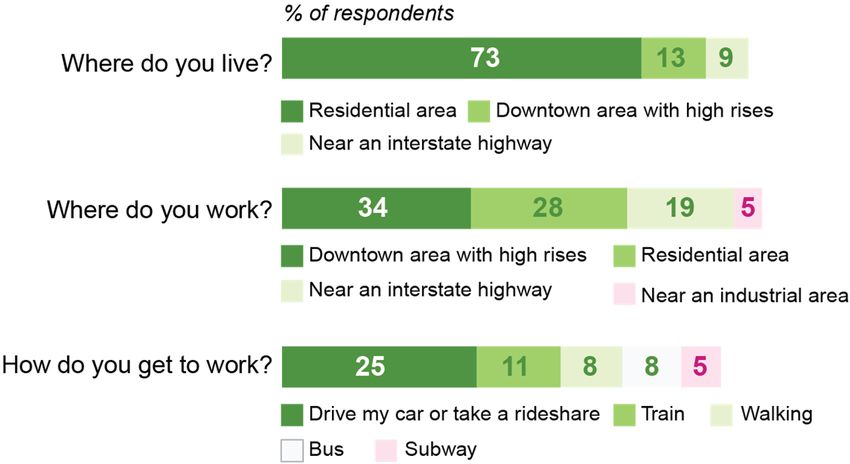
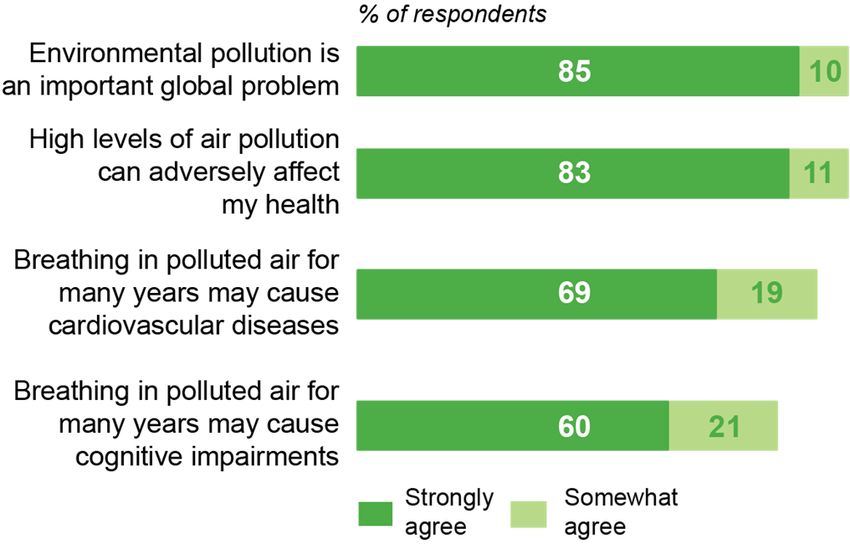
3

3 User Survey

3.1 Method
We designed an online survey with twenty-seven multiple-choice questions (Appen-
dix A) to elicit (1) air pollution monitoring practices, (2) preferences about monitor-
ing air pollution exposure, (3) sociodemographic characteristics, and (4) environmen-
tal attitudes. The survey was open for responses between April and November 2019.
The target population was adults living and/or working in a metropolitan area. Re-
cruitment occurred via advertisements on social media outlets, university mailing
lists, and distributed by local community organizations. One participant was randomly
selected to receive a $50 gift card. This study was reviewed and approved by the uni-
versity’s institutional review board (IRB).

3.2 Results
Demographics. A total of 314 respondents completed the survey. Respondents were
53.8% male and 43.3% female. Most of the respondents were between 18 to 44 years
old (88.8%), Caucasian (44.1%), and employed (63.7%). Nearly half of the respond-
ents’ annual household income was less than $50,000 (46.6%), and only a quarter
reported to be in a technical industry (25%). Respondents were largely from the
greater Chicago area in midwestern United States. Detailed demographics are shown
in Table 1.

Fig. 1. Most of the respondents lived in a residential area (73%) and worked in a downtown
area with high rises or residential area (62%).

Most respondents lived in a residential area (73%), worked in a downtown or residen-
tial area (62%), and went to work by car (Figure 1). Most respondents considered
environmental pollution as an important global problem and expressed concern about
the adverse health effects of chronic exposure to air pollution (Figure 2).
4

Fig. 2. A majority of respondents showed concern about the adverse health effects of air pollu-
tion. (5-Point Likert Scale)

 Table 1. Participant Sociodemographics.
 Participant Characteristics (n = 314) Descriptive Statistics
 Gender, n (%)
 Male 169 (53.8)
 Female 136 (43.3)
 Other 9 (2.9)
 Age, n (%)
 18 – 24 164 (52.2)
 25 – 44 115 (36.6)
 45 – 64 24 (7.6)
 65 or older 11 (3.5)
 Ethnicity, n (%)
 Caucasian 137 (44.1)
 African American 24 (7.7)
 Hispanic or Latino 52 (16.6)
 Education Level, n (%)
 Less than 4-year college 127 (40.5)
 4-year college or more 187 (59.5)
 Annual household income, n (%)
 Less than $50,000 132 (46.6)
 $50,000 – $100,000 84 (29.7)
 More than $100,000 67 (23.7)
 Employed, n (%) 200 (63.7)
 Primary industry, n (%)
 Scientific or Technical Services 29 (10.2)
 Software 42 (14.8)
 Computers and Electronics Manufacturing 17 (6)
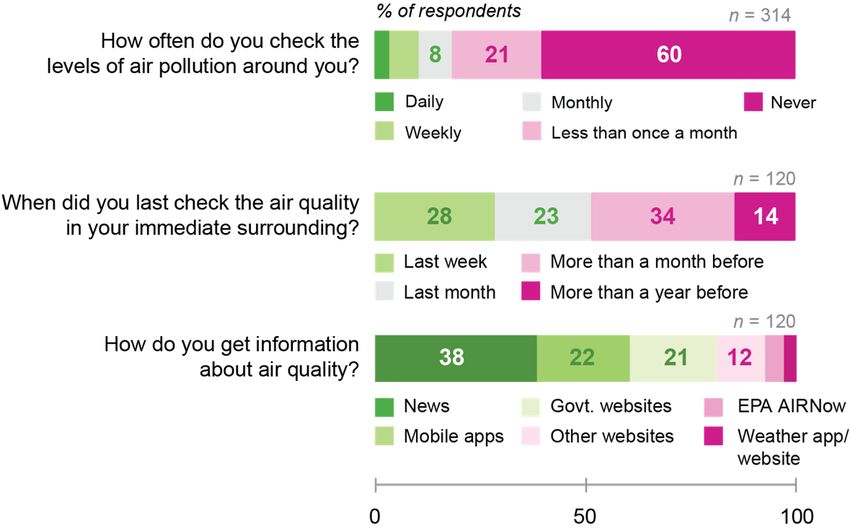
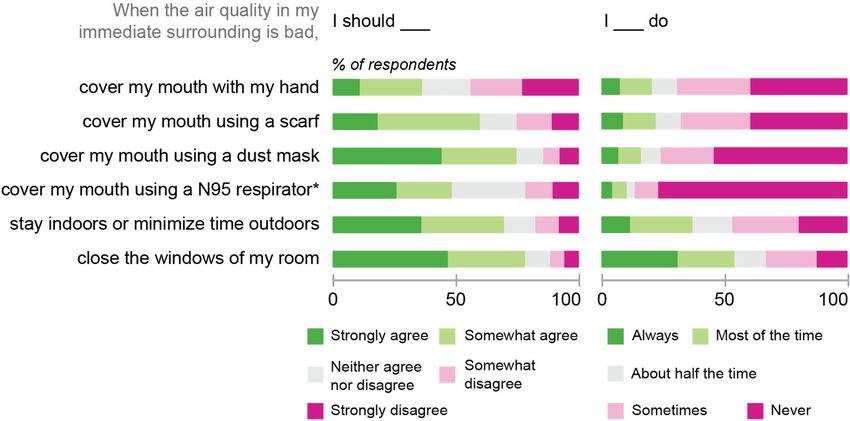
5

Pollution Monitoring Practices. Although concerned about air pollution and its ad-
verse effects (Figure 2), less than 10% of the respondents reported checking the levels
of air pollution at least once a week. A majority of the respondents (60%) never
checked air pollution levels (Figure 3).

Fig. 3. Most of the respondents reported never checking the levels of air pollution around them.
Among those who did, the top three sources of information were news, mobile apps, and gov-
ernment websites.

 Fig. 4. Most respondents were aware of how to minimize exposure to air pollution, but few
always took those steps. (*survey conducted before the 2019 – 20 coronavirus pandemic)
 Among respondents who did check the air quality around them, diverse sources of
information were used, including: the news (38%), mobile apps (22%), government
websites (21%), or other websites (12%). Only nine (2.9%) respondents (either col-
lege students or people with an annual income of $100,000 or more) reported using
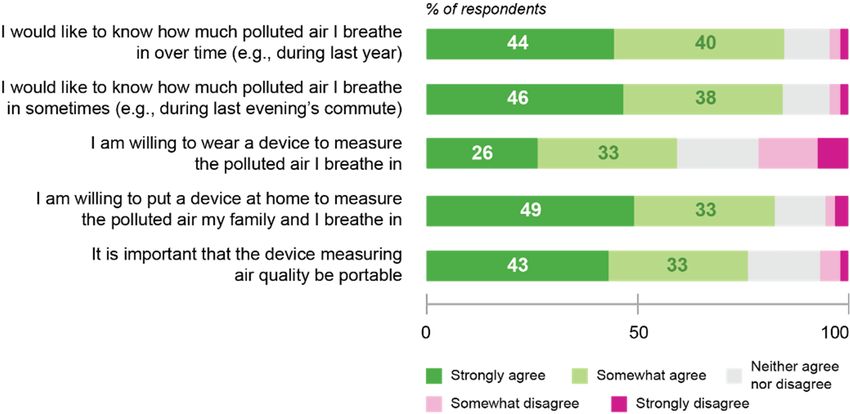
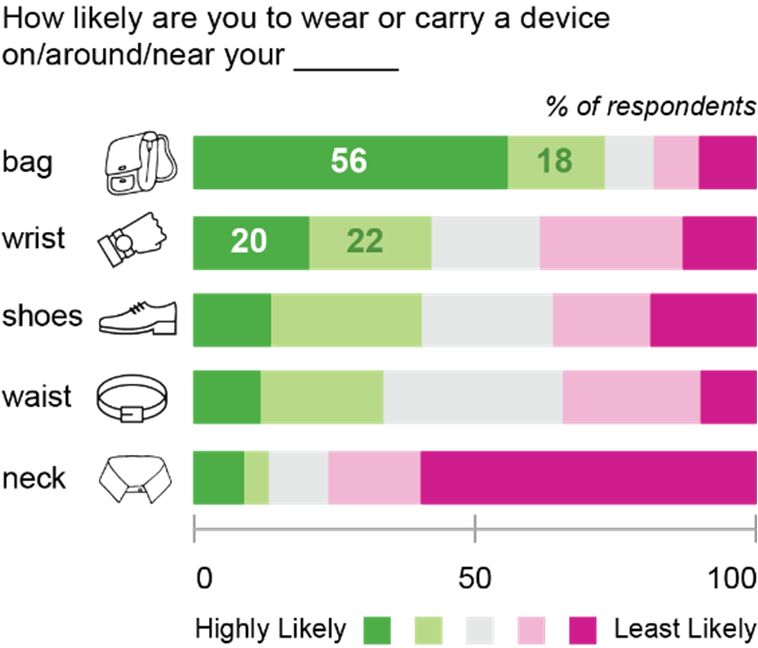
6

any air quality monitoring devices. Those devices varied widely, from custom-made
sensor boards to off-the-shelf products, like AirBeam1, Dyson Pure Cool2, Foobot3
and Awair4. Two respondents reported using air purifiers as air quality monitors, alt-
hough such devices do not directly offer air quality data to users. One person referred
to his body as an air pollution monitoring device.
Most respondents were aware of how to minimize exposure to air pollution when air
quality was poor, such as: to use a dust mask (74.5%), minimize time outdoors
(69.4%), or close the windows of a room (78%). Respondents, however, rarely took
all those steps (Figure 4).

Fig. 5. The majority of respondents (84%) wanted to know how much air pollution they breathe
in with time and were more willing to have a portable air quality monitoring device at home
(82%) than to wear a device (59%).

Pollution Monitoring Preferences. Majorities of respondents wanted to know how
much air pollution they breathe in, both over the long-term (e.g., over the last year,
84%) and short-term (e.g., during last evening’s commute, 84%). While 82% of re-
spondents were willing to have a portable air quality monitoring device at home, 59%
were willing to wear one. Most respondents (76%) valued portability in an air quality
monitoring device (Figure 5). When suggested that a personal device may more accu-
rately measure their exposure to air pollution than estimates across neighborhoods
from fixed monitoring sites, respondents were more likely to carry a device as a bag
accessory (74%) or wear a device on their wrist (42%), than a device on or near their
shoes, waist, or neck (Figure 6).

1 https://www.habitatmap.org/airbeam
2 https://www.dyson.com/purifiers/dyson-pure-cool-overview.html
3 https://foobot.io/
4 https://getawair.com/
7

Fig. 6. The top two form-factor choices for a personal air quality monitoring device were bag
accessory and wristwear.

Summary. In a convenience sample of 314 people living/working in a midwestern
US metropolitan area, who were concerned about the adverse effects of air pollution,
we found a considerable preference for monitoring personal pollution exposure (Fig-
ure 5). However, most respondents reported that they currently do not check or meas-
ure air pollution levels around them (Figure 3). Nevertheless, more people wanted to
have a portable at-home air quality monitoring device than a wearable (Figure 5).
 Greater Chicago has relatively low air pollution than many other parts of the world,
which may have been why many respondents in this study reported never checking air
pollution levels. The infrequent use of air pollution monitors may be due, in part, the
relatively high cost of consumer-grade air quality monitoring devices ($200+), and/or
their recent availability in the marketplace.
 With respect to the design of personal air quality monitoring devices, respondents
preferred to clip it on a bag or wear it on the wrist (Figure 6). Note that the age of our
survey respondents was skewed toward the young (Table 1); thus, all our results may
not extend to an older population. Furthermore, the levels of education and income do
not appropriately reflect the full gamut of socioeconomical statuses (SES); air pollu-
tion monitoring practices and preferences of people with low SES or less formal edu-
cation might be different from our survey findings.
 While the survey results indicated a general preference toward personal air pollu-
tion monitoring, the data could not clarify 1) why people might not want to monitor
air pollution, 2) why they preferred a keychain or wrist-wear like form factor, and 3)
how would they use the monitoring data (given that most people rarely take actions to
reduce their air pollution exposures). To find out, we designed an in-depth qualitative
study with a technology probe.
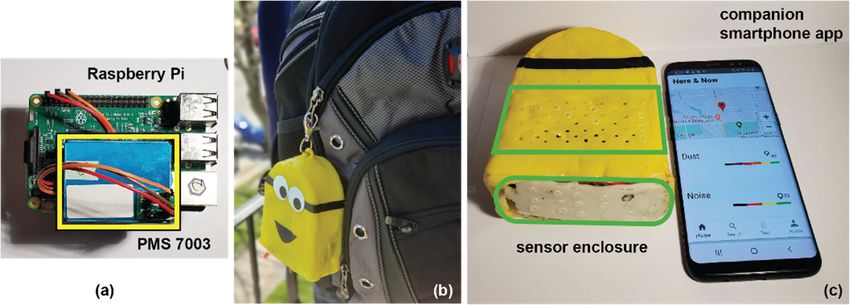
8

4 Technology Probe Study

4.1 The Technology Probe
Technology probes are commonly used in HCI to collect information about the use
and users of a technology. In this approach, users explore a fully functional technolo-
gy prototype to think about how and whether the technology can support their needs
and desires [29]. As a technology probe, we designed a personal air pollution moni-
toring tool using off-the-shelf air quality monitoring sensors (Figure 7).

Fig. 7. Using a low-cost, off-the-shelf air quality sensor (a), we developed a technology probe
for our interviews—a keychain device (b) with a companion smartphone application (c).

 The probe used a $30 off-the-shelf particle concentration sensor, Plantower
PMS7003 (48 mm x 32 mm x 12 mm). The PMS7003 operates using the principle of
light scattering to measure the number concentration of airborne particles with aero-
dynamic diameters < 2.5 (PM2.5) in real-time. The sensor was mounted on a third-
generation single-board computer, Raspberry Pi 3b+ (85 mm x 56 mm x 17 mm),
which included a 1.4 GHz 64-bit quad-core processor, a Bluetooth module, Wi-Fi, 1
GB RAM, and 16 GB storage. The Pi was powered with a 1000 mAh rechargeable
LiPo battery at 3.7 V (30 mm x 40 mm x 7 mm). The device weighed about 100 gms.
 Python scripts read data from the PMS7003, wrote data to a local or cloud data-
base, and sent data to a companion smartphone application. When the device could
connect to a wireless network, the sensor readings were logged to the cloud database
(Amazon Web Services); otherwise, sensor readings were logged onto the smartphone
via Bluetooth and sent to the cloud by the app when an internet connection became
available. An Android application visualized the airborne particle concentrations so
that users could monitor their current exposure to PM2.5 (Figure 7c) and logged geolo-
cation using the smartphone’s global positioning system (GPS) receiver.

4.2 Method
In this phase, we targeted people who resided near an industrial area and/or belonged
to a vulnerable group (e.g., older adults, people with cardiovascular or respiratory
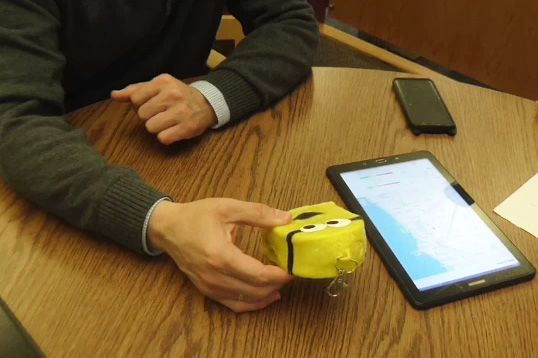
9

conditions). We chose this group as they could get a more immediate advantage from
personal air pollution monitoring technologies as well as have specific system re-
quirements that might not have emerged from the survey. Participants were recruited
via social media posts and partnerships with local community organizations. Partici-
pants were not affiliated with the authors’ institution.
 Participants explored the technology probe, asked questions about it to the re-
searchers, and then discussed whether they would use a similar technology, why or
why not, and how. The study session lasted for about 30 to 40 minutes. The study was
approved by the institutional IRB and participants were compensated with a $10 gift
card for their time. Sessions were audio recorded, and iteratively analyzed for themes
via memoing and group discussions.

 Fig. 8. A study participant exploring the technology probe during the study.

4.3 Results
 We interviewed seven individuals residing in the greater Chicago area. Their de-
mographics are shown in Table 2. All participants reported strong concerns about the
adverse health effects of air pollution. The first and last author open coded the data to
uncover themes. Initial themes included how people see or smell air pollution around
them, health concerns due to bad air quality, behaviors around bad air quality, advo-
cacy, and interest in monitoring air pollution exposure. After further reflection and
analysis via memoing and axial coding, the following five themes emerged5.

5 Negative or less than enthusiastic comments about personal air pollution monitoring are
 emphasized in red.
10

 Table 2. Participant Sociodemographics
Participant Age Gender Characteristic(s)
1 35 Male lives in/near a heavy industrial area
2 72 Female older adult, cardiovascular condition
3 27 Female chronic respiratory condition, lives near a heavy industrial area
4 55 Female chronic respiratory disease
5 70 Male older adult
6 69 Female older adult
7 47 Male chronic respiratory condition

Smaller, Lighter, Modular. Participants wanted a system they could use both on-
the-go and at home:
 I’d think just with you. And then if you’ve it on your home, you could just
 mount it, if it needs to be charged, and that’s your home system —P1
 I think it should be… especially for people like me...I have sinus problems
 and dust triggers sinus I think it will be very beneficial for people to use
 everywhere...in and out...with asthma and sinus infection —P7
After exploring the technology probe, people wanted a smaller and lighter version
(“consolidated, compressed…size, maybe half of this”, “an option of a watch is a
good one”, “like a television remote control”, “it’s too bulky”), something modular
enough to wear, carry, or stow at home:
 You can use a bigger one at home because you are putting it in one place
 [...] and then much more portable when you are out —P5
 Or almost similar to the air fresheners they have in the car and as you are
 driving wherever you go ... in the same context...because then you could
 just bring it home —P1

To Monitor or not to Monitor. Monitoring attitudes differed across participants.
Some wanted to know the air quality in their immediate surroundings to take actions,
while others expressed apathy, anxiety, and almost a comfort in not knowing.
 Well I guess I’d avoid if it was indicating that it was high levels ... I’d try to
 avoid it [the place] —P2
 It’s good to know if the air around us is polluted with some of these [...]
 that could cause cancer at the long run right. So we get ahead of that [...] if
 we can detect it early enough then we can save the younger generation
 —P7
 Would I like to [monitor air quality]? Well ... the problem is if you monitor
 it what can you do about it. [...] To me it’s almost better not to know. —P6
11

 If we went from red green yellow [...] will it give a person a sense of panic
 to a certain degree [...] I will be panicked..I will be like I gotta get out of
 here. I mean it’s good but like do I really wanna panic all the time about
 seeing something..uhm..I don't know. —P3

Access to Longitudinal Data. People wanted easy access to their long-time exposure
data—to understand triggers to their chronic health conditions, inform others, and be
aware of their neighborhood air quality.
 Yeah, I think year long would be good. Just because I’d like to know if the
 pollutions are actually irritating me more and when ... are they really cor-
 relating to when I get sick because it’s the cold or they're correlating be-
 cause there is something in the air. —P3
 [...] it could tell you the quality of the air per where you were in the day. So
 now you have a better idea ok the air was terrible [...] you could look at
 where was I, what was I doing while I was there, and then you could even
 send that back to those people and say hey can you do something about
 your air quality there —P1
 I might consider at some point where can I move to where there is less pol-
 lution. If I can compare like living here in the city to maybe [...] depending
 on how it affected me personally like noticing that my health was being af-
 fected where can I live that there’s less of this —P4

Ambivalence toward Lifestyle Changes. If personal pollution monitoring were
available, how much people would change their behaviors to reduce air pollution
exposure was fraught with ambivalence. Some were optimistic about actions they
could/would take, while others were realistic about the lack of actionable steps out-
side home.
 I will analyze it and see how safe to live in that area and if it is not safe ei-
 ther we do something about it and if it’s not in our power we move —P7
 how can I better it like presenting this stuff to your bosses and you cowork-
 ers to say this is how bad the air is here, what can we do to clean it —P1
 If it’s indoors [...] I can maybe install a filtration or air cleaning system. I
 don’t know what I can really do about it [pollution] as far as what’s outside
 unless we start wearing those [...] protective masks or walk around in those
 hazmat suits —P4
 There’s not much really that you can do other than promote like carpool or
 walking —P3

Advocacy Goals. An interest in using the data to advocate for environmental changes
at a community or state level emerged.
12

 well if your neighbors all had something similar you could petition to your
 alderman to do something about the air quality or if there’s a city bureau. I
 mean if you have data that’s why you go up there [town hall, local govern-
 ment] you don’t use opinions —P6

4.4 Summary
The interview data elaborated our survey findings. The limited options in controlling
personal exposure to air pollution appeared to demotivate the use of any personal air
pollution monitoring tool. The qualitative data also elaborated the form factor re-
quirements of a personal air pollution monitoring tool beyond a particular accessory
type. Different ways of using exposure data emerged, such as to correlate with sick
days, to decide which neighborhood to live in, or to share it with community leaders
to facilitate changes beyond one’s personal control. Next, we discuss the user re-
quirements that emerged from the mixed-methods study and identify the associated
design tradeoffs.

5 Discussion

Study results indicate that among people who are concerned about the adverse effects
of air pollution, there is a high preference for monitoring personal pollution exposures
over time (84%, Figure 5). However, despite that, and the current pollution monitor-
ing technologies available at no additional cost, such as government websites6 or
smartphone apps, most people never check the levels of air pollution around them
(60%, Figure 3). One could reasonably argue that this might be because those widely
available air pollution monitoring technologies are rarely personal; they offer air pol-
lution estimates at the county or neighborhood level. For instance, there are four
PM2.5 governmental monitoring stations in greater Chicago, and most operate on a 1-
in-6 or 1-in-4-day sensing schedule [30]. Nevertheless, other factors emerged from
our study that has important implications for the future uptake and use of personal air
pollution monitoring technologies.

5.1 Design Issues
Our study revealed a set of preferences for a personal air pollution monitoring device,
such as high mobility, lightness, and easy access to longitudinal data. From what we
know technologically about how current personal air pollution monitoring works [22],
user requirements did not always align with the optimal operating conditions. User
preferences for form factors may have been biased by the ubiquitous computing de-
vices in wide use today, like smartphones and smartwatches. Table 3 lists the user
requirements that emerged from our study, some design solution examples, and de-
sign tradeoffs associated with those solutions. In describing the design requirements

6 https://www.airnow.gov/
13 for personal air pollution monitoring systems, we do not anchor to a particular tech- nology or sensor; rather, we acknowledge the current technological limitations in the personal air pollution monitoring field [22]. Table 3. User Requirements for Personal Air Pollution Monitoring Systems. User Requirement Design Solution Associated Design Tradeoff(s) (for example) A small, light, carri- A wearable wrist- Accuracy may be unreliable at certain able system worn monitor using concentrations of air pollutants low-cost sensor com- A smaller battery implies repeated charging ponents Human skin emissions may interfere with air pollutant readings Good accuracy A correction model Additional environmental sensors may be to calibrate the sensor needed to achieve good calibration; thus, performance making the system bulkier and/or larger Multiple calibrations may be needed to address sensor ageing effects, seasonal changes, or any prior calibration errors Easy access to daily, Offer a companion Long-term air pollution exposure affects weekly, monthly, app/website with health outcomes differently for different and yearly average daily, weekly, month- demographics, but that research is still in air pollution expo- ly, and yearly aver- its early stages and not yet fully standard- sure data age air pollution ized exposure and levels Data may generate anxiety and helpless- for adverse health ness among users without the means to take effects any steps to reduce pollution exposure Tangible actions to Use time and location Asking users to have their GPS always on reduce air pollution (GPS) information to will have privacy issues exposure identify pollution Logging users’ location information to hotspots aggregate long-term pollution exposure da- ta will make them vulnerable to security breaches 5.2 Socioeconomic Issues Very few people (2.9%) reported owning/using an air pollution monitoring device. Furthermore, higher levels of education and income correlated with the ownership of a personal air pollution monitoring technology. This was expected given the current innovation stage of personal pollution monitoring technologies. As the sensing tech- nology advances, these systems are expected to get affordable and widely available. Nevertheless, the qualitative data indicated that people perceive air pollution as a public health issue, not a personal issue. Thus, participants expected air pollution monitoring devices to be made freely available by the city or state as a utility, not something they would want to buy personally. This view was expressed by three older participants (P4, 55; P5, 70; P6; 69) in our interviews. Older adults, however, are
14

more vulnerable to air pollution and could get a more immediate advantage from per-
sonal air pollution monitoring. Note that participants self-selected for our study,
which already indicated an interest in the technology. We observed that the willing-
ness to pay (WTP) widely varied by age. Future controlled studies with larger sample
sizes are needed to confirm this trend. Nevertheless, it is worth noting that personal
air pollution monitoring can be most beneficial to the older adults and people with
low SES.

5.3 Sociotechnical Issues
Our interviews revealed that even if an affordable and accurate air pollution monitor-
ing device is available, some people may not want to use it regularly because of the
lack of tangible steps available to an individual to reduce personal air pollution expo-
sure. This finding unveils an interesting dichotomy. If enough people are monitoring
and trying to reduce their personal air pollution exposure, apart from individual life-
style changes, their awareness and advocacy can bring about big societal changes.
Unfortunately, the prospect of only a long-term reward may not be enough for general
technology adoption and use. Future personal monitoring systems must think about
how to present tangible steps to users to not only monitor their air pollution exposure
but significantly reduce it over time and thus, get personal health benefits. For exam-
ple, predicting to a runner how running at a different time of the day or taking a dif-
ferent route may result in x% less PM exposure in the next month compared with the
last. In sum, this is a hard sociotechnical problem that remains to be addressed.

5.4 Study Limitations
Our study is not without limitations. The survey used a convenience sample, which
may have impacted the results. Greater Chicago does not have pollution levels com-
parable to some of the most polluted areas globally. People residing in those areas
may have different perceptions and practices toward air pollution monitoring, not
only because of the levels of pollution but also due to sociocultural factors. Future
studies focusing on vulnerable populations may elicit additional user requirements
that we missed due to our participant demographics.

6 Conclusion

In this paper, we presented empirical data on people’s air pollution monitoring prac-
tices and preferences. Results indicate a preference for air pollution monitoring devic-
es that can be used both outside and inside home. Whether people would adopt and
heavily use personal air pollution monitoring devices will depend on how monitoring
devices offer tangible steps for them to reduce pollution exposures. At present, few
people monitor the levels of air pollution around them, and way fewer own or use an
air pollution monitoring device. But the increasing affordability of these systems, as
technology advances, may increase adoption in the future. Nevertheless, the soci-
15

 otechnical issue of short-term vs. long-term reward may hinder a wider uptake and
 use of personal air pollution monitoring technologies.

 Acknowledgements

 We thank all our participants for their time and the City Tech Collaborative, Envi-
 ronmental Law and Policy Center, and Chicago Hyde Park Village for their assistance
 in study recruitment.

 References
 1. Rajagopalan, S., Al-Kindi, S., Brook, R.: Air Pollution and Cardiovascular Disease. Journal
 of the American College of Cardiology 72(17), 2054-2070 (2018).
 2. Johannson, K., Balmes, J., Collard, H.: Air Pollution Exposure: a novel environmental risk
 factor for interstitial lung disease? Chest 147(4), 1161-1167 (2015).
 3. Tzivian, L., Dlugaj, M., Winkler, A., Weinmayr, G., Hennig, F., Fuks, K.B., Vossoughi, M.,
 Schikowski, T., Weimar, C., Erbel, R., Jöckel, K.H.: Long-Term Air Pollution and Traffic
 Noise Exposures and Mild Cognitive Impairment in Older Adults: A Cross-Sectional Analy-
 sis of the Heinz Nixdorf Recall Study. Environmental Health Perspectives 124(9), 1361-
 1368 (2016).
 4. World Health Organization (WHO) Air pollution, https://www.who.int/health-topics/air-
 pollution#tab=tab_1, last accessed 2020/06/15.
 5. Wu, X., Nethery, R.C., Sabath, B.M., Braun, D., Dominici, F.: Exposure to air pollution and
 COVID-19 mortality in the United States. medRxiv (2020).
 6. Özkaynak, H., Baxter, L., Dionisio, K., Burke, J.: Air pollution exposure prediction ap-
 proaches used in air pollution epidemiology studies. Journal of Exposure Science & Envi-
 ronmental Epidemiology 23(6), 566-572 (2013).
 7. Kloog, I., Koutrakis, P., Coull, B.A., Lee, H.J., Schwartz, J.: Assessing temporally and spa-
 tially resolved PM2.5 exposures for epidemiological studies using satellite aerosol optical
 depth measurements. Atmospheric Environment 45(35), 6267-6275 (2011).
 8. Levy Zamora, M., Xiong, F., Gentner, D., Kerkez, B., Kohrman-Glaser, J., Koehler, K.:
 Field and Laboratory Evaluations of the Low-Cost Plantower Particulate Matter Sensor. En-
 vironmental Science & Technology 53(2), 838-849 (2019).
 9. Liu, X., Jayaratne, R., Thai, P., Kuhn, T., Zing, I., Christensen, B., Lamont, R., Dunbabin,
 M., Zhu, S., Gao, J., Wainwright, D.: Low-cost sensors as an alternative for long-term air
 quality monitoring. Environmental Research 185 (2020).
10. Kelly, K.E., Whitaker, J., Petty, A., Widmer, C., Dybwad, A., Sleeth, D., Martin, R., Butter-
 field, A.: Ambient and laboratory evaluation of a low-cost particulate matter sensor. Envi-
 ronmental Pollution 221, 491-500 (2017).
11. Zusman, M., Schumacher, C.S., Gassett, A.J., Spalt, E.W., Austin, E., Larson, T.V., Carvlin,
 G., Seto, E., Kaufman, J.D., Sheppard, L.: Calibration of low-cost particulate matter sensors:
 Model development for a multi-city epidemiological study. Environment International 134
 (2020).
12. Morawska, L., Thai, P.K., Liu, X., Asumadu-Sakyi, A., Ayoko, G., Bartonova, A., Bedini,
 A., Chai, F., Christensen, B., Dunbabin, M., Gao, J.: Applications of low-cost sensing tech-
 nologies for air quality monitoring and exposure assessment: How far have they gone?. En-
 vironment International 116, 286-299 (2018).
16

13. Lin, Y., Dong, W., Chen, Y.: Calibrating Low-Cost Sensors by a Two-Phase Learning Ap-
 proach for Urban Air Quality Measurement. Proceedings of the ACM on Interactive, Mo-
 bile, Wearable and Ubiquitous Technologies 2(1), 1-18 (2018).
14. Kim, Y., Eberle, J., Hanninen, R., Un, E.C., Aberer, K.: Mobile observatory: an exploratory
 study of mobile air quality monitoring application. Proceedings of the 2013 ACM confer-
 ence on Pervasive and ubiquitous computing adjunct publication - UbiComp '13 Adjunct,
 733–736 (2013).
15. Chattopadhyay, D., Toward a Bayesian Approach for Self-Tracking Personal Pollution Ex-
 posures. Proceedings of the 2018 ACM International Joint Conference and 2018 Interna-
 tional Symposium on Pervasive and Ubiquitous Computing and Wearable Computers -
 UbiComp '18, 1166-1171 (2018).
16. Budde, M., El Masri, R., Riedel, T., Beigl, M.: Enabling low-cost particulate matter meas-
 urement for participatory sensing scenarios. Proceedings of the 12th International Confer-
 ence on Mobile and Ubiquitous Multimedia - MUM '13, 1–10. (2013).
17. Nikzad, N., Verma, N., Ziftci, C., Bales, E., Quick, N., Zappi, P., Patrick, K., Dasgupta, S.,
 Krueger, I., Rosing, T.Š., Griswold, W.G.: CitiSense: improving geospatial environmental
 assessment of air quality using a wireless personal exposure monitoring system. Proceedings
 of the conference on Wireless Health - WH '12, 1-8 (2012).
18. Maag, B., Zhou, Z., Thiele, L.: W-air: Enabling personal air pollution monitoring on weara-
 bles. Proceedings of the ACM on Interactive, Mobile, Wearable and Ubiquitous Technolo-
 gies 2, 1-25. (2018).
19. Sakhnini, N., Yu, J.E., Chattopadhyay, D.: myCityMeter: Helping older adults manage the
 environmental risk factors for cognitive impairment. Proceedings of the 2018 ACM Interna-
 tional Joint Conference and 2018 International Symposium on Pervasive and Ubiquitous
 Computing and Wearable Computers - UbiComp '18, 235–238 (2018).
20. Piedrahita, R., Xiang, Y., Masson, N., Ortega, J., Collier, A., Jiang, Y., Li, K., Dick, R.P.,
 Lv, Q., Hannigan, M., Shang, L.: The next generation of low-cost personal air quality sen-
 sors for quantitative exposure monitoring. Atmospheric Measurement Techniques 7, 3325-
 3336 (2014).
21. Kim, S., Li, M.: Awareness, Understanding, and Action: A Conceptual Framework of User
 Experiences and Expectations about Indoor Air Quality Visualizations. Proceedings of the
 2020 CHI Conference on Human Factors in Computing Systems, 1-12 (2020).
22. Al Mamun, M.A., Yuce, M.R.: Sensors and systems for wearable environmental monitoring
 toward iot-enabled applications: A review. IEEE Sensors Journal, 19(18), 7771-7788
 (2019).
23. AirBeam is a low-cost, palm-sized air quality instrument,
 https://www.habitatmap.org/airbeam/, last accessed 2020/06/15.
24. MicroPEM™ Sensor for Measuring Exposure to Air Pollution,
 https://www.rti.org/impact/micropemsensor-measuring-exposure-air-pollution, last accessed
 2020/06/15.
25. Plume Flow2, https://plumelabs.com/en/flow-2/store/, last accessed 2020/06/15.
26. Oz Robotics: Air Pollution Monitor that helps you breathe cleaner, healthier air,
 https://ozrobotics.com/shop/atmotube-portable-air-pollution-monitor/, last accessed
 2020/06/15.
27. Tian, R., Dierk, C., Myers, C., Paulos, E.: MyPart: Personal, portable, accurate, airborne
 particle counting. Proceedings of the 2016 CHI Conference on Human Factors in Compu-
 ting Systems, 1338–1348 (2016).
28. Creswell, J.W., Clark, V.L.P.: Designing and Conducting Mixed Methods Research. Sage
 publications (2017).
17

29. Hutchinson, H., Mackay, W., Westerlund, B., Bederson, B.B., Druin, A., Plaisant, C.,
 Beaudouin-Lafon, M., Conversy, S., Evans, H., Hansen, H., Roussel, N.: Technology
 probes: inspiring design for and with families. Proceedings of the conference on Human fac-
 tors in computing systems - CHI '03, 17-24 (2003).
30. Illinois PM2.5 Daily Averages - Illinois EPA Bureau of Air,
 http://www.epa.state.il.us/air/pm25/index.html, last accessed 2020/05/04.

 Appendix A: Survey Questions

 Q1. How often do you check the levels of air pollution (i.e., air quality) around you?
 Never Less than once a month Monthly Weekly Daily
 Q2. When did you last check the air quality in your immediate surrounding? (e.g.,
 measured using a device or visited a government website, such as https://airnow.gov)
 Never More than a year before More than a month before Last month
 Last week
 Q3. How do you get information about air quality? (Choose all that apply.)
 News Government website Other websites
 EPA AIRNow mobile app Other mobile apps Other I don’t
 Q4. Do you use any air quality monitoring devices?
 Yes No
 Q5. Do you own/use any of the following air quality monitoring devices? (Choose all
 that apply.)
 Dylos Airbeam Foobot Dyson Pure Cool Xiaomi Mi Air Purifier Pro
 Awair uHoo PurpleAir Healthy Home Coach by Netatmo
 AirVisual Pro Blueair Aware Other I don’t own any device.
 Q6. The air quality in your immediate surrounding is bad. Now consider the following
 statements.
 I should cover my mouth with my hand.
 Strongly disagree Somewhat disagree Neither agree nor disagree
 Somewhat agree Strongly agree
 I should cover my mouth using a scarf.
 I should cover my mouth using a dust mask.
 I should cover my mouth using a N95 respirator.
 I should stay indoors or minimize time outdoors.
 I should close the windows of my room.
 Q7. The air quality in your immediate surrounding is bad. How often do you?
 Cover your mouth with your hand.
 Strongly disagree Somewhat disagree Neither agree nor disagree
 Somewhat agree Strongly agree
 Cover your mouth using a scarf.
 Cover your mouth using a dust mask.
18

 Cover your mouth using a N95 respirator.
 Stay indoors or minimize time outdoors.
 Close the windows of your room.
Q8. Research has shown that pollution levels measured with a personal device are
little different and more personal than estimated across neighborhoods from fixed
monitoring sites. Please state how much you agree or disagree with the following
statements.
 I would like to know how much polluted air I breathe in over time (e.g., during last
 year).
 Strongly disagree Somewhat disagree Neither agree nor disagree
 Somewhat agree Strongly agree
 I would like to know how much polluted air I breathe in sometimes (e.g., during
 last evening’s commute).
 I am willing to wear a device to measure the polluted air I breathe in.
 I am willing to put a device at home to measure the polluted air my family and I
 breathe in.
 It is important that the device measuring air quality around me be portable.
Q9. You are offered a device that can measure your daily exposure to air pollution.
The device needs to be worn outside, over your topmost layer of clothing, to accurate-
ly measure the air quality around you. How likely are you to wear or carry a device
like this? Please rank in the order of your preference. (Rank 1 means highly likely,
rank 5 means least likely. Images show some examples.)
 ___on or near your bag
 ___around or near your waist
 ___around or near your neck
 ___on or near your shoes
Q10. Please state how much you agree or disagree with the following statements:
 Environmental pollution is an important global problem.
 Strongly disagree Somewhat disagree Neither agree nor disagree
 Somewhat agree Strongly agree
 High levels of air pollution can adversely affect my health and my family’s health.
 Breathing in polluted air for many years may cause cardiovascular diseases.
 Breathing in polluted air for many years may cause cognitive impairments.
Demographics
You can also read