Hydrological and hydrochemical observation status in
←
→
Page content transcription
If your browser does not render page correctly, please read the page content below

Hydrological and hydrochemical observation status in the
pan-Arctic drainage basin                                 por_126   327..338

Arvid Bring & Georgia Destouni
Department of Physical Geography & Quaternary Geology, Stockholm University, SE-106 91 Stockholm, Sweden

Keywords                                            Abstract
Discharge; hydrochemistry; hydrology;
monitoring; pan-Arctic drainage basin;              In order to identify and understand the ongoing changes in the Arctic hydro-
water chemistry.                                    logical cycle, and the impacts on the Arctic Ocean, timely and open access to
                                                    water and water-chemistry data is essential. By synthesizing and analysing
Correspondence                                      all openly accessible water-discharge and water-quality data, we present an
Arvid Bring, Department of Physical                 updated, quantitative picture of the status of observational data on hydrologi-
Geography & Quaternary Geology, Stockholm
                                                    cal and hydrochemical fluxes from the pan-Arctic drainage basin (PADB) to the
University, SE-106 91 Stockholm, Sweden.
E-mail: arvid.bring@natgeo.su.se
                                                    ocean. We identify and compare the characteristics of monitored and unmoni-
                                                    tored areas, and the differences between them, across the continents in the
doi:10.1111/j.1751-8369.2009.00126.x                PADB. Results indicate significant gaps in monitoring data for water chemistry,
                                                    in particular for high-latitude near-coastal areas. The differences in character-
                                                    istics between monitored and unmonitored areas may bias assessments of
                                                    hydrological and hydrochemical fluxes to the Arctic Ocean. The reliable iden-
                                                    tification and understanding of important biogeochemical processes in the
                                                    PADB require extended monitoring, particularly in high-latitude permafrost
                                                    ground, and more ready access to harmonized and integrated hydrochemical
                                                    data.

The Arctic hydrological cycle is an integral part of the                       users of the monitoring data. For instance, the freshwater
climate system, both in the Arctic region itself through                       fluxes from land to sea would be optimally monitored by
its integration of terrestrial, atmospheric and human                          prioritizing the most downstream stations of the main
systems with the Arctic Ocean (Vörösmarty et al. 2001),                        rivers. However, with regard to the waterborne nutrient
and globally through its connections to worldwide ocean                        and pollutant mass fluxes from land to sea, the small,
circulation and climate feedback mechanisms (Houghton                          unmonitored and often heavily populated near-coastal
et al. 2001). Recently observed rapid and significant                          catchment areas, along the extended coastline stretches
changes to the Arctic water cycle, including the shorter                       between the main rivers, may yield as large or larger mass
extent of the snow-cover season (Serreze et al. 2000),                         fluxes as are observed for the major monitored rivers
increasing river run-off (Peterson et al. 2002) and                            (Destouni et al. 2008). The process-based understanding
increasing precipitation (Houghton et al. 2001), may                           of hydrological changes within catchments, on the other
indicate that the region is in transition to a state not                       hand, requires monitoring across a range of different
previously observed in recent history (Hinzman et al.                          inland catchments of varying characteristics (Sidle 2006;
2005).                                                                         Soulsby et al. 2006).
   In order to identify and monitor the freshwater fluxes                         In all cases, water-monitoring data are necessary both
from land to the Arctic Ocean, and to understand the                           for establishing a baseline of past states and trends, in
ongoing changes in the Arctic hydrologic cycle in general,                     relation to which comparisons can be made, and for
access to reliable environmental data is of paramount                          calibrating models and observing the current changes to
importance. Most long-term river monitoring data are                           hydrological systems. Unfortunately, factors such as its
collected by government agencies, which, with limited                          harsh climate, long distances and low population density
budgets, must address a range of partially conflicting                         limit the availability of water-monitoring data for the
information goals. Therefore, the spatial distribution and                     Arctic. Recent discussions of the global status of hydro-
extent of stations in the monitoring networks are not                          logical monitoring programmes (Brown 2002; Fekete &
likely to be optimized for the specific needs of the end                       Vörösmarty 2002; Maurer 2003; GCOS 2005; Hannerz

Polar Research 28 2009 327–338 © 2009 The Authors                                                                                    327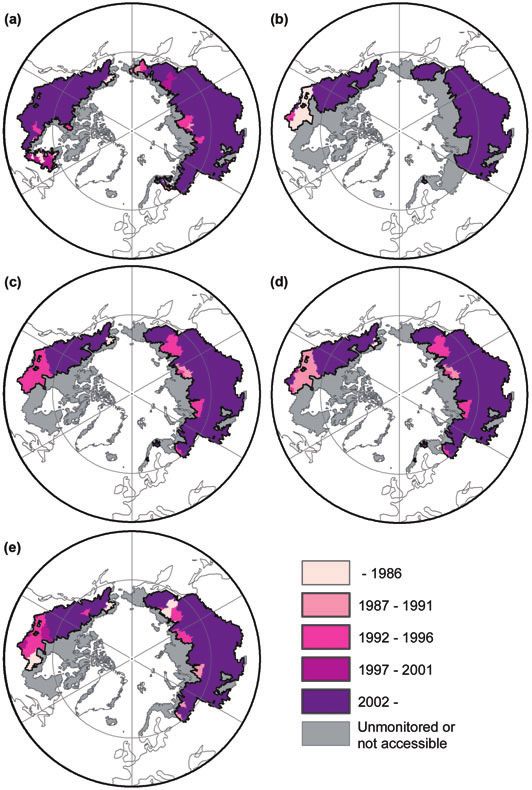
Hydrological and hydrochemical observation status                                                             A. Bring & G. Destouni

2008) have indicated severe problems of data availability       mass fluxes, from the pan-Arctic drainage basin (PADB)
and accessibility. Stations are being closed, and data          to the Arctic Ocean. Furthermore, the study aims to
are delayed, incomplete or not disseminated. Where              characterize the monitored and the unmonitored coastal
monitoring the status in Arctic regions in particular is        catchment areas within the PADB, and their potential
mentioned (e.g., Lammers et al. 2001; Shiklomanov et al.        systematic differences with regard to various properties
2002; Hinzman et al. 2005; Walsh et al. 2005), the situa-       that are relevant for the hydrological and hydrochemical
tion is also described as worrying. In particular, there is     fluxes from land to sea. This information could indi-
a lack of monitoring of water chemistry (Holmes et al.          cate whether the monitoring data presently available
2002; Prowse et al. 2005), and data quality is also an issue    adequately capture the prevailing variation in hydrologi-
in some cases (Holmes et al. 2000; Zhulidov et al. 2000;        cal and hydrochemical parameters in the drainage to the
Holmes et al. 2001). Furthermore, the state of monitoring       Arctic Ocean. Our analysis constitutes a first-order assess-
in the Arctic is deteriorating, and data-gathering systems      ment and analysis of areas where the lack of monitoring
continue to decline across the region (GCOS 2005).              may be most critical. Further studies are needed to
   Nevertheless, significant efforts have been made to har-     address more specific monitoring issues, such as the
monize and increase the accessibility to discharge data.        optimal placement of new stations for different scientific
There are currently at least four international discharge       goals, environmental and resource management targets
databases with data for the pan-Arctic region: the Arctic       or adaptation to change.
Runoff Database (ARDB), administered through the
Global Runoff Data Centre in Koblenz, Germany;
                                                                Material and methods
the Regional, Hydrometeorological Data Network for the
Pan-Arctic Region (R-ArcticNET); the Arctic Rapid Inte-         Openly accessible monitoring data for freshwater dis-
grated Monitoring System (ArcticRIMS); and the Global           charge were gathered from four established inter-
River Discharge Database (RivDis), which is an older            national discharge databases: the ARDB (GRDC 2006),
global discharge database. These international databases        R-ArcticNET (Lammers et al. 2001), ArcticRIMS (Arcti-
are well known to the scientific community, and have            cRIMS 2007) and RivDis (Vörösmarty et al. 1998). To
been used extensively for water balance modelling and           synthesize water-chemistry data, the meta-databases of
studies of freshwater input to the Arctic Ocean (e.g.,          the US National Snow and Ice Data Centre (NSIDC 2006),
Peterson et al. 2002; Berezovskaya et al. 2004; Peterson        the Arctic Climate System Study Data and Information
et al. 2006). However, in order to quantify mass fluxes of,     Service (ADIS 2006), the Global Observing Systems
for example, carbon and nutrients, water chemistry              Information Centre (GOSIC 2006) and the Global Runoff
monitoring in concert with water discharge monitoring is        Data Centre (GRDC 2006) were systematically examined,
crucial. Unfortunately, such data for the Arctic region are     and databases with accessible water-chemistry data were
even less available than run-off data (Holmes et al. 2002).     identified. From these databases, all accessible water-
There have been many process-level studies of individual        chemistry data for stations within the PADB were
sites or smaller basins (Vörösmarty et al. 2001), but           subsequently gathered.
studies are lacking that support the development of a              For all monitoring programmes, the extracted data sets
comprehensive strategy for a continuous monitoring of           were processed to summarize records of series length,
biogeochemical mass fluxes in the Pan-Arctic drainage.          first operational year and latest available data year for
   In light of the ongoing decline of available and acces-      each monitoring station. The accessible water chemistry
sible monitoring data, it is important to analyse the effects   parameters were grouped into the following categories:
of this decline on the reliability of downstream analyses       carbon, sediment, nitrogen and phosphorus. Stations
based on such data. It is important to investigate whether      missing location information were removed, as were sta-
there are any systematic differences between the charac-        tions without data and stations outside the PADB. The file
teristics of the monitored and the unmonitored areas            formats of data varied widely, and required significant
draining into the Arctic Ocean. Such differences may bias       programming and database operations in order to extract
the assessments of chemical mass fluxes to the ocean,           the desired information. The most common formats of
in addition to just not resolving them sufficiently, and        data were either text files with various structures, or
thereby significantly affect the accuracy—and not just          Microsoft Excel spreadsheets. One monitoring pro-
the precision—of hydrologic modelling across basins with        gramme, the United Nations Global Environment
different properties.                                           Monitoring System Water Program (GEMS/Water), did
   The present study aims to establish a comprehensive          not provide raw data, and the information from this
quantitative picture of the current status of accessible        monitoring programme was summarized manually from
monitoring data for water discharge, and waterborne             inspecting a multitude of graphs on the programme’s

328                                                                                  Polar Research 28 2009 327–338 © 2009 The Authors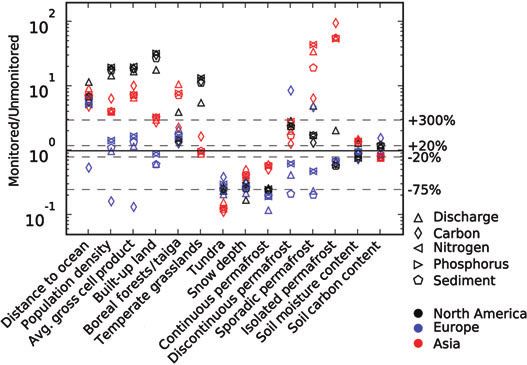
A. Bring & G. Destouni                                                         Hydrological and hydrochemical observation status

website (GEMStat 2007). To clearly identify which years         following manner. For each station, the maximum acces-
had accessible data, graphs displaying aggregated values        sible length of time series was determined. For all stations
in yearly box plots were used.                                  sharing the same value of their time series length, the
   Monitored and unmonitored catchment areas were               combined monitored drainage area of that set of stations
identified by co-referencing monitoring stations to the         was identified. All raster cells within this combined moni-
30′ ¥ 30′ STN-30p drainage network (Simulated Topo-             tored drainage area were given the associated, same value
logical Network; Vörösmarty et al. 2000). For stations          of time series length. The raster maps from repeated steps
with listed drainage areas smaller than five cells, the         of this procedure were further combined, keeping the
watersheds were considered too small for delineation            maximum value of data series length for each cell. This
using the drainage network. Cells containing such sta-          resulted in a final map in which each cell has a value of
tions were instead classified as partly monitored if they       the longest data series available for that cell. An analo-
fell outside the area otherwise identified as monitored         gous procedure was applied to generate a map with the
by stations with larger drainages. This translates to mini-     latest data year available for all cells.
mum watershed areas for drainage delineation ranging               Since the investigated databases were not mutually
from 4000 km2 at a latitude of 75°N to 10 000 km2 at a          exclusive, many stations occur in more than one data-
latitude of 50°N. Stations without drainage area informa-       base, sometimes with different coordinates even for
tion available from the data source were also removed if        obvious cases of identical stations. No attempt was made
their drainage was smaller than five cells in the topologi-     at correcting these coordinate errors, as no data were
cal network.                                                    available that would improve the precision of the station
   The co-referencing of stations with the 30′ drainage         coordinates. However, the impact is most likely to be
network was performed through comparison of station             limited, as the main use of station data was to quantify
locations with the 30′ network, and also with a river           monitored areas. A station occurring in more than one
network of higher spatial resolution from the Hydro1k           database with the same length of data and end year
database (US Geological Survey 1998), to aid the inter-         would not affect results, as the monitored areas overlap.
pretation of the station co-referencing with the 30′               In order to identify potential biases in the monitoring
network. The listed drainage area for each station was          coverage representation of hydrologic properties, the
compared with the simulated drainage area of the 30′            area-weighted distribution of distance to ocean, popula-
network. All stations with a difference of more than 10%        tion, economic production, built-up land, vegetation
between listed and simulated drainage areas were manu-          zones, snow depth, ground ice, permafrost, soil organic
ally inspected. The stations were relocated to nearby           carbon and soil moisture were summarized and aver-
cells with better agreement between simulated and listed        aged across unmonitored and monitored areas in North
areas, where this was possible, and were otherwise              America, Europe and Asia. Differences in characteristics
deleted. Stations for which visual inspection revealed a        were also summarized by calculating the quotients
poor degree of representation in the 30′ network were           between average values for unmonitored and monitored
removed.                                                        areas.
   It would be desirable to develop the assessment of the          The distance to ocean was based on data from STN-30p
characteristics of basins to a finer scale than 30′. However,   (Vörösmarty et al. 2000), which in turn are based on the
even though the coordinates of many stations are given          physical transport path of water through the simulated
to the precision of 0.01° (equal to 36″ or 0.6′), which is      stream network. For calculation of population and
sufficient for continent- and regional-scale analysis, a        population density, the Gridded Population of the World
quick visual inspection of these locations together with        database (CIESIN 2007), produced by Columbia Universi-
the Hydro1k 30″ drainage network showed that many               ty’s Earth Institute, was used. The economic production
position errors are much larger. This indicates that the        data were based on the Geographically Based Economic
station coordinates cannot be taken to be accurate to the       Data (G-Econ) database (Nordhaus 2006), which has a
last digit. A substantial effort at improving the accuracy of   resolution of 1 ¥ 1°. For each 0.5 ¥ 0.5° grid cell, one
station coordinates, in particular for stations in Russia,      quarter of the gross cell product of the overlapping G-Econ
would be necessary for run-off and water chemistry mod-         cell was assigned to it. The gross cell product in the G-Econ
elling at finer resolutions.                                    data is expressed in terms of 1995 US dollars at purchasing
   In order to present a pan-Arctic overview of the extent      power parity (PPP) exchange rates. As prices of similar
of accessible data, maps that show the maximum length           goods vary between countries, PPP rates allow a direct
of data series and the last data year accessible, for all       comparison of the value of production in different econo-
parameters, were produced. To produce these maps, the           mies, in contrast to market exchange rates. Estimates of
final delineation of watersheds was carried out in the          the economic production in some remote areas may be

Polar Research 28 2009 327–338 © 2009 The Authors                                                                           329
Hydrological and hydrochemical observation status                                                           A. Bring & G. Destouni

significantly lower than actual values, as both the eco-       and Suspended Sediments (PARTNERS) project (PART-
nomic value and the extent of Arctic hydrocarbon               NERS 2008; McClelland et al. 2008), GEMS/Water
exploration in remote areas has intensified significantly in   (GEMStat 2007), Eurasian River Historical Nutrient and
the past decade (Walker et al. 2006). The G-Econ meth-         Sediment Flux Data (Holmes & Peterson 2002), HYDAT
odology, which is based on regional production per capita      (Environment Canada 2004), European Waterbase
distributed according to population patterns, may not have     (European Environment Agency 2006) and the US Geo-
incorporated the vast economic values added by the Sibe-       logical Survey National Water Information System (US
rian gas fields, but we estimate that it may still provide a   Geological Survey 2007). Apart from the international
sufficient basis for estimating the spatial distribution of    efforts of PARTNERS and GEMS/Water, water-chemistry
economic production.                                           data reside only in national and regional databases, with
   The built-up land data were compiled by Miteva (2001),      significant variation in data format and availability.
based on DMSP/OLS night-time lights imagery and
the International Geosphere–Biosphere Programme land
                                                               Results
cover classification. The vegetation-zone data were
based on the World Wildlife Fund’s Terrestrial Ecoregions      Table 1 lists the parameters used from each water-
GIS Database (Olson et al. 2001), which categorizes global     chemistry monitoring programme, for each of the main
land areas into 16 categories, of which nine are repre-        investigation parameters. When several parameters for a
sented in the PADB. Average annual snow-depth data,            monitoring programme were deemed relevant, more
based on climatologies for the period 1950–1999 (Will-         than one was included. Table 2 presents an overview
mott & Matsuura 2001), were downloaded from the Atlas          of the accessibility to, and the characteristics of, the
of the Biosphere project (SAGE 2007) at the University of      water-quality parameters of all five databases. The basin
Wisconsin. The data are on a natural logarithmic scale,        characteristics differ quite markedly between monitoring
representing the average annual snow depth in mm.              programmes, and between different continents. In
   Ground ice and permafrost information was taken from        R-ArcticNET, the typical basin is most likely to be a few
a United Nations Environment Program GRID-Arendal              thousand square kilometres in size, and has a discharge
digitized version of a circum-Arctic map of permafrost         record of around 20 years. A typical nitrogen-monitored
and ground ice (Brown et al. 1998), which in turn is           basin in GEMS/Water or the Eurasian River Historical
based on a paper map prepared by Brown et al. (1997) for       Nutrient and Sediment Flux Data Set databases (if such a
the International Permafrost Association. Ground ice is        basin can be said to exist, based on the small number of
categorized into high, medium or low for lowland topo-         stations), on the other hand, is probably at least a few
graphy, and high/medium or low for highland and moun-          hundred thousand square kilometres in size, with a
tainous topography. High ground ice content is defined as      record of around 14 years. Furthermore, the aggregation
more than 20% visible ice (by volume) in the upper             period varies significantly between databases. Some data-
10–20 cm of the ground, medium is defined as 10–20%            bases provide data from individual samples, but most
and low is defined as less than 10%. The permafrost            provide averaged or representative values for a certain
extent is categorized according to the percentage of area      period, ranging in length from daily to annual.
underlain by permafrost, with continuous permafrost               Figure 1 shows an overview of the spatial and temporal
corresponding to 90–100% cover, discontinuous to               extent of the monitoring of water, carbon, nitrogen,
50–90% cover, sporadic to 10–50% cover and isolated            phosphorous and sediment fluxes. Accessible water-
patches to 0–10% cover.                                        discharge data are significantly more extensive than
   The soil organic-content data were downloaded from          water-chemistry data, particularly in temporal extent,
the Atlas of the Biosphere (SAGE 2007), where the data         but also spatially. However, even the water-discharge
are based in turn on the SoilData programme of the             monitoring covers no more than 73% of the ice-free area
International Geosphere–Biosphere Programme Data and           draining to the Arctic Ocean, with the majority of the
Information Services (Global Soil Data Task Group 2000).       unmonitored areas occurring in the Arctic Archipelago,
The soil-moisture data, based on climatologies for the         and in the northern regions of Asia. Nitrogen and phos-
period 1950–1999 (Willmott & Matsuura 2001), and a             phorus monitoring cover 62% of the non-glaciated Arctic
soil water holding capacity of 150 mm, were downloaded         Ocean drainage basin area, sediment monitoring covers
from the Atlas of the Biosphere project (SAGE 2007) at         63% and carbon monitoring covers 51%. The average
the University of Wisconsin.                                   length of time series for water-chemistry data is much
   We identified six databases with accessible water-          shorter than that for water discharge for all continents
chemistry monitoring data for the PADB. These are the          (Fig. 1). The accessibility of recent water-chemistry data,
Pan-Arctic River Transport of Nutrients, Organic Matter,       on the other hand, is better, and is almost on a par

330                                                                                Polar Research 28 2009 327–338 © 2009 The Authors
A. Bring & G. Destouni Hydrological and hydrochemical observation status
Table 1 Water chemistry parameters for different monitoring programmes.
Monitoring programme Carbon Nitrogen Phosphorus Sediment
GEMS 䊏 Carbon—total organic 䊏 Nitrogen, nitrate + 䊏 Phosphorus—dissolved 䊏 Fixed suspended solids
(mg l-1 C) nitrite (mg l-1 N) (mg l-1 P) (mg l-1)
䊏 Nitrate (mg l-1 N) 䊏 Phosphorus—total 䊏 Suspended solids 105°C
dissolved (mg l-1 P) (mg l-1)
䊏 Phosphorus—total
(mg l-1 P)
Eurasian Rivers N/A 䊏 Monthly NH4-N 䊏 Monthly PO4-P 䊏 Monthly sediment load
data set concentrations (mg l-1) concentrations (mg l-1) (kg s-1)
䊏 Monthly NO3-N
concentrations(mg l-1)
HYDAT N/A N/A N/A 䊏 Mean suspended sediment
concentration (mg l-1)
National Water 䊏 Organic carbon, water, 䊏 Nitrate, water, filtered 䊏 Phosphorus, water, filtered 䊏 Suspended sediment
Information unfiltered (mg l-1) (mg l-1 as nitrogen) (mg l-1) concentration (mg l-1)
system (USGS) 䊏 Organic carbon, water, 䊏 Nitrate, water, filtered 䊏 Orthophosphate, water,
filtered (mg l-1) (mg l-1) filtered, (mg l-1 as
䊏 Inorganic carbon, phosphorus)
suspended sediment,
total (mg l-1)
䊏 Organic carbon,
suspended sediment,
total (mg l-1)
䊏 Carbon (inorganic plus
organic), suspended
sediment, total (mg l-1)
Waterbase–Rivers 䊏 Total organic carbon 䊏 Total nitrogen (mg l-1 N) 䊏 Total phosphorus N/A
data set, version (mg l-1) (mg l-1 P)
6 (EEA)
with the accessibility of water-discharge data, except for generally fall between North America and Europe in the
south–central Canada and northern Asia (Fig. 2). The balance of anthropogenic pressures.
best-monitored continent on average is Europe, except With respect to vegetation zones, boreal forests and
for sediment, where Asian areas have both longer taiga are over-represented in monitored areas, and
records and more recent data, and the accessibility to under-represented in unmonitored areas, particularly in
current water-discharge data, where Asia also has more Asia. Temperate grasslands are much more prevalent in
recent data. monitored than in unmonitored areas in North America,
Figure 3 summarizes the differences in area-weighted whereas their occurrence is balanced in Asian moni-
characteristics between unmonitored and monitored toring. Areas of tundra and continuous permafrost are
areas for the continents in the pan-Arctic drainage, and strongly under-represented in the monitored areas, and
for different monitoring parameters, expressed as quo- the average annual snow depth is much lower in the
tients between the area-weighted average values of the monitored than in the unmonitored areas on all conti-
studied basin properties. For characteristics related to nents. Soil carbon and moisture are the most well-
anthropogenic impacts (population density, average gross balanced characteristics, even though the quotient
cell product and built-up land), North America system- between monitored and unmonitored areas for these
atically exhibits the highest quotients between monitored parameters can still amount to more than ⫾20%.
and unmonitored areas. Monitored areas in North
America are therefore the most biased towards including
Discussion
more population- and production-rich catchments than
prevail on average in the PADB part of the continent. In The synthesis of accessible discharge and water-chemistry
contrast, accessible European carbon monitoring is biased data shows a wide range in aggregation time, average
towards including catchments that are sparsley populated time series length and basin size between monitoring
and close to the ocean. The Asian monitoring quotients programmes (Table 2). This may reflect variations in the
Polar Research 28 2009 327–338 © 2009 The Authors 331332
Table 2 Summary of accessible data for discharge and water-chemistry monitoring databases. The areas for PARTNERS basins were calculated from co-referencing sampling locations to the STN-30p flow
network (Vörösmarty et al. 2000). The areas for GEMS were calculated from the ARDB database for corresponding discharge stations. The areas for the Eurasian Rivers Data Set were calculated from the
R-ArcticNET database for corresponding discharge stations. The areas for the remaining databases were calculated from information in the corresponding databases.
Monitoring No. of Latest Mean series Median series Mean basin Median basin
Database parameter Aggregation period stations First data yr data yr length (yrs) length (yrs) size (km2) size (km2)
ARDB Discharge Monthly, daily 2401 1877 2004 36 33 39 782 3 050
R-ArcticNET Discharge Monthly 5093 1877 2001a 24 20 23 975 1 200
ArcticRIMS Discharge Monthly, daily 276 1877 2008 50 55 168 529 44 700
Hydrological and hydrochemical observation status
RivDis (Arctic part) Discharge Monthly 107 1881 1986 25 19 201 688 57 500
PARTNERS Carbon Individual samples 6b 2003 2006 4 4 1 745 000 1 960 000
Nitrogen 2003 2006 4 4
Phosphorus 2003 2006 4 4
Sediment 2003 2006 4 4
GEMS Carbon Annual, monthly 2 1979 1981 2 2 946 000 946 000
Nitrogen 31 1979 2002 14 14 1 001 000 606 000
Phosphorus 32 1979 2003 11 10 980 000 525 000
Sediment 30 1978 2003 16 15 999 000 525 000
Eurasian Rivers data set Nitrogen Monthly 16 1969 1995 14 14 677 800 224 000
Phosphorus 16 1976 1995 14 14 677 800 224 000
Sediment 18 1938 2000 23 20 596 400 220 000
HYDAT Sediment Monthly, daily 380 1948 1997 7 5 32 758 1 780
National Water Information Carbon Daily, individual samples 119 1969 2005 3 2 4 415 934
System (USGS) Nitrogen 237 1939 2005 6 4 9 602 490
Phosphorus 265 1965 2005 5 2 7 770 517
Sediment 213 1953 2005 5 3 10 965 490
Waterbase–Rivers data set, Carbon Annual 12 1976 2004 21 26 4 073 2 188
version 6 (EEA) Nitrogen 38 1976 2004 14 9 3 761 2 125
Phosphorus 38 1976 2004 14 9 3 761 2 125
a
After a recent update, 206 stations now include data up until 2002 or 2003.
bSampling is carried out from ships at specific locations on six rivers.
A. Bring & G. Destouni
Polar Research 28 2009 327–338 © 2009 The AuthorsA. Bring & G. Destouni Hydrological and hydrochemical observation status Fig. 1 Overview of the maximum length of accessible data series (years) for the pan- Arctic monitoring of (a) water discharge, (b) carbon, (c) nitrogen, (d) phosphorus and (e) sediment. Cells containing stations with drain- age areas smaller than five cells are indicated as partly monitored. motives for both the design of the various station net- logic behaviour (e.g., Lyon et al. 2009), requires a finer works and the subsequent choices of the stations from temporal resolution. In some cases there may be data which data is made accessible. with higher temporal resolution available, but not made Unfortunately, the variation in these factors implies accessible, and efforts at making such data accessible that although the combined monitoring area of all data- would clearly contribute to the possibility of combining bases for a certain monitoring parameter is relatively data sets. large, the data themselves may be difficult to combine. Furthermore, for the majority of the PADB, water- For example, a lowest common denominator of yearly chemistry monitoring data are only accessible for very data suffices to detect some long-term trends, but the large basins, spanning climate zones and with heteroge- study of processes on seasonal or shorter time scales, or neous properties. This is particularly true for the Asian the use of statistical techniques to identify shifts in hydro- territory, where there is no accessibility to the smaller Polar Research 28 2009 327–338 © 2009 The Authors 333
Hydrological and hydrochemical observation status                                                           A. Bring & G. Destouni

                                                                                    Fig. 2 Overview of the latest accessible data
                                                                                    year for the pan-Arctic monitoring of (a) water
                                                                                    discharge, (b) carbon, (c) nitrogen, (d) phos-
                                                                                    phorus and (e) sediment.

catchments that dominate European and North American           water-chemistry data, where measurement and analysis
water-chemistry monitoring at the regional and national        methods differ more widely than for discharge data. Glo-
levels. These differences indicate the difficulty in under-    bally, the United Nations GEMS/Water programme is a
standing biogeochemical responses at relatively small          hydrochemical counterpart to the Global Runoff Data
scales across the PADB. Further studies are required to        Centre, and aims to integrate and disseminate water-
specifically outline areas where an increased accessibility    chemistry data. However, the GEMS/Water database
to data or the establishment of new stations is particularly   does not currently function fully as a water-chemistry
important.                                                     repository for the PADB. The GEMS/Water river station
   To realize the potential of combining monitoring data       network in the PADB includes only 20 stations, several of
for the PADB, integration and the harmonization of data        which are clustered closely together in smaller areas.
are important. This is a particularly challenging task for     Furthermore, online data access is only possible though

334                                                                                Polar Research 28 2009 327–338 © 2009 The Authors
A. Bring & G. Destouni Hydrological and hydrochemical observation status Fig. 3 Quotients of area-weighted average characteristic values of water discharge, carbon, nitrogen, phosphorus and sediment between unmonitored and monitored areas, for different continents in the pan-Arctic drainage basin. Quotients are not applicable for built-up land, temperate grasslands and continuous permafrost in European carbon monitoring, as the average value is zero for these parameters in monitored areas. summary graphs, and the accessibility to recent data is Secondly, the land-to-sea export of important water- relatively low. Developing a coherent and harmonized chemistry constituents from near-coastal areas and database of pan-Arctic water-chemistry data could smaller river basins may in some areas be significant in improve the accessibility to data, and facilitate their use relation to the fluxes in major monitored rivers (Destouni across a wider range of applications. Although it does not et al. 2008). Our knowledge of the nutrient dynamics for aim to integrate external data, the PARTNERS project boreal and Arctic rivers is limited (Humborg et al. 2003), provides access to pan-Arctic harmonized data, and is an and, to improve the quantification of subsurface path- important step in this direction. ways and land–sea interactions in polar regions, there is a Our analysis of the combined spatial and temporal motivation for an increased effort in monitoring these extent of monitored areas shows that the majority of northern areas. unmonitored areas are in the coastal high-latitude Thirdly, the significant disparity and heterogeneity in regions of the PADB (Figs. 1, 2). Although it is not hydrological properties between monitored and unmoni- surprising (nor perhaps undesirable) that stations are tored areas (Fig. 3) limit the reliability of the important concentrated at lower latitudes, which coincides with the modelling efforts that must be used to fill in gaps in distribution of population, and also with most man-made the data. The hydrological properties of the northern water infrastructure (Lammers et al. 2001), the lack of unmonitored areas stand out as particularly dissimilar monitoring around the coastal areas of the Arctic is prob- with regard to permafrost extent, vegetation type and lematic for at least three reasons. climatic conditions, and may thus suffer from bias in the Firstly, as a result of a warming climate, and the asso- land-to-sea flux estimates based on accessible monitoring ciated increased accessibility to natural resources and the data. Also, the considerable differences between Europe, Northern sea routes (Kerr 2002), the economic activity in North America and Asia in representative coverage of high-latitude areas is expected to increase significantly in some monitoring parameters may confound interconti- the future (Nellemann et al. 2001). Much of this increase nent comparisons based on accessible monitoring data. will probably take place in coastal areas (Andreeva 1998). Extending monitoring to remote areas of the Arctic is The hydrologic impacts of anthropogenic activities, such costly. Our analysis indicates, however, that large areas of as hydrocarbon exploration, mining operations and for- the PADB are discharge-monitored, but lack monitoring estry, might be significant in some areas, such as the of any of the water-chemistry parameters studied. In observed doubling of sediment yield in the Kolyma River, these cases, and particularly for large rivers, it may be which may be connected to gold mining (Gordeev 2006). rational and economically feasible to extend water- With the coastal areas largely unmonitored, the impacts chemistry monitoring to coincide with the most on water chemistry, solute fluxes and run-off regimes downstream gauging station. In some cases, data from these activities will remain largely unknown. may also be available, just not accessible. Although Polar Research 28 2009 327–338 © 2009 The Authors 335
Hydrological and hydrochemical observation status                                                           A. Bring & G. Destouni

considerable areas would still be unmonitored, this          direction, as it provides harmonized data for large parts of
would nevertheless improve the possibility of closing        the pan-Arctic, but it does not aim to integrate accessible
mass budgets for a larger share of the PADB. Another         data from other sources and from smaller basins. Clearly,
possibility to improve monitoring may be to extend the       such an effort would still fall short of providing the
ship-based sampling within the PARTNERS programme,           same information level as the water-discharge monitor-
which was originally initiated to address some of the        ing, because the water chemistry records extend much
problems in Arctic water-chemistry monitoring. More          shorter into the past than the water-discharge records.
specific investigations of potential station or sampling     However, even with the coarser resolution and shorter
locations, in combination with cost–benefit analyses, are    time series of water chemistry, such a database would
required to address the viability of such efforts.           still be a valuable asset to environmental modellers and
                                                             policymakers, facilitating the rapid dissemination of
                                                             information on the changing Arctic environment, and
Conclusions
                                                             allowing for better informed decisions to manage these
The fragmentation of water-chemistry monitoring data         changes.
implies that environmental modellers, as well as policy-
makers and the public, have a restricted ability to
                                                             Acknowledgements
integrate accessible data and accurately assess bio-
geochemical changes in the Arctic environment.               We thank Fredrik Hannerz for many helpful suggestions
Although the monitoring of land-to-sea fluxes of hydro-      and inputs to the data search. We also thank the
chemical constituents has recently improved through          reviewers for comments that have improved the manu-
the PARTNERS project, relatively large and potentially       script. The work has been supported by the Swedish
significant high-latitude coastal areas remain unmoni-       Research Council and the Swedish Research Council for
tored, for which budgets of carbon, sediment and             Environment, Agricultural Sciences and Spatial Plan-
nutrients cannot be closed. The shorter time series,         ning (Formas), and has been carried out as part of the
restricted accessibility to recent data and incomplete       Bert Bolin Centre for Climate Research at Stockholm
spatial coverage of water-chemistry measurements,            University.
relative to water-discharge measurements, still hampers
the possible uses of the water-discharge data.
                                                             References
   Furthermore, the significant disparity and heterogene-
ity between characteristic properties of monitored and       ADIS 2006. Arctic Climate System Study Data and
unmonitored areas limit the possibility to generalize          Information Service. Accessed on the internet at
hydrological and hydrochemical impact assessments based        http://acsys.npolar.no/adis/adis.php on 12 December
on monitoring data. Systematic differences in the relative     2006.
characteristics of monitored and unmonitored areas           Andreeva E.N. 1998. The Russian Arctic coastal zone
between continents may also imply that the continent-to-       management problems: past lessons and new realities.
                                                               Ocean & Coastal Management 41, 237–256.
continent differences found in such monitoring-based
                                                             ArcticRIMS 2007. ArcticRIMS. Accessed on the internet at
assessments may depend more on monitoring bias than on
                                                               http://rims.unh.edu on 11 January 2007.
real differences between continents.                         Berezovskaya S., Yang D. & Kane D.L. 2004. Compatibility
   The reliable identification and understanding of land-      analysis of precipitation and runoff trends over the large
to-sea fluxes from the entire PADB, including high-            Siberian watersheds. Geophysical Research Letters 31, article
latitude tundra and permafrost soils, requires extended        no. L21502, doi 10.1029/2004GL021277.
monitoring in northern near-ocean areas, and harmo-          Brown J., Ferrians O. Jr., Heginbottom J. & Melnikov E.
nized and more ready access to data. Monitoring would          1997. Circum-Arctic map of permafrost and ground-ice
need to be extended to better cover the anthropogenic          conditions. USGS Circum-Pacific Map Series CP-45. Reston, VA:
pressures in the European and Western Siberian part of         US Geological Survey.
the pan-Arctic. In North America and Asia, monitoring        Brown J., Ferrians O.J. Jr., Heginbottom J.A. & Melnikov
                                                               E.S. 1998 (revised February 2001). Circum-Arctic map of
should be extended to better represent the permafrost
                                                               permafrost and ground-ice conditions. Boulder, CO: National
and vegetation types present on the northern rims of
                                                               Snow and Ice Data Center/World Data Center for
these continents.                                              Glaciology. Digital media.
   Ideally, an international repository for Arctic water-    Brown K. 2002. Water scarcity: forecasting the future with
chemistry monitoring data would need to be established,        spotty data. Science 297, 926–927.
with assured up-to-date, harmonized and good-quality         CIESIN (Center for International Earth Science Information
data. The PARTNERS data is an important step in this           Network) 2007. Gridded Population of the World,

336                                                                                Polar Research 28 2009 327–338 © 2009 The Authors
A. Bring & G. Destouni Hydrological and hydrochemical observation status version 3 (GPW v3). Accessed on the internet at http:// Holmes R.M., McClelland J.W., Peterson B.J., Shiklomanov sedac.ciesin.columbia.edu/gpw/ on 19 March 2007. I.A., Shiklomanov A.I., Zhulidov A.V., Gordeev V.V. & Destouni G., Hannerz F., Prieto C., Jarsjö J. & Shibuo Y. Bobrovitskaya N.N. 2002. A circumpolar perspective on 2008. Small unmonitored near-coastal catchment areas fluvial sediment flux to the Arctic Ocean. Global yielding large mass loading to the sea. Global Biogeochemical Biogeochemical Cycles 16, article no. 1098, doi 10.1029/ Cycles 22, article no. GB4003, doi 10.1029/2008GB003287. 2001GB001849. Environment Canada 2004. HYDAT version 2004-20.04. Holmes R.M. & Peterson B.J. 2002. Eurasian river historical Ottawa: Water Survey of Canada. Accessed on the internet nutrient and sediment flux data. Boulder, CO: National at http://www.wsc.ec.gc.ca/products/hydat/main_e. Snow and Ice Data Center. Digital media. Accessed on the cfm?cname=hydat_e.cfm on 14 March 2007. internet at http://nsidc.org/data/arcss092.html on 14 European Environment Agency 2006. Waterbase—Rivers February 2007. dataset, version 6. Accessed on the internet at http:// Holmes R.M., Peterson B.J., Gordeev V.V., Zhulidov A.V., dataservice.eea.europa.eu/dataservice/metadetails. Meybeck M., Lammers R.B. & Vörösmarty C.J. 2000. Flux asp?id=835 on 4 February 2007. of nutrients from Russian rivers to the Arctic Ocean: can Fekete B.M. & Vörösmarty C.J. 2002. The current status of we establish a baseline against which to judge future global river discharge monitoring and potential new changes? Water Resources Research 36, 2309–2320. technologies complementing traditional discharge Holmes R.M., Peterson B.J., Zhulidov A.V., Gordeev V.V., measurements. In D. Schertzer et al. (eds.): Predictions in Makkaveev P.N., Stunzhas P.A., Kosmenko L.S., Köhler Ungauged Basins: PUB kick-off (Proceedings of the PUB kick-off G.H. & Shiklomanov A.I. 2001. Nutrient chemistry of the meeting held in Brasilia, 20–22 November 2002). IAHS Ob’ and Yenisey Rivers, Siberia: results from June 2000 Publication 349. Paris: International Association of expedition and evaluation of long-term data sets. Marine Hydrological Sciences. Chemistry 75, 219–227. GCOS (Global Climate Observing System) 2005. Analysis of Houghton J.T., Ding Y., Griggs D.J., Noguer M., van der data exchange problems in global atmospheric and hydrological Linden P.J., Dai X., Maskell K. & Johnson C.A. (eds.) networks. GCOS Report 96. Geneva: World Meteorological 2001. Climate change 2001: the scientific basis. Contribution Organization. of Working Group I to the third assessment report of the GEMStat 2007. GEMStat: Global Water Quality Database. Intergovernmental Panel on Climate Change. Cambridge: Accessed on the internet at http://www.gemstat.org on Cambridge University Press. 10 February 2007. Humborg C., Danielsson Å., Sjöberg B. & Green M. 2003. Global Soil Data Task Group 2000. Global gridded Nutrient land–sea fluxes in oligotrophic and pristine surfaces of selected soil characteristics (International estuaries of the Gulf of Bothnia, Baltic Sea. Estuarine, Geosphere–Biosphere Programme Data and Information Coastal and Shelf Science 56, 781–793. System). Data set. Accessed on the internet at http:// Kerr R.A. 2002. A warmer Arctic means change for all. www.daac.ornl.gov on 24 April 2007. Science 297, 1490–1492. Gordeev V.V. 2006. Fluvial sediment flux to the Arctic Lammers R.B., Shiklomanov A.I., Vörösmarty C.J., Fekete Ocean. Geomorphology 80, 94–104. B.M. & Peterson B.J. 2001. Assessment of contemporary GOSIC (Global Observing Systems Information Centre) 2006. Arctic river runoff based on observational discharge Global Observing Systems Information Centre. Accessed records. Journal of Geophysical Research—Atmospheres 106, on the internet at http://www.gosic.org on 11 December 3321–3334. 2006. Lyon S.W., Destouni G., Giesler R., Humborg C., Mörth M., GRDC (Global Runoff Data Centre) 2006. Global Runoff Data Seibert J., Karlsson J. & Troch P.A. 2009. Estimation of Centre. Accessed on the internet at http://grdc.bafg.de on permafrost thawing rates in a sub-Arctic catchment using 5 December 2006. recession flow analysis. Hydrology and Earth System Sciences Hannerz F. 2008. Making water information relevant on local to Discussions 6, 63–83. global scale—the role of information systems for integrated water Maurer T. 2003. Development of an operational internet-based management. PhD thesis, Stockholm University. near real time monitoring tool for global river discharge data. Hinzman L.D., Bettez N.D., Bolton W.R., Chapin F.S. III, GRDC Report 30. Koblenz: Global Runoff Data Centre. Dyurgerov M.B., Fastie C.L., Griffith B., Hollister R.D., McClelland J.W., Holmes R.M., Peterson B.J., Amon R., Hope A., Huntington H.P., Jensen A.M., Jia G.J., Brabets T., Cooper L., Gibson J., Gordeev V.V., Guay C., Jorgenson T., Kane D.L., Klein D.R., Kofinas G., Lynch Milburn D., Staples R., Raymond P.A., Shiklomanov I., A.H., Lloyd A.H., McGuire A.D., Nelson F.E., Oechel W.C., Striegl R., Zhulidov A., Gurtovaya T. & Zimov S. 2008. Osterkamp T.E., Racine C.H., Romanovsky V.E., Stone Development of a pan-Arctic database for river chemistry. R.S., Stow D.A., Sturm M., Tweedie C.E., Vourlitis G.L., EOS, Transactions of the American Geophysical Union 89, Walker M.D., Walker D.A., Webber P.J., Welker J.M., doi 10.1029/2008EO240001. Winker K.S. & Yoshikawa K. 2005. Evidence and Miteva B. 2001. Built-up land classification. Accessed on implications of recent climate change in northern Alaska the internet at http://www.sage.wisc.edu/atlas/ and other Arctic regions. Climatic Change 72, 251–298. maps.php?datasetid=18&dataset=18 on 19 April 2007. Polar Research 28 2009 327–338 © 2009 The Authors 337
Hydrological and hydrochemical observation status                                                                 A. Bring & G. Destouni

Nellemann C., Kullerud L., Vistnes I., Forbes B.C., Husby E.,       pan-Arctic research. EOS, Transactions of the American
  Kofinas G.P., Kaltenborn B.P., Rouaud J., Magomedova              Geophysical Union 83, 13.
  M., Bobiwash R., Lambrechts C., Schei P.J., Tveitdal S.,        Sidle D.R.C. 2006. Field observations and process
  Grøn O. & Larsen T.S. 2001 GLOBIO. Global methodology for         understanding in hydrology: essential components in
  mapping human impacts on the biosphere. UNEP/DEWA/                scaling. Hydrological Processes 20, 1439–1445.
  TR.01-3. Nairobi: Division of Early Warning and                 Soulsby C., Tetzlaff D., Dunn S.M. & Waldron S. 2006.
  Assessment, United Nations Environment Programme.                 Scaling up and out in runoff process understanding:
Nordhaus W.D. 2006. Geography and macroeconomics: new               insights from nested experimental catchment studies.
  data and new findings. Proceedings of the National Academy of     Hydrological Processes 20, 2461–2465.
  Sciences 103, 3510–3517.                                        US Geological Survey 1998. HYDRO1k Elevation Derivative
NSIDC (National Snow and Ice Data Center) 2006. National            Database. Center for Earth Resources Observation and
  Snow and Ice Data Center. Accessed on the internet at             Science, Sioux Falls, SD.
  http://nsidc.org on 15 December 2006.                           US Geological Survey 2007. USGS National Water
Olson D.M., Dinerstein E., Wikramanayake E.D., Burgess              Information System. Accessed on the internet at http://
  N.D., Powell G.V.N., Underwood E.C., D’amico J.A., Itoua          waterdata.usgs.gov/nwis on 20 March 2007.
  I., Strand H.E., Morrison J.C., Loucks C.J., Allnutt T.F.,      Vörösmarty C.J., Fekete B.M., Meybeck M. & Lammers R.B.
  Ricketts T.H., Kura Y., Lamoreux J.F., Wettengel W.W.,            2000. Global system of rivers: its role in organizing
  Hedao P. & Kassem K.R. 2001. Terrestrial ecoregions of the        continental land mass and defining land-to-ocean linkages.
  world: a new map of life on Earth. BioScience 51, 933–938.        Global Biogeochemical Cycles 14, 599–621.
PARTNERS 2008. Pan-Arctic River Transport of Nutrients,           Vörösmarty C.J., Fekete B.M. & Tucker B.A. 1998. River
  Organic Matter, and Suspended Sediments. Accessed on the          Discharge Database, version 1.1 (RivDIS v1.0 supplement.)
  internet at http://ecosystems.mbl.edu/partners on 16 June         Available through the Institute for the Study of Earth,
  2008.                                                             Oceans, and Space, University of New Hampshire,
Peterson B.J., Holmes R.M., McClelland J.W., Vörösmarty             Durham, NH.
  C.J., Lammers R.B., Shiklomanov A.I., Shiklomanov I.A. &        Vörösmarty C.J., Hinzman L.D., Peterson B.J., Bromwich
  Rahmstorf S. 2002. Increasing river discharge to the Arctic       D.H., Hamilton L.C., Morison J., Romanovsky V.E., Sturm
  Ocean. Science 298, 2171–2173.                                    M. & Webb R.S. 2001. The hydrologic cycle and its role in
Peterson B.J., McClelland J., Curry R., Holmes R.M., Walsh          Arctic and global environmental change: a rationale and strategy
  J.E. & Aagaard K. 2006. Trajectory shifts in the Arctic and       for synthesis study. Fairbanks: Arctic Research Consortium of
  Subarctic freshwater cycle. Science 313, 1061–1066.               the United States.
Prowse T.D., Bøggild C.E., Glazovsky A.F., Hagen J.O.M.,          Walker T.R., Crittenden P.D., Young S.D. & Prystina T. 2006.
  Hinzman L.D., Killingtveit Å., Lettenmaier D.P., Nelson           An assessment of pollution impacts due to the oil and gas
  F.E., Rouse W.R., Steffen K., Shiklomanov I.A., Young K.L.        industries in the Pechora basin, north-Eastern European
  & Kotlyakov V.M. 2005. ICARP II—Science Plan 7. Terrestrial       Russia. Ecological Indicators 6, 369–387.
  cryospheric and hydrologic processes and systems. Copenhagen:   Walsh J., Anisimov O., Hagen J.O., Jakobsson T., Oerlemans
  Second International Conference on Arctic Research                J., Prowse T.D., Romanovsky V., Savelieva N., Serreze M.,
  Planning.                                                         Shiklomanov A., Shiklomanov I. & Solomon S. 2005.
SAGE (Center for Sustainability and the Global                      Crysophere and hydrology. In C. Symon et al. (eds.): Arctic
  Environment) 2007. Atlas of the biosphere: mapping                climate impact assessment. Pp. 183–242. Cambridge:
  the biosphere. Accessed on the internet at http://                Cambridge University Press.
  www.sage.wisc.edu/atlas/maps.php on 30 March 2007.              Willmott C.J. & Matsuura K. 2001. Terrestrial water budget
Serreze M.C., Walsh J.E., Chapin III F.S., Osterkamp T.,            data archive: monthly time series (1950–1999). Accessed
  Dyurgerov M., Romanovsky V., Oechel W.C., Morison J.,             on the internet at http://climate.geog.udel.edu/~climate/
  Zhang T. & Barry R.G. 2000. Observational evidence of             html_pages/download.html on 30 April 2007.
  recent change in the northern high-latitude environment.        Zhulidov A.V., Khlobystov V.V., Robarts R.D. & Pavlov D.F.
  Climatic Change 46, 159–207.                                      2000. Critical analysis of water quality monitoring in the
Shiklomanov A.I., Lammers R.B. & Vörösmarty C.J. 2002.              Russian Federation and former Soviet Union. Canadian
  Widespread decline in hydrological monitoring threatens           Journal of Fisheries and Aquatic Sciences 57, 1932–1939.

338                                                                                      Polar Research 28 2009 327–338 © 2009 The Authors
You can also read