Training on data collection and management to improve GHG inventory compilation in the waste sector Workshop documentation
←
→
Page content transcription
If your browser does not render page correctly, please read the page content below
Information Matters, Ghana

Capacity Building for Enhanced Reporting and Facilitation of International
         Mutual Learning through Global Peer-to Peer Exchange

             Training on data collection and management
             to improve GHG inventory compilation in the
             waste sector
             Workshop documentation
             Capital View Hotel, Koforidua, Ghana
             14-15 February 2018
This project is part of the International Climate Initiative (IKI). The Federal Ministry for the
Environment, Nature Conservation and Nuclear Safety (BMU) supports the initiative on the basis
of a decision adopted by the German Parliament (Bundestag).

Published by
Deutsche Gesellschaft für
Internationale Zusammenarbeit (GIZ) GmbH

Registered offices
Bonn and Eschborn, Germany
T +49 228 44 60-0 (Bonn)
T +49 61 96 79-0 (Eschborn)

Friedrich-Ebert-Allee 40
53113 Bonn, Germany
T +49 228 44 60-0
F +49 228 44 60-17 66

Dag-Hammarskjöld-Weg 1-5
65760 Eschborn, Germany
T +49 61 96 79-0
F +49 61 96 79-11 15

E info@giz.de
I www.giz.de

Authors
Reka Soos, Brian McCarthy and Flaviu Pop (Resources and Waste Advisory Group)

Editors
Oscar Zarzo, Verena Schauss and Maria Lau (GIZ)

Photo credits
GIZ

Copyright
GIZ

Berlin, May 2018
Information Matters Ghana: Waste Workshop Documentation

Contents
Abbreviations ............................................................................................................................. 4

1.     Background ......................................................................................................................... 5

     1.1.     Information Matters ...................................................................................................... 5
     1.2.     Project activities in Ghana............................................................................................ 5
     1.3.     Purpose and objectives of the training ......................................................................... 6
     1.4.     Training approach and content .................................................................................... 6
2.     Activities and results achieved ............................................................................................ 6

     2.1.     Day 1 ........................................................................................................................... 6
        2.1.1.      Setting the scene: Information Matters global project ............................................ 6
        2.1.2.      The UNFCCC processes ...................................................................................... 7
        2.1.3.      Overview about 2006 IPCC Guidelines on waste .................................................. 8
        2.1.4.      Ghana’s current GHG inventory on waste ............................................................11
        2.1.5. Exercise 1: Identifying key categories, scope of inventory and issues with quality of
        the data based on a 3 scenarios mass balance .................................................................12
        2.1.6.      Waste management data .....................................................................................14
        2.1.7.      Exercise 2: Classification of SW disposal sites ....................................................16
        2.1.8.      Exercise 3: Data needs – what data, from where and why? .................................16
     2.2.     Day 2 ..........................................................................................................................20
        2.2.1.      IPCC waste model ...............................................................................................20
        2.2.2. Exercise 4: Understanding the impact of different data sets on GHG emissions.
        Default data versus country-specific data ...........................................................................21
        2.2.3.      Identification of mitigation actions in the waste sector ..........................................22
        2.2.4.      Waste analysis and characterisation and waste audit methodology .....................24
        2.2.5.      Exercise 5: Institutional functions .........................................................................24
        2.2.6.      Closing remarks ...................................................................................................26
3.     Outputs and outcomes .......................................................................................................26

4.     Recommendations .............................................................................................................26

5. Annexes ................................................................................................................................28

     Annex 1: Workshop agenda ..................................................................................................28
     Annex 2: Adapting the training to special circumstances in Ghana ........................................31
     Annex 3: Photo report............................................................................................................33

                                                                                                                                               3
Information Matters Ghana: Waste Workshop Documentation

Abbreviations
BMU      Federal Ministry for the Environment, Nature Conservation and Nuclear Safety
BOD      Biological oxygen demand
BUR      Biennial Update Report
C&D      Construction and demolition
CCAC     Climate & Clean Air Coalition
CH4      Methane
CO2      Carbon dioxide
COD      Chemical oxygen demand
DDOC     Decomposable degradable organic carbon
DOC      Degradable organic carbon
EPA      Environmental Protection Agency
FOD      First order decay
Gg       Gigagram (1 kt or 1,000 t)
GHG      Greenhouse gas
GIZ      Deutsche Gesellschaft für Internationale Zusammenarbeit GmbH
IM       Information Matters
IPCC     Intergovernmental Panel on Climate Change
MCF      Methane correction factor
MLGRD    Ministry of Local Government and Rural Development
MRV      Measurement, reporting and verification
MSW      Municipal solid waste
MtCO2e   Million tonnes of carbon dioxide equivalent
NAMA     Nationally appropriate mitigation action
NC       National communication
NDC      Nationally determined contribution
NIR      National inventory report
N2O      Nitrous oxide
RCC      Regional Coordination Council
SWDS     Solid waste disposal site
TOW      Total organically degradable carbon in wastewater
UNFCCC   United Nations Framework Convention on Climate Change

                                                                                        4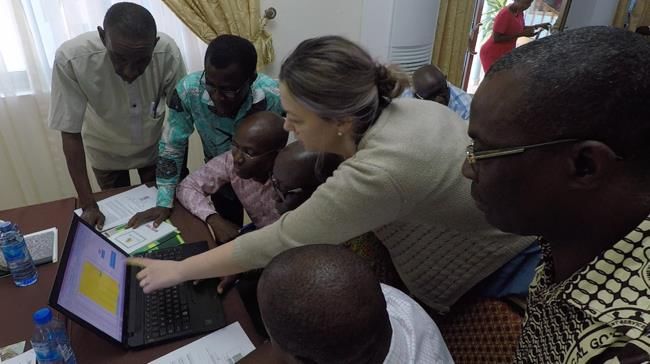
Information Matters Ghana: Waste Workshop Documentation

   1. Background
   1.1. Information Matters
In the context of the Information Matters (IM) project, the Deutsche Gesellschaft für Internationale
Zusammenarbeit (GIZ) GmbH on behalf of the German Federal Ministry for the Environment,
Nature Conservation, and Nuclear Safety (BMU), provides support to a number of selected
partner countries to strengthen their in-country capacities for enhanced reporting under the United
Nations Framework Convention on Climate Change (UNFCCC). IM is funded under BMU’s
International Climate Initiative (IKI). For more information, please refer to www.international-
climate-initiative.com. The project focuses especially on the preparation of Biennial Update
Reports (BURs) and the development and implementation of sustainable systems for
measurement, reporting and verification (MRV). During a first project phase (2013-2016) support
has been provided to Chile, the Dominican Republic, Ghana and the Philippines. For the second
phase (2016-2017), Colombia, Egypt, Georgia and Viet Nam joined the project, allowing building
upon the results, experiences and ‘lessons learned’ gained during the first phase.

A key feature of the IM project is the country-tailored approach. In consultation with the partner
countries, specific needs and priorities for setting up MRV systems and greenhouse gas (GHG)
emissions inventories are identified, prioritised and addressed through tailored in-country capacity
building workshops and training events. These capacity building activities aim to enable the
partner countries to analyse and define procedures, methods and responsibilities, with a view to
systematically institutionalising their MRV systems and meeting reporting requirements under the
UNFCCC.

Given that MRV systems are an essential element of the forthcoming Enhanced Transparency
Framework under the Paris Agreement, the IM project also provides a sound basis for its partner
countries to prepare for future post-Paris transparency requirements.

   1.2. Project activities in Ghana
GIZ provided technical support to Ghana’s Environmental Protection Agency (EPA), addressing
its specific capacity building needs. Following the general project implementation steps, the
project in Ghana started in 2013 with a stock taking exercise during which the strengths and gaps
in the MRV system in place were analysed and assessed. At a subsequent kick-off workshop to
review the stock take with key stakeholders, a roadmap for capacity building was developed.

After conducting five capacity building workshops (MRV domestic architecture, climate-relevant
data management, quality assurance and quality control of GHG inventories, baseline scenario
setting and training on the Intergovernmental Panel on Climate Change (IPCC) software, and
preparation for the ICA and lessons learned from the first BUR preparation process), the IM
project carried out a sixth workshop in February 2018 on data collection and management to
improve GHG inventory compilation in the waste sector.

                                                                                                  5
Information Matters Ghana: Waste Workshop Documentation

   1.3. Purpose and objectives of the training
The training aimed to improve Ghana’s climate data management system to ensure enhanced
data gathering and to improve the quality of reporting in the waste sector for Ghana’s GHG
inventory. The main topics in focus in Ghana, as established with the EPA, were:

   •   introduction to the UNFCCC negotiation process and agreements and the reporting
       requirements and international policy instruments arising from them;
   •   introduction to the 2006 IPCC Guidelines for inventory development in the waste sector;
   •   waste data collection and management;
   •   in-depth insight into use of the Excel tools described in the IPCC Guidelines;
   •   waste characterisation method;
   •   defining and selecting mitigation actions and comparing mitigation scenarios;
   •   institutional framework for inventory compilation and data flows.

   1.4. Training approach and content
The training approach was a mix of interactive lectures and group exercises. The lectures were
delivered in such a way as to facilitate interaction, ensuring that there were pauses for questions.
Time was set aside for questions and answers at the end of each presentation. There were two
formal presentations delivered by the EPA to enhance understanding of the local situation and
help the consultant adapt the training to local circumstances.

The training materials were adjusted to the local context, using local studies, policies and Ghana’s
inventory data. Annex 2 gives details on how the materials were adjusted to fit local circumstances
in Ghana. A total of five exercises were carried out during the training. Four of these involved
group work and were followed by presentation and discussion in plenary. One exercise involved
short videos of disposal sites around the world and discussion of each video in a plenary session,
with participants learning to use IPCC definitions together.

   2. Activities and results achieved
   2.1. Day 1
   2.1.1. Setting the scene: Information Matters global project
Setting the scene included a presentation of past activities of the IM project in Ghana and an
introduction to the agenda of the workshop (Annex 1).

The participants were asked to respond to a series of questions with a show of hands, which
allowed the consultant to ascertain that the audience was largely made up of field practitioners
from municipalities around the country and EPA representatives. Some of the participants were
therefore highly knowledgeable on waste issues, and others on GHG inventories.

                                                                                                  6
Information Matters Ghana: Waste Workshop Documentation

    2.1.2. The UNFCCC processes
Developments in international climate policy
The timeline of UNFCCC negotiations and the most important milestones in the negotiations
among countries were presented, as shown in the diagram below.1 The presentation focused on
points of interest to the participants in the training event, highlighting Conferences of the Parties
at which decisions regarding reporting, national inventories and specific policy instruments for
mitigation were made.

Figure 1: Brief history and current status of climate agreements and negotiations

Institutional roles in GHG inventory development in the waste sector2
The presentation distinguished between the institutional roles for GHG inventory development,
including those concerned with inventory compilation and calculation, and the managers of
different data sets and activity data collectors. The institutional arrangements for NCs and BURs
are connected to the institutional roles already established for data collection and management.

1Largely based on the UNFCCC timeline available at http://unfccc.int/timeline/.
2UNFCCC Toolkit for Non-Annex I Parties on establishing and maintaining institutional arrangements for
preparing national communications and biennial update reports.

                                                                                                    7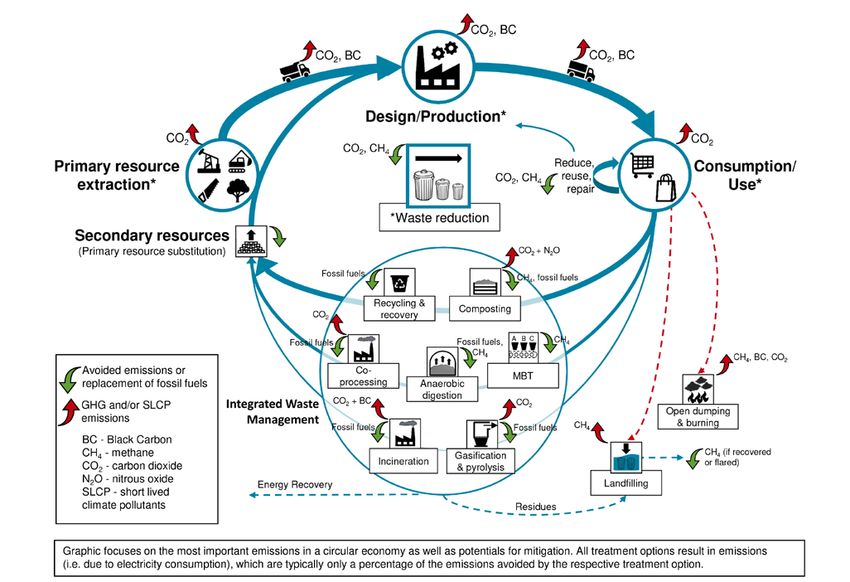
Information Matters Ghana: Waste Workshop Documentation

Discussions and results

The following discussions arose during this session of the training:
   • The abbreviations specific to UNFCCC negotiations, reporting and policy development
        processes were overwhelming and needed more clarification.
   • The role of emissions trading in the current UNFCCC process was raised, and the standing
        of the emissions trading markets was discussed.
   • Participants raised the issue that some emissions and waste generation in developing
        countries is due to second-hand equipment, cars and waste being exported from
        developed countries to developing countries. It was concluded that all countries need to
        develop and implement policies to prevent and control this. These emissions are not fully
        attributable to developing countries. The implementation of such policies requires
        resources.

Results
   • An increased understanding of UNFCCC processes among participants.
   • An understanding of why the GHG inventories need to be prepared.
   • An understanding on how the inventories contribute to shaping policy for mitigation
      actions.
   • A list of abbreviations was drafted and is included as part of this report on page 4.

   2.1.3. Overview about 2006 IPCC Guidelines on waste
After this first session providing an introduction to UNFCCC reporting requirements, processes
and policy instruments, attention turned to the content of the 2006 IPCC Guidelines for inventory
development.

What is covered in the Guidelines?
The graph below shows the categories of activities covered in the GHG inventory for the waste
sector. At the national GHG inventory level, it is important to understand the boundaries of the
reporting system to avoid double counting. The Guidelines include instructions on allocating
emissions to the different sectors.

                                                                                               8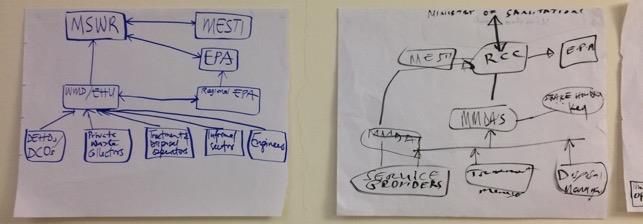
Information Matters Ghana: Waste Workshop Documentation

Figure 2: Sectors covered by the Guidelines

This part of the presentation was mainly based on the Good Practice Study on GHG Inventories
for the Waste Sector in Non-Annex I Countries undertaken by GIZ.3 For each emission
category, information was given on sources of emissions, activity data and emission factors, and
good practice examples from different countries were presented.

Solid waste disposal sites
The main pathways for GHG emissions from landfills are methane generation through anaerobic
digestion of biodegradables. This methane is either oxidised in cover layers, released into the
atmosphere or extracted for flaring or energy recovery. The methane generated at disposal sites
is estimated based on the IPCC Guidelines for the purposes of the inventory. For determining
methane emissions, the IPCC Guidelines recommend the use of the first order decay (FOD)
method and provide Excel tools and software to carry out this assessment based on a series of
input data.

Data needs:
   • population data
   • municipal solid waste (MSW) generation data

3   GIZ, Good Practice Study on GHG Inventories for the Waste Sector in Non-Annex I Countries.

                                                                                                 9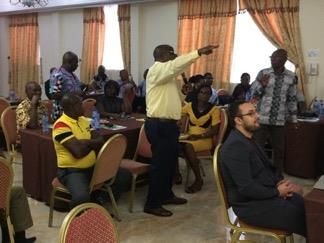
Information Matters Ghana: Waste Workshop Documentation

   •   historical waste generation data
   •   industrial waste generation data
   •   share of solid waste disposed of
   •   waste composition.

Biological treatment of solid waste
This section covers composting and anaerobic digestion. As decomposition of biomass during
these treatments is much faster than at disposal sites, the emissions are estimated on an annual
basis. In both cases, they are process emissions and are higher at poorly managed treatment
sites than at well managed ones.

Amount of organic waste treated
  • Default values in the Guidelines are scarce; national activity data should be used.
  • Even if there is limited data reported by a limited number of sites, countries are
     encouraged to use the available data as a starting point and employ various methods to
     fill in the gaps.

Emission factors for treatment
   • Default values are available; countries are encouraged to develop national emission
       factors (Tier 2) or measure emissions at sites (Tier 3).

Incineration and open burning
CO2, CH4 and N2O are generated during the combustion process. The diagram below (Figure 3)
depicts the process emissions that count towards the GHG inventory. Emissions from the burning
of fossil fuel count towards the GHG inventory, while those from the combustion of biomass do
not.

Incineration takes place in a relatively low number of controlled facilities. It is a common
treatment for clinical waste in developing countries:
    • waste burned per type, including municipal solid waste, industrial waste, hazardous waste,
       clinical waste and sewage sludge, and share of fossil carbon per waste type;
    • amount of fossil liquid waste;
    • site-specific data is often collected for controlled facilities; methodologies are available for
       gap filling, for example, estimating the amount of clinical waste based on the number of
       hospital beds.

Open burning is common practice, especially in rural areas; detailed consideration of this
category is therefore recommended:
    • population burning waste and waste generation among this population;
    • fraction of waste burned; open burning is an incomplete process, and the default value is
       that 60% of waste is actually oxidised and 40% remains as ash on site;
    • the population not served by a collection service and the quantity of waste going to open
       pits are possible starting points for estimating the quantity of waste openly burned.

Emission factors depend on the fossil carbon content of the waste for CO2, while for CH4 and
N2O they depend on the combustion technology. Default values are available.

Wastewater treatment and discharge
Methane emissions occur in deep and slow-moving waters and can be found in both treatment
and discharge pathways.

                                                                                                   10
Information Matters Ghana: Waste Workshop Documentation
In order to estimate CH4 and N2O emissions in this category, the total organically degradable
material in wastewater (TOW) needs to be determined. Biological oxygen demand (BOD) is the
most common way to measure TOW content of the wastewater.
Domestic wastewater:
• determine the total organically degradable material in wastewater (TOW);
• determine or choose the default value for emission factors for each pathway of the system;
default values are available for domestic wastewater based on the carbon discharged per
person;
• determine the relative share of each pathway in the system; systems may be distributed
based on rural, urban high-income and urban low-income populations.
Industrial wastewater:
• the main industries to consider for emissions from industrial wastewater are pulp and
paper, food and beverages and the organic chemical industry;
• activity data is based on production output from the relevant industries and chemical
oxygen demand (COD) per unit of output for each industry;
• for N2O emissions, the value for protein intake per person is required; protein intake may
be available from nutritional statistics or international organisations.
Discussions and results
The following discussions arose during this session of the training:
• The rationale for converting GHGs to CO2e was discussed, and it was explained by the
trainers that this is a common denominator for accounting purposes and is used as the
currency of GHG accounting, measurement, reporting and verification and trading. The
global warming potential of gases is expressed in terms of the global warming potential of
CO2.
• A discussion arose about upward trends in methane emissions in Ghana and in the
developing world in general. It was explained by the trainers that this is due to growing
consumption and population and waste generation patterns and also to the shift from
disposal at aerobic sites to sites that are better managed and more likely to create
anaerobic conditions.
Results
• An increased understanding of the IPCC Guidelines on waste among participants.
• An understanding of all the emission sources in all waste-related subsectors.
2.1.4. Ghana’s current GHG inventory on waste
Current waste management in Ghana
The current waste generation rates in Ghana range between 0.2 and 0.8 kg/person/day, while the
total estimated amount of waste produced is estimated at 13,500 tonnes per day. Waste
composition is dominated by organic materials (approximately 60%). The coverage of waste
collection services in urban areas has increased from 68% in 2004 to approximately 80% in 2010.
As of 2015, there are five operational engineered sanitary landfills in Ghana as well as 172 official
dumpsites. There are about seven medium to large operational and non-operational composting
facilities in Ghana with capacities ranging from 1,000-110,000 tonnes/year.
Data collection and management
11Information Matters Ghana: Waste Workshop Documentation
Sources of data for the compilation of the inventory include published national reports, Ghana
Statistical Service, the Sanitation Directorate of the Ministry of Local Government and Rural
Development (MLGRD), the World Bank Country Database, private waste management
companies, the Civil Engineering Department of the Kwame Nkrumah University of Science and
Technology (KNUST), EPA, Ghana Heath Services, MLGRD and the National Industry Survey.
Filling of data gaps
The data gaps were filled as per the IPCC methodology and included:
• solid waste disposal – trend interpolation method to address missing data on annual per
capita solid waste generation;
• waste water discharge and treatment – interpolation and extrapolation methods to address
missing data on income classification and interpolation to address the distribution of
population to different waste treatment facilities.
Improvement plan
The improvement plan includes tasks to increase data quality for solid waste disposal (solid waste
generation rates and waste composition), the classification of disposal sites, the share of solid
waste treated biologically and industrial and domestic waste.
Methodology for emission estimation
• 2006 IPCC Guidelines for estimating CH4 emissions from solid waste disposal sites
(SWDSs) (Excel spreadsheet):
o default values for Western Africa (tropical wet) on delay time, oxidation factor, CH4
generation rate constant, degradable organic carbon (DOC) and DOCf (fraction of
DOC that can decompose);
o methane correction factor – three types of landfill in Ghana (unmanaged deep,
unmanaged shallow and managed anaerobic).
• Biological treatment of waste: in 2012, 187.47 gigagrams (Gg) or 3.7% of the total national
solid waste generated.
• Incineration and open burning: in 2012, 33.26 Gg of waste incinerated and 133.06 Gg
openly burned.
• Wastewater treatment and discharge: in 2012, BOD was 16.43 kg/person, and protein
intake was 26.5 kg/person.
In 2012, total GHG emissions in the waste sector amounted to 4.52 MtCO2e, which represented
14.6% of total national GHG emissions. Total emissions from the sector increased from 1.3
MtCO2e in 1990 to 2.3 MtCO2e in 2000 and further to 4.52 MtCO2e in 2012. One of the key
challenges is data across the time series.
2.1.5. Exercise 1: Identifying key categories, scope of inventory and issues with
quality of the data based on a 3 scenarios mass balance
Key category analysis and double counting was covered in the introduction to this part of the
training. Handouts on mass balance flows were distributed and questions put to groups.
12Information Matters Ghana: Waste Workshop Documentation
Avoiding double counting
The issue of avoiding double counting is central to GHG inventories, and the Guidelines contain
detailed instructions on how to do this.
The diagram below illustrates the activities included as emission categories in the Guidelines as
well as other treatment options and technologies in production, consumption and waste
management processes that are not counted towards the waste sector. Activities included in the
GHG inventory are those marked with a red circle.
Figure 3: Waste management activities included in the waste sector inventory (marked
with a red circle)4
Key category analysis
Key categories are those data source categories that contribute the most to absolute emissions
(level assessment) and/or to the change in GHG emissions over the years (trend assessment).
One of the following methods can be used to identify key categories (IPCC, 2006):
• qualitative assessment,
• based on previous emissions estimates,
• based on previous emissions estimates and uncertainties.
In the case of waste management data, given that the largest sources of emissions are methane
generation resulting from solid waste disposal, data for key categories is often the amount and
composition of the waste collected and disposed of. However, if significant changes are expected
in waste diversion to an advanced treatment technology, another data source may become
crucial, for example, composting if the country is focusing on a significant increase in composting.
4 Adapted from GIZ, Sectoral implementation of nationally determined contributions (NDCs): Circular
economy and solid waste management, 2017.
13Information Matters Ghana: Waste Workshop Documentation
Discussions and results
There were three main categories of questions that gave rise to the following discussions and
results:
• Identification of key categories was useful; the different groups identified different key
categories based on the scenarios. The result of the exercise was to showcase how
different data will be useful in different waste management systems.
• Identification of the scope of the inventory in terms of categories was useful, and the
options given in the handout were helpful. Participants identified and discussed emissions
and activities that were outside the scope of the waste sector inventory.
Results
• A better understanding of how key categories are identified and how they can change
depending on the waste management system, priorities, policies and trends.
• An understanding of the importance of avoiding double counting in the context of national
inventories.
• Increased capacity to identify the basket of gases that would be measured for GHG
inventory compilation in the sector.
2.1.6. Waste management data
Waste data collection
Waste management services are delivered at sub-national level, either at sub-national
government authority levels (e.g. regional, provincial, municipal, etc.) or at NGO (interest group),
corporate, facility or project levels.
Understanding this diversity of stakeholders and their different data requirements is important to
determine how to obtain the data that is needed and interpret and validate it correctly. There are
commonalities that can be exploited, and efforts to improve this aspect should be given priority.
Figure 4: Typical integrated solid waste management service chain
The figure above illustrates a typical integrated solid waste management service chain, showing
core local service provision, i.e. collecting and transporting waste. The value chain is also a key
focus, introducing circular economy thinking to retrieve value from waste resources. At an
14Information Matters Ghana: Waste Workshop Documentation
operational level, waste management practitioners, who produce the raw sub-national data, focus
on delivering their services based on these factors.
Waste data management
The IPCC Guidelines provide default values for waste generation, mass and composition that
assist in preparing GHG inventories when data is missing.
The two graphs presented in figure 5 illustrate the composition of municipal solid waste in two
% Composition
different South African by Mass (kg)
municipalities. It demonstrates how composition can vary between
% Composition by Mass (kg)
locations within a country along with variances in generation.
SPECIAL CARE OTHER WASTE
OTHER WASTE WASTES 3%
SPECIAL CARE 4%
WASTES
5%
8%
C&D Food waste
Food waste 0% TEXTILES 17%
20% 8%
C&D TEXTILES
0% 7%
GLASS
GLASS
4% 9%
METAL
2% METAL Garden waste
2% 19%
Garden waste
PAPER & 19% PAPER &
PAPERBOARD
18%
PAPERBOARD
16%
PLASTICS
PLASTICS
18% 21%
Figure 5: Comparison of MSW composition in two different South African cities
Food waste Garden waste PLASTICS
Figure 5 highlights the variance that exists between the 2006 IPCC Guidelines default MSW
PAPER & PAPERBOARD METAL GLASS
composition figures for Southern Africa and data collected in South Africa in 2017. There is a
substantial difference between the two which C&Dwhen combined TEXTILES
with the variancesSPECIAL CARE WASTES
in generation
OTHER WASTE
rates and added to the national level can result in significant emission calculation variance.
15% Composition
Information Matters Ghana: Waste by Mass (kg)Documentation
Workshop
OTHER WASTE
SPECIAL CARE 4%
WASTES
8%
Food waste Food waste
23% 20%
C&D TEXTILES
0% 7%
OTHER WASTE
GLASS
37%
4%
METAL
2%
Garden waste
PAPER & 19%
Garden waste PAPERBOARD
25% 18%
Wood
15% PLASTICS
18%
Figure 6: Variance between the 2006 IPCC Guidelines default MSW composition and
data collected in South Africa in 2017
Given the diversity of stakeholders and their varying data needs, the best way to maximise
accuracy and minimise the reporting burden on practitioners in the field, data duplication and
inconsistencies is to establish a standardised national waste reporting system.
A methane correction factor (MCF) is a value assigned to each type of SWDS classified according
to the IPCC which accounts for the fact that unmanaged SWDSs produce less CH4 from a given
amount of waste than anaerobic managed SWDSs.
2.1.7. Exercise 2: Classification of SW disposal sites
Different videos showing an aerial view of several disposal sites around the world were used as
a tool to supplement the training programme. The purpose of this exercise was to provide an extra
level of insight on the topic of classifying SW disposal sites and to help the participants convert
information into knowledge. The participants were asked to identify the classification of solid
waste disposal sites and the default oxidation factor. Answers to each of the examples were
provided by the audience, and their choice was further discussed with the trainers. The examples
included waste disposal sites in Ethiopia, Senegal, South Africa and Cyprus.
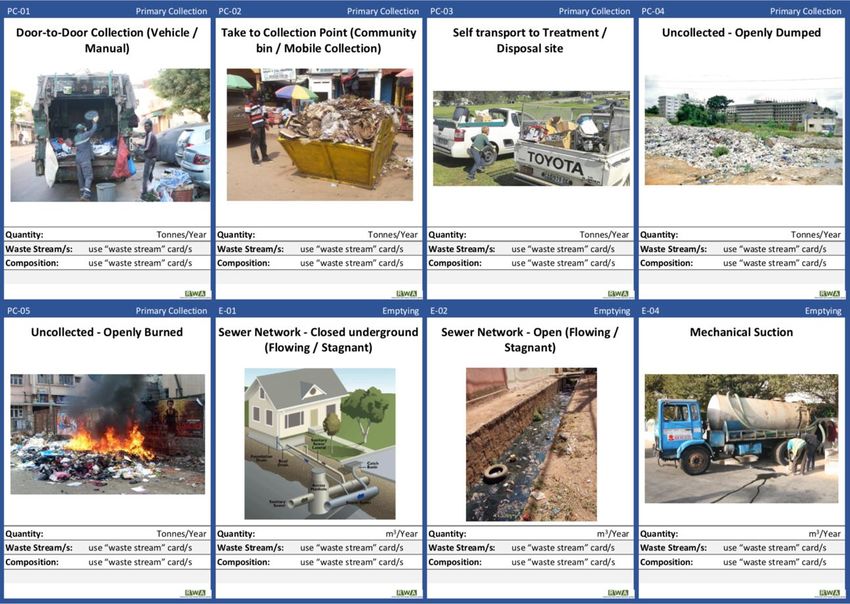
2.1.8. Exercise 3: Data needs – what data, from where and why?
An exercise was conducted to increase understanding of data needs at each step of the waste
process flow and the way waste composition and quantity change at each step. To this end, the
participants were given a generic process flow and technical options in the form of waste cards
to choose from for each process element.
The first task for participants was to construct their own waste flow, ensuring flow balance. The
diagram below depicts a flow that could have been chosen by the participants from primary
storage to collection and transfer through to final disposal.
16Information Matters Ghana: Waste Workshop Documentation
Figure 7: Solid and liquid waste process flows
Examples of the cards distributed for choice of collection method are shown below.
Figure 8: Examples of cards illustrating steps or processes in the waste sector
The participants then calculated input and output in terms of quantities and composition at each
process step.
17Information Matters Ghana: Waste Workshop Documentation
Discussions and results
Discussions related to estimating waste generation
• Waste generated in markets is difficult to estimate. Trainers pointed out that it is possible
to track a sample of trucks collecting waste from the market and estimate the amount and
composition based on that information.
• Besides open burning, there are other practices, such as waste burying and illegal
dumping, that make estimating generation rates difficult. This is done in Ghana by means
of a census, but the information it provides should be treated with caution, as it may be
biased, given that open burning and other forms of on-site treatment of waste are not
viewed as good practice and may be subject to penalty. Potentially, the amount of waste
burned or treated otherwise on site may be underestimated.
Losses in the process flow
• Moisture loss during composting and other treatments of biological waste should be taken
into account.
• If the collection is frequent, then moisture loss in the containers and primary storage point
is not an issue.
• Other losses may be due to informal sector activities.
• Losses occur already in the first step of the waste management system, especially when
there is a community-based container and a bring system rather than door-to-door
collection.
• In the discussions following Exercise 3, many group presentations included the estimated
percentages of losses at different steps of the process flow, with between 30% and 60%
disposal of the generated waste.
Waste composition
• Differences between the composition of the waste generated and the waste disposed of
were highlighted by several teams in the discussions following Exercise 3.
• Plastic and biomass are often openly burned, and this changes the composition of the
waste from the point of generation to collection.
• The fact that there is no international standard on defining waste categories (i.e. municipal
solid waste) and no international standard composition methodology was highlighted. It
was observed that this makes it difficult to compare and contrast different waste
composition study results, and a recommendation was made to establish national best
practice, norms and standards for waste characterisation and composition analysis.
Wastewater treatment and discharge
• There were discussions about ditch depth and the likelihood of anaerobic conditions and
methane generation occurring. It was clarified that deep and stagnant waters are worse
discharge options from the point of view of GHG emissions than other options such as
open defecation. However, open defecation may be worse from a public health point of
view.
• It was clarified that an open sewer is a means of collecting wastewater from homes,
institutions and businesses. Examples were shown in pictures to convey the different
wastewater discharge and treatment pathways (this highlighted a further example of
where local industry terminologies differed from IPCC Guidelines terminology).
Clarifications concerning waste disposal site categories
• The water table is high if the waste is almost permanently in contact with the water.
• Managed landfills must comply with at least one of a series of criteria, not all of them.
18Information Matters Ghana: Waste Workshop Documentation
• In terms of managed and unmanaged disposal sites, there is a difference between IPCC
categories and waste managers’ terminology and categorisation.
Results
• A thorough understanding of waste data collection and data management tasks and how
these relate to GHG inventory compilation in the sector.
• An increased understanding of IPCC terminology and definitions regarding key categories
of disposal sites and the related influence on methane generation.
• Good understanding of the waste management process flow and insight into technical
options along the process flow.
• Good understanding of the sources of emissions in wastewater treatment and discharge
pathways and ability to compare and rate different pathways in terms of climate change
impact.
19Information Matters Ghana: Waste Workshop Documentation
2.2. Day 2
2.2.1. IPCC waste model
The IPCC waste model implements the FOD method for estimating emissions from solid waste
disposal sites. According to this method, the rate of CH4 generation depends on the amount of
CO2 remaining in the waste over the several decades it takes for the content of the degradable
organic fraction of the waste to slowly decay. There are several ways in which the model can be
used by countries to compile inventories, depending on the tier used. The Tier 1 method uses a
set of default data for all the parameters of the model, which means that there is no need for any
country-specific activity data.
Figure 9: Country-specific data needed for the three tiers in the waste model
CH4 emissions from SWDSs
CH4 is generated under anaerobic conditions as a result of the degradation of organic material. It
can be recovered for energy use or flared, in which case it is subtracted from the amount
generated. The part that is not recovered will be subject to oxidation in the cover material.
20Information Matters Ghana: Waste Workshop Documentation
Data on decomposable degradable organic carbon (DDOC) from waste disposal
CH4 generation potential can be estimated based on the amount and composition of waste and
waste management practices at disposal sites. DDOCm, the mass of decomposable DOC
deposited, is the fraction of the organic carbon deposited that will degrade under anaerobic
conditions.
Methane generation potential
The methane generation potential is related to the DDOCm that will degrade at the disposal site.
Landfill gas is approximately 50% methane, with the remainder being mostly carbon dioxide.
2.2.2. Exercise 4: Understanding the impact of different data sets on GHG
emissions. Default data versus country-specific data
The purpose of this exercise was to show how country-specific data can be obtained by modelling
existing data (IPCC parameters and activity data), thus moving from IPCC default Tier 1 data to
country-specific Tier 2 data. The exercise was conducted in three different country scenarios, and
the results obtained were then compared, cumulated and interpreted.
As the IPCC waste model is quite rigid in modelling data and requires specific inputs (total MSW
generated, no breakdown between urban and rural population, etc.), an additional spreadsheet
was provided in order to show real examples of data modelling to produce the specific inputs
required by the IPCC waste model.
Results
The results for the three scenarios, as discussed, are presented in the graphs shown below. The
exercise showed how the emissions change in the three scenarios and that even though the
population in rural areas is much higher than in the low or high-income scenarios, the related
emissions are not much higher. Participants gained an understanding of the different factors that
contribute to methane emissions and learned how to use the IPCC waste model.
CH4 emissions (1000 tonnes)
25,00
20,00
15,00
10,00
5,00
0,00
1950 1960 1970 1980 1990 2000 2010
Urban 1 Urban 2 Rural
21Information Matters Ghana: Waste Workshop Documentation
2.2.3. Identification of mitigation actions in the waste sector
GHG accounting at project level versus national level requires a change of mind-set. While in
national GHG inventory development the focus is on avoiding double counting and making sure
that emissions are correctly allocated to sectors, in the case of projects the focus is on
understanding the total GHG mitigation impact of a project. Therefore, the approach and
methodologies available for project impact assessment tend to include all activities and all gases
and are often based on a life cycle approach.
In order to understand the complete GHG impact of activities, the life cycle approach is used in
emission estimating methodologies. This means that activities and materials downstream and
upstream of certain core activities are also considered when looking at the mitigation impacts.
National policy development for mitigation
While waste management contributes about 3% to global GHG emissions, it has the potential to
mitigate between 15% and 20% of emissions if we consider all the mitigation impacts the circular
economy and resource recovery can yield.5
The two main policy instruments arising from the UNFCCC Conference of the Parties (COP) are
Nationally Appropriate Mitigation Actions (NAMAs) and Nationally Determined Contributions
(NDCs).
A NAMA is any action that reduces emissions in developing countries, prepared under the
umbrella of a national governmental initiative. They can be policies directed at transformational
change within an economic sector or actions cutting across sectors for a broader national focus.
NAMAs are supported and enabled by technology, financing and capacity building and aim to
achieve a reduction in emissions relative to the ‘business as usual’ scenario by 2020.
NDCs embody efforts by each country to reduce national emissions and adapt to the impacts of
climate change. The Paris Agreement (Article 4, paragraph 2) requires each Party to prepare,
communicate and maintain successive nationally determined contributions (NDCs) that it intends
to achieve. Parties must pursue domestic mitigation measures, with the aim of achieving the
5 Global Waste Management Outlook, 2015
22Information Matters Ghana: Waste Workshop Documentation
objectives of such contributions. NDCs are powerful policy instruments that set national mitigation
and adaptation targets.
Identifying and implementing mitigation actions
Driven by national policy or by local initiatives, local plans, master plans and feasibility studies
aimed at waste sector improvements may take into consideration mitigation impacts and potential
as a decision-making factor.
Mitigation approaches and technologies
When selecting mitigation options, the waste management hierarchy and technical, financial and
legal considerations together with mitigation impact will play a role. Lastly, the cumulative impact
of each scenario considered for the different material streams will be considered.
Impact assessment of technical options and scenarios
The best-known and most commonly used methodologies for emission accounting in the sector
include the SWM-GHG Calculator (GIZ/IFEU), the Climate & Clean Air Coalition (CCAC) waste
sector tool, the GHG Protocol sector tool and the ICLEI Recycling and Composting Emissions
Protocol. These tools help users to compare scenarios based on input data, with all the equations,
emission factors and gap fillers in place in case there is data missing on any aspect of the project.
Setting baselines correctly is very important in estimating the mitigation impact of a project.
Setting baseline emissions unrealistically high is a potential source of bias in scenario
assessment.
Climate finance for mitigation
Waste sector development and, by extension, mitigation actions rely heavily on public financing,
and sources of financing are scarce. The private sector may be attracted to financing parts of
waste management development projects under public-private partnerships, but these usually
require long-term contracts and guaranteed gate fees for waste amounts. Municipalities rarely
have the credit rating and debt-to-finance ratio to be eligible for private financing even in countries
with a relatively well-developed banking sector.
Discussions and results
Mitigation
• Discussion of mitigation (deducted or avoided emissions) and emissions (occurred
emissions, added to the balance).
• Composting has positive emissions in the impact assessment of mitigation actions
because of the process emissions associated with composting.
• It was clarified that home composting is just one example of mitigation technologies
available for anaerobic digestion. The decision to pursue one mitigation option or another
should not depend solely on the GHG impact but also on other technical, financial, social
and environmental considerations.
Results
• Increased understanding of the difference between national and project-based GHG
accounting.
• Understanding of the importance of defining the ‘business as usual’ scenario and how to
conduct scenario assessment.
• Introduction to the concept of avoiding emissions and the net emission impact of projects.
23Information Matters Ghana: Waste Workshop Documentation
2.2.4. Waste analysis and characterisation and waste audit methodology
Waste analysis and characterisation consists of two parts:
• Solid waste generation survey:
o daily generation rates in kg/person/day for residential waste and in kg/m 2/day for
commercial waste;
o bulk density of solid waste generated in kg/m3.
• Solid waste composition survey:
o composition of solid waste generated as a percentage by weight.
The main steps are:
• Pre-survey:
o Includes defining the geographical area of the municipality, region or country
intending to undertake the waste analysis and the objective of the study.
• Analysis design and planning:
o Involves defining the type of sampling methodology for the geographical area and
objective identified for the study and determining the practical sample collection
design; it should take into account seasonality and stratification.
• Execution of waste analysis:
o Includes the logistics required to collect, name and number the samples, locating
and resourcing the physical sorting and analysis of the samples, recording the
data, ensuring data accuracy and quality and safely disposing of the samples once
the analysis has been completed.
• Evaluation of waste analysis:
o The evaluation includes compiling results and entering them into a spreadsheet
for calculations, disaggregation and comparisons with existing data sets (i.e.
weighbridge data or past analysis), extrapolating the results against strata and
area summaries and presenting the results in a format compatible with the
established objectives and target audience.
2.2.5. Exercise 5: Institutional functions
A brief introduction on data flow and institutional roles was followed by a group exercise, plenary
presentation and intense debate among participants, signalling an interest and eagerness on the
part of the Ghanaian waste sector and climate sector stakeholders to cooperate in improving the
GHG inventory for the sector.
Institutional roles for GHG inventory development include inventory compilation and calculation
functions and also the roles of managers of different data sets and activity data collectors.
Institutional arrangements for the preparation of NCs and BURs are closely associated with the
institutional roles already established for waste data collection and management systems.
24Information Matters Ghana: Waste Workshop Documentation
Figure 10: Institutional roles for data collection, management and reporting
Institutional roles in GHG inventory compilation
It is recommended that a single body be designated to be responsible for the overall coordination
and management of the process of preparing NCs and BURs. The compilation and submission
of National Inventory Reports (NIRs), as shown below, is a complex cyclic process that restarts
almost immediately after a report is finalised.
As part of this exercise, participants were asked to draw a data flow diagram and institutional
structure that, in their view, would be best suited for collecting, reporting and aggregating the
activity data needed for GHG inventory compilation.
Discussions and results
Institutional setup
Those stakeholders who are responsive and provide data are invited to participate and
continue to be part of the working groups. Some operators have been more responsive
than municipal departments and have gained an important role as data providers.
The role of the Regional Coordination Council (RCC) was discussed, and the participants
raised the question of whether municipal departments should be directly linked to the
national level or continue to report through the RCC as they do at present. Following a
heated discussion, the consensus reached seemed to be that current systems should be
reinforced rather than reinventing the wheel. The RCC’s role should therefore be
maintained and strengthened.
Various specialised working groups carry out inventory compilation. Questions related to
the size and composition of the groups were clarified by Ghana EPA.
25Information Matters Ghana: Waste Workshop Documentation
Data management instruments
The idea of sharing data on a web-based platform was proposed.
Means of financing and reducing the costs of waste composition and characterisation
studies mainly consist of sourcing donor funds and involving research institutions or
universities in the process.
2.2.6. Closing remarks
The workshop closed with a summary of the most important topics covered and the main learning
points addressed over the two days.
The head of Ghana EPA emphasised the importance of continuously improving the GHG
inventory for the waste sector and implementing mitigation actions. Participants were encouraged
to collect and communicate better field data, implementing the knowledge and skills they had
learned during the training.
3. Outputs and outcomes
The training aimed to improve Ghana’s climate data management system to ensure enhanced
data gathering and to improve the quality of reporting in the waste sector for Ghana’s GHG
inventory.
The authorities responsible for GHG inventory compilation now have sound experience and
knowledge of good practices and are aware of the methods and tools available to improve
inventories.
Given that the majority of the trainees were data managers and waste management practitioners
who are knowledgeable about the existing waste management systems at the municipal level but
are not aware of the exact requirements of a GHG inventory, the main outcome of the training
was to facilitate communication with the authorities responsible for the GHG inventory and make
the trainees aware of data requirements for a GHG inventory.
There was a lively debate during one of the last sessions, focusing on institutional arrangements
and data flow. As the waste management practitioners are at the base of the data management
pyramid and have an important role in sourcing the information needed for GHG inventories, the
knowledge gained during the training will contribute to improving the quality of GHG waste data
and making communication channels more effective towards the top of the pyramid.
The training workshop created a platform for discussion with different institutions on how to
strengthen the design of the data collection and management systems in order to improve the
quality of the data.
4. Recommendations
As a result of the training, waste management practitioners are more aware of data needs for the
GHG inventory and have gained knowledge and skills in this field and also in collecting data. Field
practitioners, namely the waste management departments at local and district level, are expected
to actively and regularly collect data, assess the disposal sites in their areas, according to IPCC
data, and start reporting the data needed for the inventory. This group of participants are expected
26Information Matters Ghana: Waste Workshop Documentation
to share the information and knowledge they have gained with other members of the waste and
municipal service departments in their organisation.
Furthermore, there was significant interest on the part of practitioners in understanding mitigation
pathways and using climate impact criteria for identifying priority technical options and measures
in the sector. Further training, capacity building or dissemination of information is needed on
mitigation options and how to assess them in the waste sector.
It is recommended that communication channels between the working groups compiling the GHG
inventory and local municipalities be reviewed and strengthened, building on existing
communication channels through regional authorities. Discussions during the training showed an
eagerness on both sides to share data and information, although there seem to be bottlenecks in
communication between the different institutions involved.
It is crucial that regional authorities responsible for data management and aggregation and
communication between national and local levels of government are informed about data needs
and that they receive information on the contents of the training. Ideally, meetings should be held
in person with the representatives of regional authorities to actively engage them and facilitate
data flows.
Last but not least, at the national level, the EPA is encouraged to enhance the quality of GHG
reporting by streamlining data collection, conducting a review of the activity database and the
inventory as a whole and identifying opportunities for enhancement. Best practices were shared
during the training for activity data sourcing and also for gap filling and points for quality checks.
If outsourcing the review is not possible, then the EPA could conduct an internal review, using the
training manual and the Good Practice Study on GHG Inventories for the Waste Sector in Non-
Annex I Countries.
27Information Matters Ghana: Waste Workshop Documentation
5. Annexes
Annex 1: Workshop agenda
Training on data collection and management to improve GHG
inventory compilation in the waste sector
Venue: Capital View Hotel, Koforidua, date: 14th – 15th February
The training aims to improve Ghana’s climate data management system to ensure enhanced data
gathering and to improve the quality of reporting in the waste sector for Ghana’s GHG inventory.
The training will give insight to the work and role of all stakeholders involved in data collection,
data management and the compilation of the inventory.
Agenda
TIME ACTIVITY RESPONSIBLE
Day 1
8:30 – 9:00 Registration GIZ
9:00 – 9:15 Opening Remarks and Introduction of Participants EPA/ GIZ/ All
Information Matters
Setting the Scene:
9:15 – 9:30 (IM),
IM Global Project
Verena Schauss
Levelling-off on Level of Knowledge/Experience; Resources and
9:30 – 9:45 Expectations Check Waste Advisory
Program and methodology of the workshop Group (RWA)
Introduction:
UNFCCC reporting requirements, GHG mitigation
9:45 – 10:15 RWA
goals: NDC formulation and implementation related to
waste management
10:15 – 10:30 Coffee break
Overview about 2006 IPCC Guidelines on waste:
Solid waste disposal
Biological treatment of solid waste
Incineration and open burning
10:30 – 11:30 Waste water treatment and discharge RWA
Focus will be on practical examples and good practices
as highlighted in the Good Practice Guideline from the
countries analysed involving participants in sharing
Ghana’s experience on each issue.
28Information Matters Ghana: Waste Workshop Documentation
TIME ACTIVITY RESPONSIBLE
Day 1
Ghana’s current GHG inventory on waste:
Current figures / emissions, time series and
trends for GHG emissions from waste EPA,
11:30 – 12.30 Strengths and gaps in data collection and Joy Ankomah Hesse
management
Discussion
12:30 – 13:30 Lunch Break
Exercise 1: Identifying key categories, scope of
inventory and issues with quality of the data based RWA and all
13:30 – 14:15
on a 3 scenarios mass balance participants
14:15 – 14:30 Presentation of results All participants
Waste Management data (Data Needs – what data,
from where and why? Including group exercises)
Mass balance
Waste data collection – what data, from where
14:30 – 15:00 and why? RWA
Service chain vs value chain
Waste composition
Waste data management
15:00 – 15:15 Coffee break
Exercise 2. Classification of SW disposal sites All participants,
15:15 –16:00
facilitated by RWA
Exercise 3. Data Needs – what data, from where
and why? Incorporating group exercises
Data collection practical exercise using an urban
scenario presenting waste composition, All participants,
16:00 – 17:15 population, and process flow chart to extrapolate facilitated by RWA
required information
Presentation of results in the plenum
TIME ACTIVITY RESPONSIBLE
Day 2
8:30 – 9:00 Presentation of results All participants
9:00 – 9:15 Recap of Day 1 RWA, GIZ
IPCC waste model:
Introduction
9:15 – 9:45 Tiers RWA
Calculation methods
29You can also read