EU Greenhouse Gas Emission Budget: Implications for EU Climate Policies - Nils Meyer-Ohlendorf Philipp Voß Eike Velten Benjamin Görlach - Ecologic ...
←
→
Page content transcription
If your browser does not render page correctly, please read the page content below
EU Greenhouse Gas Emission Budget: Implications for
EU Climate Policies

Nils Meyer-Ohlendorf

Philipp Voß

Eike Velten

Benjamin Görlach

12 Januar 2018
What does 2050 mean for 2030?                                                                                  2

Contact
Nils Meyer-Ohlendorf
Ecologic Institut
Pfalzburger Straße 43/44
10717 Berlin
E-Mail: nils.meyer-ohlendorf@ecologic.eu

Proposed citation
Meyer-Ohlendorf, Nils; Voß, Philipp; Velten, Eike; Görlach, Benjamin: EU Greenhouse Gas Emission Budget:
Implications for EU Climate Policies (2018)

About the Ecologic Institute

The Ecologic Institute is a private not-for-profit think tank for applied environmental research, policy analysis
and consultancy with offices in Berlin, Brussels and Washington DC. An independent, nonpartisan body, the
Ecologic Institute is dedicated to bringing fresh ideas to environmental policies and sustainable development.
The Ecologic Institute's work programme focuses on obtaining practical results. It covers the entire spectrum
of environmental issues, including the integration of environmental concerns into other policy fields. Founded
in 1995, the Ecologic Institute is a partner in the network of Institutes for European Environmental Policy. The
Ecologic Institute acts in the public interest.

About the funder

The German Ministry for Environment, Nature Conservation, Building and Nuclear Safety funded this report.
The Ecologic Institute is appreciative of this support. Opinions expressed in this report represent the views of
the author and do not necessarily represent the official position or policies of the German Ministry for Envi-
ronment, Nature Conservation, Building and Nuclear Safety. The responsibility for the content of this publica-
tion lies solely with the authors.
What does 2050 mean for 2030?                                                                                3

Key messages
Estimates of the EU’s greenhouse gas emission budgets for the rest of the century vary considerably but have
one thing in common: The EU’s emission budget is very small and shrinking rapidly. If the EU’s emission budg-
ets were based only on least-costs considerations, it would range between meagre 50 Gt (in 1.5°scenarios) or
90 Gt (in 2°C scenarios) for the period 2020 and 2100. With current annual emissions of about 4 Gt, the EU
would have used up its 1.5°C budget by about 2032. In 2° scenarios, the EU budget could be exhausted by
around 2042. If, instead, the budget were distributed purely on the basis of equity considerations, the EU
emission budget would be much smaller. If, for example, the EU’s emission budgets were based on expected
EU’s share in the global population in 2050, the budget for the period 2021 and 2100 would be 6.9 Gt in 2°C
scenarios; the EU would have already exceeded its 1.5°C budget by 10.3Gt in 2020. It is noteworthy that the
Paris Agreement (PA) requires emission reductions based on equity but does not refer to least cost considera-
tions.

To have a reasonable chance to stay within the 1.5°C scenario emission budget, the EU should reduce its
greenhouse gas emissions by 71% by 2030 and at least 95% by 2050 (compared to 1990) – if the emission
budget is calculated based on least cost considerations. Reductions of this scale would require the EU to re-
duce emissions up to 2030 at an annual rate of 293 Mt and between 2031 and 2050 at an annual rate of 69
Mt. To stay within emission budgets that are based on the EU’s share in the global population in 2050, the
complete decarbonisation of the EU economy as soon as 2023 would be necessary (2°C scenarios). In either
case, the current EU 2030 target of reductions of 40% (compared to 1990) is clearly insufficient. It undermines
the long term reduction efforts of the EU.
What does 2050 mean for 2030?                                                                                   4

Executive Summary
Around 400 ppm – this was the atmospheric greenhouse gas (GHG) concentration measured in March 2017. It
is the highest GHG concentration in the atmosphere in at least the last 800.000 years. GHG concentrations
must remain below 430 ppm CO2eq to have a 50% chance of keeping temperature increases below 1.5 °C by
2100. For a 66% likelihood of keeping temperature increases below 2 °C, concentrations should not rise above
450 ppm. In other words, GHG concentrations can only increase by an additional 30 ppm until 2100 to retain a
50% chance of keeping temperature below 1.5°C. Concentration may only grow by an additional 50 ppm to
have a 66% chance of staying below 2°C. Staying below these atmospheric GHG concentrations requires that
only a relatively small amount of GHG is emitted between now and 2100. Current estimates range between
680 Gt CO2eq for 1.5 °C (>50% probability) and 1440 Gt CO2eq for 2°C (>66% probability) – for the period
between 2010 and 2100.

With global greenhouse gas emissions (incl. LULUCF) of about 52 Gt in 2016, these emission budgets are
shrinking rapidly. To stay within the budgets and to avoid the effects of uncontrolled global warming on hu-
man economies and societies, emissions have to decrease immediately and much more drastically. That
means that even with a full implementation of all Nationally Determined Contributions (NDCs), emissions
would well exceed the remaining emission budget for a 2°C scenario, let alone 1.5°C scenarios. Since it is diffi-
cult to conceive of such drastic emission reductions, most 2°C or 1.5°C scenarios rely on overshooting in aver-
age temperature and the active and permanent removal and storage of CO2 from the atmosphere through
Carbon Dioxide Removal technologies (CDR) – so-called negative emissions. Yet this is highly problematic and
ultimately irresponsible: currently, no CDR technology is a safe, realistic, technologically and economically
feasible option to remove very large quantities of CO2 from the atmosphere. Future technological innovation
could change this, but it is an extremely risky bet whether the necessary technological changes will materi-
alise within the required time spans.

While estimates of global emission budgets are largely based on science, the distribution of these budgets
among countries is a political decision. This decision typically involves a number of criteria, such as cost-
effectiveness (mitigation costs and potential) and equity considerations (historic emissions, per capita emis-
sions or GDP). Depending on the weighting and combination of these criteria, emissions budgets for countries
differ considerably. Effort-sharing proposals largely based on equity considerations arrive at a different distri-
bution of the remaining emission budget than proposals that are primarily based on least cost assumptions.

Depending on the criteria, the EU’s remaining emission budgets vary considerably. Even in least-cost ap-
proaches, which unfairly favour the EU and other industrial countries, the EU emission budget between 2010
and 2100 ranges between 100 Gt in 1.5°C scenarios and 140 Gt in 2°C scenarios. Crucially, the EU has already
used up 28 Gt of this budget between 2010 and 2015. Moreover, it will be reduced by an additional 22 Gt by
2020 if current emission trends continue. This leaves the EU with an emission budget of a meagre 50 Gt (in
1.5°C scenarios) or 90 Gt (in 2°C scenarios) for the for the period 2020 and 2100. Crucially, this approach
leaves the rest of the world with only about 120 Gt in 1.5°C scenarios and 840 Gt in 2°C scenarios for the pe-
riod 2020-2100, if current trends continue. In other words, pure least costs approaches would grant the EU
about 10-29 % of the remaining global emission budget, while its population in 2050 is expected to be only
5.4% of the world’s total population. With current annual emissions of about 4 Gt, the EU would have used up
What does 2050 mean for 2030?                                                                                 5

its 1.5°C budget by about 2032. In 2°C scenarios, the EU budget could be exhausted by around 2042. Any ton
of GHG emissions would then have to be compensated. Crucially, equity approaches require the EU to re-
duce emissions drastically more than least costs approaches, requiring zero emissions as soon as 2023 – if
the EU’s emission budget is based on 2050 population shares. It is noteworthy that the Paris Agreement
requires emission reductions based on equity but does not refer to least cost considerations (Articles 2 and
4.1).

Against this background, the EU should reduce its GHG emissions by around roughly 71% by 2030 and at least
95% by 2050 (compared to 1990) if the emission budget is based on least cost considerations (1.5°C scenario).
If, instead, the global emission budget is distributed on the basis of equity, EU reductions would have to be
even higher. In either case, the current EU 2030 target of reductions of 40% (compared to 1990) is insuffi-
cient and would undermine the long term efforts of the EU. Reductions of roughly 71% by 2030 and 95% by
2050 would require the EU to reduce emissions at an annual rate of 292 Mt between 2021-2030 and of 69 Mt
between 2031-2050.

As its contribution to these reductions, the sectors under the Emission Trading Scheme (ETS) would have to
reduce their emissions by roughly 81% by 2030 and 100% by 2050 compared to 2005 – if the proportional
distribution between ETS and non-ETS continues that the Low Carbon Economy Roadmap and the European
Council adopted. This would result – as one possible option – in a linear reduction factor of 6.25% or an an-
nual reduction of 137 Mt CO2eq from 2021 to 2030. From 2031 to 2050, the linear reduction factor would be
1% (annual reduction of 22 Mt CO2eq). The non-ETS sector would have to reduce emissions by around 44% by
2030 and of 90% by 2050. If reduction efforts are equally distributed between the ETS and non-ETS sectors,
the ETS sectors would have to reduce their GHG emissions by at least 60% by 2030 and by 95% by 2050 (com-
pared to 2005). This entails that the linear reduction factor for the period of 2021 to 2030 would increase
from 2.2% to 4%; from 2031 to 2050 the linear reduction factor would amount to 1.85%. The non-ETS sector
would reduce emissions by around 60% by 2030 and of 94% by 2050. Steeper reductions between 2021 and
2030 are sensible as they help to meet long term targets and avoid to lock-in carbon intensive investments.

In light of these required reductions, the level of ambition of the ETS reform and reform of the Effort Sharing
Decision (ESD) are inadequate. The revised ETS could amount in accumulated emissions of up to 15.5 Gt in
2030 and the reformed ESD (Climate Action Regulation (CAR)) would amount in accumulated emissions of
23.4 Gt. With no flexibilities, accumulated emissions under the CAR would amount to 22.5Gt.

The EU’s permissible emission budget could increase as CO2 removal technologies mature and are applied.
But at this point in time there are no removal technologies that are safe, sustainable, affordable and socially
acceptable: And it is far from clear that such technologies can be developed in the remaining time. In optimis-
tic scenarios the potential cumulated removals from LULUCF would amount to roughly 11.7 Gt CO 2eq from
2010 to 2050, which is way short of the needed removal of the 27 to 36 Gt CO2eq which would be required if
the EU aims to stay within a 100Gt budget and if it were to implement its 2030 targets of 40% and the 2050
aspiration of 80-95%. With the important exception of negative emissions from restoring degraded forests,
the EU has no viable option to remove larger amounts of CO2 from the atmosphere.

What does 2050 mean for 2030?                                                                                                                                         6

Content

1   Introduction ...................................................................................................................................................7

2   Implementing the Paris Agreement – which long-term targets and emission budgets for the world? ............9

    2.1       Global emission budgets and trajectories associated with 2°C and 1.5°C .............................................. 10
    2.2       Negative emissions and overshooting ..................................................................................................... 13

    2.3       Implication for global emissions until 2030 ............................................................................................. 15

3   EU emission budgets, trajectories and long-term targets ............................................................................. 16

    3.1       What are the necessary reductions for the EU? ...................................................................................... 17
    3.2       What is the EU’s remaining emission budget for rest of the century?.................................................... 19

    3.3       Mind the gap (1): Has the EU adopted the necessary reduction targets? .............................................. 20

    3.4       Mind the Gap (2): Are ETS and non ETS emission budgets compatible with EU targets and overall
              EU emission budgets?.............................................................................................................................. 21

    3.4.1 ETS and non ETS emission budgets until 2030: Compatible with EU 2030 targets and overall EU
          emission budgets? ................................................................................................................................... 22

    3.4.2 ETS and non ETS emission budgets until 2050: Compatible with EU 2050 aspiration and overall
          EU emission budgets?.............................................................................................................................. 23

    3.5       How to close the gap: Which EU reduction targets, trajectories and budgets? ...................................... 24

4   2030 EU policy architecture – fit for 2050? ................................................................................................... 27
    4.1       EU Emissions Trading System: What are the necessary reductions until 2050? ..................................... 29

    4.2       Non-ETS sectors: What are the necessary emission reductions for 2050? ............................................. 32

    4.3       Required negative emissions ................................................................................................................... 34

    4.3.1 LULUCF..................................................................................................................................................... 35

    4.3.2 Bioenergy-CCS and Direct Air Capture..................................................................................................... 36

5   Annexes........................................................................................................................................................ 37

    5.1       Annex 1: Required reductions in percentage points for 2050 and 2100 (IPCC AR 5) .............................. 37

    5.2       Annex 2: Underlying calculations for Section 3.4: ................................................................................... 37

    5.2.1 Calculating emissions in the ETS sector ................................................................................................... 37

    5.2.2 Calculating the flexibility of different starting years in the non-ETS sector ............................................ 38

6   Literature ..................................................................................................................................................... 40
What does 2050 mean for 2030? 7
1 Introduction
In 1850, the concentration of greenhouse gases (GHG) in the atmosphere was at about 280 parts per million
(ppm). Since then, atmospheric GHG concentration has increased drastically, exceeding 400 ppm in 2016. In
April 2017, GHG concentration reached a record-high 410 ppm. 400 ppm already marked the highest atmos-
pheric GHG concentration that the world has seen in the last 800.000 years.1 Between 1850 and 1950, GHG
concentrations increased only by 40 ppm, while the increase was a staggering 180 ppm between 1950 and
2016. Emissions from human activities are the main cause of this increase.2
Specific GHG concentrations entail certain global warming potentials. According to the IPCC’s 5th Assessment
Report of 2014, mitigation scenarios in which average global temperature remain below 1.5°C by 2100 with a
50% chance assume GHG concentrations of below 430 ppm CO2eq in 2100, whereas scenarios in which tem-
perature increase stay below 2°C with a 66% probability are characterised by concentrations of about 450
ppm CO2eq.3 There is universal agreement, most recently expressed in the Paris Agreement that the global
average temperature should stay well below 2°C. That way, the worst effect of global warming on human
societies can hopefully be avoided, which include increased sea level rise, increased frequency and intensity
of droughts, floods and other extreme weather events, resulting in decreased food production, threatening
the livelihoods of millions, and adding to already existing migratory pressures.
In other words, GHG concentrations can only increase by additional 30 ppm until 2100 to have a 50% likeli-
hood of keeping temperatures below 1.5°C. GHG concentration can only grow by an additional 50 ppm to
have a 66 % chance of staying below 2°C. GHG concentrations in excess of this value decrease the probability
of keeping temperature increases well below 2°C. With higher concentrations, it is still possible that the tem-
perature increase might remain below 2°C, but it becomes less and less likely. It should be stressed that these
IPCC findings date from 2014: New research by the IPCC is under way and due to be published in late 2018.
With the entry into force of the Paris Agreement (PA), 195 countries obliged themselves to hold the increase
of global average temperatures well below 2°C and to pursue efforts to hold it below 1.5°C.4 These obligations
are legally binding, but there is no political agreement whether the PA also commits Parties, collectively, to
stay below a specific GHG concentration in the atmosphere, despite the fact that science helps to translate
the temperature goals of the PA into GHG concentrations targets (of 430 or 450 ppm, respectively, for the
1.5° (50% chance) and 2°C targets (66% chance). The PA also obliges Parties to aim for peaking emissions as
soon as possible and to pursue climate-neutrality in the second half of this century. With its entry into force
1
IPCC (2014): Climate Change 2014: Synthesis Report. Contribution of Working Groups I, II and III to the Fifth Assessment Report of the Inter-
governmental Panel on Climate Change
2
IPCC (2014): Climate Change 2014: Synthesis Report. Contribution of Working Groups I, II and III to the Fifth Assessment Report of the Inter-
governmental Panel on Climate Change
3
IPCC (2014): Climate Change 2014: Synthesis Report. Contribution of Working Groups I, II and III to the Fifth Assessment Report of the Inter-
governmental Panel on Climate Change
4
As of May 2017, 147 countries have ratified, 195 countries have signed the Agreement, http://unfccc.int/paris_agreement/items/9444.phpWhat does 2050 mean for 2030? 8 on November 4th 2017, the PA obliges the EU – and all other Parties – to ensure that its policies and targets make an adequate contribution to achieving these objectives. In EU climate policy, the single most important instruments to ensure that the EU meets its obligations are the EU Emission Trading Directive (ETS) and the successor of the Effort Sharing Decision (ESD). The EU is about to finalize reforms of these instruments. As an additional key instrument, the new Governance Regulation for the Energy Union (GR) has potentially far-reaching implications for the implementation of the PA. This regula- tion is currently being negotiated. In light of these reforms, but also against the background of the up-coming facilitative dialogue under the PA, the IPCC report on the implantation of the 1,5°C target under the PA, the adoption of Long Term Low Emission Strategies and up-dating of the EU’s nationally determined contribution in 2020, it is necessary that the EU takes a fresh look at its policies. In light of these political processes, the EU has to answer the question whether its laws and policies are capable of making an adequate contribution to the implementation of the PA – or not. Against this backdrop, this paper discusses and quantifies the EU’s remaining emission budget for the re- mainder of the century. It defines the EU’s emission budget as the EU’s share of remaining global emissions; not as the quantity of emissions that the ETS and the ESD allow Member States to emit. The paper explores necessary EU reductions until 2030, 2050 and beyond – as the EU’s meaningful contribution to global efforts to keep temperature increases well below 2°C. The paper also discusses the implications of the required EU reductions on its climate policies and laws and in particular for the EU ETS and the Climate Action Regulation (CAR)5, the successor to the Effort Sharing Decision. The paper does not analyse technical details of specific EU climate instruments. 5 In late December 2017, trilogue between Council, Parliemant and Commission agreed on the Regulation on binding annual greenhouse gas emission reductions by Member States from 2021 to 2030 contributing to climate action to meet commitments under the Paris Agreement and amending Regulation (EU) No 525/2013.
What does 2050 mean for 2030? 9
2 Implementing the Paris Agreement – which long-term targets
and emission budgets for the world?
High and rising concentrations of GHGs in the atmosphere lead to global warming.6 These GHG concentrations
are the result of the cumulative GHG emissions to the atmosphere. To protect the global climate and prevent
dangerous and irreversible anthropogenic interference with it, cumulative emissions need to remain within
safe limits. This effectively sets an emission budget that the world must not exceed.
To help identify the emission budget that is available for the EU for the rest of century and the corresponding
reduction targets and trajectories, this section discusses:
The remaining emission budgets for the world and the resulting global reduction targets and trajecto-
ries – associated with 2°C and 1.5°C.
The potential of permanent removal of carbon from the atmosphere, i.e. whether it is possible to
generate so-called negative emissions at a scale that would effectively allow increasing the carbon
budget significantly.
Implications of the size of the remaining budgets for global emissions until 2030.
Emission budgets, reduction targets and trajectories
The concentration of GHGs in the atmosphere is the direct result of the total, cumulative emissions
over time. Emission budgets reflect this idea: they show the amount of GHG that can be emitted dur-
ing the budget period without exceeding a certain GHG concentration. Compared to a reduction tar-
get for a given year, budgets have the advantage that they take account of total admissible emissions.
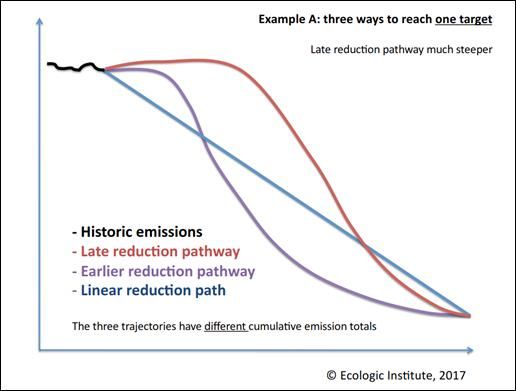
Without a clearly defined trajectory, reductions targets can allow very different amounts of emis-
sions, as shown in the following graphics:
In this (stylised) example, the cumulative emissions are measured by the integer, i.e. the shaded area.
While all scenarios lead to the same reduction target at the end of the period, the cumulative emis-
sions under the three scenarios differ markedly.
Regardless of this weakness, reduction targets and reduction trajectories must complement emission
6
According to the IPCC today’s unprecedented levels of GHG concentrations are “extremely likely to have been the dominant cause of the
observed warming since the mid-20th century”. IPCC (2014): Climate Change 2014: Synthesis Report. Contribution of Working Groups I, II and III
to the Fifth Assessment Report of the Intergovernmental Panel on Climate ChangeWhat does 2050 mean for 2030? 10
budgets:
Realistic reduction pathways crucial: It is possible to reach a given target by emitting large
amounts of GHG at the beginning of the budget period and to reduce sharply at the end of
the period. Yet this approach makes it less likely that a given country will stay within its
budget. Targets and trajectories give a realistic indication how to stay within a given budget.
Targets and trajectories part of EU law and policies: Unlike explicit emission budgets for the
EU and its Member States, targets and trajectories are already part of EU law and policies.
The political discourse uses to this terminology and the actors are used to it.
When to go negative: In real terms, targets and trajectories show when and to what extent
countries have to start generating negative emissions – to stay within the budget.
Emission budget set by EU law7: The ETS and the ESD set emission budgets for sectors cov-
ered and Member States. Both instruments are currently being reformed but are set to con-
tinue its budget approach. The emission budgets permitted by these instruments has to be
compatible with the EU reduction target as well as the overall EU emission budget, defined
by the EUs share on global emissions. In other words, the emission budget defined by EU law
may not allow more emissions than determined by reduction targets and the EUs overall
budget (see below, section 3.3.).
2.1 Global emission budgets and trajectories associated with 2°C and 1.5°C
The size of the world’s remaining emission budget for the 21st century depends on a range of criteria. Depend-
ing on how criteria are chosen and combined, emission budgets vary considerably. Criteria include:
The maximum allowable temperature increase, i.e. 2°C or 1.5°C, where a higher target corresponds
to a larger emission budget;
The probability of meeting the maximum temperature increase that is considered desirable or neces-
sary. A higher probability reduces the remaining emission budget, while low probabilities increase it.
The capacities to generate negative emissions, i.e. to remove CO2 from the atmosphere and to store
it safely and permanently.8
In its 2017 Emission Gap Report, United Nation Environment Programme (UNEP) presents the annual and
total global carbon budgets that would deliver a 50 - 66% probability of staying below 1.5°C and a 66% prob-
7
For the purpose of this paper, however, the EU’s emission budget means the EU’s share of remaining global emissions; not the quantity of
emissions that the ETS and the ESD (and their successors) allow Member States to emit.
8
To a large extent, the size of the remaining budget also depends on tolerating temporary overshooting of average temperatures and on the
capacity of natural processes to absorb C02 from the atmosphere but these scientific questions are not part of this paper.What does 2050 mean for 2030? 11
ability of limiting temperature increases below 2°C.9 Accordingly, the remaining carbon budget for the period
between 2011 and 2100 to stay below 1.5°C with a 50 - 66% chance is less than 600 Gt, equivalent to around
16 years of the current 36 Gt of global carbon emissions. For a 66% chance of keeping temperature increases
below 2°C, the remaining carbon budget from 2011 to 2100 would add up to 1000 Gt. This 1000 Gt equals
roughly 28 years at current annual emissions. With annual CO2 emissions of about 36 Gt, these budgets
shrank by 180 Gt between 2011 and 2016, leaving a carbon budget of 420 Gt (1.5°C with a 50 - 66% chance)
and 820 Gt (2°C with a 66% chance) for the period 2017-2100. With current CO2 emissions, these budgets
would be exhausted in 12 years time or 23 years time respectively. It is important to note that these figures
represent a median; scenarios for remaining budgets vary significantly.10 It is also noteworthy that the 2016
UNEP gap report estimated a much smaller carbon budget of 217 Gt (1,5°C with a 50% chance) and 553 Gt
(2°C with a 66% chance) for the period 2015-2100.
Working with similar probabilities, the IPCC sets out a range of different potential carbon budgets for the
period between 1870 and 2100. 11 For a 66% chance of keeping temperatures below 2°C, the world has a total
emission budget of about 2900 Gt CO2 (the figure circled in red). To have a 50 - 66% chance of staying below
1.5°C, total emissions should be no higher than 2250 Gt CO2 (circled in green). In both cases, most of the
budget has already been used up – for a 66% chance of staying below 1.5°C, for example, there is (as of 2011)
only around 400 Gt CO2 left (the figure circled in blue). For a 66 % chance of staying below 2°C, the remaining
budget for the remainder of the century is only a median 1000 Gt (the figure circled in brown).12
9
UNEP (2017): The Emissions Gap Report 2017. United Nations Environment Programme (UNEP), Nairobi
10
According to Mercator Research Institute on Global Commons and Climate Change, for example, reaching the 2°C target with a high probabil-
ity allows for total global CO2 emissions between 2017 and 2100 of a maximum of about 940 GT of CO2. Medium estimates allow for about 760
Gt, while lower scenarios permit for only about 390 Gt. According to another recent research paper, the remaining budget for a 66% probability
of limiting warming to 1.5C in 2100 at 880 – 915bn tonnes of CO2 (from the start of 2015) - Richard Millar et al: Emission budgets and pathways
consistent with limiting warming to 1.5 °C, Nature Geoscience (2017), and Richard Millar: Why the 1.5C warming limit is not yet a geophysical
impossibility https://www.carbonbrief.org/guest-post-why-the-one-point-five-warming-limit-is-not-yet-a-geophysical-impossibility.
11
IPCC (2014): Climate Change 2014: Synthesis Report. Contribution of Working Groups I, II and III to the Fifth Assessment Report of the Inter-
governmental Panel on Climate Change
12
Annex 1 contains required reductions in percentage points for 2050 and 2100 as estimated by IPCC AR 5.What does 2050 mean for 2030? 12
The reports by UNEP and the IPCC reflect the 2°C target adopted at COP 16 in 2010 (Cancun). They do not
take account of the more ambitious targets of “well below 2°C” established by the PA in 2015. To take
account of the new framework of the PA, additional research by the IPCC is under way and due to be pub-
lished in late 2018. But already today there is analysis of scenarios that that keep temperature increases
well below 2°C or even below 1,5°C. According to Anderson et al. (2017) global carbon budgets compati-
ble with the objectives of the PA range between 490 to 640 Gt CO2eq for the period 2017 – 2100.13 Other
studies carried out by Climate Analytics work inter alia with a 90-100% probability, which is an important
expansion of UNEP’s and IPCC’s report because these reports are based on considerably lower (or dan-
gerous) probabilities of only 66% or a mere 50%. According to this analysis, a very likely chance of meet-
ing the 2°C target would require that GHG emissions are net zero by 2065 and negative thereafter. For a
very likely chance of meeting the 2°C target, global CO2 emissions would need to be zero as early as 2045,
and be negative thereafter.14
Climate Analytics use among other a so-called Paris Agreement 1.5°C Scenario and a so-called Cancun
Agreements 2°C Scenario.15 In the Paris Agreement 1.5°C Scenario, the global carbon budget for the pe-
riod 2010-2100 is 450 GtCO2. In the Cancun Agreements 2°C Scenario, it is 950 GtCO2. With a CO2 share of
about 66% in overall GHG emissions, these carbon budgets result in global GHG budgets of about 680 Gt
for 1.5°C and 1440 Gt for 2°C. We use these Paris Agreement 1.5°C Scenario and the Cancun Agreements
2°C Scenario as the basis for our calculations because they do not only focus on global budgets, but also
provide numbers on EU least-cost emission budgets.
13
Anderson et al. (2017): Natural gas and climate change
http://www.foeeurope.org/sites/default/files/extractive_industries/2017/natural_gas_and_climate_change_anderson_broderick_october2017.
pdf
14
Niklas Höhne, Michel den Elzen, Annemiek Admiraal: Analysis beyond IPCC AR5: Net Phase Out of Global and Regional Greenhouse Gas Emis-
sions and Reduction Implications for 2030 and 2050 http://www.pbl.nl/sites/default/files/cms/publicaties/pbl-215-act-factsheet-net-phase-out-
of-global-and-regional-ghg-emissions-and-reduction-implications-for-2030-and-2050.pdf
15
Both scenarios were developed by the Institute of Applied Systems Analysis (IIASA), using their Integrated Assessment Model (IAM) MESSAGE.
MESAGE, like other IAMs, provides scenarios consistent with limiting global warming below 2°C and 1.5°C by calculating the optimal emission
pathway over time. For both scenarios, negative CO2 emissions play a crucial role in the second half of the 21st century. For more information on
the carbon budgets see: Climate Analytics (2016) What does the Paris Climate Agreement mean for Finland and the European Union?
http://climateanalytics.org/files/ca_paris_agreement_finland_eu.pdf. For more information on the MESSAGE model see: Rogelj et al. (2015)
Energy system transformations for limiting end-of-century warming to below 1.5°C , or
http://www.iiasa.ac.at/web/home/research/modelsData/MESSAGE/MESSAGE.en.htmlWhat does 2050 mean for 2030? 13
2.2 Negative emissions and overshooting
Most 2°C and all 1.5°C scenarios involve negative emissions in the second half of the century.16 This means
that these scenarios assume the active and permanent removal and storage of CO2 from the atmosphere
through Carbon Dioxide Removal technologies (CDR). Furthermore, mitigation scenarios reaching about 450
ppm CO2eq in 2100 typically involve a temporary overshoot of atmospheric concentrations, as do many sce-
narios reaching about 500 ppm to about 550 ppm CO2eq in 2100.17
There are a number of different CDR technologies, but all of them face a number of significant challenges.
Technological innovation could help to address these in the future, but at this point in time no CDR technol-
ogy is a realistic option to remove very large quantities of CO2 from the atmosphere without significant envi-
ronmental risks and at economically viable costs:
Volume of required removals: Many 1.5°C or 2°C scenarios assume negative emissions as high as
1,020 Gt CO2, while the median (2010-2100) removal is 810 GtCO2.18 For a sense of proportion: in
2015, the global annual crude oil production came to 4 Gt of oil equivalent. Just in terms of weight,
810 Gt of CO2 would be as heavy as the oil that would be produced over the next more than 200
years (ceteris paribus). This gives a sense of the scale of infrastructure that would be necessary to
handle – and to safely store such amounts of CO2. Even more optimistic scenarios that are based on
16
UNEP (2017): The Emissions Gap Report 2017. United Nations Environment Programme (UNEP), Nairobi
17
IPCC (2014): Climate Change 2014: Synthesis Report. Contribution of Working Groups I, II and III to the Fifth Assessment Report of the Inter-
governmental Panel on Climate Change
18
UNEP (2017): The Emissions Gap Report 2017. United Nations Environment Programme (UNEP), NairobiWhat does 2050 mean for 2030? 14
lower negative emissions still require removals of about 480 Gt CO2,19 equivalent to over 13 years’
worth of current annual emissions. Existing technologies and infrastructure are nowhere near capa-
ble of handling negative emission of this magnitude.
Limited storage capacities: CDRs depend on accessible and economically affordable storage sites for
permanent and safe storage of CO2. Local communities have to accept storage sites. This limits stor-
age capacity further.
More specifcally, each CDR technology has to overcome its specific challgenges:
Bioenergy with carbon capture and storage (BECCS): BECCS technologies are CDR technologies that
have gained some attention. These technologies burn biomass or biogas in stationary installations
that can be equipped with CCS. Estimates show that by 2050, BECCS technologies could sequester 10
billion metric tons of industrial CO2 emissions annually worldwide.20 But to achieve removals of this
scale, BECCS would have to take up vast amounts of land. There is also considerable difference in cost
estimates which vary from around 60 to 250 USD / tCO2.21
Direct Air Capture: Direct Air Capture (DAC) is another option to remove CO2 from the atmosphere,
but currently this technology is expensive and energy intensive.22 Estimates range from $400 to
$1,000 per tonne of CO2.23 Capturing 12 billion tonnes of CO2 equivalent per year or third of annual
global emissions would require 156 exajoules of energy, which is more than a quarter of total annual
global energy demand.24 In short, DAC is still a premature technology but it is possible that innovation
will make DAC an important tool to help keep temperature increases well below 2°C
Enhanced weathering: Enhanced weathering, another CDR technology, uses the dissolution of natu-
ral or artificially created minerals to remove CO2 from the atmosphere. According to estimates, en-
hanced weathering could sequester up to 3.7 Gt of CO2eeq per year globally, but at very high costs.25
In light of the difficulties of today’s CDR technologies, another option is gaining momentum: restoring de-
graded forests. According to some estimates, the restoration of degraded forests could remove up to 330 Gt
19
Sivan Kartha, Kate Dooley (2016): The risks of relying on tomorrow’s ‘negative emissions’ to guide today’s mitigation action, https://www.sei-
international.org/mediamanager/documents/Publications/Climate/SEI-WP-2016-08-Negative-emissions.pdf
20
Sivan Kartha, Kate Dooley (2016): The risks of relying on tomorrow’s ‘negative emissions’ to guide today’s mitigation action, https://www.sei-
international.org/mediamanager/documents/Publications/Climate/SEI-WP-2016-08-Negative-emissions.pdf
http://gcep.stanford.edu/pdfs/rfpp/Report%20from%20GCEP%20Workshop%20on%20Energy%20Supply%20with%20Negative%20Emissions.pd
f and http://news.stanford.edu/pr/2013/pr-reducing-carbon-dioxide-021513.html
21
IPCC (2014): Climate Change 2014: Mitigation of Climate Change
22
Carbon Brief (2016): 10 ways negative emission could slow climate change: http://www.carbonbrief.org/explainer-10-ways-negative-
emissions-could-slow-climate-change
23
Simon, Evans (2016): Swiss company hoping to capture 1% of global CO2 emissions by 2025, https://www.carbonbrief.org/swiss-company-
hoping-capture-1-global-co2-emissions-2025
24
Smith, Pete et. al. (2016): Biophysical and economic limits to negative CO2 emissions, Nature Climate Change 6, 42–50
25
Carbon Brief (2016): 10 ways negative emission could slow climate change: http://www.carbonbrief.org/explainer-10-ways-negative-
emissions-could-slow-climate-changeWhat does 2050 mean for 2030? 15
from the atmosphere in the course of the century.26 If done right, restoring forests would not only avoid the
many problems that mar current CDR technologies, but it would also have important co-benefits for biodiver-
sity, water quality and soil protection. With its theoretical removal capacity of up to 330 Gt, however, restor-
ing degraded forests alone will probably not be able to keep GHG concentrations below 450 ppm over the
course of the century.
2.3 Implication for global emissions until 2030
At current annual emission levels, the global CO2 budget for limiting warming to below 2°C with at least 66%
probability will be almost entirely depleted by 2030. The budgets that would preserve at least a 50 - 66%
change of limiting warming to below 1.5°C would already be well exceeded by then.27 In its 2017 Emissions
Gap Report, UNEP analyzes the gap between 2030 emission levels and those consistent with least-cost path-
ways to the 2°C and 1.5°C goals respectively. The report highlights that even with full implementation of both
unconditional and conditional NDCs for 2030; the gap to staying below an temperature increase of 2°C is 11 –
13.5 Gt CO2eq. For the 1.5°C, it is 16 – 19 Gt CO2eq. The global scenarios assessed by UNEP show further, that
if least-cost trajectories are followed, greenhouse gas emissions should not exceed 42 Gt CO2eq in 2030, if a
chance of at least 66% is to be attained for reaching the 2°C target. Earlier UNEP reports argued that 2030
global emissions should not exceed 37 Gt CO2eq - for a 50% chance of keeping temperature increases below
1.5°C. For securing a chance of at least 66% for keeping the global temperature rise below 1.5°C, new studies
indicate that least-cost pathways starting from 2020 indicate a much lower 2030 level of around 24 Gt CO2eq.
This would imply significantly faster and deeper reductions than previously anticipated.28
These estimates show that even with the full implementation of the NDCs by 2030, the world would signifi-
cantly exceed its CO2 budget for keeping temperature increases below 1.5°, and it would almost have ex-
hausted its all-time budget for staying below 2°C. In consequence, emissions must decline far more steeply
until 2030 than the level implied by the nationally determined contributions (NDC).29
In conclusion, the emission trajectories until 2030 determine whether it will even be possible, let alone eco-
nomically feasible, to keep concentrations at 430 to about 450 ppm CO2eq by 2100. Only immediate and more
drastic emission reductions will maintain a realistic chance to hold average temperature increases well below
2°C. Slow emission reductions in the next decade drastically increase the need for emission removals, which is
a risky bet on an uncertain development and deployment of new break-through CDR technologies (see
above).
26
Sivan Kartha, Kate Dooley (2016): The risks of relying on tomorrow’s ‘negative emissions’ to guide today’s mitigation action, https://www.sei-
international.org/mediamanager/documents/Publications/Climate/SEI-WP-2016-08-Negative-emissions.pdf
27
UNEP (2016): The Emissions Gap Report 2016. United Nations Environment Programme (UNEP), Nairobi
28
UNEP (2017): The Emissions Gap Report 2017. United Nations Environment Programme (UNEP), Nairobi
29
IPCC AR 5 also shows that emissions until 2030 have strong implications for keeping concentrations to about 450 – 500 ppm CO2eq by 2100
but note that these estimates refer to 450-500 ppm scenarios, not 430-450 ppm).What does 2050 mean for 2030? 16
3 EU emission budgets, trajectories and long-term targets
The remaining global emission budgets and the required global reductions do not answer the effort sharing
question: which countries have to reduce by which amount by when? How should the emission budgets be
distributed among countries? What is the share for the EU? There are various criteria that help inform the
distribution of the remaining emission budgets between the EU and the rest of the world. In particular, these
include cost-effectiveness (global mitigation costs) and equity considerations (historic emissions, national
capacities, per capita emissions or GDP).
Depending on the choice of criteria, or their weighting and combination, emission budgets for countries
differ considerably. Effort-sharing proposals largely based on equity considerations distribute the remaining
emission budget completely different than proposals that are primarily based least cost considerations.30
Emission budgets also differ drastically depending on whether they are intended to contribute to 1,5°C or 2°C
scenarios. The following graphic provides an overview of possible criteria and their combination:
30
For example, according to an exemplary calculation by Climate Analytics, Finland would have to reduce its emission by 130% in 2050 according
to the least-cost models; required emission reductions in Finland would be even higher in line with equity models, where Finland would have to
reduce emissions by 150% http://climateanalytics.org/files/ca_paris_agreement_finland_eu.pdfWhat does 2050 mean for 2030? 17
Global 2050 EU 2021- 2050
Approach
Goal Budget
1.5°C
excl. LULUCF
2°C
Historic responsibility
1.5°C
incl. LULUCF
2°C
1.5°C
Population 2015
2°C
Equity Population
1.5°C
Population 2050
2°C
1.5°C
Purchasing Power
o per Capita (PPP)
2°C
Capacity to mitigate
Human 1.5°C
Development
Index (HDI) 2°C
2°C
Least cost o o
1.5°C
It is important to understand, however, that none of these criteria constitute an automatism which is in-
tended or even able to determine in an objective manner the EU’s emission budget for the time until 2050
and beyond. There are no scientific criteria or no one formula for the distribution of the required reductions
among countries. Allocating of the world’s remaining emission budget among countries – in any form – is a
political decision that must be informed by science and should be based on the criteria above. This political
decision has to weigh the specific advantages and disadvantages of these criteria and should take account of
equity and least cost considerations.
3.1 What are the necessary reductions for the EU?
Since the budget distribution is an inherently political decision, it is not surprising that neither the IPCC nor
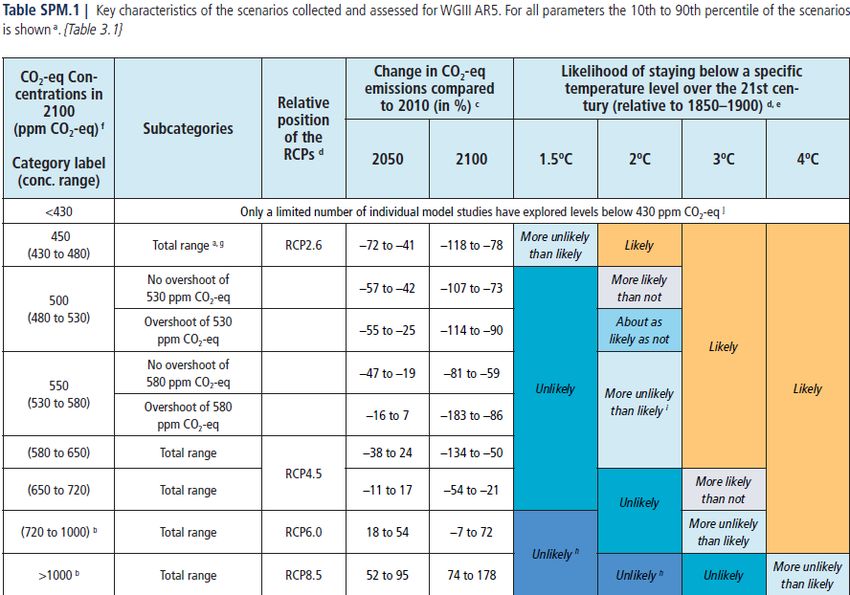
UNEP identify an emission budget for the EU (or for any other country). Yet the IPCC does present a table forWhat does 2050 mean for 2030? 18 emission reduction scenarios by OECD countries (and other country groups). Accordingly, GHG emissions from OECD countries would have to be reduced by 32% (between 23% and 40%) in 2030 in 430-550 ppm sce- narios. Emissions would need to decline by 14% in 530-650 ppm scenarios. Concerning required reductions by 2050, OECD countries would reduce their emissions by 90-100% in 2050 in 430 ppm scenarios and by 80-95% in 450 ppm scenarios: Unlike the IPCC, other analysts calculated necessary EU reductions for 2030 and 2050 for the period 2010 to 2100. Depending on the approaches, estimates yield very different results: According to estimates by the Öko Institut, the EU would have to reduce its emissions by 2050 between a staggering range of 70% (target based on grandfathering 2°C with overshooting and 66% probability) and 180% (target based on historic responsibil- ity, 1.5 °C, no overshooting, and 50% probability).31 According to Climate Analytics, the EU would need to reduce greenhouse gas emissions by about 90% until 2050 and 50% by 2030 – if least-cost approaches ap- ply.32 If equity approaches apply, the EU would have to reduce emissions by 75% by 2030 and by 160% for 31 Jakob Graichen (2016): Targets for the non-ETS sectors in 2040 and 2050: https://www.oeko.de/fileadmin/oekodoc/Targets-for-the-non-ETS- sectors-in-2040-and-2050.pdf 32 Climate analytics (2016): What does the Paris Agreement mean for Finland and the EU? http://climateanalytics.org/files/ca_paris_agreement_finland_eu.pdf
What does 2050 mean for 2030?                                                                                                            19

2050 (compared to 1990).33 Importantly, these estimates have to be interpreted carefully because of large
uncertainties, on-going research and great differences in models.34 They give, however, a solid indication of
the scale of required reductions.

3.2 What is the EU’s remaining GHG budget for rest of the century?
In least-cost approaches, the median EU carbon budget between 2010 and 2100 would be 83 Gt in the 1.5°C
scenario and 116 Gt in the 2°C scenario.35 As CO2 has a share of roughly 80% in EU overall GHG emissions, this
carbon budget results in an EU GHG budget of about 100 Gt for 1.5°C and 140 Gt for 2°C. The EU emission
budget would be drastically smaller if it were calculated on population shares in 2050 – one of the central
equity considerations – leaving the EU only a meagre 56.9 Gt in the 2°C budget. The 1.5°C EU budget based on
2050 population shares would be 39.7 Gt.

Regardless of the method chosen to split up the global budget, the EU already used up 28 Gt CO2eq between
2010 and 2015 – roughly one fourth of its emission budget for the entire century (1.5°C scenario and least-
cost considerations). Emissions from 2015-2020 are projected to amount to 22 Gt CO2eq if trends from 1990
to 2015 continue.36 This means that by 2020 the EU will have emitted 50 Gt or consumed roughly 50% of its
1.5°C least-cost GHG budget. In other words – based on the EU GHG budget – only 50 Gt CO2eq (in case of the
1.5°C scenario) would be available for the period 2020 to 2100. In case of a 2°C scenario, the EU would have
used 36% of its remaining budget before 2020, allowing the EU to emit about 90 Gt for the rest of century.
The EU 1.5°C equity budget based on 2050 population shares would already be well depleted and in the 2°C
equity budget based on 2050 population shares, less than 7 Gt CO2eq would be left. These figures must be
treated with care, but they give an indication of how small the quickly shrinking EU emission budget is.

Defining the EU emission budget is ultimately a political decision (as discussed above) but it is likely that
the emission budget will be defined on the basis of a combination of least-cost and equity considerations. A
pure least-cost approach is politically unviable because it unfairly favours the EU and other industrialised na-
tions to the detriment of the rest of the world. It would give the EU 29.4% (Paris Agreement 1.5°C scenario) or
9.7% (Cancun Agreement 2°C scenario) of the global budget from 2021.

33
  Climate analytics (2016): What does the Paris Agreement mean for Finland and the EU?
http://climateanalytics.org/files/ca_paris_agreement_finland_eu.pdf
34
  There als also other approaches for determining the EU carbon budget. Anderson et al. for example determine the non-OECD countries’ share
of the global budget by aksing for the most ambitious peak date non-OECD nations could achieve and what they could subsequently deliver in
terms of mitigation rates. By taking this approach, the non-OECD regions’ cumulative emissions range from 502 GtCO2 to 620 GtCo2, leaving
OECD countries with only 20 – 140 GtCO2 from 2017-2100. Depending on the subsequent approach of splitting up the OECD budget, the mid-
value EU carbon budget ranges from 23 to 32 Gt.To stay within these budgets, the EU would have to mitigate at an annual rate of minimum of
12%.
35
  Climate analytics (2016): What does the Paris Agreement mean for Finland and the EU?
http://climateanalytics.org/files/ca_paris_agreement_finland_eu.pdf; Climate Analytics did not estimate the EU carbon budgets based on equity
considerations.
36
     The trend over the period 1990-2015 shows an average reduction of 51 Mt CO2eq/yr.
What does 2050 mean for 2030? 20
3.3 Has the EU adopted the necessary reduction targets?
The EU has adopted a number of decisions relevant for its emission budget and the related emissions reduc-
tions until 2030, 2050 and / or the second half of the century:
Conclusions of the European Council of 2009: In 2009, the European Council adopted the aspira-
tional long-term target of 80-95% GHG emissions reduction by 2050 (compared to 1990 levels). The
European Council adopted this aspirational target six years before the PA was ratified, i.e. at a time
when the EU had not accepted the obligations to contribute to hold temperature increases well be-
low 2°C and to pursue efforts to keep temperature increases below 1.5°C.
Conclusions of the European Council of 2014: In October 2014, the European Council adopted a do-
mestic GHG reduction target of at least 40% by 2030 compared to 1990 levels.37 These conclusions
did not address the period beyond 2030.
The table below compares these decisions with necessary reductions compared to the 1990 base year:
37
European Council (2014): European Council Conclusions, 23/24 October 2014. EUCO 169/14, para. 2.1.
http://www.consilium.europa.eu/uedocs/cms_data/docs/pressdata/en/ec/145397.pdfWhat does 2050 mean for 2030? 21
2030 target: at least - 2050 aspiration: - 80
40% domestic38 to 95%39
Least-cost assumptions for a 2°C world:
IPCC AR540; 430-480ppm, OECD&EIT -42% [24-44%]
-47% [40–51%]
Knopf et al. 2013
Ökoinstitut, target based on grandfathering 2°C with
overshooting and 66 % probability -33% 63%
Ökoinstitut, target based on historic responsibility, 1,5 °C, -
no overshooting, 50 % probability -40% 180 %
Climate Analytics, least-cost approach -47 % -88 %
Climate Analytics, equity approach -75 % -164 %
Accordingly, the EU 2030 target and 2050 aspiration are not in all cases in line with the respective required
emission reductions. If the global emission budget was distributed on the basis of least-cost mitigation, the
EU’s aspiration for 2050 of reductions between 80-95% would be roughly in line with the necessary reduc-
tions (reductions of -88% in 2050). In all other approaches, however, the EU’s targets are not sufficient. The
gap between adopted targets and required reductions grows considerably if the remaining global emission
budget is distributed based on equity considerations. In this case the EU would need to achieve negative
emissions of up to 164% and 180% by 2050.
3.4 Are ETS and non ETS emission budgets compatible with EU targets and
overall EU emission budgets?
Effectively, the ETS Directive sets a budget for the emissions that it covers, while the ESD and CAR introduce a
budget for non-ETS emissions. In combination, both instruments establish an emission budget for the EU as a
whole but only until 2030 – as the CAR will only cover the period until 2030. Neither instrument sets an over-
all EU emission budget that explicitly derives from the EU’s fair share of global emissions.
38
European Council (2014): European Council Conclusions, 23/24 October 2014. EUCO 169/14, para. 2.1.
http://www.consilium.europa.eu/uedocs/cms_data/docs/pressdata/en/ec/145397.pdf
39
European Council (2009): https://www.consilium.europa.eu/uedocs/cms_data/docs/pressdata/en/ec/110889.pdf
40
IPCC AR5, Table 6.4. OECD and EIT regions: 32% (18/20% to 40%) emission reduction by 2030 compared to 2010 converts to a reduction of
42% compared to 1990 as the EU has reduced its emissions from 1990 to 2010 by 14% (EEA 2017).What does 2050 mean for 2030? 22
3.4.1 ETS and non ETS emission budgets until 2030: Compatible with EU 2030 targets and
overall EU emission budgets?
The ETS is set to reduce covered emissions by 43% in 2030 (compared to 2005). With emissions of 2338 Mt in
2005, the total ETS emission budget for the period between 2005 and 2030 is about 49.2 Gt.41 This emission
budget could be reduced to 47.7Gt if an estimated 1,5 billion allowances between 2021 and 2030 are can-
celled as determined by the revised ETS.42 The MSR and backloading regulate the timing when a specific
amount of allowances becomes available but it does not have a direct impact on the overall ETS budget for
the period until 2030.
The CAR is supposed to reduce covered emissions by 30% in 2030 (compared to 2005). With emissions of
2848 Mt in 2005, this reduction target entails an overall budget of about 22.5Gt – provided Member States
reduce their emissions along a linear reduction pathway as stipulated in the ESD (Article 3.2) and the CAR
proposal (Article 4.2). According to our calculations, this emission budget could increase by up to 927 Mt to
about 23.3 Gt because of a number of so-called flexibilities that the CAR is set to contain:
LULUCF: up to 280 mio. through LULUCF (Article 7).
ETS: up to 100 mio. through ETS exception (Article 6).
So-called safety reserve: up to 105 mio. through bonuses for lower-income states (Article 10 a).
Starting year: As proposed by the Commission, the CAR is set to use average 2016-2018 emissions as
a starting point for calculations after 2020. This starting point leads to a carbon budget of 22Gt be-
tween 2021 and 2030, which is 442 Mt higher than the budget would be if estimated 2020 emissions
were taken (estimated according to 2020 goals).
Accordingly, the ETS and the CAR provide in sum for a total EU emissions for the period 2021 to 2030 of about
38 Gt (15,5 Gt for the ETS and 22,5 Gt for the non ETS) if flexibilities are not included. With the cancellation of
1.5 billion allowances in the ETS and with the flexibilities in the CAR sector, the budget for the two sectors
combined decreases to 37.4 Gt (14 Gt for the ETS and 23.4 Gt for the non ETS). In theory, these budgets are
compatible with the overall EU budget until 2050 of 50 Gt but this leaves the EU with meagre 12 Gt (12.6
Gt, respectively) for 2031-2050. This means that far less than 1Gt per year would be available each year after
2030.
41
4784 Mt emissions in 2006-2007, a reduction of 6.5% in 2008-2012 (compared to 2005) and a linear reduction factor of 1.74% (between 2013
and 2020) and 2.2% (between 2021 and 2030)
42
In 2019, a total of 1232Mt allowances go into the MSR. (400 of these come from backloading, 625 Mt are based on an estimation from
https://ec.europa.eu/clima/policies/ets/reform_de and the remaining 207Mt. reflect 24% of the 2018 surplus allowances that exceed 833Mt).
From 2019-2023, 24% of the surplus exceeding 833Mt of the previous year go into the MSR (current Council proposal). Allowances are can-
celled from 2024 onwards if the amount of allowances in the MSR is higher than the amount of allowances distributed in the previous year
(current Council proposal). This means that the amount auctioned in the previous year sets the limit for the MSR in the current year. For our
calculations we assumed that after 2017, ETS participants in each year use exactly as many allowances as are distributed. This assumption is
critical, because it determines the amount of allowances cancelled. Through the proposed functioning of MSR and cancellation, it is generally
true that less allowances are cancelled if the ETS participants use more allowances and vice versa.You can also read