The current state of transformation around the world - International Association ...
←
→
Page content transcription
If your browser does not render page correctly, please read the page content below

HIGHER EDUCATION
IN THE DIGITAL ERA

T h e c u r r e n t s ta te o f tra n s f o rm a tion
                a r o u n d th e w o r ld
                      Trine Jensen
HIGHER EDUCATION
                  IN THE DIGITAL ERA
                   The current state of transformation
                   around the world in the digital era

                  Technological advancements bring about new
                  opportunities for improving the human condition, yet they
                  also introduce new social challenges and the risk of
                  creating divisions between those who have access to
                  potential benefits and those who do not. The preconditions
                  for leveraging the potential of technological developments
                  are very different among and within countries, which
                  implies that the rapid changes risk exacerbating rather
                  than bridging digital divides. To counter this trend, the
                  International Association of Universities (IAU) fosters
                  collaboration among higher education institutions, as IAU
                  believes that this is an essential component to bridge-
                  building, facilitating leapfrogging and capacity building
                  through mutual exchange with a common goal of
                  leveraging the potential of technological advancements for
                  good and rendering them accessible to all .

                  Author : Trine Jensen, IAU Manager, Events and Projects
                  Editing : Nicholas Poulton, IAU Information and Publication Officer
                  Graphic design : Juliette Becker, IAU Communications Manager

   This report presents the results of the Open Consultation carried out by the
   International Association of Universities (IAU) from 1 November 2018 to 1 April 2019. The
   aim of the consultation was to take stock of the current state of digital transformation
   in higher education around the world and to inform the development of a new IAU
   Policy Statement.

© Copyright, International Association of Universities (IAU), 2019, all rights reserved.
CONTENTS

04   Foreword

05   Introduction

06   Context, methodology and sample

12   Assessing the external environment of
     higher education institutions (HEIs)

18   Transformation at the institutional level

42   Perceptions of the developments

49   Conclusions in relation to the Policy
     Statement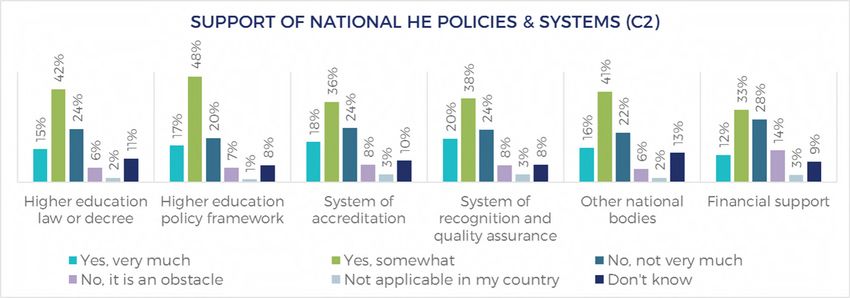
FOREWORD

     Technology in itself is merely a means to an end, yet technological
     developments are leading to fundamental changes in higher education
     and in society - and this at an unprecedented pace. This is why the
     International Association of Universities (IAU) has made ‘technology in
     higher education’ one of its key priorities in order to discuss, debate and
     bring to the attention of leaders of higher education and policy makers the
     issues at stake and the opportunities to be explored.

     On one hand, technological developments are exciting and aspiring as they
     come with an untapped potential for exploring new opportunities for
     tackling challenges facing societies, opportunities in terms of teaching,
     learning and research. Yet, at the same time, the opportunities for exploring
     and leveraging the potential of technology are very different from one
     country to another and within countries, which means there is a great risk of
     exacerbating divides. This implies that our mission is twofold: we need to
     consider the opportunities to be explored and at the same time to advocate
     and raise awareness of the important global challenges and risks related to
     digital transformation in order to close gaps, avoid biases and ensure an
     inclusive, fair, ethical and human-centred approach to digitalization.

     In this complex context, IAU stresses that ‘there is no one size that fits all’ to
     digital transformation in higher education and society. It is crucial to bring
     together views and experiences from different parts of the world and to
     discuss the values and principles that must underpin digital transformation
     at the global level. This is essential in order to build bridges and create
     mutual understanding of local as well as global challenges to determine the
     key values and principles that are pivotal in order to shape a meaningful,
     human-centred digital future for the common global good, regardless of
     where in the world we are physically based. This is precisely the aim of the
     new IAU Policy Statement that is currently being developed.

     This report presents the results of the Open Consultation, conducted to
     monitor the current state of digital transformation in higher education
     from a global perspective and inform the drafting of the policy statement.
     IAU is pleased to present this first stock-taking exercise in the field, and to
     contribute to discussing the current state of transformation, the risk of
     inequalities, the ethical implications and how to jointly leverage the
     potential of technological developments for a sustainable future .

     We hope you enjoy the wealth of information presented in this report. The
     aim is that it will fuel the much-needed debates on digital transformation
     in higher education and contribute to the IAU Policy statement. Together
     we can shape the digital future that we want for higher education to
     better serve its purpose and society as a whole.

     Hilligje van’t Land                         Remus Pricopie
     Secretary General, International            Rector, SNSPA, Romania & Chair of
     Association of Universities                 the IAU Working group on
                                                 Technology in higher education

04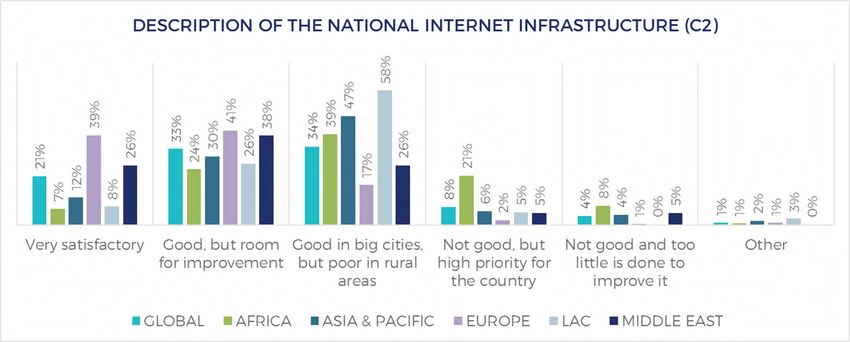
INTRODUCTION

This report presents the results of the        This is followed by a section looking at
Open Consultation carried out by the           changes as they relate to teaching and
International Association of Universities      learning; it also examines the use of
(IAU) from 1 November 2018 to 1 April          Open Educational Resources (OERs) and
2019. The aim of the consultation was to       the current trends in terms of Open
take stock of the current state of digital     Science. Considering the public
transformation in higher education
                                               discourse and an increasing need for
around the world and to inform the
                                               Lifelong Learning (LLL), there is a
development of a new IAU Policy
                                               specific section dealing with this
Statement. It is structured around five
                                               aspect. The section ends with a
main sections:
                                               summary of what HEIs consider the key
                                               achievements and the major challenges
I) Context, methodology and sample             in terms of digital transformation.

The first part sets the context, explains
the rationale, method and outreach. It         IV) Perceptions of the developments
also introduces the data sample by
region and by breakdown between                The last part of the report presents
public and private institutions. Finally, it   respondents’ perceptions and opinions
presents the profile of responding             of current and future developments as
institutions to provide a sound                well as of commonly used assumptions
understanding of the sample to be              and claims related to digital
considered when reviewing the results.         transformation in higher education and
                                               society.

II) Assessing the external
environment of higher education
                                               V) Conclusions in relation to the
institutions (HEIs)
                                               Policy Statement

This section focuses on the national
context in which higher education              Finally, the conclusions include the key
institutions (HEIs) are operating in order     outcomes of the consultation and a
to assess to what extent HEIs are              reflection of how the results can be
operating in an environment conducive          transformed into forming the principles
to digital transformation. This section        of the IAU Policy Statement.
examines both the infrastructure and
governance in terms of policies and
higher education regulations.

III) Transformation at the institutional
level

In the third part, the institutions are at
the centre of the review of the current
transformation taking place. The first
part focuses on institutional governance.

                                                                                          05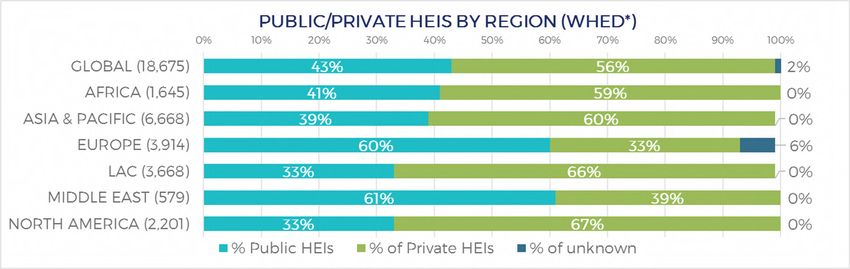
I. CONTEXT,METHODOLOGY AND SAMPLE

 I.1   SETTING THE CONTEXT                                       Romania in May 2018. The meeting was
                                                                 generously hosted by the National
                                                                 University of Political Studies and Public
 Technology in higher education became
                                                                 Administration (SNSPA). The EAG agreed
 a strategic priority for the International
                                                                 the roadmap to the statement which
 Association of Universities (IAU) as part
                                                                 included carrying out a consultation
 of its Strategic Plan 2016-2020. IAU
                                                                 among higher education institutions
 Members agreed that technological
                                                                 (HEIs) around the world to take stock of
 development has significant
                                                                 the current level of transformation, and
 implications for the future development
                                                                 to gather information about their
 of higher education and society. The
                                                                 experiences and views on the future.
 main objective set out in the plan was to
 develop a new policy statement building
                                                                 The Open Consultation was divided into
 on, yet moving beyond, the principles
                                                                 two separate consultations: i) one
 laid out in ‘Universities and Information
                                                                 targeting the leadership of HEIs
 and Communications Technologies
                                                                 (referred to in the report as ‘leadership
 (ICTs)’ adopted in 2004. While many of
                                                                 consultation’ in the text and as ‘C1’ in
 the principles of the latter remain
                                                                 the graphs) and ii) one open to all
 relevant, the context, opportunities and
                                                                 representatives in HEIs across the
 implications of technology in higher
                                                                 institution (referred to as the
 education and in society have drastically
                                                                 ‘comprehensive consultation’ in the text
 changed over the past decade and
                                                                 and ‘C2’ in the graphs). The purpose of
 continue to change at a rapid pace.
                                                                 having two separate consultations was
                                                                 based on the desire to reach out to the
 To oversee the development of the
                                                                 leadership of HEIs and to do so, it was
 Policy Statement, an Expert Advisory
                                                                 important that the consultation was as
 Group (EAG) was established composed
                                                                 succinct as possible. The comprehensive
 of IAU Board members and experts from
                                                                 consultation included a more detailed
 different parts of the world, bringing
                                                                 set of questions, seeking more
 together a broad range of expertise both
                                                                 background information on respondents
 in higher education leadership as well
                                                                 and their HEIs. While the first
 as in specific areas of digital
                                                                 consultation specifically targeted the
 transformation [1] . To plan the work and
                                                                 leadership of HEIs, the comprehensive
 to discuss the initial outline of the
                                                                 consultation was open to all
 statement, the EAG met in Bucharest,
                                                                 representatives from HEIs.

 [1] The list of the Expert Advisory Group (EAG) members is available here : https://iau-aiu.net/technology?onglet=1

06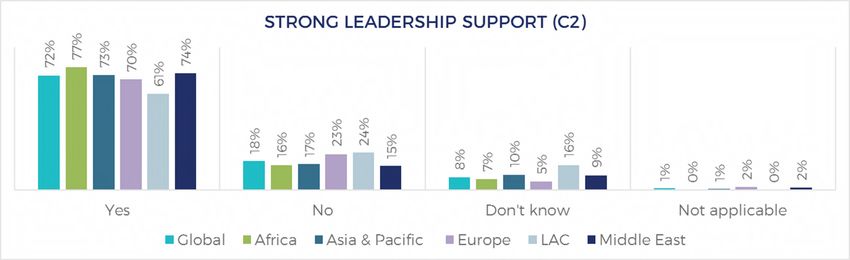
It was also decided that several             Beyond the individual invitations sent to
representatives from the same                9,121 contacts, IAU invited its Member
institution could contribute to the          Organizations and its Affiliates to
consultation in order to collect             disseminate invitation to participate in
information as many different sectors as     the consultation through their networks;
possible within institutions that may be     several heads of institutions also
involved in activities or initiatives        contributed to the outreach by sharing
related to digital transformation. In        the consultation through their national
most cases, institutions responded once      networks and rectors conferences. IAU is
or twice, but a number of institutions,      grateful to its partners around the world
particularly in the Middle East,             who took part in disseminating the
responded more than twice.                   consultation, including among others
                                             UNESCO, the Commonwealth of
The main objective of the consultation       Learning (COL), the European University
was to inform the development of the         Association (EUA), the Association of
policy statement, but it is all the same     Universities of Latin America and the
interesting to present the results of this   Caribbean (UDUAL), the Association of
global consultation to generate              African Universities (AAU), the
awareness about the commonalities            Conference of Rectors of Universities
and differences that derive from the         (CRUE), Spain and the Groningen
outcomes of the consultation. It is          Declaration Network (GDN). We also
essential to keep in mind that the open      thank other partners who contributed to
consultation is composed of voluntary        this effort without our awareness.
contributions of HEIs interested in and
willing to take part in the consultation
to shape the IAU policy statement.
                                             I.3 WHO RESPONDED TO THE
                                             OPEN CONSULTATION?

I.2 REACHING OUT TO THE
                                             Taking into account the total number of
HIGHER EDUCATION                             replies to both consultations, IAU
INSTITUTION COMMUNITY                        received 1,039 complete replies from
                                             127 countries. The leadership
The IAU World Higher Education               consultation gathered 347 complete
Database (www.whed.net) constitutes          replies from 107 countries, and the
the key source of information for            comprehensive consultation gathered
reaching out to higher education             692 replies from 106 countries.
institutions worldwide. The database
includes information on more than
18,500 higher education institutions
(HEIs) in 196 countries. For the launch of
the Open Consultation in November
2018, 6,440 heads of institutions
received an invitation to take part in the
Open Consultation and 2,681
representatives from the international
relations offices also received the
invitation encouraging them to share it
with relevant staff internally in the
institution.

                                                                                       07
I.3.1 BREAKDOWN BY REGION                                   As the participation of LAC is more
                                                             significant, it has been included in the
                                                             regional breakdown of the data, but it is
 The distribution of replies by region is
                                                             important to keep in mind that
 listed in the table below.
                                                             representation of LAC, particularly in the
                                                             comprehensive consultation, is lower
 When comparing the regional
                                                             than the other regions. As mentioned,
 breakdown of respondents against the
                                                             this consultation reflects the replies from
 number of institutions by region in the
                                                             respondents who participated in the
 WHED (Fig.1) , we see that Africa, Europe
                                                             voluntary contribution to shape the IAU
 and the Middle East provided                                policy statement. HEIs around the world
 proportionately more replies when                           received an invitation to take part, and
 compared to the respective numbers of                       all regions received an equal opportunity
 HEIs in the WHED. Asia & the Pacific is                     to contribute to the consultation. While
 slightly lower and the participation of                     we regret the low participation in LAC
 Latin America and the Caribbean (LAC)                       and North America, probably due to high
 while North America is significantly                        level of national surveys on this topic, we
 lower than the number of HEIs in their                      were very pleased with the overall global
 respective regions. Due to the                              involvement and the high response rate
 particularly low participation from                         to the first survey by IAU in this field. IAU
 North America, it has been excluded                         would like to thank all respondents for
 from the regional comparison                                the time they invested and support they
 throughout the analysis. However, the                       provided, which constitute an important
 responses received from this region are                     contribution to the development of the
 included in the global dataset.                             policy statement.

                                    Asia & the                  Latin America    Middle         North
                         Africa                     Europe       & Caribbean                   America
                                     Pacific                                      East

        Leadership         70            75            119            43            27               13
     consultation: 347

            %             20%           22%           34%            12%            8%               4%

      Comprehensive       146           186           202             38            117              3
     consultation: 692

            %             21%           27%           29%            5%            17%           0%

 Fig. 1

 *The data from the IAU World Higher Education Database (WHED.net) were extracted on 13 March 2019

08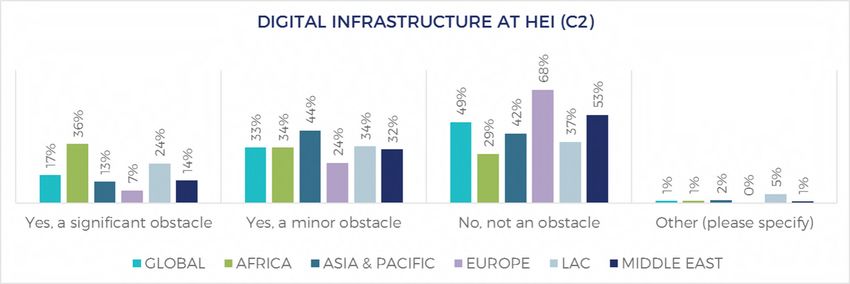
I.3.2 PROFILE OF RESPONDING                                   The regions with the most responses from
INSTITUTIONS                                                  public institutions are Europe (79%),
                                                              Africa (69%) and Asia & the Pacific (54%),
                                                              followed by LAC (50%). The Middle East is
The comprehensive consultation
                                                              the only region where the majority of
includes information on the profile of
                                                              responses came from private institutions
respondents and their institutions, which
                                                              (62%). In Fig. 3 , this breakdown is
are presented in this section. However,
                                                              compared to the distribution of HEIs in
as the leadership consultation was more
                                                              the WHED. However, the data from the
succinct, in order to encourage a high
                                                              WHED do not distinguish between private
response rate, it therefore did not
                                                              not-for-profit and private for-profit. In the
contain these background questions.
                                                              WHED, 43% of all HEIs are public, which
                                                              shows that the Open Consultation has a
I.3.2.1. BREAKDOWN BY PUBLIC AND                              high representation of public institutions.
PRIVATE HEIS

The higher education landscape
                                                                         WHED            RESPONDENTS
continues to change. To assess the type
of institutions that took part in the Open
                                                                        43%                  61%
Consultation, we included a question to                                 Public                Public
distinguish public, private not-for-profit
and private for-profit (Fig.2) . The global                             56%                  39%
data shows that most responses came                                     Private              Private
from public institutions (61%).

Fig. 2

Fig. 3

* Based on data extracted from the IAU World Higher Education Database (www.whed.net) on 13 March 2019

                                                                                                              09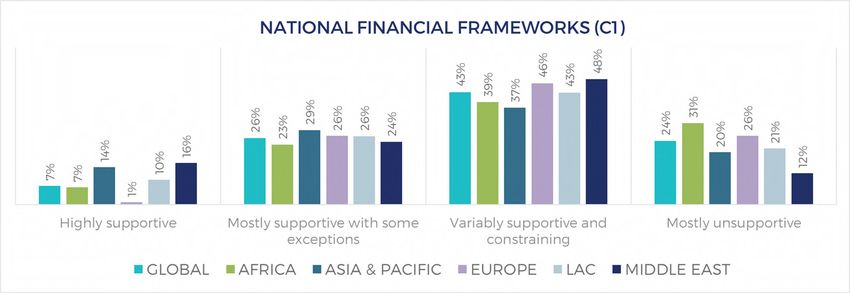
I.3.2.2. SIZE AND FOCUS OF THE HEIS

     Fig. 4 presents the size of responding
     institutions by student enrolment. The
     profile of the institutions ( Fig. 5 ) shows
     that over 80% of the institutions focus
     on both teaching and research. Finally,
     Fig. 6 lists the level of degrees awarded
     by the responding institutions where
     89% are offering Bachelors degrees, 92%
     Masters degrees, and 69% PhD degrees.

     Fig. 4

     Fig. 5

     Fig. 6

10
I.3.2 PROFILE OF RESPONDENTS As technology has the reputation of
being a male-dominated field, it is
encouraging to see that around a third
In both consultations, the respondents
of the replies came from women. The
provided their title. The results are
age distribution is available in Fig. 9 .
presented in Fig. 7 for the leadership
consultation and in Fig. 8 for the
RESPONSES BY GENDER
comprehensive consultation. As expected,
most respondents to the leadership
consultation (39%) are at the highest level 32% 68%
of leadership, but another important Women Men
share comes from other senior positions
within the HEIs. For the comprehensive Fig. 9
consultation, most respondents are
faculty, heads of departments and staff. It
also includes contributions from senior
leadership, although less important in the
overall score. It was a challenge to have
the two consultations taking place
simultaneously and to ensure that
invitations reached the right audience. In
spite of the difficulty, overall we are very
pleased with the participation results. In
the comprehensive consultation,
respondents also shared their gender and
The next section assesses to what extent
age (relatively few did not reply to these the national environment in which the
optional questions). We were pleased to HEIs are operating is conducive to
note that 32% of them were women. digital transformation.
Fig. 7
Fig. 8
11II. EXTERNAL ENVIRONMENT
II.1 RELEVANCE OF NATIONAL
HIGHER EDUCATION POLICIES,
REGULATIONS AND SYSTEMS
Are regulatory
frameworks conducive
to digital transformation ?
Asia & the Pacific
To understand digital transformation at has the most
the institutional level, it is important to positive assessment,
assess to what extent HEIs find that the
national regulatory framework for higher
where Europe
education is appropriate and conducive
has the most
to transition in the digital era. In the
negative one.
leadership consultation, the respondents
assessed the extent to which the
national regulatory policies ( Fig. 10 ) and Most replies lie at the middle of the
financial frameworks ( Fig. 11 ) are scale, with a slight preponderance
supportive at the institutional level. towards the negative end. The remaining
respondents are equally divided between
There are some differences among ‘Highly supportive’ (16%) and ‘Mostly
regions, but at the global level, the unsupportive’ (17%). When adding
results show a divide between ‘Mostly together the replies on the supportive
supportive with some exceptions’ policies side compared to the less supportive
(32%) and ‘variably supportive and side, 48% considers the policies
constraining’ policies (36%). supportive and 52% unsupportive.
Fig. 10
Fig. 11
12Looking at this same breakdown by
region, it shows that in Asia & the The financial frameworks are the least
Pacific, HE policies are considered more conducive to digital transformation. Besides,
supportive (62%) than other regions, the accreditation system and the recognition
followed by the Middle East (59%). The and quality assurance systems are
regions weighing higher on the negative considered slightly less conducive to digital
transformation compared to the rest.
side of the scale are Europe (58%),
Africa (56%) and LAC (53%) where most
respondents consider the policies less
Adding up the scores of the responses
conducive to digital transformation.
on the positive and negative sides, we
see the same trends as for the previous
Turning to the second part of the
question on policies: Asia & the Pacific
questions on the national financial
(43%) and Middle East (40%) are the
frameworks for higher education,
most positive regarding the national
‘Variably supportive and constraining’
financial framework. The less positive
(43%) has the highest score not only at
responses are from Europe (72%), Africa
the global level but across all regions.
(70%), and LAC (64%), thus echoing
Here, ‘Mostly unsupportive’ (24%) also
replies to the previous question.
has a higher score than ‘Highly
supportive’ (7%). Although respondents
The comprehensive consultation sought
from Asia & Pacific are also more critical
a more detailed assessment of national
compared to the previous one, it
higher education regulations ( Fig. 12 )
remains the most positive region (14%
‘Highly supportive’ and 29% in ‘Mostly with questions on the following:
supportive with some exceptions’). i) Higher education law or decree,
ii) Higher education policy framework,
iii) System of accreditation, iv) System of
recognition and quality assurance,
v) Other national bodies in charge of
higher education and vi) Financial
support. Besides the two positive and
two critical replies proposed, two
additional options were included (‘Not
applicable in my country’ or ‘Don’t
know’) to take into account the
differences in terms of higher education
governance at the national level as well
as the level of awareness of respondents.
Fig. 12
13Looking at the results from the
evaluation of the different policies and
systems in place, it shows a rather
consistent trend across the different
regions where the category with the
most replies is '‘Yes, somewhat’
conducive to digital transformation in
higher education. The percentage varies
from 33 to 48% in this category, but in
all cases, it is this reply that has scored
the highest. ‘No, not very much’ has the
second-highest score (ranging from 20
to 28%). The third most popular reply is
‘Yes, very much’ (12-20%) except for
‘Financial Support’ where ‘No, it is an
obstacle’ gained a higher percentage.
II.2 INTERNET INFRASTRUCTURE
Comparing the overall results among
the different options, the respondents While the response patterns were
find that the ‘financial frameworks and relatively similar in the previous section
support’ are the less conducive to digital on national policies and systems, it is
transformation. Besides that, the not the case here where the focus is on
‘System of Accreditation’ and the internet infrastructure and the
‘System of Recognition and quality consequences for HEIs. This is not a
assurance’ are considered slightly less surprise, as it is in line with global data
conducive to digital transformation on internet penetration and use. The
when compared to the rest. figures from International
Telecommunication Union (ITU) in Fig.
Overall, there is a clear message from 13 shows only 51% of the world’s
respondents that the current policies
population is using the Internet. For
and regulation systems of higher
developed countries, it is 81% of the
education are ‘somewhat’ supportive. It
population against 45% in for
is the general trend in replies given
developing countries and when we
across these two sections. It was also
examine Least Developed Countries
clear from the different consultations
(LDCs), only some 20% of the population
that HEIs would like to see more
- the opposite of developed countries.
supportive financial frameworks as an
incentive to move towards more Fig. 13 - Individuals using the Internet per 100
transformation. The respondents are not capita (2018)
necessarily very critical of existing
Per ITU Developed vs. developing
policies, but neither are they necessarily defined region countries
very positive. It is an area to monitor in
Africa 24,4 Developed 80,9
more details in order to identify the key
challenges and opportunities in the Arab States 54,7 Developing 45,3
relationship between the national Asia & Pacific 47,0 World 51,2
policies and regulations and the CIS 71,3 LDCs 19,5
possibility of higher education
Europe 79,6
institutions pursuing transformation and Source: ITU (2019)[2]
change in an increasingly digital world. Americas 69,6
[2] ITU 2019 https://www.itu.int/en/ITU-D/Statistics/Pages/stat/default.aspx (Accessed on 4/6/2019)
14QUALITY OF THE INTERNET
INFRASTRUCTURE
? There is still a continuous need for
investment in infrastructure and for
awareness and solidarity among HEIs
with access and those without to
strengthen capacity building and
facilitate leapfrogging when possible.
This very simple graph ( Fig. 14 ) shows
Satisfactory
connection
7% 38% extensive inequalities in internet access
and therefore also in access to
Connection international networks and most
not good
29% 10%
importantly, in the access to knowledge
and information. Is it possible to refer to
‘knowledge society & economy’ when
Although the higher education sector half of the world population is excluded
represents a segment of the population from the wealth of information available
which is more likely to have access to online? We want all countries to thrive,
the internet, there is still an important grow and improve the human condition.
difference between Europe, where 38% However, as for many other societal
describe the national infrastructure as aspects, the preconditions needed to
‘very satisfactory’ against only 7% in explore and leverage the potential of
Africa. Particularly, LAC (58%), Asia & the technology in higher education remains
Pacific (47%) and Africa (39%) indicate highly unequal and represents a major
that the infrastructure is ‘good in big risk in terms of creating or exacerbating
cities, but poor in rural areas’. This divides.
confirms that the opportunities are far
from the same in terms of digital
transformation around the world and
within many countries. It will not be
Unequal access to internet,
possible to transform higher education
and make use of the potential of implies unequal access to
technology where infrastructure and
connectivity are not providing the
information, knowledge
essential conditions for tapping into this and international networks
potential.
Fig. 14
15Respondents were also asked to
describe the internet infrastructure
within the institution, which in the same
manner illustrates the different working
conditions of HEIs depending on where
in the world they are situated. The same
trend is visible in this chart showing
that the largest divide is between Africa
(36%) and Europe (7%) when looking at
the answer category ‘Yes, a significant
obstacle’. In the same manner, the
respondents who indicate that it is not
an obstacle, Europe scores 68% against
29% in Africa.
Fig. 15
II.3 USAGE OF NATIONAL In the comprehensive consultation,
RESEARCH EDUCATION respondents assessed whether there is
NETWORK (NREN) national support for NREN ( Fig. 16 ) and
whether NREN is used at the institution
( Fig 17 ).
As an alternative to the commercial
Internet Service Providers (ISPs), the
The results in Fig. 16 show that in most
National Research Education Network
cases the respondents confirmed that
(NREN) constitutes a different,
there is ‘Yes, somewhat’ (55%) support
independent network connection used
in many countries specifically for for NREN at the national level and if
education and research. Beyond the ‘Yes, very much’ is added to the
network, NREN can also provide percentage it brings the global
different services to HEIs, and it is an percentage to 71%. Only in LAC do
important opportunity for global replies differ from other regions where
collaboration on education and research the respondents are more mixed
through access to databases and other (50%/50%) in terms of the support
research material[3]. versus lack of support.
[3] https://www.casefornrens.org/Resources_and_Tools/Document_Library/Documents/What%20is%20an%20NREN.pdf
16On the use of NREN at the institutional account the national environment and
level ( Fig. 17 ), it shows that while the the different factors that play a role in
highest score is ‘yes’ at the global level the governance of HEIs. While many of
(42%) it is worth mentioning that Africa the replies were similar across regions in
has the highest score of usage (49%). An relation to national policies and
important number of respondents do regulations, the internet infrastructure
not know whether their university is remains the most unequal factor for the
using an NREN network (33%). It means level of opportunity higher education
that while the consultation provides institutions have around the world for
some indication that most of the pursuing the potential of emerging
institutions are using NREN, it also technologies.
shows that faculty and staff across the
institution are not aware of this and it NREN is one way of investing in
may be useful to raise awareness about educational and research infrastructure
the potential that NREN can bring to other than commercial internet
the education and research community. providers, and also the means to
facilitate the transfer of data and
The purpose of this section was to communication at high speed.
present the different parameters to
understanding the conditions for digital In the next section, the focus moves from
transformation at HEIs, taking into the national to the institutional level.
Fig. 16
Fig. 17
17III. TRANFORMATION AT THE INSTITUTIONAL LEVEL
This section examines several aspects III.1 TRANFORMATION IN
within the HEIs in order to assess the HIGHER EDUCATION
level of digital transformation within
these various facets. The section is
GOVERNANCE
divided into different parts looking first
at changes from perspective of the III.1.1 THE COMMITMENT TO AND
overall institutional governance, THE NATURE OF CHANGE
followed by the use of technology in
teaching and learning. The third part
It aimed at assessing to what extent
reviews the progress made towards the
leaders in higher education consider
use of Open Educational Resources
digital transformation as a priority ( Fig.
(OERs), Open Science and the
18 ). Unsurprisingly, most respondents
availability of digital knowledge
consider it a ‘high priority (68%) or
infrastructures such as an online library.
‘medium priority’ (29%) and only very
A specific part on Lifelong learning has
few consider it a ‘low priority’ (3%) or
been included in response to the
‘not a priority’ (1%).
current societal discourse on the need
for continual training, re-skilling and
In the comprehensive consultation,
upskilling of citizens to assess to what
respondents were not asked to assess
extent lifelong learning is affecting
whether digital transformation is
higher education. The last part presents
considered a priority but rather the
the key achievements and obstacles
commitment of leadership towards
related to digital transformation
digital transformation and the use of
according to the HEIs.
new technologies within the institution
( Fig. 19 ). The results confirm that 72% of
respondents find that there is a
commitment from the leadership at the
global level. Particularly in Africa (77%)
which is above average, but less so in
LAC (61%) which is below the global
average. In spite of the differences, there
is an overall trend where leadership
considers ‘digital transformation’ an
important priority and respondents
confirm that in the majority of HEIs,
there is strong leadership commitment
to pursuing digital transformation.
Fig. 18
18Fig. 19
To understand how digital transformation As expected, the responses to this
translates into action, respondents were question are rather divided with,
asked to assess whether it is mainly being globally, a slight majority in the ‘bottom-
pushed top-down by the leadership and up approach’ (41% top-down/ 56%
through an institutional-wide strategy or bottom-up). When we consider the
whether it is mainly developing as bottom- regional breakdown, in the Middle East
up, building on different opportunities and (70%) the result is more marked, where
experiences across the different faculties the trend is towards a ‘bottom-up
or administration ( Fig. 20 ). approach with multiple initiatives taking
?
place within the different faculties’. This
trend is also somewhat reflected in
HOW IS DIGITAL TRANSFORMATION Africa (63%). However, at the global
BEING PUSHED level, it is a mixture of both approaches.
This was also expressed in several
TOP-DOWN BY BOTTOM-UP comments relating to the question,
LEADERSHIP APPROACH explaining that there is no strategy in
place but that it is being developed,
41% 56% while others confirmed that it is a
combination of both and some refer to a
digital roadmap or strategy in place to
support the institutional transformation.
Fig. 20
19To assess perceptions of digital Digital transformation is being
transformation in HEIs, the respondents integrated in the institutional
to the leadership consultation were strategic plan in most HEIs
asked whether initiatives undertaken at
around the world.
their institutions are mainly ‘to do the
same things, but with the help of
technology’ or ‘to do things differently,
III.1.2 FROM COMMITMENT TO
with the help of technology’. An
ACTION
additional option was added: ‘We are
planning to do things differently, but are
III.1.2.1. STRATEGIC PLANNING
limited because of funding or other
demands’ ( Fig. 21 ). In terms of global
80% of respondents confirmed that the
average, the highest score (43%) is
institution has an institution-wide
showing that things are being done
strategic plan, while 11% ‘do not know’
differently so it is not only a matter of
and the remaining 9% explained that
doing the same things supported by
the institution does not have a strategic
technology, while 38% explained that
plan. In the subsequent question, the
they are planning to do things
respondents were asked whether the
differently but are held back by a lack of
use of new technologies is part of the
resources. Finally, 18% stated that the
institutional strategic plan ( Fig. 22 ), to
transformation is mostly about doing
which 75% confirmed that it is the case
the same things but with the help of
without big differences among regions.
technology. Only 1% indicated that 'No
9% specify that this is not part of the
new initiatives are taking place’.
institutional strategic plan. In this
category, Europe (13%) and the Middle
This first series of questions were to
East (12%) are above the global average.
assess the understanding of digital
13% ‘don’t know’ and in this category,
transformation in higher education. The
LAC are particularly above the global
next series of topics relate to the overall
average (18%). Despite the differences,
governance of the institution in order to
this provides a clear sign that digital
examine how digital transformation
transformation is being integrated as
translates into action through a
part of the institutional strategic plan in
different set of measures.
most HEIs around the world.
Fig. 21
20Fig. 22
III.1.2.1. STRATEGIC PLANNING
III.1.2.2 BUDGETARY COMMITMENTS Again, most respondents (55%), confirm
that there is a budget supporting digital
In the leadership consultation, the transformation, 25% do not know and
respondents were asked to indicate 18% indicate that there is no budget
approximately how much of the overall available.
institutional budget is allocated for
digital transformation ( Fig. 23 ). In the The results of the leadership consultation
comprehensive consultation ( Fig. 24 ), show that budget is mostly assessed
the question was more open and between 0-9% (35%), and then between
respondents had to indicate whether 10-19% (29%). Thereafter, the number of
the institution had a budget allocation replies decline as the percentage of the
to support digital transformation. budget ranges increase.
Fig. 23
Fig. 24
0-9%
35% of the institutional budget
is allocated to digital
transformation
10-19%
29% of the institutional budget
is allocated to digital
transformation
21III.1.2.3 MANAGERIAL COMMITMENT III.1.2.4. COMMITMENT TO WIDENING
ACCESS TO HIGHER EDUCATION
With no significant differences among
Technology offer new opportunities of
regions, the institutions confirm that in
outreach to students, both in terms of
most cases (73%), there is a person or an
distance access and means to facilitate
organizational unit in charge of digital
learning for, among others, people with
transformation ( Fig. 25 ). In contrast, 19%
disabilities. In this respect, the
of HEIs do not have someone or a unit in
leadership consultation included a
charge. Africa (21%) is the only region
question to assess whether universities
slightly above the global average. In the
are undertaking initiatives to improve
leadership consultation ( Fig. 26 ), the
access to higher education for under-
results are slightly more positive with
represented groups ( Fig. 27 ). Most of
overall 83% positive replies, among which
the respondents confirm that this is the
60% ‘Yes’ and 23% 'Yes, several’. Similarly
case: ‘Yes, somewhat’ (44%) and ‘Yes,
to the comprehensive consultation, 17%
fully’ (19%); 20% indicate that it is not
explain that they do not have senior
the case currently, but it is being
leadership in charge of this area.
discussed. The remaining 18% represent
the category where no initiatives are
Fig. 26 currently taking place. In particular, LAC
are above average in the category ‘Yes,
fully (37%) whereas Europe is above
average in the category ‘No, not at this
stage’ (27%). While most replies are on
the positive side, it still leaves 38 % on
the negative side, which is a clear sign
that there is room for improvement to
explore the technological opportunities
to improve access to higher education
of under-represented groups.
Fig. 25
Fig. 27
22III.1.2.5 CAPACITY-BUILDING above and the Middle East (17%) slightly
below. In the leadership consultation,
Both consultations sought to assess to however, there is more regional variation
what extent capacity-building and in the replies. When we look at the sum of
training opportunities are available to the two ‘no’ options, 13% indicate that no
support faculty and staff in gaining new training opportunities exist and both
skills and becoming familiar with new Europe (18%) and Africa (17%) are above
technologies and new opportunities. In the global average. LAC (98%) is the
both consultations, there is a clear reply region with the highest percentage of
across regions that training institutions with access to training
opportunities are indeed available. The opportunities when considering both ‘yes’
respondents to the leadership categories, but even in the ‘Yes, fully’
consultation were a little more category, the region has a much higher
optimistic ( Fig. 28 : 87%) compared to percentage (56%) than the other regions
the comprehensive consultation ( Fig. where Africa comes in second (36%).
29 : 73%). So while most staff can enjoy
capacity-building opportunities,
somewhere between 13-27% do not have
access to these opportunities or might
not know that such opportunities exist.
Considering the results of those without
access to training opportunities (19% in
the comprehensive consultation), the
regional responses are more or less the
same, with Africa (21%) only slightly
Fig. 28
Fig. 29
23III.2 ONLINE GOVERNANCE III.2.2 USE OF LEARNING
OF STUDENT DATA AND MANAGEMENT SYSTEMS (LMS)
LEARNING PROCESSES
The use of Learning Management
Systems (LMS) was assessed in both
III.2.1 ONLINE STUDENT
consultations ( Fig. 31 and 32 ). Overall,
ENROLMENT
the replies are similar, although the use
of LMS is slightly higher in the
At the global level, 63% indicate that leadership consultation (35% versus 30%
the enrolment process and student data for the category ‘Yes, fully’). Overall, the
is fully managed online, followed by trend is similar between 73-77% of
30% indicating that it is managed respondents are using LMS (either fully
partially online (Yes, somewhat) ( Fig. or somewhat) and between 24-27% are
30 ). Europe (72%) and Middle East (70%) not using LMS or not aware of it. Some
are both above the global average in are, however, exploring LMS more
terms of fully managing the application extensively than others. In terms of the
process online and Africa (53%) and LAC regions, the trends are similar in both
(58%) are below the average in this consultation except for LAC where the
category. When combining the results of leadership indicate that 47% that it is
the two negative reply options (‘No, but ‘fully used’ and 28% ‘somewhat used’
it is being discussed’ and ‘No, not at this whereas in the comprehensive
stage’), Africa (10%) and Asia & the consultation the trend is the opposite
Pacific (10%) are above the global with 16% expressing that it is ‘fully used’
average of 7% for these categories. After against 53% ‘somewhat used’. So in this
30 years with the world-wide-web, this region, there are divergent views on to
is one area where the majority of what extent LMS is being used but less
universities across the different regions so when considering the ‘yes’ categories
have either started or fully transitioned jointly. Different respondents from
to online management of enrolment different countries within the region
and student data. Yet, 7% are still might also explain the difference
managing this process fully offline, between the two consultations. Finally,
which means that if this was 7% of the Europe has a high score of ‘don’t know’
number of institutions in the World (19%) in the comprehensive
Higher Education Database (WHED), it consultation.
represents around 1,300 institutions
worldwide.
Fig. 30
24Fig. 31
Fig. 32
III.2.3 POLICIES ON DATA
MANAGEMENT
Online management of data generates
new possibilities for exploring, tracking ETHICS
and using the data related to students
throughout their enrolment and of the
alumni of the institution. It enables new
forms of communication with students,
online learning spaces and fora, online
communication with professors and and 30% ‘yes, somewhat’ ( Fig. 33 ).
teachers. These new opportunities bring
However, when considering the replies
about new ethical questions about
by region, the data shows that LAC (65%)
management and transparency in the
and Europe (64%) are more advanced in
use of data, data security and the right
this area. The Middle East (41%), Africa
to data privacy. The consultation,
(43%) and Asia & the Pacific (49%) have
therefore, aimed to assess to what
the lowest score in this category and
extent universities have data privacy
although they are slightly higher than
policies in place or ethical guidelines. In
the global average (30%) in the ‘yes,
the leadership consultation, both
somewhat’ category, these three regions
dimensions were grouped into one
remain the ones with the highest rate of
question on whether the university has
‘no’ answers namely 26% for the Middle
ethical guidelines or a privacy policy in
East, 22% for Africa, and 20% for Asia &
place dealing with the use of data and
the Pacific - when combining the sum of
information: 55% responded ‘yes, fully’
the two ‘no’ categories of answers.
25Fig. 33
The questions were framed somewhat
differently in the comprehensive Technology is merely a means
consultation where it was broken down
to an end, the essential
into two questions, one specifically on
the Data Protection Policy ( Fig. 34 ) and question is therefore how we
one on Ethical Guidelines ( Fig. 35 ). The make use of and apply
global average on the availability of a
technology. This is intrinsically
Data Protection Policy is higher (70%)
than the leadership consultation, but linked to a series of ethical
the trends within the regions remain questions that must be a
similar, with Europe (84%) and LAC
(76%) in the top responses Africa (58%),
priority for higher education
Middle East (66%) and Asia & the Pacific to consider.
(67%) below the average.
Fig. 34
The second question on ethical dissemination of knowledge, recording
guidelines was to assess to what extent lectures etc.). This question has a slightly
HEIs are discussing, and determining lower global average (62%) and there is
policy on what is ethical in terms of the less discrepancy among regions.
use of data ( Fig. 35 ). This part can be However, it is worthwhile to note that
relevant from different angles, both from LAC (68%) and the Middle East (68%) are
the perspective of the institution and beyond the global average along with
how student data is used, and in the Asia & the Pacific (66%); divergence of
relationship with the students and their terminology in different parts of the
digital or online behaviour (plagiarism, world might explain this difference.
26Fig. 35
III.3 TRANSFORMATION IN From a general perspective, respondents
TEACHING AND LEARNING assessed whether technology is being
While the regional breakdown of the
responses on the ‘no’ side of the scale is
After considering transformation that similar, there are some regional
concerns the global governance of the differences between the categories (Yes,
HEIs, this section will look into the very much’ and ‘Yes, to some extent’).
changes specifically related to teaching For LAC, only 11% of the respondents
and learning. answered ‘yes, very’ much, against 79%
who responded ‘yes, to some extent’.
III.3.1 TECHNOLOGY IN Europe is also below the global average
TEACHING AND THE USE OF NEW in the category ‘Yes, very much’ (23%)
TEACHING MODALITIES but above average in ‘Yes, to some
extent’ (59%). When considering both of
the ‘yes’ categories together it is very
From a general perspective, respondents
clear that the technology is increasingly
assessed whether technology is being
being used in teaching, but most
increasingly integrated as part of
respondents are in the category ‘Yes, to
teaching ( Fig. 36 ). Most respondents
some extent’. This can be a sign of a
expressed that ‘yes, to some extent’ potential to integrate it more fully, or
(56%) and 31% indicated ‘yes, very maybe that it is important that
much’. Some 8% replied ‘No, but it is technology is only used somewhat in
being discussed’ and only a few selected teaching.
‘No, not at this stage (3%).
Fig. 36
27In the leadership consultation, the The comprehensive consultation respondents assessed to what extent included three questions where the they use teaching modes such as a respondents were asked to express in flipped classroom, blended learning and percentages to what extent their online learning ( Fig. 37 ). Twenty-seven institution offers courses fully online; percent stated ‘Yes, fully’ and 52% hybrid and blended courses and thirdly indicate ‘Yes, somewhat’. These results courses supported by online resources are in line with the trends from the ( Fig. 38 ). previous question. There is a general tendency towards more integration of It is very clear that very few of the technology through new teaching and responding institutions offer courses learning modes, yet the potential is, available fully online. As the first 10% maybe not yet, being fully explored in range attracted 59% of responses, it was most HEIs. In terms of the regional decided to break the range down into breakdown, LAC has the highest score in three categories: 0% (with 32% of ‘yes, fully’ (49%) and below the average replies), 1 to 4% (14% of replies) and 5 to in ‘yes, somewhat’ (37%). Europe is 9% (13% of replies). Then we see the slightly below the average in ‘yes fully’ curve gradually declining the higher the (24%), but more importantly beyond percentage becomes, except for the last average in the category ‘yes, somewhat’ range of 90-100% (2%) where a few (60%). However, when considering the open universities, providing all courses sum of the ‘yes’ categories both LAC fully online, lead to a slight increase at (86%) and Europe (84%) are at the same the end. However, it is very clear that level, it is the degree of the ‘yes’ that is moving towards teaching provided fully significantly different. Finally, Middle online is not a major priority. East (22%/7%) and particularly Africa (29%/9%) are the two regions above the global average (16%/5%) in both of the ‘no’ categories. So although the previous question showed that respondents in Africa indicated that technology is increasingly being integrated into teaching, it is not necessarily in the form of the different teaching modes highlighted in this question. Fig. 37 28
Fig. 38

In terms of hybrid and blended learning,     III.3.2 CHANGES IN TEACHING
the responses are clearly divided across     PEDAGOGIES, COMPETENCIES
the scale. Twelve percent indicate that      AND ASSESSMENTS
they do not use hybrid or blended
learning. The majority of remaining
                                             Considering the change in teaching
replies (50%) are more or less evenly
                                             pedagogies, most respondents (51%)
distributed within the spectrum of 1-
                                             indicate that in the past 5 years,
30% with the remaining 38% being
                                             teaching pedagogies ‘have changed
distributed across the rest of the scale
                                             somewhat’, and 29% express that they
(31-100%). Finally, in terms of use of
                                             ‘have changed a lot’ ( Fig. 39 ). This leaves
online resources to support courses, the
                                             very few respondents that find that the
results show that these are more widely
                                             teaching pedagogies remain mainly the
used. Here, the highest concentration of
                                             same (12%) or that they are not
replies falls within the category 90-100%
                                             changing (2%). Overall, regional trends
(27%) and only 5% state that they do not
                                             are similar; however, Africa (37%) is
use online resources. Fully online
                                             above the global average in the category
courses remain predominantly the
                                             where pedagogies ‘have changed a lot’.
priority of open universities and a few
                                             LAC (21%) is above average saying that
on-site universities whereas hybrid and
                                             teaching pedagogies ‘are mainly the
blended learning are finding a steadier
                                             same’. Finally, the Middle East is above
role in universities and finally, it seems
                                             average saying that the pedagogies ‘are
to be much more mainstream to use
                                             not changing’ (7%) as well as in the
online resources to support courses
                                             category saying that they do not know
offered.
                                             (10%).

Fig. 39

                                                                                         29
Although it is complicated to measure Africa (27%) coming above average in
the change in teaching pedagogies and the category ‘Lecture-based learning’.
approaches at a general level due to Africa (56%) and Europe (53%) are above
differing traditions based on different average in the category, ‘Mostly lecture-
fields of study, a question assessed based learning but combined with
whether lectures continue to be the problem-based learning’. This means
dominant form of teaching in higher that lecture-based learning continues to
education. One possibility of technology be a dominant teaching mode, although
is to disseminate information from one it is also combined with problem-based
to many. It was a challenge to find a learning.
suitable wording to easily capture the
alternative to lecture-based learning,
but ‘problem-based-learning’ was used
as it implies a more active engagement
on the part of the students in the
learning process rather than a more
passive approach where information is
‘transmitted’ from the lecturer to the
student through a lecture ( Fig. 40 ).
Fig. 40
This question shows that 49% of Technology is changing society and
undergraduate courses are delivered by societies around the world depend more
‘Mostly lecture-based learning, but and more on digital technologies. This
combined with problem-based transformation has an impact on the
learning’. In second place is ‘Lecture- skills and competencies required of
based learning’ (23%). 19% chose ‘Mostly citizens to take part in society and in the
project-based learning, but combined labour market. Within this context,
with lectures’ and finally, 5% selected respondents to the leadership
‘Problem or case-based learning’. consultation were asked to assess
whether the university has reconsidered
The regional breakdown shows that Asia the skills and competencies required of
& the Pacific (26%), LAC (24%) are above students within the past 3 years ( Fig. 41 ).
average in the category ‘Mostly problem-
based learning, but combined with
lectures’ with Middle East (32%) and
30In terms of the global average, 82% The same question was asked for
indicate ‘yes’ where 35% of replies are ‘learning outcome assessments’ ( Fig. 42 )
‘yes, fully’ and 47% are ‘yes, somewhat’. and in this case the share of ‘Yes, fully’ is
Thirteen percent responded ‘no, but it is higher (42%) whereas yes, somewhat
being discussed’ with 5% saying ‘no, not (42%) slightly lower than in the previous
at this stage’. question. The overall trend in terms of
replies are the same across the regions,
Replies from Asia & the Pacific and however Africa particularly stands out
Europe more or less follow the global in terms of fewer replies in the ‘yes’
trend; Africa also, to a certain extent, categories (33% and 34% respectively)
but with a slightly lower rate in the ‘yes, and it has likewise a higher share of the
fully’ reply (31%) and a slightly higher ‘no’ replies - 17% in ‘no, but it is being
rate (50%) in the ‘yes, somewhat’ reply. discussed’ (against 10% in the global
LAC and the Middle East both stand out average) and 16% in the category ‘No,
when compared to the global average – not at this stage’ (against 7% in the
LAC as its share of replies to ‘yes, fully’ is global average). Europe (91% in total)
much higher (56%) and its replies are and LAC (86% in total) have a higher
lower than the global average in both share of the ‘yes’ replies and likewise a
‘no’ categories. lower share in the ‘no’ categories. The
Middle East continues to have a higher
The Middle East stands out by a much share in the category ‘No, but it is being
lower-than-average reply in the ‘yes, discussed’ (15%).
fully’ category (22%) and its much
higher-than-average reply in the ‘no, but
it is being discussed’ category (26%).
Fig. 41
Fig. 42
31Digital literacy is increasingly a skill that expressed ‘yes, to some extent’, 22% ‘yes,
is required for students in terms of both very much engaged’, 14% ‘no, but it is
their participation in society, the labour being discussed’ and 10% ‘No, not at this
market and most importantly for time’. Finally, 7% 'did not know'. In
gaining access to information and terms of the regional breakdown, the
knowledge to aid them make informed Middle East has a particularly higher
decisions about their lives. With this in share of ‘yes, very much engaged’ (32%)
mind, the comprehensive consultation although the total sum of the ‘yes’
included two questions about digital replies remains only slightly higher than
literacy: the first question was to assess the global average. LAC are, on the other
to what extent digital literacy is a hand, above the average in the ‘yes, to
priority at the national level ( Fig. 43 ) some extent’ (55%) and significantly
and the second question whether it is a lower in the ‘yes, very much engaged’
transversal learning outcome at the (11%). Finally, Europe is below the global
institutional level ( Fig. 44 ). average in both yes categories
In terms of national support, respondents (18%/39%) and 5% above average in ‘no,
mostly replied ‘yes, somewhat’ (53%) with not at this stage’ and ‘don’t know’.
26% saying ‘no, nothing much’ followed
by 17% indicating ‘yes, very much’. LAC While the overall trend is similar across
(42% in total) and Africa (38% in total) regions, this series of answers show that
stand out by having a higher share of the digital literacy is being considered ‘to
respondents in the ‘no’ categories some extent’ as a transversal learning
compared to the global average. outcome for nearly 50% of respondents
at the global level. The leadership
Turning to the question about whether consultation equally shows that most of
digital literacy is a transversal learning the respondents have reconsidered skills,
outcome for students ( Fig. 43 ), 47% competencies and the learning outcome
assessments within the past three years.
Fig. 43
Fig. 44
32You can also read