SimRa: Using Crowdsourcing to Identify Near Miss Hotspots in Bicycle Traffic
←
→
Page content transcription
If your browser does not render page correctly, please read the page content below
SimRa: Using Crowdsourcing to Identify Near Miss
                                                         Hotspots in Bicycle Traffic

                                              Ahmet-Serdar Karakaya∗, Jonathan Hasenburg, David Bermbach
                                                             TU Berlin & Einstein Center Digital Future
                                                              Mobile Cloud Computing Research Group
arXiv:2006.08481v2 [cs.CY] 1 Jul 2020

                                                                          Berlin, Germany

                                        Abstract
                                        An increased modal share of bicycle traffic is a key mechanism to reduce
                                        emissions and solve traffic-related problems. However, a lack of (perceived)
                                        safety keeps people from using their bikes more frequently. To improve
                                        safety in bicycle traffic, city planners need an overview of accidents, near
                                        miss incidents, and bike routes. Such information, however, is currently not
                                        available. In this paper, we describe SimRa, a platform for collecting data on
                                        bicycle routes and near miss incidents using smartphone-based crowdsourcing.
                                        We also describe how we identify dangerous near miss hotspots based on the
                                        collected data and propose a scoring model.
                                        Keywords: Bicycle safety, Bicycle traffic, Crowdsourcing, Near miss
                                        incident

                                        1. Introduction

                                            Major cities worldwide aim to reduce traffic emissions, traffic jams, and
                                        the city space devoted to cars. Aside from improving public transport, the
                                        main strategy for this is to increase the modal share of bicycle traffic. In
                                        practice, however, polls regularly show that a lack of (perceived) safety due to
                                        car-centric city planning keeps people from using their bikes more frequently.
                                            To address this, city planners need to comprehend the “dangerousness”
                                        of streets at the level of individual street segments and intersections. Such

                                          ∗
                                            Corresponding author
                                            Email addresses: ak@mcc.tu-berlin.de (Ahmet-Serdar Karakaya),
                                        jh@mcc.tu-berlin.de (Jonathan Hasenburg), db@mcc.tu-berlin.de (David Bermbach)

                                        Preprint submitted to Journal of Pervasive and Mobile Computing     July 2, 2020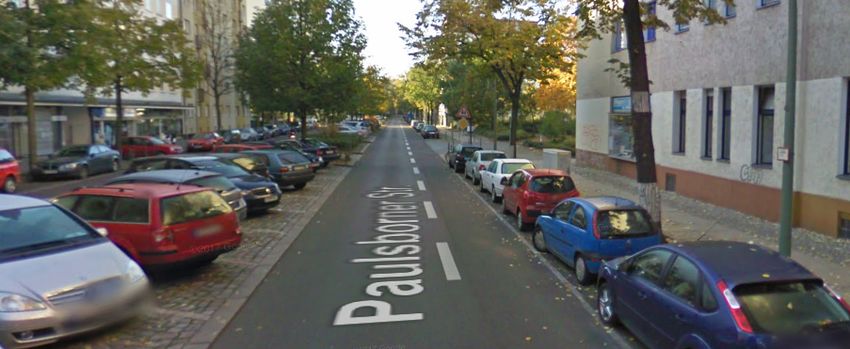
information, however, is currently not available as official accident statistics
only include crashes but not near miss incidents [1]. Yet, near miss incidents
are crucial to identify dangerous segments as actual crashes are only a
small subset of all dangerous situations. Moreover, waiting for statistical
significance in actual crashes would imply a large number of injured or dead
cyclists, i.e., it is crucial to analyze near miss incidents instead. Beyond using
such insights to improve city planning, information on near miss incidents
can also be used for dangerousness-aware routing or audio-visual warnings
for cyclists approaching dangerous areas. All such measures improve the
perceived and real safety of bicycle traffic, and by that are bound to increase
the traffic share of bicycles, thus, relieving traffic and environment.
    Unfortunately, traditional top-down approaches are not able to collect
information on near miss incidents: Such approaches involve sending police
officers to accident scenes who then file reports. If the authorities are not
notified about a near miss scene or choose not to dispatch a police officer,
the near miss incident will not be included in official statistics.
    Existing work on near miss incidents, e.g., [1], was done based on paper-
based surveys with a small number of participants over a short period. Also,
a number of authors have analyzed different aspects of bicycle safety (but not
near miss incidents), e.g., [2, 3, 4, 5]. Finally, several commercial products
aim to increase the safety of individual cyclist, e.g., by automatically notifying
emergency services upon a crash1 . Nevertheless, all these solutions do not
help to identify dangerous areas as one of the main obstacles, the lack of
near miss data, has not been solved yet.
    Today, the wide availability of smartphones and other mobile devices
offers new ways of data collection. In this paper, we hence propose to
follow a technology-supported crowdsourcing approach to collect information
on near miss incidents2 in bicycle traffic. For this purpose, we developed
a smartphone app that uses GPS to track routes of cyclists and built-in
motion sensors to detect incidents. Cyclists can annotate and upload their
anonymized rides to our processing platform where we collect, store, and
analyze the data. Thus, we make the following contributions:
   1. We describe the design of the SimRa3 platform, a crowdsourcing-based
      data collection and processing platform for cyclist routes and near miss

   1
     https://www.tocsen.com/, https://cosmoconnected.com/en/products/cosmo-city, or
https://wayguard.de/lightguard/
   2
     In the following, we refer to near miss incidents as “incidents”.
   3
     SimRa is a German acronym that stands for safety in bicycle traffic.

                                        2
incidents.
   2. We present our open source prototype which has been deployed in
      Berlin, Germany since March 2019, Bern, Switzerland since August
      2019, and Augsburg, Bochum, Pforzheim, Stuttgart (all Germany)
      since mid-September 20194 .
   3. We publish the ride data collected so far as open data.
   4. We describe a data visualization platform for such ride data and our
      data analysis process, including first results with insights into road
      safety for cyclists in Berlin.
    This paper is structured as follows: Building on related work, we give an
overview of the SimRa platform (section 3) and describe its data acquisition
process (section 4), the collected data (section 5), and the analysis process
(section 6). Then, we describe our implementation and deployment (section 7)
and evaluate SimRa based on examples (section 8). Finally, we discuss our
approach before drawing a conclusion.

2. Related Work

    Only with the broad availability of smartphones could crowdsourcing
become the popular method it is today. A prime example of such applications
is collecting cycling data to improve road safety which has the potential to
close gaps in official accident statistics [6].
    Previous work already proposes to use crowdsourcing for improving bicycle
safety: Blanc and Figliozzi [7, 5] developed a smartphone application to
collect information on users’ cycling experience after each of their trips. With
such information, it is possible to identify streets with poor cycling experience,
possibly due to safety concerns. The app, however, does not collect data on
near miss incidents or any data that could be used to identify them. Nelson
et al. [8] developed a website on which cyclist can place crash and near miss
incident markers. Similarly to them, we want to identify dangerous traffic
sections. They, however, do not collect the total ride number per section,
which is necessary to determine the frequency of incidents. Thus, it remains
unclear whether a given traffic section has many reported incidents due to
its dangerousness or due to the number of rides. Moreover, their incident
detection cannot be semi-automated and cyclists can report incidents at
locations they have never been to. As we will describe later, SimRa does

   4
    Please, note that the number of regions and recorded rides is subject to change. All
data presented in this paper is as of October 24, 2019

                                           3
not suffer from these shortcomings as we also record the rides and can thus
consider influence factors such as the number of rides or the length of a
street segment. In the Radmesser project [9], 100 Berlin-based cyclists were
equipped with distance sensors to identify close passes over a period of two
months. While this provides great insights, the project cannot scale and only
tracks close passes.
Besides these directly related approaches, other work focuses on improving
cycling safety through different methods (section 2.1) or uses crowdsourcing
data for a different purpose (section 2.2).
2.1. Improving Cycling Safety
Wu et al. [2] use several open datasets such as OpenStreetMap5 to predict
perceived cycling safety levels. They consider sociological and environmental
factors such as crime rates or the number of street lanes. These factors have
a direct and indirect influence on how cyclist perceive road safety. Yasmin
and Eluru [10] use a similar approach to predict cycling safety for specific
areas. In difference to both, we propose to use the cyclists themselves to
acquire accurate, user-curated information on incidents.
Strava6 is an application that collects crowdsourced cycling data. Many
studies rely on Strava data to analyze different cycling characteristics, e.g.,
[11, 3, 12, 13, 14]. Furthermore, Blanc and Figliozzi [7, 5] use Strava data to
measure and predict cycling ridership volumes in city traffic. The Strava data,
however, is highly biased since the Strava app is mainly used for recreational
activities [15].
Ferster et al [16] describe how specifically targeting cyclists with pro-
motion increases the amount of data submitted while targeting the general
public results in a greater diversity of users in terms of age and gender. Their
results as well as results by Yang et al. [17] could help us with recruitment of
additional users. Teschke et al. [18] evaluated which of 14 road types poses
the highest risk for cyclists. Unsurprisingly, quiet streets or streets with
dedicated bike infrastructure have the lowest risk of injury.
Other authors want to improve road safety in general, e.g., by automati-
cally detecting accidents based on automated analysis of traffic flow data [19]
or through visualization of traffic data [20]. Using collected road safety data
for route recommendation [21] can help to reduce incidents, as well.
5
https://planet.openstreetmap.org/
6
https://www.strava.com/
42.2. Crowdsourced Data Collection
In recent years, crowdsourcing has been used in a variety of domains, e.g.,
for traffic analysis [22, 23], archival of analog data and digital curation [24],
or location-based search [25]. Furthermore, a number of research projects
have developed smartphone apps for specific crowdsourcing purposes: Le
Dantec et al. [26] collect cycling data to make the infrastructure planning
process more data-driven, e.g., to optimize the placement of bike lanes or to
identify optimal synchronization schemes for traffic signals. With the app of
Aubrey et al. [27], users can report traffic offenses so that citizens improve
their respect for the traffic code. Cakmak et al. [28] proposed a cloud-backed
smartphone app to monitor heart failure patients in their daily lives. Stevens
and D’Hondt [29] implemented a smartphone app to collect information
on sound pollution. Neither of these approaches is directly comparable to
SimRa.
3. The SimRa Platform: An Overview
In this section, we give a general overview of the SimRa platform which
comprises all things related to the collection, storage, and analysis of crowd-
sourced cycling data which we will focus on in the following sections.
For data acquisition we rely on an app installed on the smartphones of
participating cyclists. This app collects data and detects incidents during
rides, lets users add comments or labels, and anonymizes the data before
uploading it to our servers (see section 4). The anonymized data comprises
information on cyclist routes, incidents, user demographics, as well as some
aggregated ride statistics (see section 5). Finally, we continuously process
and analyze collected data to gain insights into dangerous street segments
and intersections. For this, we have developed one approach for interactive
exploratory data analysis based on a web application and one for confirmatory
data analysis [30] which automatically derives a “dangerousness” score per
street segment and intersection (see section 6).
4. Data Acquisition
Our approach relies on crowdsourcing to collect necessary data; in fact,
SimRa is a citizen science project. For data acquisition, we could either
rely on dedicated hardware or use commonly available hardware such as
smartphones. While dedicated hardware has certain benefits, e.g., higher
measurement precision, such projects are inherently limited in scale: We
decided for project scalability and collect data with smartphones only. Our
51 Data Recording
2 Automated Incident Detection
3 Data Labeling and Annotation
4 Data Anonymization
5 Data Upload and Storage
Figure 1: In the data acquisition process, collected data is manually annotated and
anonymized before being uploaded to our backend servers.
goal is to collect data in a way that allows us (i) to identify incident hotspots
as well as the kind of incidents and (ii) to identify the routes of cyclists (in
which unnecessary detours are likely to identify severe incident hotspots).
Overall, our data acquisition process has five steps and follows the
structure shown in figure 1 (we describe the steps in the following sections
in detail). This process runs continuously and in parallel as cyclists may
create data for individual rides at any time. During a ride, we first record
sensor data using the built-in sensors of a cyclist’s smartphone (section 4.1).
Upon completion of a ride, we analyze the raw data to automatically detect
incidents (section 4.2). Afterwards, the cyclist can enrich collected data with
labels and annotations (section 4.3), use a number of anonymization measures
(section 4.4), and upload the data to our backend servers (section 4.5).
4.1. Data Recording
During a ride, we track three sensors at varying rates per minute. First,
we query the GPS sensor every three seconds; this returns the current location
and a radius with an accuracy confidence value of 68%. Second, we query
the smartphone’s accelerometer at 50Hz. While such a high sampling rate
allows us to detect sudden peaks, this also leads to an unnecessary large
data set which typically needs to be uploaded via mobile networks. Thus, we
aggregate the data based on a moving average across 30 values of which we
only consider every sixth value. This reduces the amount of data while still
retaining all peaks in sensor readings. Third, we store the device orientation
based on the smartphone’s gyroscope sensor every three seconds. Each sensor
measurement, together with a timestamp, is stored locally on the device.
6We chose these rate settings based on initial experiments in which we
identified the data collection rates and aggregation schemes as a sweet spot
between system overload and information loss.
4.2. Automated Incident Detection
After a ride, as soon as the cyclist stops the recording, we analyze the
recorded data to identify incidents. The challenge, here, is to reliably detect
incidents – initially, without any training data.
For this reason, we developed a heuristic for incident detection that
relies on the assumption that incidents will often materialize as sudden
acceleration spikes. Now, that we have over 10,000 labeled rides, we started
to explore alternative detection methods ranging from machine learning to
signals processing. In our heuristic, we group the acceleration time series in
three-second buckets to differentiate incidents and poor road conditions (e.g.,
potholes result in high vertical acceleration). In each bucket, we identify
the minimum and maximum value for every dimension and calculate the
difference between those two. In a second step, we categorize the six highest
difference values across all buckets as likely incidents. This allows us to
separate high acceleration values based on poor road conditions (which
usually have low difference values) from incident-related peaks.
In practice, this heuristic works well for cyclists with a “relaxed” cycling
style. For cyclists with a more “rapid” style of cycling, our heuristic usually
identifies either accidents, severe bumps, or traffic lights but usually not
incidents. The heuristic is also inherently limited as it cannot detect close
passes and similar incidents which do not materialize as acceleration spikes.
4.3. Data Labeling and Annotation
Even though we plan to improve the automated detection of incidents,
some incident types cannot be automatically detected based on the sensor
data alone. For example, while being tailgated might make the cyclist ride
faster, this kind of observable activity can also be related to other, non-
dangerous events. Thus, we do not think that a fully automated detection,
also based on our hardware limitations, is a realistic option for SimRa –
neither now nor in the future. Instead, we ask the cyclist to edit the pre-
detected set of incidents (i.e., add false negatives and ignore false positives)
and to label and annotate the correct set of incidents (see also section 5
which describes the resulting data in detail).
7Location Location
Timestamp Timestamp
1..*
1..*
1..*
1..*
Route Ride Incident
1..*
Acceleration Description
Device
Cyclist Data
Orientation
Figure 2: For each ride, we store route and incident data.
4.4. Data Anonymization
One of our side goals in SimRa is to preserve the privacy of our users,
which is mainly achieved through three mechanisms: Delayed recording allows
users to define a time and a distance threshold after which a recording will
start, ride cropping allows users to crop their ride manually to hide where
they started or arrived, and per-record pseudonymization stores demographic
and ride data separately so that rides cannot be connected to individual
users. Furthermore, each ride is pseudonymized separately.
4.5. Data Upload and Storage
Finally, and only when explicitly triggered by the cyclist, the ride data
is uploaded to our backend. For authentication, we calculate an access key
based on the current timestamp and a random salt which we update with
new app versions. This is necessary to avoid automated attacks on our
backend as we do not have a notion of user accounts. So far, this has sufficed
as extracting the salt from the app binary requires enough manual effort to
make this infeasible for automated attacks. Note, that we store rides and
user data per region so that we can analyze (geographic) regions separately
(we describe our concept of regions in section 5).
5. Collected Data
In this section, we describe the collected data in more detail. For each
region, we have two kinds of data sets: one for ride data (section 5.1) and
one for profile data (section 5.2).
5.1. Ride Data
Here, we use one file per ride; it comprises route and incident data (see
figure 2 for an overview). For each route, we store a sequence of geo-positions
(location) as well as acceleration and device orientation measurements along
8Age Ride Duration
Cycling
Wait Duration
Experience
Demographic
Information
Profile Statistics
Number of
Region
Ride Time Incidents
Gender
Histogram
Figure 3: For each profile we store statistical and demographic data.
with the corresponding timestamp. Beyond this, each file also contains a
list of incidents. For each of them, we store the corresponding location with
a timestamp, a description of the incident, and some information on the
cyclist (cyclist data). In the description, the cyclist can optionally describe
the details of what happened, list other participants involved in the incident
(e.g., taxi or pedestrian), indicate whether the incident was scary, and select
an incident type. For the incident type, we use the classification of Aldred
and Goodman [1]: Close Pass, someone pulling in or out, near left/right
hook, someone approaching head-on, tailgating, near-dooring, dodging an
obstacle, and “other”. In the cyclist data, we store general information on
the ride which might be useful for correlation analysis but will not identify
individual cyclists. In particular, we store the type of bike (e.g., racing bike),
the location of the phone during the ride (e.g., on the handlebar), but also
whether the bike had a trailer or was used to transport a child.
5.2. Profile Data
In the profile data, we store demographic data and aggregated ride
statistics per cyclist (see figure 3 for an overview). Cyclists have one (possibly
empty) profile per region. This data is not used to identify incident hotspots
but rather to support correlation analysis with demographic data that we
decided not to store as part of the rides for privacy reasons. The demographics
contain the cyclist’s age, gender, the number of years that they have cycled
(cycling experience), and the region. In the aggregated statics, we store
the total duration of recorded rides (ride duration), the total time spent
stationary, e.g., waiting at traffic lights (wait duration), the total number
of incidents recorded by the respective cyclist, and the ride time histogram
which shows the distribution of rides across the hours of day.
Based on this data, we could, e.g., answer the question of whether women
have more incidents per km than men and whether this varies across regions.
96. Data Processing and Analysis
The SimRa platform offers two options for data analysis: exploratory
and confirmatory data analysis [30]. While the first is used to identify new
and possibly unexpected insights in an interactive way, the latter is used
to calculate predefined metrics in a fully automated way. For exploratory
data analysis, we have designed a web application which allows users to
interactively explore the data set (section 6.1). For confirmatory data analysis,
we describe an automated analysis and scoring approach in section 6.2.
6.1. Exploratory Data Analysis
For exploratory data analysis, we have designed a web application that
allows users to interactively explore the collected data based on visual analysis.
The web application plots rides as lines and incidents as markers layered on
a map. A key feature is the set of filters through which users can filter rides
and incidents based on time or ride data properties as described in section 5.1.
Based on the web application, users can identify incident hotspots by first
looking for incident clusters and then comparing them to the number of rides
on a particular street segment or intersection.
6.2. Confirmatory Data Analysis
Our main goal is to identify incident hotspots, i.e., the most dangerous
street segments, so our current approach focuses on achieving this goal. It is,
of course, possible to add further analysis goals (e.g., road surface quality).
Data Model: To identify incident hotspots, we first translate the col-
lected data into a form where incidents can be mapped to intersections or
street segments. For this purpose, we have designed a simple graph model
that abstracts a map: nodes represent intersections7 , and edges represent
street segments in between intersections. Figure 4 shows an example of this.
Beyond this, our graph model is in fact a weighted graph so that we can
enrich it with ride and incident data. Each node has three weights. The first
(in the following r) describes the number of rides which we have recorded for
the respective intersection. The second and third are vectors of length eight
(there are eight incident types) and describe the number of scary (s) and
non-scary (n) incidents which we recorded for the respective intersection.
7
For our purposes, an intersection is a place more than two streets meet and a street is
any public way which may legally be used by cyclists.
8
Map data copyrighted by OpenStreetMap and available from openstreetmap.org
10Figure 4: Example: Map and graph representation of an area in Berlin8
Edges also use the same weights as nodes. In contrast to nodes, however,
the vectors s and n are eight-by-two matrices as we also need to consider
the ride direction during the incident. For the same reason, the number of
rides r is a vector of length two. Finally, edges also store the length l of the
respective street segment as some street segments, especially in downtown
areas, might be very short while others may span several kilometers.
Scoring: Based on this data model, we can calculate a score that
describes how dangerous a particular street segment or an intersection is.
Intuitively, more incidents means higher danger score. This, however, is not
necessarily true as dangerousness is essentially the ratio of incidents to rides.
We, hence, need to consider the number of rides in our scoring function.
Furthermore, we believe that scary incidents should have more impact on
the score than non-scary ones. Hence, we propose the following formula to
calculate the dangerousness score for street segments and intersections:
1
score = · (α · s + n) (1)
r
In that formula, α is the severity factor which affects how much more
weight we assign to scary incidents than to non-scary ones. A survey among
cyclists in Berlin indicates that 4.4 might be a good value for α.
For street segments, score is a matrix with the incident categories as
rows and street direction as columns; for intersections, score is a vector.
Both will usually be further aggregated based on the respective needs: First,
when the direction information of street segments is not relevant, the score
can further be simplified by summing up both columns pairwise. This makes
the comparison of streets and intersections easier since intersections do not
have a direction in our model. Similarly, the incident categories, i.e., the
respective row entries, can be summed up so that the result is one score
value for intersections and one score value per direction for street segments.
Of course, both aggregation methods can and will be combined in practice.
For improved comparability of street segments, we also need to account
11for the length differences, especially when the length of the shortest and
the longest street segment is very different. For this purposes, we propose a
length-adjusted score for street segments:
1
score = · (α · s + n) (2)
r·l
Length-adjusted scores can be aggregated in the same way as the standard
scores. Although they are useful for better comparison of street segments,
they further complicate the comparison of street segments and intersections.
Based on these scores, we can identify incident hotspots by using either
a top-k approach or by manually defining a threshold score. We suggest to
only accept nodes or edges as incident hotspots if the respective number of
rides exceeds a minimum, e.g., depending on the size of the data set.
Model Population: For automated data analysis, the model above
needs to be populated with data. As the SimRa data set specifies incidents
and rides based on a sequence of GPS locations and not based on street
segments and intersections, we first need a mapping from coordinates to our
model. For this, we propose to enhance the edges and nodes in our model with
a polygon each describing the geo-shape of the respective intersection or street
segment. Such data can be obtained manually for small areas or automatically
from digital cadastres and public sources such as OpenStreetMap.
In a second step, the SimRa data set can then be mapped onto the model
by checking for each location contained in a ride file in which polygon it is
contained. While we discard GPS values with low accuracy in the smartphone
app, it may still be necessary to smooth the GPS trace. In practice, this
is usually done either based on Kalman filters or the least squares method.
Especially the latter approach is likely to be a good fit as the set of correct
values, i.e., streets and intersections, is limited.
After smoothing and matching, we can easily determine how many rides
are going through an intersection or street segment and can also map incidents
to the corresponding street segment or intersection.
7. Implementation and Deployment
The SimRa platform comprises several software systems and prototypes:
We have implemented the data acquisition process from section 4 in two
smartphone apps. The Android and Lineage OS app has been implemented in
Java using OpenStreetMap; The iOS app has been implemented in Objective-
C using standard platform libraries. Screenshots of both the iOS and Android
1210000
Region
All
8000 Berlin
Bern
Number of Rides
6000 Augsburg
Pforzheim
Bochum
4000 Stuttgart
2000
0
Apr May Jun Jul Aug Sep Oct Nov
Month in 2019
Figure 5: The total number of recorded rides is steadily growing; Berlin has the most rides
as it is a major city and also the city where we initially launched the app.
Table 1: Distribution of incident types across all rides as of Nov 1, 2019.
Incident Type Scary Incidents Non-scary Incidents
Close Pass 402 1176
Someone pulling in or out 71 333
Near left or right hook 195 546
Someone approaching head on 78 525
Tailgating 42 128
Near-Dooring 29 70
Dodging an obstacle 110 1519
Other 227 1722
versions of the app can be found online9 . Our backend service is a REST-
based storage server implemented in Java. Both apps and the backend
service are available as open source9 . The processing and analysis parts from
section 6 are currently in a prototype state. We will make them available as
open source as soon as they reach a stable state.
For the deployment, we started recruiting citizen scientists in Berlin in
September 2018. Together with them, we defined requirements and necessary
features for the app. Using first prototypes, we gradually morphed into a
9
https://github.com/simra-project
13Table 2: Base data for all street segments with Leibnizstraße having the most rides, followed
by Paulsborner Straße and Edisonstraße .
Street Segment Number of Rides Length of Street Segment
Edisonstraße 79 230m
Leibnizstraße 194 628m
Paulsborner Straße 184 600m
beta testing phase around February 2019. In mid-March 2019, we released
the Android app in the Google Play Store10 , deployed our backend on three
TU Berlin servers, and opened the “Berlin/Potsdam” region. In the last week
of May 2019, we also released the iOS app in the App Store11 . Afterwards,
initiatives from several cities expressed interest in using the SimRa platform.
As a result of this, we started the “Bern, Switzerland” region in early August
2019, as well as four more German regions in mid-September 2019 (“Augsburg”
and “Pforzheim”) and mid-October 2019 (“Bochum” and “Stuttgart”).
As of today (Nov 1, 2019), we have a steadily growing number of recorded
rides and – since the curve is, at least in the summer months, slightly super-
linear apparently also of users. Figure 5 shows the total number of rides
recorded with the SimRa platform since the release of the Android app and
table 1 shows the total number of incidents recorded until October 24 2019.
We continuously publish all recorded raw data9 .
8. Evaluation
As our approach is hard to evaluate in its entirety, we evaluate it based
on a use case. For this purpose, we picked three street segments in Berlin;
each has a significant number of rides. Specifically, we used our prototype for
exploratory data analysis to pick three street segments in Berlin: Edisonstraße
which appears to be an incident hotspot, Leibnizstraße which appears to
be relatively safe based on the number of incidents, and Paulsborner Straße
which has an average number of incidents.
For each of the street segments, we calculate the incident score as de-
scribed in section 6.1 and discuss the findings from our data set based on
a photo of the street segment from Google Streetview. Specifically, we use
this evaluation to also discuss the limitations of our approach. Note, that we
disregard the direction of the ride due to the (still) limited number of rides.
10
https://play.google.com/store/apps/details?id=de.tuberlin.mcc.simra.app
11
https://apps.apple.com/gb/app/simra/id1459516968
14Table 3: Observed number of incidents and calculated score in Edisonstraße for α = 4.4
Incident Type No. of Incidents Score
Scary Non-Scary [10−2 ]
Dodging an Obstacle 18 25 131.90
Total 18 25 131.90
Length-Adjusted Score [10−4 ] 57.35
Table 4: Observed number of incidents and calculated score in Leibnizstraße for α = 4.4
Incident Type No. of Incidents Score
Scary Non-Scary [10−2 ]
Close Pass 1 0.51
Someone Pulling In or Out 1 2.27
Near Left or Right Hook 1 1 2.78
Tailgating 1 2.27
Near-Dooring 1 0.51
Dodging an Obstacle 1 3 3.81
Other 1 2 3.30
Total 5 8 15.46
Length-Adjusted Score [10−4 ] 2.46
For our analysis, we deviated slightly from our model in that we defined
our street segments based on the closest two intersections with a major street;
all analysis is based on data as of Oct 24, 2019. Table 2 gives an overview of
the resulting lengths and number of rides.
Based on these settings, we retrieved the respective number of incidents
from the ride files and calculated the scores. Tables 3 - 5 show the resulting
data, excluding incident types without occurrence. With length-adjusted
scores of about 57, 2.5, and 3.2, Edisonstraße appears by far to be the most
dangerous of these streets while Paulsborner Straße is more dangerous than
Leibnizstraße (intuitively, these scores are the average number of incidents
per meter per ride in that street segment represented as 10−4 ). For each of
these streets, we analyzed the results based on Google Streetview and also
visited two of the three street segments.
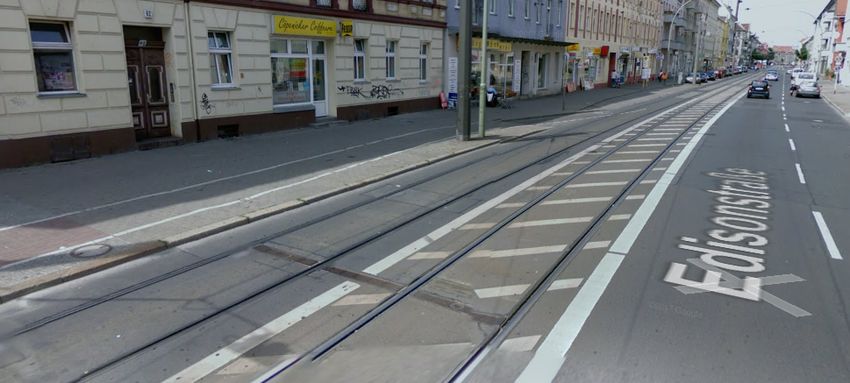
Edisonstraße: Here, the main problem appears to be dodging obstacles.
When taking a look at the incident descriptions, it becomes clear that cars
are frequently blocking the bike lane or are parking in second row. When
cyclists traveling towards the viewer (in the left part of figure 6) are blocked
by an illegally parked car, they are not only confronted with other cars
15Table 5: Observed number of incidents and calculated score in Paulsborner Straße for
α = 4.4
Incident Type No. of Incidents Score
Scary Non-Scary [10−2 ]
Close Pass 4 12 16.09
Someone Approaching Head On 3 1.63
Dodging an Obstacle 1 0.54
Other 2 1.08
Total 4 18 19.34
Length-Adjusted Score [10−4 ] 3.22
Figure 6: On Edisonstraße, illegally parked cars force cyclists to merge into high-speed car
traffic on top of tram tracks (screenshot from Google Streetview).
usually driving much faster. They also need to avoid the tracks of the tram
line which can easily trip a cyclist. Based on this, we conclude that this
street segment is an incident hotspot and a very dangerous place for cyclists.
Leibnizstraße: Based on the collected data, Leibnizstraße appears to be
fairly safe. We also analyzed the written incident descriptions in comparison
to what we found on-site. The street segment has a bike lane (though in
poor condition) separated from street traffic, right next to the sidewalk (in
the left part of figure 7). As such, it is not unexpected to find few incidents
that are caused by having a shared bike/car infrastructure. Nevertheless, we
see the usual conflicts with pedestrians and the occasional left/right hook
of a car driver. Fortunately, the latter is uncommon as the other streets
at intersections are low traffic neighborhood streets. Overall, we conclude
that this street segment is indeed relatively safe; safety in intersections and
separation from pedestrians, however, could be improved.
16Figure 7: Leibnizstraße is a low traffic neighborhood street with a separate bike lane which
leads to relatively few near miss incidents (screenshot from Google Streetview).
Paulsborner Straße: Based on the collected data, Paulsborner Straße
appears to be a bit more dangerous than Leibnizstraße but not in a way
comparable to Edisonstraße. The main problem, which we also identified
based on the written descriptions, is close passes. When looking at the
Streetview Photo in figure 8, the reason for this becomes obvious: Cyclists
traveling in the bike lane on the street tend to ride almost on the dashed
line to avoid the dangerous dooring area next to the parked cars on the right.
This, however, means that any car passing the cyclist will keep a distance
between 0.5m and 1m which qualifies as a close pass (and is also illegal in
Germany). Nevertheless, the dashed line suggests to drivers that it is safe to
pass the cyclist. While we did not measure, it appears to be impossible to
pass a cyclist in a car (no matter where the cyclist is positioned) without
violating the minimum passing distance as the car lane is rather narrow.
Contrary to the score metric, this street segment should therefore be
classified as a dangerous place even though it is not an incident hotspot. We
believe that this is due to the fact that close passes cannot be detected by
our measurement approach and need to be marked manually. In conversation
with users, we have heard that many users mark only critical close passes
as there are too many of them in daily cycling. This is also in line with the
findings of Aldred and Goodman who discovered that 37% of all observed
incidents were close passes with 98% being caused by motor vehicles and
about half of them being perceived as “on purpose”. We believe that this is
a limitation of our approach which we discuss in more detail in section 9. As
such, we have to assume that our approach underestimates the number of
17Figure 8: On Paulsborner Straße, cyclists and cars have to share the road which explains
the high amount of close passes (screenshot from Google Streetview).
close passes which we should consider in our detection of incident hotspots.
We plan to use the numbers of Aldred and Goodman to calculate an adjusted
number of close passes.
9. Discussion
Our approach has a number of inherent limitations which we will discuss
in this section.
First, only a limited number of incident types can be detected based on
the acceleration sensor measurements. Specifically, our approach can only
detect situations which caused sudden movement of the cyclist, e.g., swerving
to the side or braking. This implies that our approach can only detect close
passes in case of really inexperienced cyclists who are not yet used to being
threatened that way or when the close pass is a very narrow miss. Likewise,
tailgating is not detectable directly unless the smartphone is in a jacket
pocket and the cyclist keeps turning around as this results in a repeated
circular motion. We counter this limitation by having the manual labeling
and annotation phase after each ride which allows users to add such incidents.
These, however, will rarely be complete as there will be an (individual)
upper limit on the number of incidents that a cyclist can remember which is
especially problematic on long rides with many incidents. As such, our data is
very likely to underestimate the actual number of incidents. We are currently
considering options for a feature that offers live tagging, e.g., pressing a
hardware button, or selecting the category directly on the smartphone screen
during the ride. While additional sensors would naturally improve the overall
data quality, this inherently limits the number of participants. Nevertheless,
18we are currently working on a feature that allows users to connect additional
sensors to the smartphone app, e.g., distance sensors to detect close passes.
Second, one might argue that all incidents which we record are subjective
and not objective. This is indeed correct and desired as the perceived safety,
a subjective measure, is the key influence factor for mobility choices.
Third, our user group is not necessarily a representative subset of the
cycling population. In particular, we are unlikely to have senior citizens using
our apps even though they may still be cycling. We plan to compare our
user group to official cycling statistics and derive corresponding aggregated
incident metrics based on the profile data described in section 5.2.
Fourth, there is a margin of human error, due to the nature of crowdsourc-
ing: For instance, users may forget to stop the recording of their ride once the
destination has been reached. For that case, the mobile app’s privacy slider
can be used to crop the ride later on. Even if the ride is uploaded without
cropping, we can easily detect such a ride and crop it automatically. Users
could also record rides with a non-bicycle transportation mode, whether
intentionally or not. In most cases, we can also detect this easily based on the
velocity of the ride – there may, however, be false positives (e.g., with racing
bikes) or false negatives (e.g., with electric scooters). Finally, if incidents
are mislabeled or not labeled at all, this can currently not be detected auto-
matically. We are currently exploring the use of machine learning methods
for improved detection of incidents. Overall, we believe SimRa can provide
valuable insights. While they may not be perfect, they are far better than
anything available at the moment.
10. Conclusion
Increasing the modal share of bicycle traffic is a key mechanism to reduce
traffic-related emissions but also to reduce traffic jams and the amount of
space devoted to cars in inner city areas. In practice, however, polls regularly
show that a lack of (perceived) safety keeps people from using their bikes
more frequently. City planners who hence aim to improve bicycle safety need
not only information on accidents but also on the much more frequent near
miss incidents. Such information, however, is not broadly available at the
moment.
In this paper, we proposed to close that gap based on the crowdsourcing
platform SimRa: In SimRa, participants record their rides using a smartphone
app which uses acceleration sensors to detect near miss incidents. In a second
step, users annotate and label the collected data before they upload it to our
analytics backend. There, we use exploratory data analysis methods based on
19a visualization toolkit as well as an automated scoring approach to identify
incident hotspots. Beyond the proposed platforms and the description of
its deployment in Berlin since March 2019 (and other cities later), our
contributions include the collected data set as well as first analysis insights.
Acknowledgement
We would like to thank all supporters of the project, especially TU Berlin
for funding the project, Christoph Krey for implementing the iOS app version,
and of course all our users.
References
[1] R. Aldred, A. Goodman, Predictors of the frequency and subjective
experience of cycling near misses: Findings from the first two years of
the uk near miss project, Accident Analysis & Prevention 110 (2018).
[2] J. Wu, L. Hong, V. Frias-Martinez, Predicting perceived cycling safety
levels using open and crowdsourced data, in: Proc. of Big Data, IEEE,
2018.
[3] B. Jestico, T. Nelson, M. Winters, Mapping ridership using crowdsourced
cycling data, Journal of Transport Geography 52 (2016).
[4] A. Medury, O. Grembek, A. Loukaitou-Sideris, K. Shafizadeh, Investigat-
ing the underreporting of pedestrian and bicycle crashes in and around
university campuses - a crowdsourcing approach, Accident Analysis &
Prevention (2017).
[5] B. Blanc, M. Figliozzi, Safety perceptions, roadway characteristics, and
cyclists’ demographics: A study of crowdsourced smartphone bicycle
safety data, Transportation Research Board 96th Annual Meeting (2017).
[6] M. Branion-Calles, T. Nelson, M. Winters, Comparing crowdsourced
near-miss and collision cycling data and official bike safety reporting,
Transportation Research Record Journal of the Transportation Research
Board 2662 (2017).
[7] B. Blanc, M. Figliozzi, Modeling the impacts of facility type, trip
characteristics, and trip stressors on cyclists comfort levels utilizing
crowdsourced data, Transportation Research Record 2587 (1) (2016).
20[8] T. A. Nelson, T. Denouden, B. Jestico, K. Laberee, M. Winters,
Bikemaps.org: A global tool for collision and near miss mapping, Fron-
tiers in Public Health 3 (2015).
[9] Der Tagesspiegel, Radmesser, interaktiv.tagesspiegel.de/radmesser/, ac-
cessed August 16, 2019, 2019.
[10] S. Yasmin, N. Eluru, Latent segmentation based count models: Analysis
of bicycle safety in montreal and toronto, Accident Analysis & Prevention
95 (2016).
[11] W. Musakwa, K. M. Selala, Mapping cycling patterns and trends using
strava metro data in the city of johannesburg, south africa, Data in
Brief 9 (2016).
[12] H. Wang, C. Chen, Y. Wang, Z. Pu, M. B. Lowry, et al., Bicycle safety
analysis: Crowdsourcing bicycle travel data to estimate risk exposure
and create safety performance functions (2016).
[13] J. Lee, M. Abdel-Aty, An assessment of traffic safety between drivers and
bicyclists based on roadway cross-section designs and countermeasures
using simulation (2018).
[14] H. H. Hochmair, E. Bardin, A. Ahmouda, Estimating bicycle trip volume
for miami-dade county from strava tracking data, Journal of Transport
Geography 75 (2019).
[15] G. P. Griffin, J. Jiao, Crowdsourcing bicycle volumes: Exploring the
role of volunteered geographic information and established monitoring
methods (2019).
[16] C. Ferster, T. Nelson, K. Laberee, W. Vanlaar, M. Winters, Promoting
crowdsourcing for urban research: Cycling safety citizen science in four
cities, Urban Science 1 (2) (2017).
[17] D. Yang, G. Xue, X. Fang, J. Tang, Incentive mechanisms for crowd-
sensing: Crowdsourcing with smartphones, IEEE/ACM Trans. Netw.
24 (3) (2016).
[18] K. Teschke, M. A. Harris, C. C. Reynolds, M. Winters, S. Babul, M. Chip-
man, M. D. Cusimano, J. R. Brubacher, G. Hunte, S. M. Friedman,
M. Monro, H. Shen, L. Vernich, P. A. Cripton, Route infrastructure
and the risk of injuries to bicyclists: A case-crossover study, American
Journal of Public Health 102 (12) (2012).
21[19] M. Ozbayoglu, G. Kucukayan, E. Dogdu, A real-time autonomous
highway accident detection model based on big data processing and
computational intelligence, in: Proc. of Big Data, IEEE, 2016.
[20] A. Imawan, J. Kwon, A timeline visualization system for road traffic
big data, in: Proc. of Big Data, IEEE, 2015.
[21] F. A. Santos, D. O. Rodrigues, T. H. Silva, A. A. F. Loureiro, R. W.
Pazzi, L. A. Villas, Context-aware vehicle route recommendation plat-
form: Exploring open and crowdsourced data, in: Proc. of ICC, IEEE,
2018.
[22] T. Koita, S. Suzuki, Crowdsourcing and its application for traffic survey
work, in: Proc. of ICBDA, IEEE, 2019.
[23] E. Barka, C. A. Kerrache, N. Lagraa, A. Lakas, Behavior-aware uav-
assisted crowd sensing technique for urban vehicular environments, in:
Proc. of Annual Consumer Communications Networking Conference
(CCNC), IEEE, 2018, pp. 1–7.
[24] R. Cox, S. Shah, W. Frederick, T. Nelson, W. Thomas, G. Jansen,
N. Dibert, M. Kurtz, R. Marciano, A case study in creating transparency
in using cultural big data: The legacy of slavery project, in: Proc. of
Big Data, IEEE, 2018.
[25] G. Chatzimilioudis, A. Konstantinidis, C. Laoudias, D. Zeinalipour-
Yazti, Crowdsourcing with smartphones, IEEE Internet Computing
16 (5) (2012).
[26] C. A. Le Dantec, M. Asad, A. Misra, K. E. Watkins, Planning with
crowdsourced data: Rhetoric and representation in transportation plan-
ning, in: Proc. of CSCW, ACM, 2015.
[27] E. Aubry, T. Silverston, A. Lahmadi, O. Festor, CrowdOut: A mobile
crowdsourcing service for road safety in digital cities, in: Proc. of
PerCom, IEEE, 2014.
[28] A. S. Cakmak, E. Reinertsen, H. A. Taylor, A. J. Shah, G. D. Clifford,
Personalized heart failure severity estimates using passive smartphone
data, in: Proc. of Big Data, IEEE, 2018.
[29] M. Stevens, E. DHondt, Crowdsourcing of pollution data using smart-
phones, in: Workshop on Ubiquitous Crowdsourcing, ACM, 2010.
22[30] D. Bermbach, E. Wittern, S. Tai, Cloud service benchmarking, Springer,
2017.
23You can also read