Pope Branch Subwatershed
              Action Plan
←
→
Page content transcription
If your browser does not render page correctly, please read the page content below
Pope Branch Subwatershed
Action Plan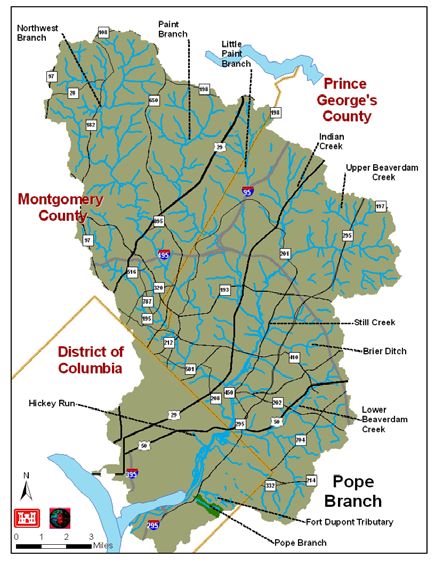
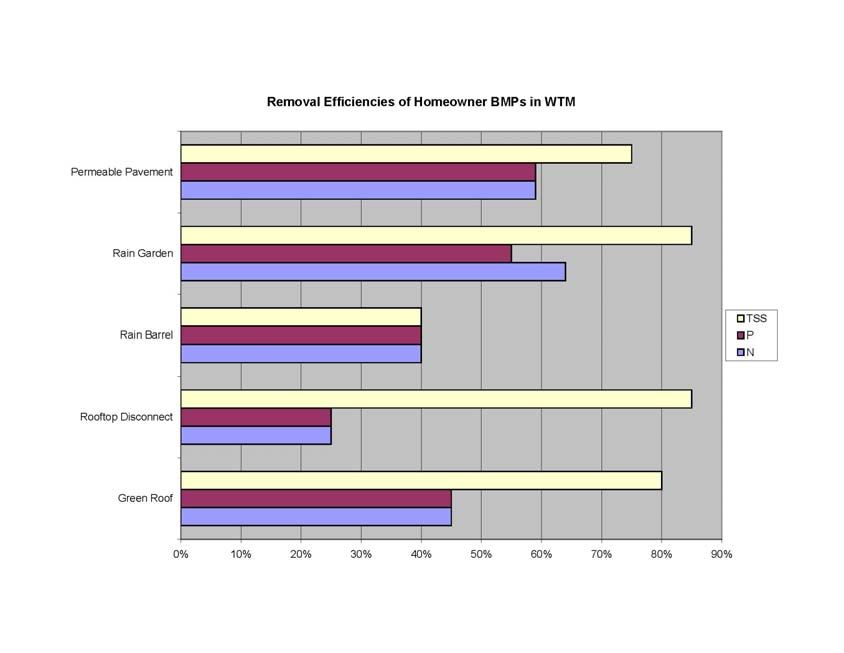
Table of Contents

Section 1: Vision and Existing Conditions                            7
     Need and Purpose                                                8
     10-Year Vision                                                  9
     Pope Branch 2020 Restoration Targets                           10
     Existing Conditions in the Pope Branch Subwatershed            10
     Problems Facing the Pope Branch Subwatershed                   15
           Changes to Hydrology                                     15
           Poor Aquatic Habitats                                    15
           Poor Water Quality                                       15
           Trash                                                    16
           Flooding                                                 16
     Existing Pollutant Loads                                       18

Section 2: Inventory of the Potential
Restoration Projects                                                19
     Inventory of the Potential Restoration Projects                20
     Results of the Evaluation and Scoring of
        Restoration Actions in Pope Branch Subwatershed             25
           Stormwater Management                                    25
           Stream Restoration                                       27
           Wetland Creation                                         27
           Fish Blockage Removal and Modification                   28
           Riparian Reforestation and Invasive Species Management   29
           Trash Reduction                                          30
           Parkland Acquisition                                     30
     Summary of Recommended Restoration Actions                     31
     Implementation Type of Potential Restoration Actions           32

Section 3: Evaluation and Discussion
of the Restoration Strategies                                       33
     Evaluation of Proposed Restoration Projects                    34
     Potential to Reduce Stormwater Pollutant Loads                 34
     Potential to Reduce Peak Flow Discharge                        36
     Potential to Reduce Pollutant Loads Using Street Sweeping      38
     Pollutant Reduction of Homeowner Stormwater Management         41

Section 4: 10-Year Targets and Milestones                           49
     Pope Branch 10-Year Targets and Milestones                     50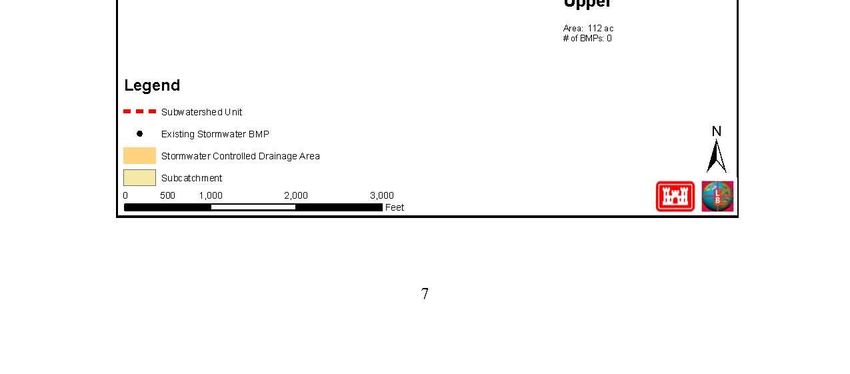
List of Figures

Figure 1-1: Impervious Surfaces in Pope Branch Subwatershed   11
Figure 1-2: Pope Branch Subwatershed                          12
Figure 1-3: Pope Branch Subwatershed Planning Units           13
Figure 1-4: Pope Branch Subwatershed Current BMPs             14
Figure 3-1: Homeowner BMP Scenarios                           43
Figure 3-2: Removal Efficiencies of Homeowner BMPs in WTM     44
Figure 3-3: Maximum Potential Pollutant Reduction             47
List of Tables

Table 1-1: Impervious Surfaces in the Pope Branch Subwatershed and
        Existing Level of Stormwater Control                                              11
Table 1-2: Nutrient Loading Estimates for Pope Branch Subwatershed and
        Comparison Values                                                                 17
Table 1-3: TMDL Reduction Goals                                                           17
Table 2-1: 2020 Pope Branch Restoration Objectives                                        21
Table 2-2: Inventory of Restoration Projects in the Pope Branch Subwatershed              22
Table 2-3: Proposed Restoration by Type in the Pope Branch Subwatershed                   23
Table 2-4: Provisional Restoration Project Estimated Unit Costs                           24
Table 2-5: Potential Stormwater Projects within the
        Pope Branch Subwatershed                                                          26
Table 2-6: Potential Stream Restoration Projects within the Pope Branch Subwatershed      27
Table 2-7: Potential Wetland Creation or Restoration Projects within the
        Pope Branch Subwatershed                                                          27
Table 2-8: Potential Fish Blockage Removal or Modification Projects within the
        Pope Branch Subwatershed                                                          28
Table 2-9: Potential Riparian Reforestation and Invasive Species Management
        Candidate Projects within the Pope Branch Subwatershed                            29
Table 2-10: Potential Trash Reduction Projects within the Pope Branch Subwatershed        30
Table 2-11: Potential Parkland Acquisition Projects within the Pope Branch Subwatershed   30
Table 2-12: Summary of Recommended Potential Restoration Actions                          31
Table 2-13: Summary of Potential Restoration Actions                                      32
Table 3-1: Level of Stormwater Control in Pope Branch Subwatershed
        After implementation of All Proposed Stormwater Projects                          35
Table 3-2: Evaluation of Stormwater Control Levels and
        Potential in Pollutants Load Reduction                                            35
Table 3-3: Ability of Stormwater Control Levels to
        Address TMDL Goals in Pope Branch Subwatershed                                    36
Table 3-4: Peak Flow Analysis Results for Pope Branch Subwatershed                        37
Table 3-5: Pollutant Reduction Estimate of Weekly Street Sweeping (Streets Only)          39
Table 3-6: Pollutant Reduction Estimate of Weekly Sweeping of Parking Lots                40
Table 3-7: Total Pollutant Reduction Estimate of Weekly
        Sweeping of All Streets and Parking Lots                                          40
Table 3-8: Pope Branch Subwatershed Impervious Acres Analysis of Residential Homes        41
Table 3-9: Removal Efficiencies of Homeowner BMPs in WTM                                  44
Table 3-10: Pollutant Reduction of Homeowner Stormwater Control Scenarios                 45
Table 3-11: Percent Reduction of Pollutants Estimated for
        Homeowner Scenarios and Acreage Controlled                                        45
Table 3-12: Maximum Potential Pollutant Reduction for Stormwater Controls,
        Homeowner BMPs, and Street Sweeping                                               47
Section 1 Vision and Existing Conditions
The Pope Branch Subwatershed Action Plan (SWAP) is intended to be an integrated summary
document for the Pope Branch Subwatershed Environmental Baseline Conditions Report and the
Pope Branch Subwatershed Provisional Restoration Projects Inventory. Based on a planning
level analysis and evaluations, various activities or actions have been identified as part of a 10-
year comprehensive restoration plan for the Anacostia River watershed. In addition, the layout
of the report is intended to follow as closely as possible the EPA nine key elements to develop a
watershed plan to improve water quality impairments, and are the minimal requirements to be
eligible to receive incremental Clean Water Act Section 319 funding (EPA, 2008).

Need and Purpose

The Anacostia River watershed is primarily confined to an urban landscape, characterized by an
alteration of the natural landscape features to accommodate the population growth and urban
sprawl that has occurred over the decades. The increase in impervious areas disrupted the
natural hydrologic cycle and ultimately affected the environmental health of the Anacostia River
and its tributaries. Urbanization throughout the years caused excessive runoff and a reduction in
groundwater recharge, a reduction in water quality through the transport of pollutants, a loss of
riparian areas, and ultimately a degradation of the watershed’s ecological habitat. It is
imperative that actions be taken to protect it from further deterioration and restore the ecosystem
to the greatest extent possible.

While urbanization and impervious surfaces are the primary stressors for the overall Anacostia
River watershed, there is regional variation throughout the watershed and as such, the extent and
source of the environmental stressors as well as potential restoration actions will be evaluated on
a subwatershed basis. As part of the Anacostia Restoration Plan (ARP) study, each of the 14
primary subwatersheds and the Tidal Anacostia River reach were evaluated in order to determine
problems and opportunities at the subwatershed scale for environmental or ecological restoration,
and present this information in such a way that would be beneficial to several different
audiences. In addition, for each of the 14 primary subwatersheds and the Tidal Anacostia River
reach, a SWAP, an environmental baseline conditions report, and a subwatershed provisional
restoration project inventory was generated.

The purpose of the Pope Branch SWAP is to provide a vision statement and targets for
restoration within the subwatershed by the year 2020, identify and describe specific problems
within the subwatershed, discuss methodologies used to evaluate potential restoration
opportunities, and present a prioritized list of restoration opportunities for implementation.

Pope Branch Subwatershed Action Plan                                                      8
The identification of restoration opportunities and potential projects were based on the following
selected strategies:
1. Stormwater Management Retrofits
2. Stream Restoration
3. Wetland Creation and Restoration
4. Fish Blockage Removal/Modification
5. Riparian Reforestation, Meadow Creation, Street Tree, and Invasive Species
Management
6. Trash Reduction
7. Toxic Remediation
8. Parkland Acquisition
Building upon the preceding eight restoration strategies, the following 2020 restoration
objectives align with and expand upon the existing Anacostia River watershed restoration goals
and requirements established by the Anacostia Watershed Restoration Partnership (AWRP):
1. Stormwater Management: Implement stormwater retrofits or Best Management
Practices (BMPs) to reduce pollutant loading and increase flow regime stability.
Increase use of homeowner BMPs throughout the subwatershed.
2. Wetland Creation and Restoration: Increase wetland habitat throughout the
subwatershed.
3. Riparian Corridors: Increase the health of riparian corridors so as to both improve
wildlife habitat connectivity and reduce the number of invasive plant problem sites.
Also, increase overall tree canopy coverage throughout the subwatershed.
4. Aquatic Community: Increase the health of the aquatic community; specifically
increase the number of resident fish species and providing for a healthier
macroinvertebrate community food base. Restore migratory fish usage of Pope
Branch.
5. Trash Reduction: Dramatically reduce trash loads in Pope Branch.
6. Outreach: Increase participation of residents, businesses, and school-age children in
activities that are beneficial to the watershed.
7. Parkland Acquisition: Increase parkland and habitat connectivity
10-Year Vision
The Pope Branch subwatershed vision is to create, by the year 2020, a more environmentally
healthy and sustainable watershed by dramatically reducing stormwater runoff volumes, stream
channel erosion problems, trash levels and pollutant loadings; protecting and restoring aquatic
and terrestrial habitats and associated biological communities; enhancing watershed recreational
opportunities; and fully engaging both public and private sectors through expanded
environmental education and incentive-based initiatives. The preceding objectives are a
continuation of and expansion on the AWRP’s existing Anacostia River watershed goals, leading
to the achievement of realistic and attainable restoration targets within the next decade.
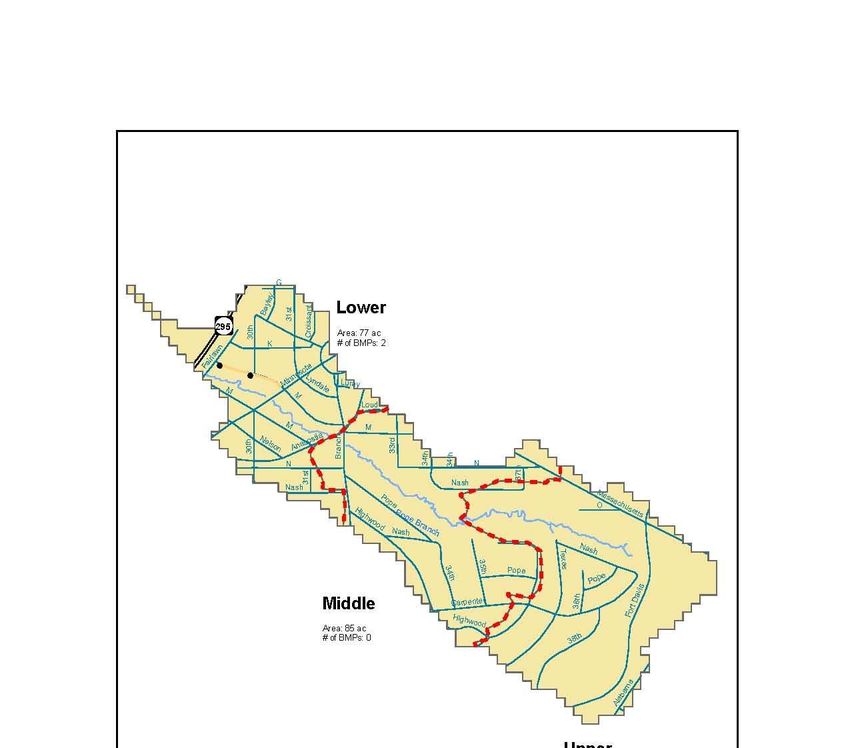
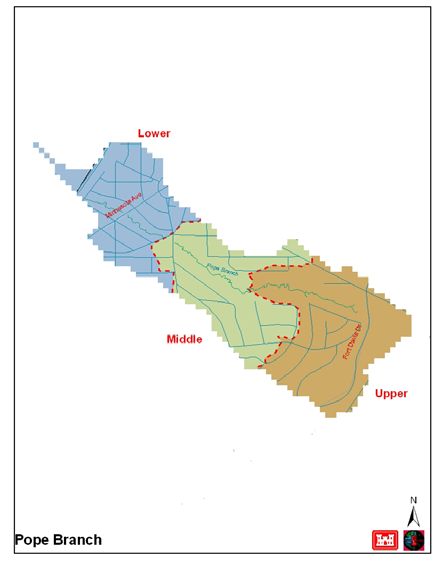
Pope Branch Subwatershed Action Plan 9Pope Branch 2020 Restoration Targets The Pope Branch 2020 Restoration Targets were determined based on the potential implementation of restoration opportunities identified within the Pope Branch subwatershed as part of the ARP, along with realistic expectations of what could be accomplished in ten years to meet the 2020 restoration objectives. These targets are established to ensure that restoration of the subwatershed is proceeding in the right direction and at a continuous, reasonable pace. The analysis presented in this SWAP will help to establish specific target levels of restoration for the subwatershed. Quantitative targets established such as stormwater management, aquatic community, trash reduction, wetland creation/restoration, riparian corridor restoration, and land acquisition, will be based on the potential restoration project inventory and recommend acreages or mileages to be restored, whereas the qualitative targets including environmental programs and public outreach will recommend programmatic actions that will serve to increase public awareness and interest in the restoring the Anacostia watershed. The 2020 Restoration Targets are presented in Section 4 of this SWAP. Existing Conditions in the Pope Branch Subwatershed The Pope Branch subwatershed, which has a drainage area of 0.4 square miles (or approximately 261 acres), is located in the south east vicinity of the Anacostia River watershed (Figures 1-2 and 1-3). The Pope Branch subwatershed is located entirely in Washington D.C. The majority of the Pope Branch main stem flows within an open, natural channel with generally moderately eroding banks. The lower 1,385 feet of Pope Branch is piped and there are no remaining open tributaries. Approximately 78-percent of the total subwatershed is developed. Overall, Pope Branch subwatershed is a densely populated area; having a population density of 3,500 per square mile with 10.7-percent of the subwatershed classified as high-density residential. The three major land uses in the subwatershed are (1) medium-density, single family residential, (2) National Park Service (NPS) and District of Columbia Department of Parks and Recreation parkland, and (3) high-density garden apartments. Impervious surfaces make up about 32- percent of the subwatershed, with approximately 36-percent of the subwatershed being forested. Figure 1-1 and Table 1-1 present a summary of the impervious surfaces within the Pope Branch subwatershed and associated stormwater controls. Currently, approximately 0.14-percent (0.37 acres) of the impervious acreage in the Pope Branch subwatershed has stormwater controls via only 2 existing Best Management Practice (BMP) sites (Figure 1-4). Pope Branch Subwatershed Action Plan 10
Impervious     Surfaces
                  Figure 1-1: Impervious   in theinPope
                                         Surfaces        Branch
                                                    the Pope BranchSubwatershed
                                                                    Subwatershed

                        19%
                                                                             Roads
                                                               49%
                                                                             Parking Lots
                                                                             Roofs
                                                                             Other
                  30%
                                         2%

                     Table 1-1: Impervious Surfaces in the Pope Branch
                           Watershed and Existing Level of Control
                                                         Miles   Acres
                    Roads                                 8.5     40.3
                      State/Federal                       0.0      0.0
                      Local                               8.5     40.3
                    Parking Lots                           …       2.1
                      Public/Institutional                 …       0.0
                      Private                              …       2.1
                    Roofs                                  …      25.7
                      Public/Institutional                 …       0.0
                      Private                              …       2.0
                      Single Family                        …      23.7
                    Other                                  …       16.4
                      Sidewalks                            …       4.1
                      Single Family Driveways              …      12.3

                    Total Impervious Acres                            85
                    Total Subwatershed Acres                         261
                    Avg. % Imperviousness                            32%

                    Current Impervious Acreage                        0.12
                    Controlled
                    Current-percent Impervious                       0.14%
                    Acreage Controlled
                    Number of existing BMPs                            2

Pope Branch Subwatershed Action Plan                                                        11
Figure 1-2: Pope Branch Subwatershed Pope Branch Subwatershed Action Plan 12
Figure 1-3: Pope Branch Subwatershed Planning Units

Pope Branch Subwatershed Action Plan                                          13
Figure 1-4: Pope Branch Subwatershed Existing BMPs

Pope Branch Subwatershed Action Plan                                           14
Problems Facing the Pope Branch Subwatershed

Changes to Hydrology
The development of the Pope Branch subwatershed has altered the hydrology and flow regime,
and is a major cause for other problems facing the subwatershed. The change in land cover from
forest or agriculture to impervious surfaces (such as roofs, roads, and parking lots) has set up a
dynamic in which stormwater runoff increases and infiltration of precipitation into soils
decreases. An increase in stormwater runoff increases peak discharge that provides energy
necessary to erode stream banks as well as discharging pollutants from overland sources into
receiving streams. Moderate stream channel erosion was documented in all three sections of the
subwatershed along the main stem of Pope Branch.

Poor Aquatic Habitats
As with many developed watersheds, the biological characteristics of the streams in this
subwatershed are far less than ideal for the support of healthy ecosystems. Approximately 77-
percent of the stream miles have adequate riparian buffers (300 foot total width) thanks to the
Pope Branch park land that runs along the stream. This represents almost all of the non-piped
stream length. Despite the riparian buffer areas 78-percent (7 of 9) of the Index of Biotic
Integrity (IBI) sampling stations were rated as poor. A problem that contributes to this is the
extremely low base flow alternating with much higher flow during periodic storm events. Flow
at the lower end of the main stem can be observed to be only a trickle during dry conditions and
then again at higher flow rates during uncontrolled storm water runoff events with episodic
inputs of sewage from leaking infrastructure. The main stem occasionally supports low numbers
of American eel, and can support pioneer species such as blacknose dace and northern creek
chubs. There are multiple physical barriers to fish movement in the subwatershed as well. Many
of these blockages are a result of piping, low flow, perched culverts, and exposed utility lines. A
total of 14 blockages were field verified. The Anacostia Watershed Environmental Baseline
Conditions and Restoration Report, contains additional information on the locations of the fish
barriers and IBI data for the subwatershed. It should be noted that there are several ongoing
projects to replace and rehabilitate the failing sewer line network as well as fish barrier removal
associated with those sewer lines.

Poor Water Quality
Water quality is a major contributor to the problems facing the Pope Branch subwatershed. This
area was developed prior to the era of mandatory stormwater controls; as such the two BMP’s
present only control roughly an eighth of an acre total. The high level of imperviousness,
inadequate numbers of stormwater management controls, as well as the 2,200 feet of moderate-
severe stream channel erosion have all contributed to the Pope Branch subwatershed total
suspended solids (TSS), nitrogen, and phosphorous load. The nutrient and TSS loading rates
associated with this are presented in Table 1-2. The sediment total maximum daily load (TMDL)
analysis for the Anacostia River estimates that approximately 70-percent of the sediment loaded
into the tidal estuary originates from the stream banks and channels

Toxics, which include trace metals, polycyclic aromatic hydrocarbons (PAH), polychlorinated
biphenyls (PCB), pesticides, and herbicides, enter the surface waters of the subwatershed via
runoff (non-point source) and industrial/municipal discharge. There has been minimal data
Pope Branch Subwatershed Action Plan                                                     15
collected to determine the amount and source of the toxics that are present in the Pope Branch
subwatershed, as such, the extent of the problem is unknown at this time. There are a total of 162
National Pollutant Discharge Elimination System (NPDES) related discharges in the Anacostia
watershed; however, none of these are located within the Pope Branch subwatershed. In addition,
no Resource Conservation and Recovery Act (RCRA) or Comprehensive Environmental
Response, Compensation, and Liability Act (CERCLA) sites are present in Pope Branch.
Locations of these sites within other regions of the Anacostia River watershed are illustrated in
the Anacostia Watershed Environmental Baseline Conditions and Restoration Report.

The available fecal coliform sampling for Anacostia River watershed suggests that streams in the
watershed do not meet established bacterial water quality standards. While this data is not
specifically available for Pope Branch, studies done in other subwatersheds of the Anacostia
River have shown that bacterial contamination is contributed to the subwatershed by the
following sources; Human (9 to 55-percent), domestic animals (24 to 28-percent), livestock (6 to
28-percent), wildlife (12 to 38-percent). However, in Pope Branch the livestock contribution
would be virtually non-existent. Washington Sanitary Sewer Commission (WSSC) has installed
one monitoring station for bacteria located on Pope Branch.

Trash
Trash is another non-point source contaminant entering the system. Trash surveys have indicated
that the middle and lower main stem of Pope Branch have one of the highest trash levels in the
Anacostia watershed. This is not surprising given the high population density of the
subwatershed.

Flooding
Flooding has been a long-standing problem throughout the Anacostia River watershed,
particularly in Prince George’s County, though areas of Montgomery County and the District of
Columbia experience episodic flooding as well. Prince George’s County is prone to flooding
because the county is located within the Coastal Plain physiographic province, which is generally
wider and flatter, and due to development of floodplains prior to the development of stormwater
management regulations and controls. Periodic flooding within Pope Branch occurs primarily at
the confluence with the Anacostia River.

Further data and discussion regarding the current conditions of the Pope Branch subwatershed
can be found in the Anacostia Watershed Environmental Baseline Conditions and Restoration
Report prepared by Metropolitan Washington Council of Governments (MWCOG).

Pope Branch Subwatershed Action Plan                                                    16
Table 1-2: Nutrient Loading Estimates for Pope Branch
                           Subwatershed and Comparison Values
                                                                        TSS
                                    Nitrogen        Phosphorus
                                                                      tons/sq
                                 lbs/sq mi/year    lbs/sq mi/year
                                                                      mi/year
               Pope Branch             3,865            443                70
                 Average
                 Anacostia             5,255            500                99
               Subwatershed
                Completely
                 Forested               42                8             N/A
                Watershed

                             Table 1-3: TMDL Reduction Goals
                                        Nitrogen  Phosphorus
                                                                    TSS tons/sq
                                         lbs/sq       lbs/sq
                                                                      mi/year
                                         mi/year     mi/year
                Anacostia River
                Watershed TMDL            79%          80%             85%
                Reduction Goals

             Estimated Pope Branch
                                          3,865         443             70
                 TMDL Loadings

             Estimated Pope Branch
                                          3,053         434             60
                 Reduction Goal

Pope Branch Subwatershed Action Plan                                              17
Existing Pollutant Loads Existing pollutant loadings for sediment, nitrogen (N), and phosphorous (P) was calculated for the Anacostia River watershed TMDL by MDE. As part of the ARP, the sediment, N, and P loadings were calculated for the Pope Branch subwatershed using the same loading rates per land use for the TMDL in order to estimate the Pope Branch subwatershed’s contribution of pollutant load to the overall Anacostia River load (Kim et al, 2007; Mandel et al, 2008). The Anacostia River watershed TMDL identifies a reduction goal for sediment, N, and P as 85-, 79-, and 80- percent, respectively. By knowing the percent reduction necessary for the entire Anacostia River watershed and applying the percent reduction to the Pope Branch subwatershed pollutant loading estimate, the subwatershed loading reduction for Pope Branch necessary to achieve the overall Anacostia River watershed TMDL can be estimated. Additional information is available on the existing pollutant loading calculations is available in the Plan Formulation appendix to the Anacostia Watershed Restoration Plan and Report. Identifying the existing magnitude of loadings on a subwatershed basis allows for the ability to geographically target and evaluate the scale of restoration needed to reduce nitrogen (N), phosphorus (P), and sediment inputs within each subwatershed to attain goals. A summary table of Pope Branch subwatershed current loadings and how they compare to the rest of the Anacostia River watershed is found in Table 1-2. The efforts to attain TMDLs are being led by the U. S. Environmental Protection Agency (EPA) and MDE, and as such neither this SWAP nor the ARP are intended to serve as TMDL implementation plans, although data presented here may contribute to that effort. The Plan Formulation appendix of the Anacostia Watershed Restoration Plan and Report provides more details regarding the methodology used to obtain the current loading estimates and presents the results of those analyses. It must be noted that the analyses conducted for the ARP in regards to pollutant reduction only considered overland flow, and does not account for pollutant contribution from the stream channel itself, namely sediment from erosion. Additional detailed modeling would be required to determine sediment transport change associated with reduced runoff volumes from implementation of the stormwater management retrofit projects identified in the ARP. Pope Branch Subwatershed Action Plan 18
Section 2
                            Inventory of the Provisional
                                Restoration Candidates

Pope Branch Subwatershed Action Plan               19
Inventory of the Provisional Restoration Candidates
As part of the ARP study, a systematic process was developed to identify, catalog, and evaluate
each restoration opportunity. In addition, the evaluation of restoration projects was completed
by using a detailed system to score the various projects and ultimately determine a ranking of
projects. The opportunities presented were identified through the compilation of existing data,
input from local jurisdictions, GIS analyses, and field observations. The existing data provided
by the local municipalities included land use data, public/private ownership information,
impervious surfaces data, planning department classifications, digital elevation models,
stormwater management data, and aerial photographs. A detailed explanation of the
methodology utilized to identify the opportunities can be found in the Plan Formulation appendix
to the Anacostia Watershed Restoration Plan and Report.
In addition to the restoration strategies discussed in Section 1, the potential projects identified as
part of this analysis are intended to achieve one or more of the following 2020 restoration
objectives:
1. Stormwater Management
2. Wetland Creation and Restoration
3. Riparian Corridors
4. Aquatic Community
5. Trash Reduction
6. Outreach
7. Parkland Acquisition
Table 2-1 identifies potential project types per objective, gives a brief description, and states the
metric that will be used to account for the extent of the project’s implementation.
Pope Branch Subwatershed Action Plan 20Table 2-1: 2020 Pope Branch Restoration Objectives
Objectives Description of Objective Metric
Stormwater Management
Acres Controlled and Pounds of
Retrofit current stormwater controls, utilize
Nitrogen (N), Phosphorus (P),
Retrofits, Environmental Site bioretention, filters, bioswales, wet ponds, wetlands
Total Suspended Solids (TSS)
Design (ESD), and Low Impact to add controlled acreage to the subwatershed
loading reduced
Development (LID)
Include use of green roofs, disconnects, rain Acres Controlled and Pounds of N,
barrels, permeable pavement, and rain gardens P, TSS loading reduced
Homeowner BMPs
Trash
Reduce trash through use of netting, catching, and Number of Projects Implemented /
Implement reduction projects grates MWCOG Trash Index Rating
Acres Swept and Pounds of N, P,
Increase street sweeping programs
Street Sweeping TSS loading reduced
Aquatic Community
Restore fish habitat through improved water quality
Index of Biotic Integrity Rating
IBI Rating for Fish and flow management
IBI Rating for Restore macroinvertebrate habitat through
Index of Biotic Integrity Rating
Macroinvertebrate improved water quality and flow management
Fish Passage Remove barriers to fish migration Miles of Stream
Wetland Creation and
Restoration
Create new wetlands and vernal pools and
Acreage created or restored
Create and Restore Acreage restore/expand existing ones
Riparian Corridors
Invasive Species Management Removal of invasive species from the corridor Acres managed
Reforestation Replanting of the riparian corridor Acres reforested
Increase Tree Canopy Tree planting in both urban and non-urban areas Acres / % increase
Outreach / Public
Involvement
Increase participation of Educate the public about BMPs and encourage
Qualitative
residents and businesses their use of them
Establish Friends of Pope Establish a subwatershed group to facilitate public
Yes or No
Branch Organization involvement
Expand current programs and encourage
businesses to offer incentives. Assist private Expanded or Maintained
Incentive Programs owners with measures such as rain barrels.
Pope Branch Subwatershed Action Plan 21A total of 28 potential restoration candidate projects within the Pope Branch subwatershed have
been identified as part of the ARP investigation. The complete inventory and description of the
28 proposed projects are included in Project Inventory section of this appendix. The potential
restoration projects address five of six restoration strategies identified for the Pope Branch 2020
restoration objectives (does not include projects for increasing participation). The presence of
toxic contaminants has been identified in Pope Branch; however, detailed studies have not been
completed to identify the exact sources and extent of the problem, and thus there are no
provisional restoration candidate projects that address toxics in the report. It is recommended that
further studies regarding the source and extent of toxic contamination should be undertaken by
the appropriate authorities. In addition to illicit discharges, historic dump sites may be sources of
toxic contaminants in the system. A diagram of these sites and current NPDES sites can be found
in the Anacostia River Watershed Environmental Baseline Conditions and Restoration Report.
Tables 2-2, 2-3, and 2-4 provide a summary of the proposed restoration project types, quantity,
and the estimated cost of implementation. It should be noted that the development of the
NPDES Municipal Separate Storm Sewer System (MS4) permit by the three local jurisdictions
may or may not include provisional restoration projects presented in the SWAP or Pope Branch
Subwatershed Provisional Restoration Projects Inventory.
Table 2-2: Inventory of Restoration Projects in the Pope Branch Subwatershed
Impervious
Number
Estimated Acreage Length Acreage
Candidate Project Type of
Cost ($) Controlled (mi) (Ac)
Projects
(ac)
Stormwater Retrofit 13 5,391,000 53.4 - -
Stream Restoration 4 5,167,000 - 0.4 -
Wetland Creation /
Restoration
1 50,000 - - 1.0
Fish Blockage Removal /
Modification
2 370,000 - 0.3 -
Riparian
Reforestation/Invasive 3 50,500 - - 10.0
Species Management
Trash Reduction 3 11,800 - - -
Sediment Remediation
(Toxics)
- - - - -
Parkland Acquisition 2 201,000 2.0
Total 28 11,241,300 53.4 0.7 13.0
Pope Branch Subwatershed Action Plan 22Table 2-3 Proposed Restoration by Type in the Pope Branch Subwatershed
Project Type Watershed Area
Total New
Acreage
for
Stormwater
Upper Middle Lower Total Projects
Wetland and Wet Pond Stormwater (acres)* 0.0 0.0 0.0 0.0 0.0
Bioretention (acres)* 21.1 15.0 3.7 39.8 39.8
Bioswales (acres)* 0.1 3.2 0.0 3.3 3.3
Permeable Pavement (acres) 0.3 0.8 0.9 2.0 2.0
Sand Filter (acres)* 0.0 0.0 0.0 0.0 0.0
Green Roof (acres)* 0.3 0.8 0.9 2.0 2.0
Downspout Disconnect (acres)* 0.3 0.8 0.9 2.0 2.0
Rain Barrels (acres)* 0.3 0.8 0.9 2.0 2.0
Rain Garden (acres)* 0.3 0.8 0.9 2.0 2.0
Infiltration Practices (acres)* 0.0 0.0 0.0 0.0 0.0
Street Sweeping (acres) 0.4 0.0 0.0 0.4 N/A
Invasive Species Management (acres) 0.0 4.8 4.3 9.1 N/A
Meadow Planting(acres) 0.0 0.0 0.0 0.0 N/A
Wetland Restoration (acres) 0.0 0.0 1.0 1.0 N/A
Vernal Pools Restoration/Creation (acres) 0.0 0.0 0.0 0.0 N/A
Riparian Reforestation (acres) 0.0 0.0 0.9 0.9 N/A
Parkland Acquisition (acres) 2.0 0.0 0.0 2.0 N/A
Stream Restoration (feet) 250 200 1,600 2,050 N/A
Fish Passage (miles) 0.0 0.0 0.2 0.2 N/A
Trash Reduction (number of projects) 1.0 1.0 1.0 3.0 N/A
*Note: The lack of current stormwater controls effectively removes the possibility of retrofits. Therefore all
stormwater projects listed here are shown with newly controlled impervious acreage.
Pope Branch Subwatershed Action Plan 23Table 2-4: Provisional Restoration Project Estimated Unit Costs
No. Practice Approximate Unit Cost ($)
Stormwater Retrofit
Existing Stormwater
Management Pond/Wetland $1,000-$3,000/acre of drainage
1 Retrofitting
New Stormwater Management $3,000-$5,000/acre of drainage
2 Pond/Wetland Construction
LID-Bioretention with Under Drain $100,000/impervious acre
3 System
$100,000/impervious acre
4 LID-Curbside/Street Planter
$54,450-$65,340/impervious acre
5 LID- tree box filter
$42/square foot
6 LID-Green Roof
LID-Single Family Home Rain $5,000 per individual garden
7 Garden
LID-Single Family Home Rain $200/barrel (typically two per house)
8 Barrel
$20,000 to $25,000 per impervious acre
9 Sand Filter
$15,000/impervious acre
10 Underground Pipe Storage
$4.0/square foot
11 Permeable Pavement
Stream Restoration/Fish Passage Blockage Removal or Modification
$300/linear foot
12 Stream Restoration
Concrete Stream Channel $1,000/linear foot
13 Removal
$2,000/linear foot
14 Stream Day Lighting
Fish Passage/Riffle Grade $150,000/one foot barrier height
15 Control Structure
$50,000/acre
16 Wetland Creation
Trash Reduction/Water Quality
Fresh Creek Trash Netting $1,000/acre of drainage
17 System
End-of-Pipe Trash Catching $4,000/acre of drainage
18 System
$50/curb mile
19 Street Sweeping
$500/inlet
20 Storm Drain Trash Grate
Pope Branch Subwatershed Action Plan 24Results of the Evaluation and Scoring of Restoration Actions in Pope Branch Subwatershed To recommend restoration action and to determine the sequence for implementation, the quantitative scoring scheme was used to evaluate the 28 provisional restoration candidate projects. This common scoring system allowed for comparison of candidates across as well as within the restoration strategies. The scores for all 28 projects ranged from 82 to 60 points out of a possible 100. To prioritize among projects based on benefits, the scores were divided into three tiers based on the distribution of the scores, with Tier I projects being those anticipated to provide the greatest potential benefits. Tier I includes projects that scored an 80 or above, Tier II includes projects that scored anywhere from 79 to 65, and Tier III includes those that scored 64 or below. Further discussion on the scoring system for the proposed projects can be found in the Plan Formulation appendix to the Anacostia Watershed Restoration Plan and Report. The scoring scheme for the provisional stormwater management candidate projects was subsequently further adjusted. The three tier system was retained, but the tier boundaries were refined based on distribution of the adjusted score as described in the stormwater management subsection below. The following tables present the scores and overall rank of the provisional restoration actions for the Pope Branch subwatershed separated by restoration strategy. Stormwater Management To provide for better differentiation for potential benefits that would be produced by the 13 potential stormwater management candidate projects and aid the local communities in prioritization for implementation, the scoring system used for project candidates in this restoration strategy were adjusted from the common scoring system. Variables representing two additional factors unique to stormwater management were incorporated into the scoring system: unit imperviousness and existing stormwater control. Data for these variables was obtained from Metropolitan Washington Council of Governments (COG) and is presented in the Pope Branch Environmental Baseline Conditions and Restoration Report. In the adjusted scoring system for the stormwater projects, Tier I includes projects above 100, Tier II includes projects that are between 89 and 99, Tier III are those scored 88 and below, and Tier IV are those projects that did not meet the minimum requirements to be included in the adjusted scoring system but could still be considered as restoration opportunities in the future. Further explanation of the basis for the adjusted scoring can be found in the Plan Formulation appendix of the Anacostia Watershed Restoration Plan and Report. The top 7 stormwater retrofit candidate projects are listed in Table 2-5. Additional information and project descriptions can be in the Pope Branch Subwatershed Provisional Restoration Projects Inventory. Pope Branch Subwatershed Action Plan 25
Table 2-5: Potential Stormwater Retrofit Projects within the Pope Branch Subwatershed

                                                                                                  Overall

                     Jurisdiction*
                                                                                                   Rank
                                                                                       Adjusted    based     Estimated
   Project ID                        Project Name
                                                                                        Score       on        Cost ($)
                                                                                                  Original
                                                                                                  Scoring
                                     G Street SE, 31st Street SE and 32nd Street SE,
PO-L-01-S-2         DC               Washington, DC                                      109.6          1         297,000
                                     Residential neighborhood composed of 34th
                                     Street SE north of Carpenter Street SE to three
                                     residences into Pope Street SE, and Nash Place
PO-M-01-S-4         DC               SE, Washington, DC                                  107.4          6     1,930,000
                                     Texas Avenue SE between Pope Branch and S
PO-U-01-S-1         DC               Street SE, Washington, DC                           103.7          7         736,000
                                     Massachusetts Avenue SE between Randle
                                     Circle SE and Alabama Avenue SE,
PO-M-01-S-3         DC               Washington, DC                                       99.9          9         512,000
                                     Neighborhood draining to outfall SS#1075,
                                     located along Carpenter Street SE between
                                     Highwood Drive SE and Nash Place SE,
PO-U-01-S-4         DC               Washington, DC                                       99.0          9         500,000
                                     Fort Davis Drive SE between Massachusetts
                                     Avenue SE and Pennsylvania Avenue SE,
PO-U-01-S-2         DC               Washington, DC                                       98.0         12         500,000
                                     Outfall SS#1076 draining O Street SE off of
PO-U-01-S-3         DC               Massachusetts Avenue SE, Washington, DC              85.1         28       340,000
   TOTAL                                                                                                      4,815,000
*DC=Washington D.C.
Scoring Tier = Tier I, Tier II, Tier III

 Pope Branch Subwatershed Action Plan                                                                        26
Stream Restoration
The potential stream restoration candidate projects are presented in Table 2-6. The proposed
projects consist of a 1,600 foot stream day lighting effort and three regenerative stormwater
conveyance system projects. Additional project description information can be found in the Pope
Branch Subwatershed Provisional Restoration Projects Inventory.
Table 2-6: Potential Stream Restoration Projects within the Pope Branch Subwatershed
Jurisdiction*
Overall Estimated
Project ID Project Name Score
Rank Cost ($)
Neighborhood draining to outfall SS#1075, located along
Carpenter Street SE between Highwood Drive SE and
PO-U-02-SR-2 DC Nash Place SE, Washington, DC 67 19 56,000
Residential neighborhood composed of 34th Street SE
north of Carpenter Street SE to three residences into
PO-M-02-SR-1 DC Pope Street SE, and Nash Place SE, Washington, DC 67 19 74,000
Outfall SS#1076 draining O Street SE off of
PO-U-02-SR-1 DC Massachusetts Avenue SE, Washington, DC 65 25 37,000
Pope Branch between Fairlawn Avenue SE and the
PO-L-02-SR-1 DC Anacostia River, Washington, DC 62 26 5,000,000
Total 5,167,000
*DC=Washington D.C.
Scoring Tier = Tier I, Tier II, Tier III
Wetland Creation
The potential wetland creation candidate project is presented in Table 2-7. This proposed project
is a 1 acre wetland creation effort. Additional project description information can be found in the
Pope Branch Subwatershed Provisional Restoration Projects Inventory.
Table 2-7: Potential Wetland Creation Projects within the Pope Branch Subwatershed
Jurisdiction*
Overall Estimated
Project ID Project Name Score
Rank Cost ($)
Pope Branch floodplain, just east of Fairlawn Avenue SE,
PO-L-03-W-1 DC Washington, DC 79 4 50,000
Total 50,000
*DC=Washington D.C.
Scoring Tier = Tier I, Tier II, Tier III
Pope Branch Subwatershed Action Plan 27Fish Blockage Removal or Modification
Both of the potential fish blockage removal or modification candidate projects are presented in
Table 2-8. Both were located at culverts with the first being an 800 foot project and the second
400 feet. Additional information regarding the project descriptions is found in the Pope Branch
Subwatershed Provisional Restoration Projects Inventory. An additional 12 fish barriers
identified earlier in this report are being addressed through other means not associated with this
ARP effort, primarily sewer line rehabilitation.
Table 2-8: Potential Fish Blockage Removal or Modification Projects within Pope Branch Subwatershed
Jurisdiction
Overall Estimated
Project ID Project Name Score
Rank Cost ($)
Culvert at the intersection of Branch Avenue SE and
PO-L-04-F-1 DC Anacostia Road SE, Washington, DC 66 21 150,000
PO-L-04-F-2 DC Culvert at Minnesota Avenue SE, Washington, DC 66 21 220,000
TOTAL 370,000
*DC=Washington D.C.
Scoring Tier = Tier I, Tier II, Tier III
Pope Branch Subwatershed Action Plan 28Riparian Reforestation and Invasive Species Management
The potential riparian buffer reforestation and invasive species management candidate projects
are presented in Table 2-9. These projects include a total of approximately 9 acres of invasive
species management and about 1 acre of riparian buffer reforestation. Additional information
regarding the project descriptions is found in the Pope Branch Subwatershed Provisional
Restoration Projects Inventory.
Table 2-9: Potential Riparian Reforestation and Invasive Species Management Candidate Projects within the Pope
Branch Subwatershed
Jurisdiction
Overall Estimated
Project ID Project Name Score
Rank Cost ($)
Riparian area of Pope Branch between Branch Avenue SE
PO-M-05-R-1 DC and 34th Street SE 81 2 24,000
Riparian area of Pope Branch between Branch Avenue SE
PO-L-05-R-1 DC and Minnesota Avenue SE 81 2 22,000
Grassy field between M Place SE and Pope Branch, west of
PO-L-05-R-2 DC Minnesota Avenue SE and east of Fairlawn Avenue SE 78 5 4,500
Total 50,500
*DC=Washington D.C.
Scoring Tier = Tier I, Tier II, Tier III
Pope Branch Subwatershed Action Plan 29Trash Reduction
The provisional trash reduction candidate projects are presented in Table 2-10. These projects
include trash removal, trash grate installation, trash nets, and a community cleanup site.
Additional information regarding the project descriptions can be found in the Pope Branch
Subwatershed Provisional Restoration Projects Inventory.
Table 2-10: Potential Trash Reduction Projects within the Pope Branch Subwatershed
Jurisdiction
Overall Estimated
Project ID Project Name Score
Rank Cost ($)
Massachusetts Avenue SE from Alabama Avenue SE to O Street
PO-U-06-T-1 DC NE 70 15 6,000
South bank of Pope Branch, between 3208 Pope Street SE and
PO-M-06-T-1 DC the Branch Avenue SE culvert 70 15 800
PO-L-06-T-1 DC Immediately upstream of the Fairlawn Avenue SE culvert 69 17 5,000
Total 11,800
*DC=Washington D.C.
Scoring Tier = Tier I, Tier II, Tier III
Parkland Acquisition
The potential parkland acquisitions projects are presented in Table 2-11. Additional information
regarding the project descriptions can be found in the Pope Branch Subwatershed Provisional
Restoration Projects Inventory.
Table 2-11: Potential Parkland Acquisition Projects within the Pope Branch Subwatershed
Jurisdiction
Overall Estimated
Project ID Project Name Score
Rank Cost ($)
PO-U-08-L-2 PG Alabama Avenue and 40th Street: 0.99 Acres 72 12 99,000
PO-U-08-L-1 PG Alabama Avenue and 40th Street: 1.02 Acres 61 27 102,000
Total 201,000
*DC=Washington D.C.
Scoring Tier = Tier I, Tier II, Tier III
Pope Branch Subwatershed Action Plan 30Summary of Recommended Restoration Actions
The Recommended Restoration Actions are those that could potentially be implemented by 2020
and a roll-up of these projects is presented in Table 2-12. Additional information on the
descriptions and details of the potential actions can be found in the Pope Branch Subwatershed
Provisional Restoration Projects Inventory.
.
Table 2-12: Summary of Recommended Potential Restoration
Actions
Number of Estimated
Candidate Project Type
Projects Cost ($)
Stormwater Retrofits
Tier I* 3 2,963,000
Tier II* 3 1,512,000
Tier III* 1 340,000
Tier IV 6 576,000
Stream Restoration
Tier I 0 0
Tier II 3 167,000
Tier III 1 5,000,000
Wetland Restoration
Tier I 0 0
Tier II 1 50,000
Tier III 0 0
Fish Blockage Removal /
Modification
Tier I 0 0
Tier II 2 370,000
Tier III 0 0
Riparian Reforestation and
Invasive Species Management
Tier I 2 46,000
Tier II 1 4,500
Tier III 0 0
Trash Reduction
Tier I 0 0
Tier II 3 11,800
Tier III 0 0
Parkland Acquisition
Tier I 0 0
Tier II 1 99,000
Tier III 1 102,000
TOTAL 28 11,241,300
*Tiers for the Stormwater Projects Reflect the Adjusted
Scoring System.
Pope Branch Subwatershed Action Plan 31Implementation Type of Potential Restoration Actions
Restoration opportunities identified as part of the ARP require additional study, design, or policy
change prior to implementation. Table 2-13 provides a summary of the number of projects that
fall under each of the four implementation types. Design/build projects are likely those projects
ready to be implemented, whereas feasibility projects would require additional detailed studies
prior to the design phase. The design/build projects can be implemented by local jurisdictions,
agencies, non-profit organizations, or through one of the several USACE design/build programs.
It should be noted that USACE has been provided authority under various Water Resource
Development Acts to complete Design/Build projects in the Anacostia watershed. The projects
requiring feasibility studies like stream restoration or wetland creation likely would be projects
USACE could implement following the appropriate Civil Works authority, budgeting cycle, and
protocol. Projects classified as requiring a programmatic element prior to implementation may
require governmental policy changes or authority to purchase land. Finally, stewardship projects
are likely those potential projects to be completed by volunteers from local churches, schools, or
community watershed groups such as trash pick up park maintenance.
Additional information regarding what specific projects are classified under each category can be
found in the Plan Formulation appendix to the Anacostia Watershed Restoration Plan and
Report.
Table 2-13: Summary of Potential
Restoration Actions Implementation Types
Number
Implementation of Estimated
Type Projects Cost
Design/Build 12 5,094,000
Feasibility 7 5,587,000
Stewardship 5 348,300
Programmatic 4 212,000
TOTAL 28 11,241,300
Pope Branch Subwatershed Action Plan 32Section 3
Evaluation and Discussion of the
Restoration Strategies
Pope Branch Subwatershed Action Plan 33Evaluation of the Proposed Restoration Projects The proposed restoration projects were evaluated using the approach described in the main report of the ARP. The first step in the evaluation consisted of assessing the potential of the restoration actions to control pollutant loads. As described in the Anacostia Watershed Environmental Baseline Conditions and Restoration Report, the TMDL modeling efforts of Interstate Commission on the Potomac River Basin (ICPRB) and Maryland Department of the Environment (MDE) were used to provide the existing pollutant loads, and the Watershed Treatment Model (WTM) was used to estimate the potential pollution reduction achieved by the proposed restoration strategies. The Plan Formulation Appendix lists the efficiencies of the various BMPs included in the WTM. It should be noted that the list of stormwater management practices listed in the WTM was expanded to include LID practices. The LID practices included green roofs, rooftop disconnection, rain barrels and cisterns, soil amendments, sheet flow to open space, bioretention, and rain gardens. The potential restoration strategies were individually evaluated using the WTM to estimate the pollutant reduction benefit the project could provide. The full WTM user guide is available online from the Center for Watershed Protection (CWP) at www.cwp.org. Potential to Reduce Stormwater Pollutant Loads The proposed restoration projects would provide additional stormwater controls to 53 impervious acres in the Pope Branch subwatershed. This increases the acres of impervious surfaces controlled by stormwater management, from approximately 0.1-percent of impervious surface up to a total of approximately 53 acres, or 63-percent, of the total impervious acres. Table 3-1 summarizes the improvements in stormwater controls after implementation of the proposed stormwater projects. Pope Branch Subwatershed Action Plan 34
Table 3-1: Level of Stormwater Control in Pope Branch Subwatershed After
                     Implementation of All Proposed Stormwater Projects
                            Existing         Potential Future
                          Stormwater           Stormwater
          Total                                                  Increase in Impervious
                            Controls             Controls
        Impervious                                               Acreage Controlled by
                                  % of                 % of
          Acres                                                   Stormwater Projects
                      Acres Impervious Acres Impervious
                                  Total                Total

             85           0.12    0.14%        53        63.3              63.1%

               Table 3-2: Evaluation of Stormwater Control Levels and Potential in
                                     Pollutants Load Reduction
                               Pollutants Load Reduction Potential    Increase in
                                                                      Impervious
               Impervious         N         P      TSS     Bacteria     Acreage
                 Acreage
                                                                     Controlled by
                Controlled                                  (billion
                               (lbs/yr) (lbs/yr) (tons/yr)            Stormwater
                                                            cfu/yr)     Projects
                    63.3 %
                  (proposed      405      95        15     10,914        63.1%
                   projects)

               * Current Stormwater Control Levels are at 0.14%

Using the distribution of projects included in the provisional inventory, several future control
levels were evaluated using the WTM to estimate potential pollution reduction. Table 3-2
identifies the maximum control level evaluated (as percent impervious acres controlled) as well
as the associated pollution reduction potential. The Plan Formulation appendix of the Anacostia
Restoration Plan and Report provides the characteristics of each BMP type included in the
provisional inventory.

To fully evaluate the benefits of providing different levels of stormwater control, the existing
pollutant load and the pollution reduction potential in the watershed must be considered in terms
of the existing Anacostia River TMDLs for nutrients and TSS (Kim et al., 2007; Mandel et al.,
2008). The TSS TMDL calls for an 85-percent reduction in existing TSS loading to the
Anacostia River watershed. The nutrient TMDL established a necessary reduction of 79-percent
for nitrogen and 80-percent for phosphorus. Table 3-3 summarizes the overall Anacostia River
TMDL reduction goals, the Pope Branch existing pollutant loadings, and the ability of the
various stormwater control levels to address the pollution reduction in the Pope Branch
subwatershed to help meet the Anacostia River TMDLs. The implementation of all of the
proposed stormwater projects reduces the pollutant load between 29 and 54-percent. Given that
the TMDL goals for the Anacostia River are between 79 and 85-percent reduction, stormwater
controls alone will not be able to address the contribution from Pope Branch.
Pope Branch Subwatershed Action Plan                                                   35
Table 3-3: Ability of Stormwater Control Levels to Address
TMDL Goals in Pope Branch Subwatershed
Pollutant Reduction
Impervious Control Level Achieved
N P TSS
1,221 174 24
TMDL Reduction Goal for lbs/yr lbs/yr tons/yr
Pope Branch (79%) (80%) (85%)
Estimate of Existing Pollutant 1,546 217 28
Loads in Pope Branch lbs/yr lbs/yr tons/yr
405 95 15
Maximum Reduction Potential lbs/yr lbs/yr tons/yr
from Proposed Projects (29%) (47%) (54%)
It should be noted that the load reduction estimates of Table 3-3 do not account for reductions in
stream channel erosion, which is another benefit of stormwater management. The following
section addresses the potential reduction in stream channel erosion following the implementation
of the proposed restoration actions.
Potential to Reduce Peak Flow Discharge
The TSS TMDL for the Anacostia River estimates that about 70 to 75-percent of the sediment
delivered from the watershed to the tidal estuary comes from stream bank and channel erosion.
Estimating the reduction of stream channel sediment loads that would result from controlling
urban stormwater runoff is very challenging. A peak flow reduction analysis is used as a
surrogate measure to give insight into the potential for reducing in-stream channel erosion loads.
In fact, erosion of the stream channel is directly related to the increase in stream energy
associated with the peak flow. Reducing the peak flow at the outlet of the watershed will lead to
the reduction in erosive shear stress on the stream banks. Therefore, it is logical to assume
potential reduction in stream bank erosion by quantifying the reduction in peak flows associated
with the levels of stormwater control. Table 3-4 contains the results of that quantification. The
Center for Watershed Protection (CWP) has an Impervious Cover Model (ICM) which classifies
the ability of a watershed to support wildlife based on its level of impervious. The ICM
describes watersheds having an impervious surface cover between 0 to 10-percent as ‘sensitive’,
10 to 25-percent as being ‘impaired’, those having 25 to 60-percent impervious cover as ‘non-
supporting’, and those with 60 to 100-percent impervious cover as ‘urban drainage’. Pope
Branch is currently approximately 21.5-percent impervious, which would be considered in the
high end of the ‘impaired’ range according to the ICM. The Peak Flow Analysis in Table 3-4
would indicate that if approximately 50-percent of all impervious acres in the subwatershed were
controlled this would be effectively equivalent to reducing the impervious cover of the watershed
enough to place it in the ‘sensitive’ category under ICM. This analysis however, is not meant to
Pope Branch Subwatershed Action Plan 36imply that a controlled acre of impervious surface is environmentally equivalent to say forest
cover, but does help to evaluate to what level stormwater controls can contribute to reducing
runoff and thereby improving the overall environmental health of a stream system.
The peak discharges are estimated using regression equations developed by the Maryland
Hydrology Panel in support of the Maryland State Highway Administration (MSHA). The
equations are used in the estimate of flood discharges for the design of culverts and bridges
(Molgen, 2007). Details on the peak flow reduction potential analysis are given in the Plan
Formulation appendix of the Anacostia Watershed Restoration Plan and Report.
Table 3-4: Peak Flow Analysis Results for Pope Branch Subwatershed
No Current Impervious Area Treated with Storm Water Controls
Treatment Treatment
0.1% 25% 30% 40% 50% 70% 100%
0% Treated Treatment Treated Treated Treated Treated Treated Treated
Effective
Percent 31.5 31.5 25.2 24.0 21.5 18.9 13.9 6.3
Impervious
Peak Flow 90 90 82 81 77 73 65 48
(cfs)
Peak Flow
per square 211 211 193 189 180 172 152 113
mile (cfs)
Peak Flow in
gpd per 136,372,862 136,372,862 124,739,158 122,153,891 116,337,039 111,166,504 98,240,166 73,033,808
square mile
(cfs) = cubic feet per second (gpd) = gallons per day Conversion: 1 cfs = 646,316.883 gpd
The Pope Branch subwatershed is located entirely within the coastal plain geographic province,
the peak discharges were estimated using the following regression equation:
(Equation 1 – Coastal) Q1.25 = 18.62*DA0.611 * (IA+1)0.419 * (SD +1)0.165
The Q1.25 indicates that the peak discharges are associated with a rainfall event that has the
likelihood of occurring once every 1.25 years. In addition, DA represents drainage area in
square miles, IA represents-percentage of impervious area, and SD represents-percentage of
group D soils, which are soils with a high runoff potential and slow infiltration rate. Although
these regression equations have limitations, which are discussed in the Plan Formulation
appendix of the Anacostia Watershed Restoration Plan and Report, they provide a reasonable
initial measure of the potential for reducing peak discharges as a function of different amounts of
stormwater management.
Among the limitations of this analysis, one is of particular importance. The peak discharge
analysis should be interpreted with caution. Although the peak flow at the outlet of a watershed
is used as a simple yardstick, reducing the peak flow is not a guarantee of reduced stream
Pope Branch Subwatershed Action Plan 37channel erosion throughout the watershed. The selection of stormwater controls should consider the Maryland Department of the Environment’s (MDE) design manual guidance for redevelopment. Detailed hydrologic and hydraulic analyses are necessary to determine hydrograph timing to avoid inadvertently increasing channel erosion. Potential to Reduce Pollutant Loads Using Street Sweeping Street sweeping is included in the provisional project inventory as a trash control, but street sweeping can also serve as an effective pollutant removal technique if the right equipment and the right techniques are employed (Montgomery County 2002). Particles that accumulate on road surfaces such as road grit, sand, and dirt; heavy metals including copper, lead, and zinc; and nitrogen and phosphorus can all be removed to some extent by street sweeping. The highest concentration of pollutants is associated with the smallest particles of road grit (EPA, 1983). Of the three technologies available for street sweeping, regenerative air sweepers and vacuum assisted sweepers provide the greatest pollutant removal. Mechanical broom sweepers do the least to remove the small particles associated with most pollutants. Decisions such as frequency of sweeping, type of road swept (residential or mixed use, etc.), whether cars are permitted to be parked in the roadway, and training of personnel performing the street sweeping affects the efficiency of the practice. Ideally, street sweeping is most effective when pollutants are permitted to accumulate and then the area is swept prior to a rain event. However, this situation is logistically difficult. The WTM is capable of estimating removal of nitrogen, phosphorus, and TSS by street sweeping. Evaluations with the WTM identify that weekly sweeping can remove 67-percent more N, P, and TSS than monthly sweeping. The benefit of street sweeping was evaluated for the roads within the Pope Branch subwatershed. (Table 3-5). Information regarding the methodology and assumptions made in the analysis can be found in the Plan Formulation appendix to the Anacostia Watershed Restoration Plan and Report. Pope Branch Subwatershed Action Plan 38
Table 3-5: Pollutant Reduction Estimate of Weekly Street Sweeping (Streets Only)
           Other Roads          Annual Pollutant Reduction        Percent Reduction
        Percent of
                                   N          P          TSS
        Roadway        Miles                                       N          P       TSS
                                (lbs/yr)   (lbs/yr)   (tons/yr)
         Treated
            5            0.1       5          1          0        0.3%       0.3%     0.3%
           10            0.2       11        1           0        0.7%       0.6%     0.5%
           15            0.3       16        2           0        1.0%       0.9%     0.8%
           20            0.4       21        3           0        1.4%       1.2%     1.1%
           25            0.5       27        3           0        1.7%       1.5%     1.3%
           50            1.0       53        6           1        3.4%       3.0%     2.6%
           75            1.5       80        10          1        5.2%       4.5%     4.0%
           100           2.0      107        13          1        6.9%       6.0%     5.3%

         Residential Roads      Annual Pollutant Reduction             Percent Reduction
        Percent of
                                   N          P          TSS
        Roadway         Miles                                      N          P       TSS
                                (lbs/yr)   (lbs/yr)   (tons/yr)
         Treated
            5            0.3       23        3           0         1.5%      1.6%      1.2%
           10            0.7       45        7           1         2.9%      3.1%      2.5%
           15            1.0       68        10          1         4.4%      4.7%      3.7%
           20            1.3       91        14          1         5.9%      6.3%      5.0%
           25            1.6      114        17          2         7.3%      7.8%      6.2%
           50            3.3      227        34          3        14.7%     15.6%     12.4%
           75            4.9      341        51          5        22.0%     23.5%     18.6%
           100           6.5      454        68          7        29.4%     31.3%     24.8%

The benefits of street sweeping on pollutant removal can also be considered for parking lots.
Parking lots accumulate trash and pollutants that eventually wash into the stormwater system
during rain events. The results of the parking lot analysis are displayed in the Table 3-6.
Sweeping the parking lots in Pope Branch subwatershed will barely have a perceptible impact on
the load reductions because there are so few acres of parking lot present here.

Pope Branch Subwatershed Action Plan                                                       39
You can also read