The Illegal, Unreported and Unregulated Fishing Index - JANUARY 2019
←
→
Page content transcription
If your browser does not render page correctly, please read the page content below
The Illegal,
Unreported and
Unregulated
Fishing Index
JANUARY 2019

                 I
THE ILLEGAL, UNREPORTED AND UNREGULATED FISHING INDEX

                                                        The Illegal,
                                                        Unreported and
                                                        Unregulated
                                                        Fishing Index
                                                        JANUARY 2019

II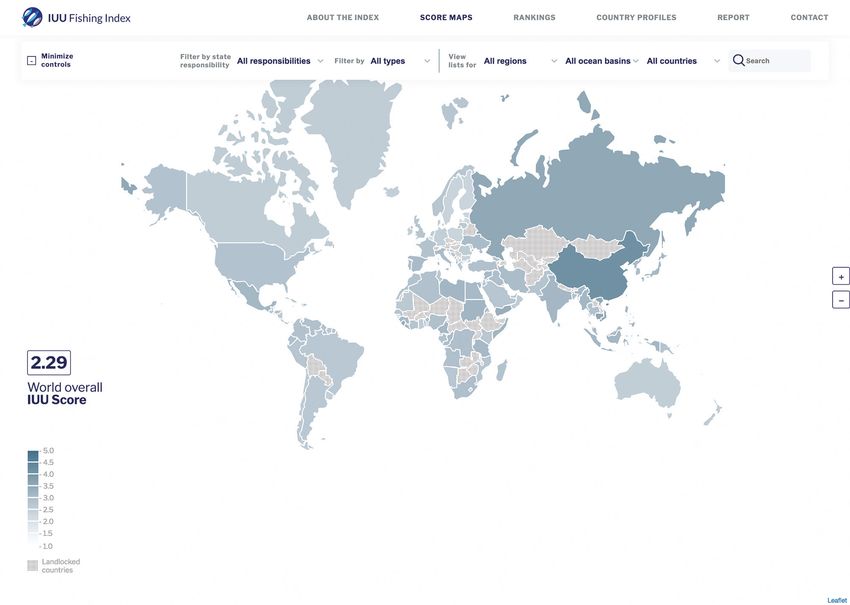
THE ILLEGAL, UNREPORTED AND UNREGULATED FISHING INDEX

                                                        Contents
                                                        Tables��������������������������������������������������������������������������������������������������������������������������������������������������������������������������������������������������������������������������� IV
                                                        Acronyms���������������������������������������������������������������������������������������������������������������������������������������������������������������������������������������������������������������� VI

                                                        Executive summary��������������������������������������������������������������������������������������������������������������������������������������������������������������������������������������� 1

                                                        1. Introduction � ���������������������������������������������������������������������������������������������������������������������������������������������������������������������������������������������������� 7
                                                        1.1 Background ��������������������������������������������������������������������������������������������������������������������������������������������������������������������������������������������������������������� 7
                                                        1.2 Why have an IUU Fishing Index? ���������������������������������������������������������������������������������������������������������������������������������������������������������������������������8
                                                        1.3 Methodology��������������������������������������������������������������������������������������������������������������������������������������������������������������������������������������������������������������������� 9

                                                        2. Introduction to the results�������������������������������������������������������������������������������������������������������������������������������������������������������� 17
                                                        2.1 Structure of this report��������������������������������������������������������������������������������������������������������������������������������������������������������������������������������������������� 17
                                                        2.2 Comments on interpretation of scores��������������������������������������������������������������������������������������������������������������������������������������������������������� 17

                                                        3. IUU fishing scores aggregated across all state responsibilities��������������������������������������������� 25
                                                        3.1 Introduction and distribution of scores����������������������������������������������������������������������������������������������������������������������������������������������������������25
                                                        3.2 Key findings���������������������������������������������������������������������������������������������������������������������������������������������������������������������������������������������������������������������26

                                                        4. IUU scores on coastal state responsibilities����������������������������������������������������������������������������������������������������� 39
                                                        4.1 Introduction and distribution of scores����������������������������������������������������������������������������������������������������������������������������������������������������������39
                                                        4.2 Key findings����������������������������������������������������������������������������������������������������������������������������������������������������������������������������������������������������������������������41

                                                        5. IUU scores on flag state responsibilities��������������������������������������������������������������������������������������������������������������� 55
                                                        5.1 Introduction and distribution of scores����������������������������������������������������������������������������������������������������������������������������������������������������������55
                                                        5.2 Key findings���������������������������������������������������������������������������������������������������������������������������������������������������������������������������������������������������������������������57

                                                        6. IUU scores on port state responsibilities��������������������������������������������������������������������������������������������������������������� 71
                                                        6.1 Introduction and distribution of scores�����������������������������������������������������������������������������������������������������������������������������������������������������������71
                                                        6.2 Key findings���������������������������������������������������������������������������������������������������������������������������������������������������������������������������������������������������������������������73

                                                        7. IUU scores on general indicators not specific to other responsibilities ����������������������� 87
                                                        7.1 Introduction and distribution of scores��������������������������������������������������������������������������������������������������������������������������������������������������������� 89
                                                        7.2 Key findings�������������������������������������������������������������������������������������������������������������������������������������������������������������������������������������������������������������������� 90

                                                        8. Implications������������������������������������������������������������������������������������������������������������������������������������������������������������������������������������������������������� 101
                                                        8.1 What do the results imply about the need for action?���������������������������������������������������������������������������������������������������������������������� 101
                                                        8.2 What does the Index imply for SDG indicator 14.6.1?����������������������������������������������������������������������������������������������������������������������� 103

                                                        9. Introduction to the IUU Fishing Index website ��������������������������������������������������������������������������������������������� 107

                                                        10. Annex: Country scores ���������������������������������������������������������������������������������������������������������������������������������������������������������������� 112

II                                                                                                                                                                                                                                                                                          III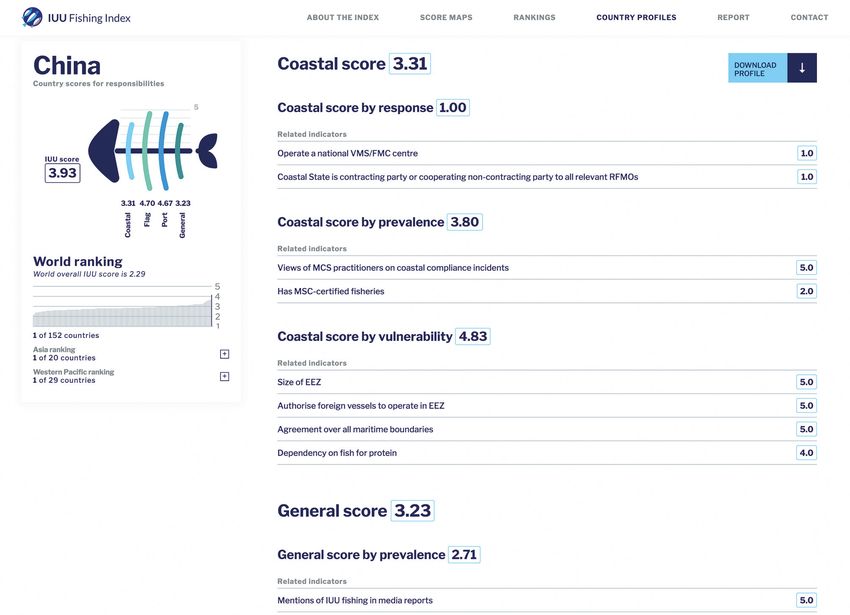
THE ILLEGAL, UNREPORTED AND UNREGULATED FISHING INDEX

Tables
Table 1. Indicator groups and names ��������������������������������������������������������������������������������������������������������� 10              Table 18. Flag state scores for region and indicator type ���������������������������������������������������������������������������� 63

Table 2. Number of indicators in different indicator groups and subgroups��������������������������������������������������� 13                               Table 19. Flag state scores for ocean basin and indicator type �������������������������������������������������������������������� 65

Table 3. Number of countries within score ranges for IUU fishing scores by type, aggregated across all                                                         Table 20. Port state indicators ���������������������������������������������������������������������������������������������������������������� 72
responsibilities ��������������������������������������������������������������������������������������������������������������������������������������� 25
                                                                                                                                                               Table 21. Number of countries within score ranges for port state IUU fishing scores ������������������������������������ 72
Table 4. Ten worst-performing countries for IUU fishing scores by type, aggregated by responsibility ������������ 27
                                                                                                                                                               Table 22. Ten worst-performing countries for port state responsibility IUU fishing scores, by indicator type ����� 75
Table 5. Ten best-performing countries for IUU fishing scores by type, aggregated by responsibility  � ������������� 29
                                                                                                                                                               Table 23. Ten best-performing countries for port state responsibility IUU fishing scores, by indicator type  � ������ 77
Table 6. All scores for regions by type, aggregated by responsibility� ������������������������������������������������������������� 31
                                                                                                                                                               Table 24. Port state scores for region and indicator type ��������������������������������������������������������������������������� 79
Table 7. All scores for ocean basins by type, aggregated by responsibility����������������������������������������������������� 33
                                                                                                                                                               Table 25. Port state scores for ocean basin and indicator type  � ������������������������������������������������������������������� 81
Table 8. Coastal state indicators��������������������������������������������������������������������������������������������������������������� 40
                                                                                                                                                               Table 26. General indicators  � ������������������������������������������������������������������������������������������������������������������� 88
Table 9. Number of countries within score ranges for coastal state IUU fishing scores � ���������������������������������� 40
                                                                                                                                                               Table 27. Number of countries within score ranges for ‘general’ state responsibility IUU fishing scores ��������� 88
Table 10. Ten worst-performing countries for coastal state responsibility IUU fishing scores, by indicator type  � ��� 43
                                                                                                                                                               Table 28. Ten worst-performing countries for general state responsibility IUU fishing scores,
Table 11. Ten best-performing countries for coastal state responsibility IUU fishing scores, by indicator type ���� 45                                        by indicator type  � ������������������������������������������������������������������������������������������������������������������������������������� 91

Table 12. Coastal state scores for region and indicator type ����������������������������������������������������������������������� 47                       Table 29. Ten best-performing countries for general state responsibility IUU fishing scores,
                                                                                                                                                               by indicator type  � ������������������������������������������������������������������������������������������������������������������������������������ 93
Table 13. Coastal state scores for ocean basin and indicator type  � �������������������������������������������������������������� 49
                                                                                                                                                               Table 30. General state scores for region and indicator type ���������������������������������������������������������������������� 95
Table 14. Flag state indicators. ���������������������������������������������������������������������������������������������������������������� 56
                                                                                                                                                               Table 31. General state scores for ocean basin and indicator type �������������������������������������������������������������� 97
Table 15. Number of countries within score ranges for flag state IUU fishing scores ������������������������������������ 56
                                                                                                                                                               Table 32. Worst-performing regions and ocean basins by indicator group �������������������������������������������������� 101
Table 16. Ten worst-performing countries for flag state responsibility IUU fishing scores, by indicator type ��� 59
                                                                                                                                                               Table 33. Worst-performing countries by indicator group ��������������������������������������������������������������������������102
Table 17. Ten best-performing countries for flag state responsibility IUU fishing scores, by indicator type ������ 61
THE ILLEGAL, UNREPORTED AND UNREGULATED FISHING INDEX

Acronyms                                                                                                            Acknowledgements

AIS - Automatic identification systems                                                                              Our thanks go to the Norwegian Ministry of Foreign Affairs for funding the
                                                                                                                    development of the IUU Fishing Index.
CCRF - Code of conduct for responsible fisheries
                                                                                                                    While most indicators used in the Index rely on publicly available secondary
CMM - Conservation and management measure                                                                           data, some rely on information and feedback from individuals/organizations.
                                                                                                                    We therefore acknowledge the important contributions by the following for
CNCP - Cooperating non-contracting party                                                                            data provision:

EEZ - Exclusive economic zone
                                                                                                                    •   Government officials/contacts, for provision of information used in
                                                                                                                        indicators 9, 13, 17, 19, 23 and 36.
EU - European Union

FAO - Food and Agriculture Organization (of the UN)                                                                 •   The Marine Stewardship Council (MSC), for data used in indicators 14 and 26.

FMC - Fisheries monitoring centre                                                                                   •   Pew Charitable Trusts for archived copies of its ‘International Fisheries
                                                                                                                        News’ email circulars, which form the basis of indicators 32 and 35, and for
HSVAR - High seas vessel authorization record                                                                           data from a Pew- funded project using automatic identification systems
                                                                                                                        (AIS) data (analysis by OceanMind) to determine countries receiving foreign
IPOA - International plan of action (to prevent, deter and eliminate illegal, unreported and unregulated fishing)       vessels into their ports (indicator 18).

IUU - Illegal, unreported and unregulated (fishing)                                                                 •   Fisheries observers, for information used in indicators 4 and 21.

MCS - Monitoring, control and surveillance
                                                                                                                    •   Monitoring, control and surveillance (MCS) practitioners, for information
                                                                                                                        used in indicators 5, 15 and 20.
MSC - Marine Stewardship Council

NOAA - National Oceanic and Atmospheric Administration                                                              Photos used in this report were taken by Poseidon staff and Gilles Hosch, or
                                                                                                                    sourced from https://www.pexels.com

NPOA-IUU - National plan of action (to prevent deter and eliminate illegal, unreported and unregulated fishing)
                                                                                                                    The design and layout of this report was completed by Café.art.br
PSMA - Port State Measures Agreement

RAV - Record of authorized vessels
                                                                                                                    Citation
RFMO - Regional fisheries management organization
                                                                                                                    This report should be cited as follows:
SDG - Sustainable Development Goal
                                                                                                                    Macfadyen, G., Hosch, G., Kaysser, N. and Tagziria, L., 2019. The IUU Fishing
UNCLOS - United Nations Convention on the Law of the Sea                                                            Index, 2019. Poseidon Aquatic Resource Management Limited and the Global
                                                                                                                    Initiative Against Transnational Organized Crime.
UNFSA - United Nations Fish Stocks Agreement

VMS - Vessel monitoring system

VI                                                                                                                                                                                                     VII
THE ILLEGAL, UNREPORTED AND UNREGULATED FISHING INDEX
The scores allow for comparisons to be made provide scores for each indicator for the country
Executive summary between countries, regions and ocean basins, and
serve to identify where action is most needed. The
Index, being repeatable and updated in 2020, will
concerned, and show how the country’s scores
compare with the average scores for the region and
the ocean basin(s) in which the country is located.
allow for changes to be monitored over time.
About the IUU Fishing Index The database underpinning the IUU fishing scores
A dedicated IUU Fishing Index website contains 5 528 separate data entries, based on
Incentives for illegal, unreported and unregulated (IUU) fishing are (IUUfishingindex.net) provides maps to visualize both publicly available data and expert opinion,
considerable given the financial benefits that can accrue in both large- scores by indicator type and responsibility, country with a high (95%) completion rate across all
and small-scale fishing operations, and in developed and developing ranking data, and 152 individual country profiles which indicators and countries
countries alike. IUU fishing is a major threat to the sustainable
exploitation of the world’s fisheries resources. The negative impacts of
IUU fishing are environmental through its depleting effect on fish stocks;
The Index scores and their implications
fisheries management is impacted by impairing scientific research; and
it has profound social and economic impacts on communities, those The global score across all state responsibilities and types of state responsibility indicators, and has the
working in the fisheries sector, and consumers. types of indicators is 2.29, with individual country worst overall scores for indicators aggregated by
scores ranging from 3.93 (the worst) to 1.43 (the responsibility and type. For the same reason, the
best). Sixty-four countries have a score that is worse Index scores imply the need for focus of action in both
Many actions have been taken at international, regional and national
than this global average, two have the exact same the Western Pacific and the East Indian Ocean basins.
levels to reduce IUU fishing. Indicator 14.6.1 of the Sustainable
score, and 86 have a better score.
Development Goals (SDGs), related to SDG 14 ‘Life Below Water’, is
dedicated to measuring achievements made towards the ambitious Some areas, such as the Western Pacific, that
target of eliminating IUU fishing by 2020. The table below highlights the worst-performing have poor scores for prevalence, have relatively
regions and ocean basins for different combinations good scores for response, suggesting that there is
of indicators related to state responsibilities and recognition of the need for action and that high policy
There are no reliable estimates of IUU fishing covering all countries
indicator types. It serves as a call to action in specific priority is given to fisheries by countries and regional
and using a standardized methodology to generate comprehensive and
areas. Asia merits special attention given its overall institutions. Other regions, such as the Middle East,
reliable figures of volumes and values for IUU fish catches. Doing so
poor rankings, and because it is a region where may have poor response scores because of the low
would be impossible with any degree of reliability, given the clandestine
much progress can be made through positive action. importance attributed to the sector by countries,
nature of IUU fishing, the fact that one methodology may not fit all
It is the region with the highest scores for all four signalling weak policy focus on the fisheries sector.
circumstances, and the multiple assumptions that would have to be
made. However, the lack of a robust basis by which countries can be
benchmarked – regarding both their exposure and response to IUU Worst-performing regions and ocean basins by indicator group
fishing – poses a problem for those in government, regional fisheries
management organizations, donors and civil society in seeking to
Type
identify where interventions are most needed.
Vulnerability Prevalence Response Overall
THE INDEX PROVIDES A This IUU Fishing Index has been developed to
• Oceania / Western • Asia / Western • Caribbean and • Asia / Western
address this need. For all 152 coastal countries of
MEASURE OF THE DEGREE the world, a score is calculated based on a suite of
Coastal Pacific Pacific Central America / Pacific
East Indian Ocean
TO WHICH 152 COASTAL 40 indicators. These relate to the prevalence of IUU
STATES ARE EXPOSED TO fishing in each country, and their vulnerability and • North America / • Asia / Western • Middle East / • Asia / Western
Flag
Responsibilities
response to it, drawing on various coastal, flag, port, Eastern Pacific Pacific Western Pacific Pacific
AND EFFECTIVELY COMBAT
and other state responsibilities. The scores do not
• North America / • Asia / Western • Middle East / West • Asia / Western
IUU FISHING indicate a measure of the volume or value of the Port
East Indian Ocean Pacific Indian Ocean Pacific
IUU fish catch, but they do indicate a standardized
measure of performance related to the 40 indicators included in the • Asia / East Indian • Asia / East Indian • Middle East / West • Asia / East Indian
General
Ocean Ocean Indian Ocean Ocean
Index. The Index therefore provides a measure of the degree to which
states are exposed to and effectively combat IUU fishing. • N America / • Asia / Western • Middle East / West • Asia / Western
Overall
Western Pacific Pacific Indian Ocean Pacific
1 2
THE ILLEGAL, UNREPORTED AND UNREGULATED FISHING INDEX

However, the aggregated scores for all countries in                developing countries in their drive to combat IUU       The Index scores provide a strong indication that the
a region or ocean basin may obscure the need for                   fishing across applicable state responsibilities. The   SDG target – to eliminate IUU fishing by 2020 – will
action in and by specific countries. The table below               vulnerability of island states also comes to the fore   not be achieved, and that combating IUU fishing
shows the countries that have the worst score for                  when ranking scores for both coastal and port state     remains a huge global challenge. The Index can
different indicator groups. The maps, ranking tables               indicators in particular.                               therefore be used to identify where action to address
and country profiles on the IUU Fishing Index website                                                                      this challenge is most needed.
provide indicator scores for all individual countries              Nations operating distant-water fishing fleets that
for different combinations of indicator groups. China,             yield poor scores for both flag state/prevalence and    Updated on a regular basis, the Index can serve as a
Taiwan, Indonesia, Russia and Cambodia are all                     flag state/response indicators may be considered        useful addition to the monitoring of indicator 14.6.1 by
countries of particular concern.                                   as particularly problematic. Solving their poor         the United Nations. It will also be beneficial to those
                                                                   performance would go a long way to help eliminate       with management responsibilities in governments
Developing countries are often especially vulnerable               IUU fishing globally, and there is a pressing need to   and regional fisheries-management organizations,
to IUU fishing. In addition, these countries also                  hold these countries to account for their actions       those wishing to fund activities aimed at reducing
often lack the resources to fully respond to the                   (or lack thereof), to monitor progress and to take      IUU fishing, civil society and consumers, and others,
challenges of, or combat, IUU fishing. This means that             remedial action where appropriate.                      such as seafood buyers, looking to ensure that their
mechanisms need to be established that support                                                                             sourcing of product responds to an impetus to buy
                                                                                                                           from sustainable sources.

Worst-performing countries by indicator group

                                                                        Type

                                Vulnerability         Prevalence                 Response                 Overall

                              • Japan            • Ecuador                  • Timor-Leste            • Cambodia
                              • Kiribati           Philippines              • Cambodia               • Somalia
                    Coastal
                              • Seychelles       • Sierra Leone             • Cameroon               • Vietnam
                                                    (+ 3 others)               (+ 6 others)

                              • China            • China                    • Singapore              • China
                              • France           • Taiwan                   • China                  • Taiwan
                     Flag
                              • Japan            • Panama                   • Libya/Russia           • Panama
                               (+ 4 others)
 Responsibilities

                              • Canada           • China                    • Bahrain                • China
                              • China            • Taiwan                   • Benin                  • Russia
                     Port
                              • France           • Vietnam                  • Brunei                 • Cambodia
                               (+ 9 others)                                    (+ 19 others)

                              • India            • Thailand                 • Singapore              • Viet Nam
                    General   • Vietnam          • Vietnam                  • Grenada                • Comoros
                              • Indonesia        • Mexico                   • Yemen                  • Cambodia

                              • China            • China                    • Singapore              • China
                    Overall   • Japan            • Taiwan                   • Cambodia               • Taiwan
                              • Russia           • Vietnam                  • Yemen                  • Cambodia

Notes: Countries with the same scores in rankings are listed alphabetically. Where more countries than
shown in the table have the same score, the number of additional countries is provided in brackets.

3                                                                                                                                                                                     4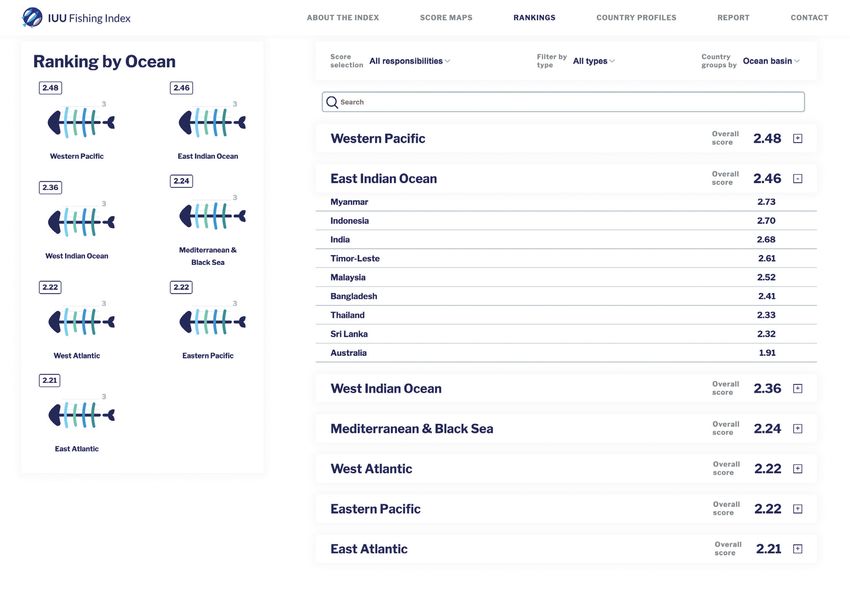
THE ILLEGAL, UNREPORTED AND UNREGULATED FISHING INDEX   INTRODUCTION

Introduction
5
                                                        1         6
THE ILLEGAL, UNREPORTED AND UNREGULATED FISHING INDEX INTRODUCTION
1. Introduction
Many actions have been taken, mainly since the mid- Indicator 14.6.1 of the Sustainable Development
1990s and the following decade, at international, Goals (SDGs), related to SDG 14 ‘Life Below Water’, is
regional, national and local levels to reduce levels dedicated to measuring achievements made towards
of IUU fishing. These have included international the ambitious target of eliminating IUU fishing by 2020.
and regional agreements, improvements in
monitoring, control and surveillance (MCS), sharing Despite these actions, however, the prevalence of
of intelligence and innovative use of technologies to IUU fishing remains a significant problem. But just
1.1 Background identify and track illegal activity. how significant is not clear.
Annual global production from capture fisheries has remained largely
stable for several years at around 90 million tonnes, 1 with 79.3 million
tonnes being produced from marine fisheries and 11.6 million tonnes
1.2 Why have an IUU Fishing Index?
from inland fisheries in 2016. The fishing sector is a multi-billion-dollar
Given the persistent concerns surrounding IUU in governments and regional fisheries management
business, with around 40 million people employed in capture fishing,
fishing, several studies in recent years have attempted organizations (RFMOs), those wishing to fund
plus many millions more in upstream businesses supplying inputs, and
to measure and report on the extent of the problem. actions aimed at reducing it and others, such as
downstream marketing and processing. Activities range from individual
Perhaps the most widely quoted is a study from 2009, seafood buyers looking to ensure sustainable
entrepreneurs operating small, unmotorized dugout canoes, mainly for
‘Estimating the worldwide extent of illegal fishing’, 3
sourcing, all clutching at piecemeal, often
subsistence or sales of product locally, to huge, vertically integrated
which estimated that the volume of IUU-caught fish unreliable, inconsistent and incomparable data.
fishing companies, with single vessels valued at over US$30 million that
in 2003 was equivalent to between 11% and 19% of The lack of a solid basis by which countries can be
move between the fishing zones of several countries. Such companies
reported catches, or 10 to 26 million tonnes of fish, benchmarked against one another poses a problem
have millions of dollars invested in processing plants and trade in
with a value of between US$10 billion and US$23 for those seeking to identify where interventions
globalized markets.
billion. However, the age of that study (and its use are most needed, and for countries themselves in
of 2005 data), the wide range between the upper understanding where policy focus should occur, or
Fish is a highly traded commodity and one of the most traded segments
and lower estimates, the lack of country-specific how their performance compares with others.
of the world food sector. Around 35% of fish harvested (by live weight
estimates and concerns over the raising factors used
equivalent) is exported, and in 2016 the value of world exports of fish
to generate the global estimate mean that it is of This index benchmarks countries according to
and fish products was US$143 billion 2. Different fish species have
little practical use beyond the fact that it provides an both their exposure and response to IUU fishing. It
very different unit values, with some individual tuna selling for tens of
alarming set of figures regarding the magnitude of the measures and maps the prevalence of IUU fishing in
thousands of dollars to sashimi markets, while small pelagic species, such
problem. More recent studies of IUU fishing in specific 152 coastal states, and the capacity to respond to
as sardine and mackerel destined for canneries, may be sold for as little
regions, countries or fisheries are often of low quality, or counter the threat of IUU fishing, as well as their
as US$100–200 per tonne. But, even taking into account these low-value
use different methodologies, are patchy in terms of vulnerability to its exposure. It also compares the
species, the large volumes of fish caught mean the value of fish landed
geographical coverage and their focus is often limited degree to which states are combating IUU fishing in
from a single fishing trip can run into hundreds of thousands of dollars.
to particular fisheries. Consequently, they do not four key ‘responsibility’ domains: coastal, flag, port
provide the basis for a global estimate or allow for a and general responsibilities. Each maritime state
THE UNITED NATIONS SUSTAINABLE These figures show that the incentives for illegal meaningful comparison of different countries. has its own strengths, weaknesses, challenges and
fishing in the sector are considerable given the
DEVELOPMENT GOAL 14, LIFE vulnerabilities when it comes to the threat posed
financial benefits that can accrue. These incentives
At present, there are therefore no reliable estimates by IUU fishing. Therefore, by combining these
BELOW WATER, HAS A TARGET TO exist both in large-scale and small-scale fishing
of IUU fishing at an aggregated global level that indicators into one comprehensive, comparative
END IUU FISHING BY 2020 operations, and illegal fishing represents a major
enable comparison between countries using a global index, practitioners and policymakers can
threat to the sustainable exploitation of the world’s
consistent methodology, and there is no simple way use it as a tool to identify where interventions need
fisheries resources. The negative impacts of IUU
to track changes in IUU fishing dynamics – or to to be prioritized. In this sense it fills a critical gap in
fishing are not just environmental: they can also have profound social
measure progress in reducing it over time. allowing benchmarking of countries’ exposure to, and
and economic impacts on communities, those working in the fisheries
performance in combating, IUU fishing. The Index,
sector and consumers.
This leaves those advocating for reduced levels of being repeatable and updatable at periodic intervals,
IUU fishing, those with management responsibilities will allow for changes to be monitored over time.
1. FAO, 2018: State of the Worlds Fisheries and Aquaculture 2016, http://www.fao.
org/3/i9942t/I9942T.pdf . 3. DJ Agnew et al, 2009: Estimating the Worldwide Extent of Illegal Fishing. PLOS ONE 4(2): e4570, doi:10.1371/ journal.
2. Ibid. pone.0004570.
7 8
THE ILLEGAL, UNREPORTED AND UNREGULATED FISHING INDEX INTRODUCTION
The 40 indicators included are listed on Tables 1 and 2.
1.3 Methodology
TABLE 1
Indicator groups and names
The IUU Fishing Index comprises 40 indicators, with
each indicator applied globally to 152 countries with a
Indicator Group Indicator Name
maritime coastline. The suite of indicators provides a
reliable and robust basis for an Index of IUU fishing and • Size of EEZ
for assigning scores to countries. Coastal state/ • Agreement over all maritime boundaries
Vulnerability • Authorized foreign vessels to operate in EEZ
• Dependency on fish for protein
The scores provide the basis for comparison between
countries, regions and ocean basins, and serve to identify Coastal state/ • Has MSC-certified fisheries
where action to combat IUU fishing is most needed. Prevalence • Views of MCS practitioners4 on coastal compliance incidents
Coastal state/ • Coastal state is contracting party or cooperating non-contracting party to all relevant RFMOs
For each country, a score is provided between 1 Response • Operate a national VMS or FMC
and 5 (1 = good/strong; 5 = bad/weak) comprised of
weighted indicators belonging to different ‘indicator Flag state/ • Distant-water vessels on RFMO RAVs
Vulnerability • Distant-water vessels under several RFMOs
groups’. Indicator groups relate to:
• Vessels on IUU lists
Flag state/
• View of fisheries observers on flag state compliance incidents
Prevalence
I. RESPONSIBILITIES • Views of MCS practitioners on flag state compliance incidents
• Accepted FAO Compliance Agreement
Coastal – indicators related to things states
• Authorized vessel data provided to FAO HSVAR
should do and their obligations in relation Flag state/
• Provision of vessel data for inclusion in Global Record
to IUU fishing that are specific to managing Response
• Compliance with RFMO flag state obligations
their exclusive economic zone (EEZ). • Flag state is contracting party or cooperating non-contracting party to all relevant RFMOs
Flag – indicators related to things states Port state/ • Number of fishing ports
Vulnerability • Port visits by foreign fishing or carrier vessels
should do and their obligations in relation to
IUU fishing that are specific to vessels they Port state/ • Views of MCS practitioners on port compliance incidents
flag (i.e. that are on their vessel register). Prevalence • View of fisheries observers on port compliance incidents
Port – indicators related to things states should • Party to the Port State Measures Agreement
Port state/Response • Designated ports specified for entry by foreign vessels
do and their obligations in relation to IUU fishing
• Compliance with RFMO port state obligations
that are specific to managing their ports.
• Perception of levels of corruption
‘General’ – these are indicators that are not • Gross national income per capita
specific to flag, coastal or port state responsibilities, General/Vulnerability • Volume of catches
including market-related indicators, and • Trade balance for fisheries products
indicators applicable to the sector as a whole. • Share of global imports
• ‘Carded’ under the EU IUU Regulation
II. TYPES General/Prevalence • Identified by the National Oceanic and Atmospheric Administration for IUU fishing
• Mentions of IUU fishing in media reports
Vulnerability – indicators that relate to
risks that IUU fishing may occur. • Mandatory vessel tracking for commercial seagoing fleet
• Ratification/accession of UNCLOS Convention
Prevalence – indicators that relate to • Ratification of UN Fish Stocks Agreement
General/
known/suspected IUU incidents. • Mentions in media reports of combating IUU fishing
Response
• Have a national plan of action to prevent, deter and eliminate IUU (NPOA-IUU) fishing
Response – indicators that relate to actions • Demand for MSC productss
setting out to reduce IUU fishing. • Market state is contracting party or cooperating non-contracting party to relevant RFMOs
4. Those working for governments in fisheries enforcement agencies.
9 10THE ILLEGAL, UNREPORTED AND UNREGULATED FISHING INDEX INTRODUCTION
Indicator groups How to read this diagram
Rati
Ma
and names
ficat
rke non-
s
darie
t St con
ion/a
Type related Weighting
ate tra
arrow head shape radius lenght
Ratification/ac
boun
EZ
cces
is c ctin
Vulnerability
nE
ont g p
time
sion
ei
tein
at
M ce
ra c a r t y
en alen
er
Prev
mari
of U
pro
Low
se
tio
op
ting to
on
ns
M
to
for
sp
NCL
cession of UNFS
in
er all
en
par rele
Re
els
m
s
fish
Ma ed
tio m
nt
OS C
ty o an
ss
nd ia Medium
in rs
de
n
nt ov
co
ato re
ve
e ne
si
on
ci
Size of EEZ
D
ry p
r co t RF
n
nc io
or
em
ign
ve
onve
b
cy
m ng
v
ia it
s ts
eme
a
se
an
pl act
to
ed IU
re
ope MO
tti
den
l tr s
d
co ie High
fo
om pr
ia U
ac r
fo
ntio
kin m he re
Agre
ra t s
re
lc S
pen
rM
ize
gf ba
fis nt
ta C
ce
po shi ts
A
tt
as f M
or
SC
ing
n
or
in d C
co fie
De
rts ng
fi
g FM ting
th
co s o
mm ti
pr
IU r S / e ra
Au
od
to
ce
on iew
er U p
cia fis
CO
- VM o
r co Os
uc
AS l
ls TA
SC na y o t RFM
V
Trad ea hi L i o a r t
ng
sM at g p van
ST
e go
an
A
bala
nce
in gfl Ha e r a ctin ll rele
ont to a
TE
for ee at
fi she t er is c party
ries Op t e
Ident Sta ing
pro t a l t ra c t
TE
ified duc a s RAVs
n FMO
TA
by N
OAA
ts Co n-co n R
LS
o
fo r IUU no ssels
ter ve
ERA
fishin n t w a
g Dista
GEN
Mentions of IU ral RFMOs
U fishing in med
ia reports ssels under seve
Distant water ve
ts View of fisher
for fis heries produc state complia ies observers on flag
Trade balance nce incidents
View
orts state of fisheri
ba l imp comp es
f glo liance observer
F
o
L
re Vie incide s on fl
Sha
A
e s ws ag
GS
tch nts
f ca of M
TA
eo Co C Sp
TE
u m a
Vol a pit mp
lia
ra c
titi
rc Pr nc one
pe n ov ew rs o
e tio is nfl
c om ru
p io ith ag
Fl n-
l in n RF sta
or
A
no
ag co
a of MO te c
fc
SM
ion om
Ac
ve
St nt
PO fla
at so
s
RT S plia
ion
ss
eP
n gs
a t ra
TATE
el nce
ce
s
Au
ess d
os el ta
e ct
ev
els
inc
n v ifie
Num
Gr
t
th
pt
da te
nciderver
l
is in
ide
nts
iga
tho
Port visits by fo s
on port complia actitioners
or carrier vessel
Views of MCS
of ta ob nts
e
to
co g p
reig pec
l
dF
on fo i ga
l
ob
nt ar
rize
rty
e
i
ber o
ri tio
pt
AO
s obs
ra t y
nc
y fo rts s
ns
Pa
e
e
ct to
rc
dv
lu
tat
C
e si
in a
nce i
f fish
om
P on
ess
g ll
ry b po
rt s
e
pa re
in
r i
p
ent ted
e
po
Gl
el d
lia
rt le
mplia
on poiew of fish
ing p
ob
y o va
nc
pr
MO
for signa
al
ata
reign fishing
nce incidents
r c nt
eA
Re
oo RF
RF
orts
rt co
co
pro
g
pe M
rd
De
re
ith
ra O s
em
vid
ew
V
tin
en
ed
g
nc
t
to F
lia
mp
AO
Co
HS
VA
R
11 12THE ILLEGAL, UNREPORTED AND UNREGULATED FISHING INDEX INTRODUCTION
TABLE 2
Number of indicators in different indicator groups and subgroups
Responsibilities Number % of total Subgroups Number % of total
Flag 10 25.00% Flag vulnerability 2 5.00%
Coastal 8 20.00% Flag prevalence 3 7.50%
Port 7 17.50% Flag response 5 12.50%
General 15 37.50% Coastal vulnerability 4 10.00%
TOTAL 40 Coastal prevalence 2 5.00%
Types Number % of total Coastal response 2 5.00%
Vulnerability 13 32.50% Port vulnerability 2 5.00%
Prevalence 10 25.00% Port prevalence 2 5.00%
Response 17 42.50% Port response 3 7.50%
TOTAL 40 General vulnerability 5 12.50%
General prevalence 3 7.50%
General response 7 17.50%
TOTAL 40
All countries are assigned individual scores, with their Index are provided in a separate methodological
scores also allocated to both a region and relevant paper published on the IUU Fishing Index website
ocean basin(s), to allow for analysis of Index scores by (IUUfishingindex.net/methodology).
individual country, region and ocean basin. Scores for
any region or ocean basin are the average scores of all The methodological paper openly acknowledges and
countries in that region/ocean basin. Where countries discusses weaknesses of the Index and its indicators.
have a coastline in two ocean basins, their scores are No composite indicator, or index, can ever be ‘perfect’,
and render through a score – or series of scores – a
included in the averages of both ocean basins.
genuinely truthful picture of a complex real-world
situation. An index always remains an approximation,
Sources of data for the indicators include and will always resonate more with the real-world
a mix of publicly available sources, country situation on the ground in some places than in others.
correspondents for certain indicators that require
factual data at country level and expert opinion. The database underpinning the IUU fishing scores
A full methodological description of the basis for contains 5 528 separate data entries, with a
high (95%) response/completion rate across all
selecting indicators, sources of data, thresholds
indicators/countries.
used for scores between 1 and 5 for the values
associated with each indicator, strengths and
weaknesses of each indicator, weightings of different
indicators, and other technical considerations for
compiling the indicator scores and raising the IUU
13 14THE ILLEGAL, UNREPORTED AND UNREGULATED FISHING INDEX INTRODUCTION
Introduction
to the results
15
2 16THE ILLEGAL, UNREPORTED AND UNREGULATED FISHING INDEX INTRODUCTION TO THE RESULTS
action to combat IUU fishing is most needed. The
2. Introduction scores will also be useful for comparative purposes
over time, as the Index will be updated in 2020, to
assess change and progress.
to the results Scores between indicator groups are not directly
comparable because the specification thresholds and
weightings differ between indicator groups. So, for
example, a score of 2.5 for coastal state indicators is
not directly comparable with a score of, say, 2 for port
state indicators, and does not imply that coastal state
2.1 Structure of this report performance is worse than port state performance,
or that there is a need to focus more effort on coastal
state performance than on port state performance.
Results are organized into sections of the report as follows:
Section 3 provides results at an aggregated level, highlighting The IUU fishing scores for countries contained in
best- and worst-performing countries, and exploring differences the Index are not a proxy for volumes and values
in aggregated scores between regions and ocean basins. of IUU fish catch. They represent a standardized
performance score related to the 40 indicators
included in the Index. The scores therefore represent
Section 4 provides results pertaining to coastal states, a measure of vulnerability, prevalence and response,
presenting data on scores by type (i.e. vulnerability, prevalence across different state responsibilities.
and response), and highlighting geographical differences.
The IUU fishing country scores cannot, and should
not, be used with any algorithm to generate
Section 5 provides results pertaining to flag states, presenting estimated volumes and values of IUU fish catch for
data on scores by type and highlighting geographical differences. different countries.
Scores of 1 for vulnerability, prevalence and response
Section 6 provides results pertaining to port states, presenting
indicators do not imply that a country has no
data on scores by type and highlighting geographical differences. vulnerability and no IUU fishing, although certainly
imply very good performance. Likewise, scores of 5
for response indicators do not imply that a country
Section 7 provides results pertaining to states in general (i.e. not
is doing nothing to combat IUU fishing, but clearly
results that are specific to flag, coastal or port states), presenting indicate that there are responses to IUU fishing which
data on scores by type and highlighting geographical differences. countries could take.
Section 8 highlights some implications of the results.
Section 9 provides and introduction to the IUU
Fishing Index website (IUUfishingindex.net)
2.2 Comments on
interpretation of scores
The main use of the IUU fishing scores is to allow for a comparison
between countries, regions and ocean basins for single indicators or for
different indicator groups. This enables users of the Index to identify
better/worse performers by ranking them and to determine where
17 18THE ILLEGAL, UNREPORTED AND UNREGULATED FISHING INDEX INTRODUCTION TO THE RESULTS How to read the fishbone graphics used in this report Skull and tail Represents the overall IUU Fishing score, larger fish skull and tail showing high/poor scores Fishbones Coastal General The fishbones represent the Flag Port coastal, flag, port, and general state responsibilities, with larger fishbones showing high/poor scores. 19 20
THE ILLEGAL, UNREPORTED AND UNREGULATED FISHING INDEX   IUU SCORES FOR COASTAL STATE RESPONSIBILITIES

IUU fishing
scores for
all state
responsibilities
21
                                                                         3                        22
THE ILLEGAL, UNREPORTED AND UNREGULATED FISHING INDEX IUU SCORES FOR COASTAL STATE RESPONSIBILITIES
World overall
2.29 IUU score
23 24THE ILLEGAL, UNREPORTED AND UNREGULATED FISHING INDEX IUU FISHING SCORES AGGREGATED ACROSS ALL STATE RESPONSIBILITIES
3. IUU fishing scores 3.2 Key findings
aggregated across Tables 4 and 5 show the ten countries with the highest
(worst performing) and lowest (best performing)
scores for aggregated responsibilities, for all types
For scores aggregated by both state
responsibility and type of indicator, eight of
the ten countries with the best scores are in
all state responsibilities of indicators, and for indicators broken down by
vulnerability, prevalence and response. They also show
Europe. The Asian country with the best score
is Brunei, ranked 67 th out of 152 countries.
scores by region and ocean basin.
European countries dominate the list of
A full list of scores for all 152 countries aggregated
ten best-performing countries in terms of
across responsibilities is provided in the Annex at the
prevalence, along with Canada and New Zealand,
end of this report.
3.1 Introduction and but top performers in terms of response are
distribution of scores The reasons underlying these scores is more fully
from five of the eight regions, while countries
with best scores in terms of vulnerability are
discussed in later sections of this report, which consider
The distribution of individual country scores aggregated by indicator responsibility to be found in the European, South American,
coastal, flag, port and general state responsibilities, and
(shown below) indicates that no countries have scores of over 4; only one has Caribbean and Central American regions.
the indicators associated with them.
a score of under 1.5. A large number of countries (123 or 81%) fall within the 2
to 2.99 score boundaries. When the scores aggregated by responsibility are
However, in summary, the following factors are of When considering the performance of different
broken down by indicator type (vulnerability, prevalence and response), scores for
interest: regions and ocean basins for all types of
countries are more widely distributed for response and vulnerability indicators.
indicators combined, the Asian region and
Prevalence scores show a high percentage of countries (89%) that fall within a
the Western Pacific basin (bordering the Asian
score range of 1 to 1.99. The global total score
continent) produce the worst scores, while the
aggregated across all state responsibilities
European region and the East Atlantic ocean basin
and types of indicator is 2.29.
(bordering the European and African continents)
have the best. Asia is also the region with the worst
TABLE 3
prevalence score. The two Pacific regions (west
Number of countries within score ranges for IUU fishing Individual country scores, aggregated across all
and east) come to the fore as the most vulnerable.
scores aggregated across all responsibilities indicator responsibilities and types, range from
3.93 for China (the worst-performing country) to
Vulnerability Score Prevalence Score Response Score
1.43 for Belgium (the best-performing country).
Range IUU Score Distribution
Distribution Distribution Distribution
4.50—4.50 0 0 0 0
China, Indonesia, Russia and Cambodia
4.00—4.49 0 3 1 3 all feature among the ten worst-performing
countries for two out of three indicator types.
3.50—3.99 1 17 1 13
3.00—3.49 5 49 1 32
For scores aggregated by both state
2.50—2.99 30 50 1 24 responsibility and type of indicator, the
worst-performing countries are all in Asia,
2.00—2.49 93 28 12 53
and the region has four countries in the ten
1.50—1.99 22 5 44 26 worst-performing countries. Africa has four of
the ten countries with the worst scores, the
1.00—1.49 1 0 92 1
Middle East one, and Europe one (Russia 5 ).
5. Note that although Russia straddles both the East Atlantic and Western Pacific ocean basins, all countries are allocated to
one geographical region only; for the Index, Russia has been assigned to the European region.
25 26THE ILLEGAL, UNREPORTED AND UNREGULATED FISHING INDEX IUU FISHING SCORES AGGREGATED ACROSS ALL STATE RESPONSIBILITIES
TABLE 4
Ten worst-performing countries
for IUU fishing scores by type, aggregated by responsibility
All types Vulnerability
China 4.44
#1 China #6 Sierra Leone
Japan 4.28
5 5
3.93 3
3.01 3 Russia 4.22
1 1 USA 3.96
France 3.92
Indonesia 3.92
Philippines 3.92
#2 Taiwan #7 Yemen S Korea 3.91
5 5
3.34 3 2.96 3
Spain 3.91
1 1 Morocco 3.84
Prevalence
China 4.44
Taiwan 4.28
#3 Cambodia #8 Sudan
5 5 Vietnam 4.22
3.23 3 2.77 3 Thailand 3.96
1 1
Panama 3.92
Russia 3.92
Cambodia 3.92
Sierra Leone 3.91
#4 Russia #9 Liberia
Ecuador 3.91
5 5
3.16 3 2.76 3
Indonesia 3.84
1 1
Response
Singapore 4.29
Cambodia 4.00
#5 Vietnam #10 Somalia Yemen 4.00
5 5 Saint Lucia 3.81
3.16 3 2.75 3
Haiti 3.80
1 1
N Korea 3.75
Iraq 3.73
Cameroon 3.71
The fishbone colours, by responsibility: Jamaica 3.71
Coastal Flag Port General Grenada 3.71
27 28THE ILLEGAL, UNREPORTED AND UNREGULATED FISHING INDEX IUU FISHING SCORES AGGREGATED ACROSS ALL STATE RESPONSIBILITIES
TABLE 5
Ten best-performing countries
for IUU fishing scores by type, aggregated by responsibility
All types Vulnerability
Monaco 1.56
#1 Belgium #6 Sweden
Belgium 1.80
5 5
1.43 3
1.73 3 Slovenia 1.80
1 1 Uruguay 1.87
Barbados 1.95
Dominica 2.00
Estonia 2.00
#2 Latvia #7 Bulgaria Latvia 2.00
5 5
1.57 3 1.74 3
Finland 2.05
1 1 Israel 2.05
Prevalence
Canada 1.00
Denmark 1.00
#3 Estonia #8 Belize
5 5 Iceland 1.00
1.67 3 1.78 3 New Zealand 1.00
1 1
Norway 1.00
Sweden 1.00
Ireland 1.07
Estonia 1.15
#4 Finland #9 Tonga
Finland 1.22
5 5
1.67 3 1.82 3
France 1.22
1 1
Response
Belgium 1.28
Poland 1.50
#5 Poland #10 Ireland Latvia 1.53
5 5 Bulgaria 1.53
1.68 3 1.85 3
Ghana 1.56
1 1
USA 1.56
Australia 1.58
Belize 1.61
The fishbone colours, by responsibility: Iceland 1.62
Coastal Flag Port General Canada 1.64
29 30THE ILLEGAL, UNREPORTED AND UNREGULATED FISHING INDEX IUU FISHING SCORES AGGREGATED ACROSS ALL STATE RESPONSIBILITIES
TABLE 6
Scores for regions
by type, aggregated by responsibility
All types Vulnerability
North America 3.71
#1 Asia #5 South America
Asia 3.32
5 5
2.69 3
2.19 3 Oceania 3.06
1 1 Africa 3.05
South America 2.90
Europe 2.75
Middle East 2.60
#2 Africa #6 Oceania Caribbean and Central America 2.58
5 5
2.38 3 2.16 3
World overall 2.91
1 1
Prevalence
Asia 2.05
Africa 1.57
#3 Middle East #7 North America
5 5 South America 1.51
2.32 3 2.13 3 Caribbean and Central America 1.48
1 1
Oceania 1.44
North America 1.43
Europe 1.37
Middle East 1.33
#4 Caribbean and Central America #8 Europe
5 5
World overall 1.54
2.24 3
2.05 3
1 1
Response
Middle East 3.24
Asia 2.77
Caribbean and Central America 2.70
Africa 2.60
World overall
5
South America 2.27
2.29 3 Oceania 2.15
1
Europe 2.10
North America 1.60
World overall 2.48
The fishbone colours, by responsibility:
Coastal Flag Port General
31 32THE ILLEGAL, UNREPORTED AND UNREGULATED FISHING INDEX IUU FISHING SCORES AGGREGATED ACROSS ALL STATE RESPONSIBILITIES
TABLE 7
Scores for ocean basins
by type, aggregated by responsibility
All types Vulnerability
Western Pacific 3.27
#1 Western Pacific #5 Eastern Pacific
East Indian Ocean 3.20
5 5
2.48 3 2.22 3 Eastern Pacific 3.14
1 1 East Atlantic 2.96
West Indian Ocean 2.87
Mediterranean and Black Sea 2.86
West Atlantic 2.70
#2 East Indian Ocean #6 West Atlantic World overall 2.91
5 5
2.46 3 2.22 3
1 1
Prevalence
Western Pacific 1.88
East Indian Ocean 1.76
#3 West Indian Ocean #7 East Atlantic
5 5 Eastern Pacific 1.60
2.36 3 2.21 3 West Indian Ocean 1.50
1 1
East Atlantic 1.47
West Atlantic 1.47
Mediterranean and Black Sea 1.42
World overall 1.54
#4 Mediterranean and Black Sea
5
2.24 3
1
Response
West Indian Ocean 2.78
West Atlantic 2.57
East Indian Ocean 2.51
Mediterranean and Black Sea 2.51
World overall
5
Western Pacific 2.41
2.29 3 East Atlantic 2.28
1
Eastern Pacific 2.07
World overall 2.48
The fishbone colours, by responsibility:
Coastal Flag Port General
33 34THE ILLEGAL, UNREPORTED AND UNREGULATED FISHING INDEX IUU SCORES FOR COASTAL STATE RESPONSIBILITIES
IUU fishing
scores for
coastal state
responsibilities
35
4 36World overall 2.51 Coastal score
THE ILLEGAL, UNREPORTED AND UNREGULATED FISHING INDEX IUU SCORES FOR COASTAL STATE RESPONSIBILITIES
TABLE 8
4. IUU scores for Coastal state indicators
Indicator Group Indicator Name
coastal state Coastal state/
Vulnerability
• Size of EEZ
• Agreement over all maritime boundaries
• Authorized foreign vessels to operate in EEZ
responsibilities Coastal state/
Prevalence
• Dependency on fish for protein
• Has MSC-certified fisheries
• Views of MCS practitioners on coastal compliance incidents
Coastal state/ • Coastal state is contracting party or cooperating non-contracting party to all relevant RFMOs
Response • Operate a national VMS/FMC centre
4.1 Introduction and The distribution of individual country scores (see Table 9) indicates that when
distribution of scores considering all indicator types combined for coastal state responsibilities,
142 countries (i.e. 93% of those in the Index) score between 1.5 and 3.49.
Vulnerability scores are the most distributed across all score ranges for the
Indicators included within the coastal state responsibilities indicator
different types of indicators. Prevalence and response indicators both have
group are shown in the table below. Large EEZs, a failure to have
over 68% of countries scoring within a single score range (2.5 to 2.99 in the
agreed maritime boundaries, authorizing foreign vessels to fish
case of prevalence indicators, and 1 to 1.49 in the case of response indicators).
in a state’s EEZ and high dependency on fish for protein, all serve
to increase the risk of IUU fishing. Having MSC-certified fisheries
provides an indication that actual levels of IUU fishing may be low TABLE 9
given MSC-criteria associated with certification. And the views
Number of countries within score ranges for coastal state IUU fishing Scores
of those working in MCS also provide a good indication of which
countries most commonly exhibit
Range Coastal Coastal by Vulnerability Coastal by Prevalence Coastal by Response
compliance incidents reflecting of
THE DISTRIBUTION OF INDIVIDUAL IUU fishing. Responses by states that 4.50—4.50 0 20 1 1
can help better ensure reduced levels
COUNTRY SCORES (SEE TABLE 9) 4.00—4.49 1 27 5 8
of IUU fishing in their EEZs include
INDICATES THAT WHEN CONSIDERING becoming a contracting party or 3.50—3.99 7 23 8 0
ALL INDICATOR TYPES COMBINED FOR cooperating non-contracting party
(CNCP) to the RFMOs relevant to 3.00—3.49 22 25 6 22
COASTAL STATE RESPONSIBILITIES, 142
the ocean basins in which the state 2.50—2.99 49 16 106 0
COUNTRIES (I.E. 93% OF THOSE IN THE is located, and establishing an FMC
INDEX) SCORE BETWEEN 1.5 AND 3.49. capable of identifying and monitoring 2.00—2.49 49 18 8 1
vessel location through the use of VMS.
1.50—1.99 22 17 2 16
1.00—1.49 2 6 16 104
39 40THE ILLEGAL, UNREPORTED AND UNREGULATED FISHING INDEX INTRODUCTION
4.2 Key findings
Tables 10 and 11 show the ten best- and worst- to generate licence revenue given the state of
performing countries in terms of coastal state development of their own fishing industries; are
responsibilities, by indicator type, and scores by home to migratory tuna resources; and have a
region and ocean basin. Comments, observations and high dependence on fish protein.
explanations include:
However, in terms of prevalence of IUU
fishing in coastal state waters, Asia as
The average IUU fishing score for coastal state a region ranks as the worst, and second
responsibilities, aggregated for all types of worst in terms of response to IUU, after the
indicator, is 2.51. Caribbean and Central American region.
Individual country scores, aggregated across
In terms of ocean basins, the Western Pacific
types for coastal responsibilities range from 4.00
comes to the fore as the most vulnerable,
for Cambodia (the worst-performing country) to
for the same reasons as stated above for
1.19 for Germany (the best-performing country).
Oceania. However it performs well compared
to other ocean basins in terms of response.
While France and Denmark appear as European The East and West Indian Ocean basins have
countries that are particularly vulnerable to IUU the worst scores for prevalence indicators.
fishing, and Albania as a European country with a
poor response to IUU fishing, the worst performers
generally (across all types) are located in Asia,
Oceania and Africa.
Only two out of the ten most vulnerable coastal
states do not have a geographical layout
consisting of, or encompassing substantial island
territory, underlining the general vulnerability
of island states to IUU fishing – developed and
developing alike.
In a similar vein, six out of the ten worst coastal
state responders to IUU are developing island
states, underlining the combination of strong
exposure to risk and weak governance among
such states.
European countries dominate the lists of best
coastal state performers across all types.
With regard to regions, Oceania has the
highest score for vulnerability to IUU fishing,
reflecting the region’s scores for the four
vulnerability indicators. Countries in this region
often have large EEZs; lack agreement over all
maritime borders; allow foreign vessels access
41 42You can also read


