Using MCAT Data in 2022 Medical Student Selection - AAMC
←
→
Page content transcription
If your browser does not render page correctly, please read the page content below

Using MCAT Data in 2022
           ®

Medical Student Selection

                  MCAT® is a program of the
                  Association of American Medical Colleges

                  www.aamc.org/mcat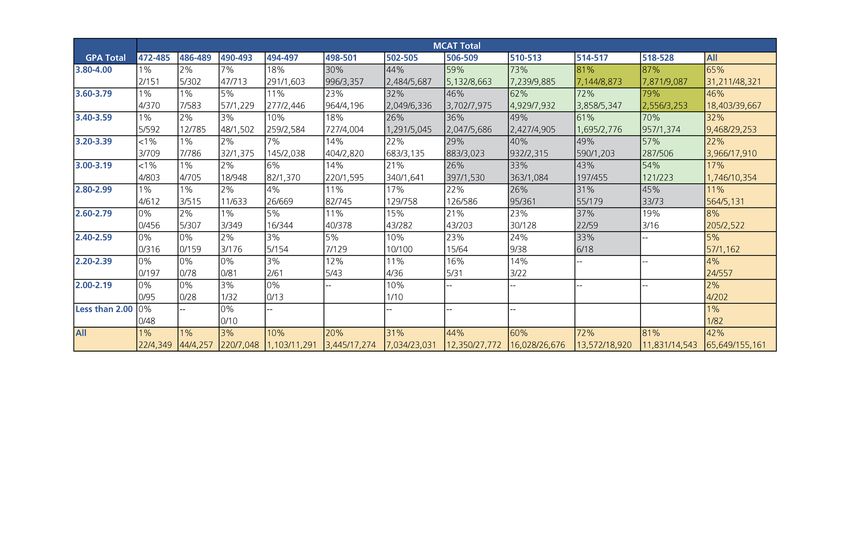
Using MCAT® Data in 2022
Medical Student Selection

              AAMC
          Washington, D.C.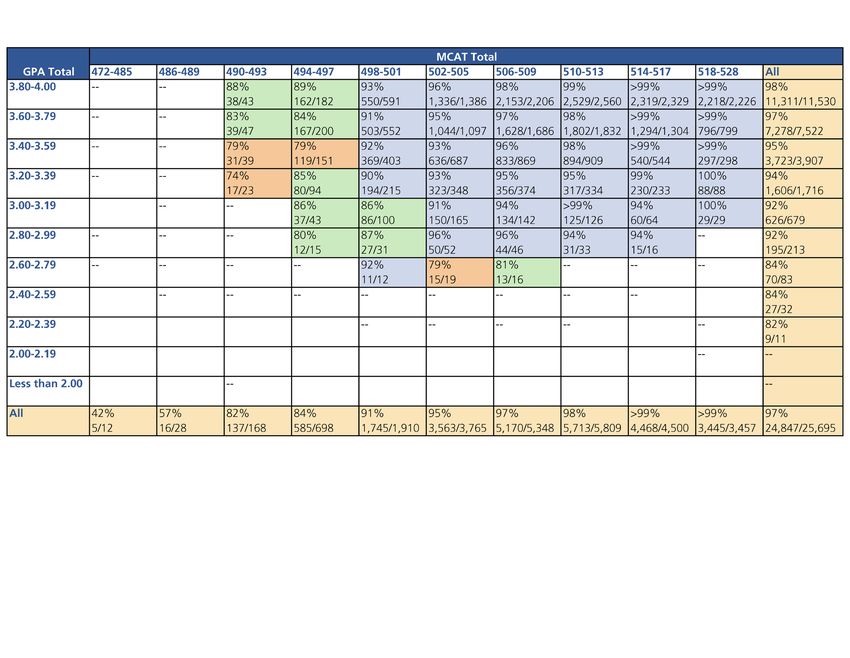
The AAMC (Association of American Medical Colleges) is a not-for-profit association dedicated
to transforming health through medical education, health care, medical research, and community
collaborations. Its members are all 155 accredited U.S. and 17 accredited Canadian medical schools; more
than 400 teaching hospitals and health systems, including Department of Veterans Affairs medical centers;
and more than 70 academic societies. Through these institutions and organizations, the AAMC leads and
serves America’s medical schools and teaching hospitals and their more than 179,000 full-time faculty
members, 92,000 medical students, 140,000 resident physicians, and 60,000 graduate students and
postdoctoral researchers in the biomedical sciences. Additional information about the AAMC is available
at aamc.org.

Suggested citation: AAMC. Using MCAT® Data in 2022 Medical Student Selection. Washington, DC:
AAMC; 2021.

© 2021 Association of American Medical Colleges. May not be reproduced or distributed without prior
written permission. To request permission, please visit aamc.org/reproductions.
Contents
Letter to Admissions Officers   v

Introduction   1

   COVID-19 and the MCAT exam   10 1

What does the MCAT exam measure?   2

How is the MCAT exam scored?   4

Who takes the MCAT exam?           5

How do examinees prepare for the MCAT exam?               6

How well do examinees score on the MCAT exam?                 7

How precise are examinees’ MCAT scores, and how should they be interpreted?   9

   Confidence bands   10

   Percentile ranks     11

   Score profile   11

How do examinees’ scores change when they retake the MCAT exam, and how do admissions
officers use scores for applicants who test more than once?   12

How do admissions officers use MCAT scores and other application data in the holistic review
of applicants’ qualifications?   14

How well do undergraduate GPAs and MCAT scores predict students’ performance in
medical school?   17

   Relationships of MCAT scores with students’ preclerkship, Step 1, clerkship, and Step 2 CK performance
   19

   Relationships of undergraduate GPAs and MCAT scores with students’ preclerkship, Step 1, clerkship, and
   Step 2 CK performance   24

   Relationships of undergraduate GPAs and MCAT scores with key milestones: Passing the Step 1 and Step
   2 CK exams on the first attempt and graduation within four years   26

   Bringing it all together   32

   Conclusions and next steps   33

References   34

Appendix A. Description of the Foundational Concepts, Scientific Inquiry and Reasoning Skills,
and Information-Processing Skills Tested on the Four Sections of the MCAT Exam   36

Appendix B. Summary of MCAT Total and Section Scores   41

Appendix C. MCAT Validity Research         43

                                                                                           Association of
                                                    iii
                                                                                           American Medical Colleges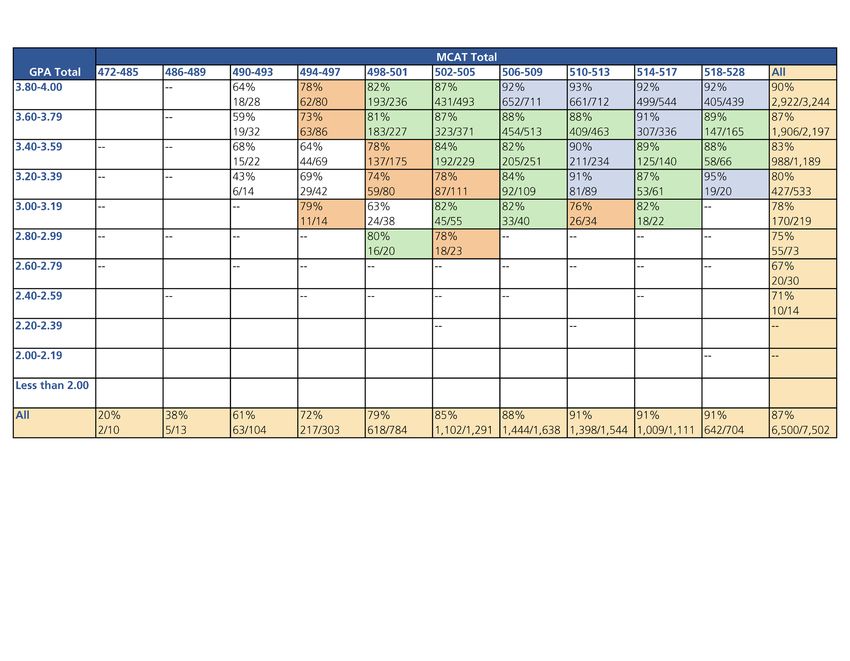
Letter to Admissions Officers
As we enter our second year of the global COVID-19 pandemic, we find both hope in the promise of vaccines
and grief at the continued loss of life during this global public health crisis. The pandemic continues to affect
educational opportunities; pose additional considerations for MCAT® testing; and present uncertainty for
personal, financial, and professional health and safety. The 2021 admissions cycle was overwhelming in
many ways, particularly under the extraordinary circumstances of the pandemic and with an unprecedented
increase in application volume. I know all of you worked diligently to overcome these difficulties, expand your
capabilities, and adapt your processes to help your applicants through the last admissions cycle.

In 2020, numerous instances of racially motivated violence and the exacerbation of existing health inequities
in disadvantaged communities by the COVID-19 pandemic prompted many in our country to begin reckoning
with its history of systemic and individual racism. Academic medicine began to acknowledge the impact of
systemic racism on society and in our field, and many institutions pledged to become anti-racist institutions.
Medical schools have been engaging in active discussions of how to meet the critical need to diversify the
physician workforce. Our admissions community plays a vital role for our schools and for the practice of
medicine, by recruiting and supporting applicants who are underrepresented in medicine and who come from
disadvantaged and diverse backgrounds.

As we enter the 2022 admissions cycle, we continue to face challenges in the admissions process, but know
that we will continue to learn lessons and find solutions as well. The AAMC Committee on Admissions (COA)
remains fully committed to supporting applicants and schools and to maintaining the integrity of holistic
review as we navigate these uncharted waters together.

The key to navigating the 2022 admissions cycle continues to be flexibility. It is more important than ever to
use your existing holistic review practices to consider students’ educational opportunities, lived experiences,
attributes, and other application components. Many of your 2022 applicants have experienced disrupted
learning, finished more than a year of undergraduate education online, faced reduced opportunities
for in-person clinical experiences and shadowing, and encountered additional burdens while preparing
for the MCAT exam. Applicants continue to be anxious about how these circumstances will affect the
competitiveness of their applications and whether we as admissions officers understand the difficulties they
are facing. Irregularities in applicants’ recent academic metrics may need to be further contextualized against
this backdrop of disruption and lost opportunities.

I hope the data presented in this guide will help your admissions committee construct a class that meets the
academic, clinical, service, and/or research missions of your medical school. While these data provide the
foundation for using MCAT scores in the context of this unusual time, we will likely all need to continue to
adapt and iterate throughout this and future admissions cycles. You can find the most up-to-date resources
related to admissions during the COVID-19 pandemic on AAMC’s website at aamc.org/mcatadmissions.

Please don’t hesitate to reach out to MCAT staff at mcatadmissions@aamc.org with questions.

Sincerely,

Lina Mehta, MD
Chair, AAMC Group on Student Affairs Committee on Admissions
Associate Dean for Admissions, Office of Admissions
Professor, Department of Radiology
Case Western Reserve University School of Medicine

                                                                                               Association of
                                                       v
                                                                                               American Medical Colleges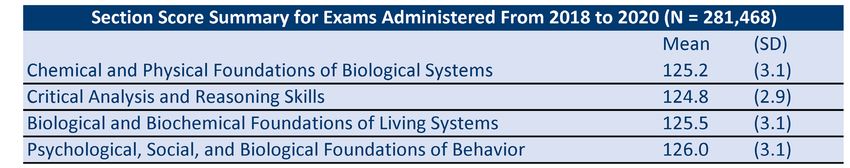
Using MCAT Data in 2022 Medical Student Selection

Introduction
This guide provides current information and data about the MCAT exam to help admissions officers and their
committees make informed decisions about applicants’ academic readiness for medical school. It describes
the concepts and skills measured by the exam. It shows the characteristics of examinees who took the MCAT
exam from 2018 to 2020 and how these examinees prepared for and performed on the exam. It also presents
guidance on how to read the MCAT score report and interpret differences in scores and shows data about
how admissions committees used MCAT scores and undergraduate grade point averages (GPAs) in the 2018,
2019, and 2020 admissions cycles.

The guide provides the most recent findings about the value of MCAT scores and undergraduate GPAs in
predicting students’ performance in medical school. New and updated validity findings include data on how
well MCAT scores and undergraduate GPAs predict students’ performance in their preclerkship and clerkship
courses, their scores and pass rates on the United States Medical Licensing Examination (USMLE) Step 1 and
Step 2 CK (Clinical Knowledge) exams (first attempt), and their graduation from medical school within four
years.

The information in this guide will support schools’ holistic review of applicants, which encompasses all the
information gathered during the admissions process. Putting MCAT scores in the context of applicants’
educational opportunities, experiences, attributes, and other academic data enables admissions officers and
their committees to select the students who will contribute to their institutions’ unique missions, goals, and
diversity interests. Using MCAT scores in the context of applicants’ full range of information is a cornerstone
of holistic review and a tenet of sound score use according to educational testing standards.1

COVID-19 and the MCAT exam
In early 2020, the AAMC partnered with the medical school admissions community to address the challenges
posed by the COVID-19 pandemic. Safe and equitable access to MCAT testing and the medical school
admissions process was and remains our highest priority during this crisis. In response to canceled test dates
from March through May 2020, we made rapid adjustments to the testing plan for the remainder of the year,
including a shortened, 5.5-hour exam administered three times daily; waived rescheduling and cancellation
fees; an expanded Fee Assistance Program; and strict social distancing and safety measures at testing sites.

Ultimately, more than 88,000 examinees took nearly 100,000 exams in 2020, compared with nearly 87,000
examinees who took more than 97,000 exams in 2019. Data from the complete 2020 testing year confirms
that this revised MCAT testing plan provided, in aggregate, the same access to examinees and applicants
from races/ethnicities underrepresented in medicine, lower-socioeconomic backgrounds, and different U.S.
geographic regions as did the 2019 testing year. Percentages of examinees in 2020 who were repeat testers
or who received accommodations or fee assistance were also similar to those from 2019. MCAT score
patterns from the 2020 testing year closely resemble those from 2019. While there was a slight increase in
overall scores this year, the magnitude is very small and, more importantly, is consistent across demographic
groups.

A detailed report on the 2020 testing year and how its data compared with 2019’s can be accessed on our
website at aamc.org/media/46511/download.

                                                                                               Association of
                                                       1
                                                                                               American Medical Colleges
Using MCAT Data in 2022 Medical Student Selection
What does the MCAT exam measure?
The MCAT exam is designed to help admissions committees select students who are academically prepared
for medical school. MCAT scores are among many sources of application data that admissions committees
use in student selection. The scores help admissions officers interpret grades and other academic data
coming from undergraduate institutions that have different curricular emphases and grading standards.
The MCAT exam tests the foundational concepts and reasoning skills
needed to be ready for medical school.
Figure 1. MCAT sections.
Psychological,
Biological and Chemical
Social, and
Biochemical and Physical Critical Analysis and
Biological
Foundations of Foundations of Reasoning Skills
Foundations
Living Systems Biological Systems
of Behavior
As shown in Figure 1, the MCAT exam has four sections:
1. Biological and Biochemical Foundations of Living Systems
2. Chemical and Physical Foundations of Biological Systems
3. Psychological, Social, and Biological Foundations of Behavior
4. Critical Analysis and Reasoning Skills
Shown in Figure 2, the two natural sciences sections and the behavioral and social sciences section of the
MCAT exam test 10 foundational concepts and four scientific inquiry and reasoning skills that are the building
blocks for learning in medical school. These sections ask test takers to combine their knowledge of concepts
from courses in first-semester biochemistry, psychology, and sociology and year-long courses in biology,
chemistry, and physics with their scientific inquiry and reasoning skills to solve problems presented in
passages and test questions. The resulting scores provide information about applicants’ readiness to
learn in medical school.
The Critical Analysis and Reasoning Skills section tests how well test takers comprehend, analyze, and evaluate
what they read, draw inferences from text, and apply arguments to new ideas and situations. The passages are
drawn from the humanities and social sciences. All the information test takers need to respond to the questions
in this section appears in the passages or in the questions themselves (refer to Figure 2). Appendix A provides
more detailed descriptions of the concepts and reasoning skills tested by each of the four sections of the exam.
Association of
2
American Medical CollegesUsing MCAT Data in 2022 Medical Student Selection
Figure 2. Foundational concepts and scientific inquiry and reasoning skills tested on the MCAT exam.
Biological and Biochemical Foundations of Living Systems
Biomolecules have unique properties that determine
how they contribute to the structure and function
Foundational Concept 1
of cells and how they participate in the processes Scientific Inquiry and Reasoning Skills
necessary to maintain life.
MCAT questions on these three sections
Highly organized assemblies of molecules, cells, and
ask test takers to solve problems using
Foundational Concept 2 organs interact to carry out the functions of living
the following scientific inquiry and
organisms.
reasoning skills.
Complex systems of tissues and organs sense the
internal and external environments of multicellular Knowledge of Scientific Concepts
Foundational Concept 3 and Principles
organisms and, through integrated functioning,
maintain a stable internal environment. • Demonstrating understanding of
scientific concepts and principles.
• Identifying the relationships between
Chemical and Physical Foundations of Biological Systems closely related concepts.
Complex living organisms transport materials, sense
Scientific Reasoning and Problem
their environment, process signals, and respond to
Foundational Concept 4 Solving
changes using processes that can be understood in
• Reasoning about scientific principles,
terms of physical principles.
theories, and models.
The principles that govern chemical interactions and • Analyzing and evaluating scientific
Foundational Concept 5 reactions form the basis for a broader understanding explanations and predictions.
of the molecular dynamics of living systems.
Reasoning About the Design
and Execution of Research
Psychological, Social, and Biological Foundations of Behavior • Demonstrating understanding of
important components of scientific
Biological, psychological, and sociocultural factors
research.
Foundational Concept 6 influence the ways that individuals perceive, think
• Reasoning about ethical issues in
about, and react to the world.
research.
Biological, psychological, and sociocultural factors
Foundational Concept 7 Data-Based and Statistical Reasoning
influence behavior and behavior change.
• Interpreting patterns in data presented
Psychological, sociocultural, and biological factors in tables, figures, and graphs.
Foundational Concept 8 influence the way we think about ourselves and • Reasoning about data and drawing
others, as well as how we interact with others. conclusions from them.
Foundational Concept 9 Cultural and social differences influence well-being.
Social stratification and access to resources influence
Foundational Concept 10
well-being.
Critical Analysis and Reasoning Skills
Examinees demonstrate their information processing skills in three areas.
Foundations of • Understanding basic components of the text, such as the main idea and conclusions.
Comprehension • Inferring meaning or intent from immediate sentence context.
• Integrating distant components of the text to infer an author’s message, intent, purpose, belief,
Reasoning Within position, bias, or assumptions.
the Text • Recognizing and evaluating arguments and their structural elements (claims, evidence, support,
relations).
• Applying or extrapolating ideas from the passage to new contexts, situations, possibilities,
Reasoning Beyond alternatives, options, or proposals.
the Text • Assessing the impact of incorporating new factors, information, or conditions on ideas from the
passage.
Association of
3
American Medical CollegesUsing MCAT Data in 2022 Medical Student Selection
How is the MCAT exam scored?
The section and total score scales are centered on memorable numbers that draw attention to the
center of the scales.
Figure 3. MCAT section score and total score scales.
Psychological,
Biological and Chemical
Social, and
Biochemical and Physical Critical Analysis and
Biological
Foundations of Foundations of Reasoning Skills
Foundations
Living Systems Biological Systems
of Behavior
118 125 132 118 125 132 118 125 132 118 125 132
Section Score Scale
472 500 528
Total Score Scale
As shown in Figure 3, scores on the four sections of the exam are reported on numeric scales centered at 125
and ranging from 118 to 132. Scores from the four sections are summed to produce a total score centered at
500 and ranging from 472 to 528.
The MCAT score scales draw attention to the center of the scales to encourage
admissions committees to consider applicants with a wide range of scores.
Research on the current version of the MCAT exam, introduced in 2015, suggests that students who enter
medical school with scores at the center of the scale (and above) succeed in medical school. Findings presented
later in this guide (pages 27-31) show that entrants with a wide range of MCAT scores passed the Step 1 and
Step 2 CK exams on the first attempt and graduated within four years. These findings are consistent with
those on the previous version of the exam, which showed that students admitted with a wide range of scores
experienced unimpeded progress toward graduation.2
Association of
4
American Medical CollegesUsing MCAT Data in 2022 Medical Student Selection
Who takes the MCAT exam?
Examinees with a wide range of backgrounds and experiences took the exam from 2018 to 2020. Figure
4 shows the percentages of the 213,322 examinees by gender, race/ethnicity, and other background
characteristics and experiences.
Students from a wide range of backgrounds sit for the MCAT exam.
More than half of examinees were female. When describing their race/ethnicity, 45% of examinees identified
as White, 11% as Black or African American, 12% as Hispanic, and 29% as Asian. About 9% were awardees
of the AAMC Fee Assistance Program. Twenty-three percent reported that none of their parents received a
bachelor’s degree, and 1% tested with nonstandard testing conditions. Finally, 38% of the examinees who
tested from 2018 to 2020 took this version of the MCAT exam more than once since it was introduced in
2015.
Figure 4. Percentages of MCAT examinees from 2018 to 2020, by gender, race/ethnicity, fee assistance
status, parental education, testing condition, and repeater status.1
2 Male 43%
Gender Female 57%
--------------------------------------------------------------------------------
White 45%
Black or African American 11%
Race/ Hispanic 12%
2,3
Ethnicity Asian 29%
American Indian or Alaska Native 1%
Native Hawaiian or Other Pacific IslanderUsing MCAT Data in 2022 Medical Student Selection
How do examinees prepare for the MCAT exam?
As described previously, the MCAT exam tests concepts from first-semester biochemistry, psychology, and
sociology courses and year-long courses in biology, chemistry, and physics. It asks examinees to demonstrate
that they can reason about research and data to answer questions about those concepts.
Data about the courses examinees completed before taking the exam show their preparation in these areas.
The coursework data in Figure 5 come from 2018-2020 examinees who responded to the AAMC’s Post-
MCAT Questionnaire (PMQ).3 Almost all of these examinees took biochemistry, biology, chemistry, and physics
courses. Most took courses in psychology and statistics before testing; many took courses in sociology and
research methods.
Examinees also studied for the MCAT exam in a variety of ways. Fifty-seven percent reported using the
Khan Academy MCAT collection, which includes free, online video lessons and test questions covering
concepts and reasoning skills tested on the MCAT exam. Thirty-nine percent took either a commercial
preparation course or a course based at a university or medical school before sitting for the exam. (The
Post-MCAT Questionnaire Summary Report is available at aamc.org/data/pmq.)
Figure 5. Percentages of MCAT examinees who completed college coursework in the natural, behavioral,
and social sciences or who prepared for the MCAT exam by using the Khan Academy MCAT collection or
completing a test preparation course.1
2
Coursework Biochemistry 92%
Introductory Psychology 86%
Introductory Sociology 53%
Research Methods 42%
Statistics 87%
Introductory Biology 94%
Introductory (Inorganic) Chemistry 92%
Organic Chemistry 97%
Introductory Physics 94%
- - - - - - - - - - - - - - - -3- - - - - - - - - - - - - - - - - - - - - - - - - - - - - - - - - - - - - - - - - - - - - - - - - - - - - - - - - - - - - - - -
MCAT Preparation
Khan Academy 57%
Commercial or University/Medical 39%
School-Based Prep Courses
0 10% 20% 30% 40% 50% 60% 70% 80% 90% 100%
Notes
1. The total number of MCAT examinees from 2018 to 2020 was 213,322.
2. These coursework data are from the AAMC’s Post MCAT Questionnaire (PMQ). Each year, between 35% to 40% of examinees
complete the PMQ. These respondents are similar to the larger examinee population on most background characteristics but obtain
slightly higher MCAT scores on average. For respondents who take the MCAT exam more than once, results are based on the PMQ
completed after the examinee’s most recent scored exam. The percentages were calculated based on the total number of 2018-to-
2020 PMQ respondents who self-reported information about courses for which they had Advanced Placement (AP), International
Baccalaureate (IB), College Level Examination Program (CLEP), community college, four-year college, postbaccalaureate, graduate,
and professional school credit (N=59,866).
3. Percentages were calculated from examinee responses to questions about their MCAT preparation asked at the end of the testing
day. Each year, more than 95% of examinees complete this brief survey at the end of the testing day. In 2020, the end-of-day survey
was eliminated from the shortened exam in response to the COVID-19 pandemic. The number of examinees from 2018 to 2019
who provided this information was 143,212. For those who tested more than once, results are based on examinees’ most recent
responses.
Association of
6
American Medical CollegesUsing MCAT Data in 2022 Medical Student Selection
How well do examinees score on the MCAT exam?
Figure 6 summarizes the MCAT total and section scores from all exams administered in 2018, 2019, and 2020.
For the examinees who tested more than once from 2018 to 2020, all their scores are included. The mean
MCAT total score was 501.5, and the standard deviation was 10.7. Means and standard deviations for the
section scores also appear in Figure 6.
Figure 6. Summary of MCAT total and section scores for exams administered from 2018 to 2020.
4.5
2018 to 2020 (Mean = 501.5, SD = 10.7)
4.0
3.5
3.0
Percentage
2.5
2.0
1.5
1.0
0.5
0.0
472 476 480 484 488 492 496 500 504 508 512 516 520 524 528
Total Score
Note: The total number of exams administered from 2018 to 2020 was 281,468. These results include multiple scores for the
examinees who took the MCAT more than once from 2018 to 2020.
Figure 7 gives additional details about students’ total scores in 2018, 2019, and 2020. It summarizes the
MCAT scores both overall and for examinees from different backgrounds and experiences, including gender
and race/ethnicity, status in the AAMC Fee Assistance Program, and highest level of parental education.
It also shows scores from examinees who tested under standard and nonstandard testing conditions and
first- and second-attempt scores for examinees who took the exam more than once.
Figure 7 uses box-and-whisker plots to show the median score (the 50th-percentile score), along with the
10th-, 25th-, 75th-, and 90th-percentile scores. The 10th- and 90th-percentile scores are shown by the ends
of the “whiskers,” the 25th- and 75th-percentile scores are shown by the box (the left edge of each box
shows the 25th-percentile score, and the right edge shows the 75th-percentile score), and the median is
Association of
7
American Medical CollegesUsing MCAT Data in 2022 Medical Student Selection
shown by the vertical bar inside each box. For example, for female examinees, the 10th-, 25th-, median-,
75th-, and 90th-percentile scores were 486, 493, 501, 508, 514, respectively. The mean MCAT total score for
each group appears in parentheses by the group label.
For every group, there are examinees with scores near the bottom,
at the middle, and near the top of the MCAT total score scale.
There is variability in the median MCAT total scores for examinees from different backgrounds. However, there is
a great deal of overlap in the scores of different groups. The similarities and differences in these data are similar
to those reported in the literature for other admissions tests.4,5 Research suggests the differences in MCAT
scores for examinees from groups underrepresented in medicine based on race/ethnicity and other background
characteristics reflect societal inequalities in income, education, and other factors rather than test bias.6
Figure 7. MCAT total scores for exams administered from 2018 to 2020, overall and by gender, race/
ethnicity, fee assistance status, parental education, testing condition, and repeater status.1,2
Overall Total (mean = 501.5; N = 281,468)
------------------------------------------------------------------------------------------------
Male (mean = 503.1; N = 117,703)
Gender
Female (mean = 500.3; N = 162,964)
------------------------------------------------------------------------------------------------
White (mean = 503.0; N = 118,861)
Black or African American (mean = 494.9 N = 30,994)
Race/ Hispanic (mean = 496.9; N = 33,150)
3
Ethnicity Asian (mean = 503.5; N = 80,664)
American Indian or Alaska Native (mean = 497.9; N = 3,274)
Native Hawaiian or Other Pacific Islander (mean = 498.8; N = 1,007)
------------------------------------------------------------------------------------------------
Fee Did not receive (mean = 501.7; N = 220,480)
4
Assistance Received (mean = 498.3; N = 21,764)
------------------------------------------------------------------------------------------------
Parental 5 Bachelor's degree or higher (mean = 502.9; N = 207,657)
Education No bachelor's degree (mean = 497.5; N = 65,488)
------------------------------------------------------------------------------------------------
Testing 6 Standard (mean = 501.5; N = 277,795)
Condition Nonstandard (mean = 503.2; N = 3,673)
------------------------------------------------------------------------------------------------
Single attempt only (mean = 504.0; N = 131,800)
Repeater
7 Repeater, 1st attempt (mean = 497.2; N = 48,308)
Status
Repeater, 2nd attempt (mean = 500.8; N = 48,308)
472 480 488 496 504 512 520 528
Total Score
Notes
1. The total number of exams administered from 2018 to 2020 was 281,468.
2. These results include multiple scores from the examinees who tested more than once from 2018 to 2020.
3. Data for examinees who reported their race/ethnicity as “other” are not shown.
4. The AAMC Fee Assistance Program eligibility is limited to examinees who are U.S. citizens or U.S. permanent residents or students
with Deferred Action for Childhood Arrivals (DACA) status.
5. Examinees report the highest level of education for up to four parents. These results are for the highest level of parental education for
examinees who took the MCAT exam from 2018 to 2020.
6. Score reports do not indicate whether scores were obtained under standard or nonstandard testing conditions.
7. For repeater status, “Single attempt only” includes the scores from the examinees who took the current MCAT exam for the first time
in 2018, 2019, or 2020 and did not test again. “Repeater” data include scores from the examinees who took the MCAT exam for the
first time in 2018, 2019, or 2020 and then tested at least one more time during this window. They are a subset of those who tested
more than once since this version of the MCAT exam was introduced. The “1st attempt” plot shows these repeaters’ scores from
their very first attempt, and the “2nd attempt” plot shows these same examinees’ scores from their second attempt.
Association of
8
American Medical CollegesUsing MCAT Data in 2022 Medical Student Selection
How precise are examinees’ MCAT scores,
and how should they be interpreted?
Four types of information are essential for interpreting MCAT scores:
• Total and section scores.
• Confidence bands.
• Percentile ranks associated with the scores.
• Score profile.
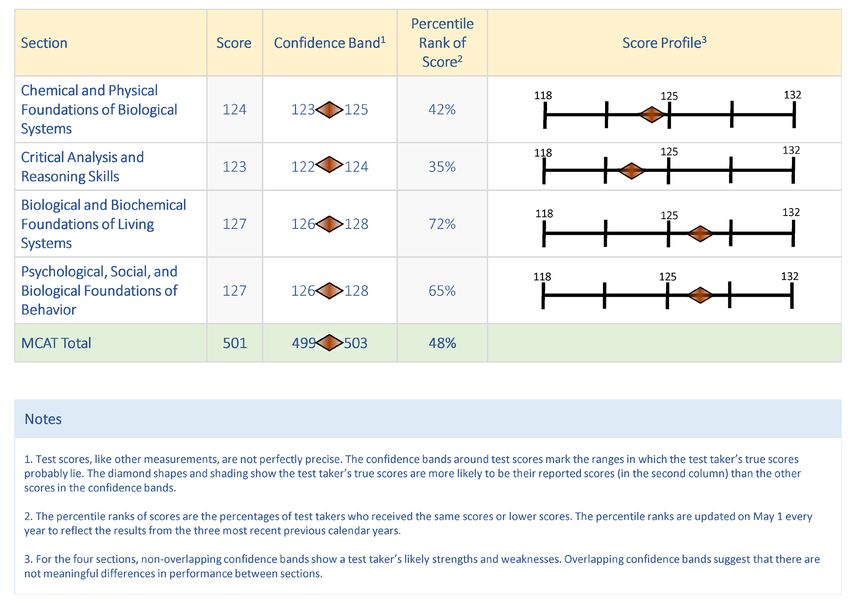
Figure 8 shows an example of an examinee’s score report that includes these four components. Details about
the confidence bands, percentile ranks, and the score profile are included below. Other resources—including
an interactive version of the score report; videos describing the concepts and reasoning skills tested by the new
exam; and downloadable fact sheets describing the scores, confidence bands, percentile ranks, and score
profile—can be found at aamc.org/mcatscorereport.
Figure 8. Example score report.
Association of
9
American Medical CollegesUsing MCAT Data in 2022 Medical Student Selection
Confidence bands
Like other measurements, MCAT scores are imperfect measures of examinees’ true levels of preparation. They
are not perfectly precise. Examinees’ scores can be dampened by factors such as fatigue, test anxiety, and
less-than-optimal test room conditions, or they can be boosted by recent exposure to some of the tested topics.
Confidence bands remind admissions committee members
not to overemphasize small differences in scores.
Confidence bands describe the precision of MCAT total and section scores. They show the ranges in which an
examinee’s true scores probably lie. Reviewing applicants’ scores with the confidence bands in mind prevents
overinterpretation of small differences in test scores.
Score reports show confidence bands both numerically and graphically. MCAT total scores are reported with
a confidence band of plus or minus two points, and MCAT section scores are reported with confidence bands
of plus or minus one point. Adding and subtracting two points to an MCAT total score of 500, for example,
defines a confidence band that begins at 498 and goes to 502.
Figures 9 and 10 illustrate how confidence bands can be used to interpret MCAT total scores. The reported
score for each examinee is shown as a square. The confidence band around each examinee’s score is shown
by the dashed lines in the figure.
Figure 9 shows that examinee A scored 500, and examinee B scored 502. The confidence bands around these
scores overlap. The overlap between the two confidence bands suggests that the two reported scores may
not be meaningfully different from each other.
Figure 10 shows that examinee A scored 500, and examinee C scored 506. The confidence bands around
their scores do not overlap, suggesting the two scores are more likely to be meaningfully different from each
other (compared with the scores for examinees A and B).
Figure 9. Confidence bands for two examinees Figure 10. Confidence bands for two examinees
with similar reported scores. with dissimilar reported scores.
Examinee A Examinee A
❚ ❚ ❚ ❚
❚ ❚ ❚ ❚
❚ ❚ ❚ ❚
❚ ❚ ❚ ❚
❚ ❚ ❚ ❚
❚ ❚ ❚ ❚
❚ ❚ ❚ ❚
Examinee B ❚ Examinee C ❚ ❚
❚ ❚ ❚ ❚
❚ ❚ ❚ ❚
❚ ❚ ❚ ❚
❚ ❚ ❚ ❚
❚ ❚ ❚ ❚
❚ ❚ ❚ ❚
488 490 492 494 496 498 500
❚ 502 504
❚ 506 508 510 512 488 490 492 494 496 498 500 502 504
❚ 506 508
❚ 510 512
❚ ❚ ❚ ❚
❚ ❚ ❚ ❚
❚ ❚
Association of
10
American Medical CollegesUsing MCAT Data in 2022 Medical Student Selection
Percentile ranks
The percentile ranks for the total and section scores show how the scores of individual applicants compare
with the scores of others who took the exam. The percentile ranks show the percentages of test takers who
received the same or lower scores on the exam.
Percentile ranks show how an applicant’s scores compare
with other examinees’ scores.
For example, the MCAT total score in Figure 8 on page 9 is 501. It has a percentile rank of 48%. This
means that 48% of MCAT scores were equal to or less than 501.
Every year on May 1, the percentile ranks for MCAT scores are updated using data from the previous three
administration years. This is a common practice in the standardized test industry and ensures that percentile
ranks reflect current information about examinees’ scores. Because examinees change from one year to the
next, the percentile ranks associated with scale scores may change over time. Basing the percentiles on data
from three administration years instead of one year makes the results more stable, but it doesn’t prevent
year-to-year changes.
That is why MCAT scores have more meaning than percentile ranks. The methods that MCAT developers use
to write test questions and build and equate test forms keep the meaning of scores constant over test forms
and time. The exam is not graded on a curve. No matter when applicants tested, whom they tested with,
or what test forms they took, their scores have common interpretations. MCAT scores describe applicants’
academic readiness in relation to the body of knowledge and skills that medical school faculty have described
as prerequisite for entering medical students.
The current percentile ranks are based on data from 2018, 2019, and 2020. Appendix B shows the MCAT total
and section score percentile ranks in effect from May 1, 2021, to April 30, 2022.
Score profile
The MCAT score profile highlights applicants’ strengths and weaknesses across the four sections of the exam
through reported scores for each section.
Score profiles highlight applicants’ strengths and weaknesses across
the four sections of the MCAT exam.
Figure 8 illustrates the score profile associated with an applicant’s MCAT section scores. Applicants’ strengths
and weaknesses on the exam can be considered along with other information about their academic
preparation (e.g., coursework and grades) and in relation to institutional missions and goals.
Association of
11
American Medical CollegesUsing MCAT Data in 2022 Medical Student Selection
How do examinees’ scores change when they retake the
MCAT exam, and how do admissions officers use scores
for applicants who test more than once?
MCAT examinees can test up to three times in one calendar year and four times across two calendar years.
An examinee cannot take the exam more than seven times in their lifetime. As shown in Figure 4 on page 5,
about 38% of individuals who took the MCAT exam in 2018, 2019, and 2020 were retesters.
To show the types of score gains obtained upon retesting, analyses were conducted to compare scores from
examinees’ first attempt with their second attempt. These analyses include scores from examinees who
tested for the first time in 2018, 2019, or 2020 and then retook the exam in that window. Figure 11 uses
box-and-whisker plots (described earlier for Figure 7) to show the distributions of score gains (and losses) on
examinees’ second attempts at the exam, relative to their first-attempt scores.
The data show that retesters across a wide range of scores tend to obtain higher scores on their second
exams. Figure 11 shows that the median gain was generally three to four score points for examinees
who tested a second time and whose first-attempt scores were between 472 and 517. For examinees
whose initial scores were between 518 and 528, the median gain was zero points. It is important to note,
however, that there was considerable variation in the magnitude and direction of score changes, with some
examinees posting increases or decreases greater than four points.
Figure 11. Changes in MCAT total scores between the first and second attempts of MCAT examinees
from 2018 to 2020 who retested.
518-528 (N = 59)
514-517 (N = 529)
510-513 (N = 2,182)
506-509 (N = 5,268)
Initial Total Score Range
502-505 (N = 7,891)
498-501 (N = 8,756)
494-497 (N = 8,152)
490-493 (N = 6,564)
486-489 (N = 4,469)
482-485 (N = 2,710)
478-481 (N = 1,287)
Note: These box-and-whisker plots show changes
472-477 (N = 441) in MCAT total scores from the first attempt to the
second attempt for examinees (N = 48,308) who
took this version of the MCAT exam for the first
-12 -10 -8 -6 -4 -2 0 2 4 6 8 10 12 time in 2018, 2019, or 2020 and then tested
Score Change a second time in this same window.
Association of
12
American Medical CollegesUsing MCAT Data in 2022 Medical Student Selection
A 2017 AAMC survey asked admissions officers how they work with retesters’ MCAT total scores in the
admissions process.7 The results showed that admissions officers use different strategies for examining
retesters’ scores. For example, some admissions committees use all exam scores in conjunction with other
information about academic preparation that may explain any score changes. Other admissions committees
use applicants’ most recent exam scores in the admissions process or use the applicants’ “best score” as
represented by their highest reported total score. Other committees compute the average total score across
the multiple attempts.
Applicants’ transcripts, experiences, and other information in their applications
provide important context for interpreting retesters’ scores.
It is important for admissions officers to examine the information in applicants’ transcripts and applications
in interpreting retesters’ scores. Data not shown in Figure 11 suggest that average score gains on the second
attempt are greater when the time between the first and second attempts is greater. Information in applicants’
files, such as completion of a postbaccalaureate program, graduate degree program, or other coursework, can
help explain gains in applicants’ scores over time.
Association of
13
American Medical CollegesUsing MCAT Data in 2022 Medical Student Selection
How do admissions officers use MCAT scores
and other application data in the holistic review
of applicants’ qualifications?
As already mentioned, MCAT scores are among many sources of application data that admissions committees
use to select medical students. The scores help admissions officers interpret grades and other academic data
that come from undergraduate institutions with different curricular emphases and grading standards. In addition
to applicants’ academic data, admissions officers examine applicants’ experiences and demographic and
personal attributes. Applicants provide a great deal of data about their academic and life experiences,
demographics, and personal characteristics through their applications, personal statements, and interviews.
Letter writers also provide rich information about applicants’ academic, experiential, and personal attributes.
The procedures that admissions officers from different medical schools use to review these data on applicants’
qualifications differ in ways that reflect the schools’ unique missions, goals, and curricula, as well as the sizes
and characteristics of their applicant pools. To learn more about the holistic review of applicants’ qualifications,
the AAMC periodically surveys admissions officers about the importance of different academic, experiential,
demographic, and personal attribute data in making admissions decisions.7-11
Reviewing information about the experiences and attributes of applicants
helps admissions committees put academic metrics in better balance.
Table 1 summarizes the results of a 2015 AAMC survey of admissions officers.11 The table highlights the
importance of different types of data in admissions decision-making. The results of this and previous AAMC
surveys about the use and importance of data for making admissions decisions show that experiences, academic
metrics, demographics, and personal attributes all weigh heavily in decisions to offer interview invitations and
acceptances.9,12
In 2017, admissions officers were surveyed about the relative weight they give to undergraduate GPAs and
MCAT scores compared with other information in applicants’ files to learn how they place these metrics in
context at different stages of the admissions process.7
The survey data show that the importance of undergraduate GPAs and MCAT scores, relative to other criteria,
decreases as more information about applicants is gathered. Admissions officers are better able to balance
data about academic metrics when they are placed in the context of applicants’ experiences and attributes.
For example, 80% of admissions officers rated other criteria just as or more important in making acceptance
offers, compared with 60% who rated other criteria just as or more important in inviting applicants to
interview. Placing applicants’ MCAT scores in the context of their educational opportunities, lived experiences,
academic trajectories, and personal attributes during the admissions process enables medical schools to
meet their missions and goals and not overlook students who would make valuable contributions to their
programs.
Association of
14
American Medical CollegesUsing MCAT Data in 2022 Medical Student Selection
Table 1. Mean Importance Ratings of Academic, Experiential, Demographic, and Interview Data Used
by Admissions Committees to Make Decisions About Which Applicants Receive Interview Invitations
and Acceptance Offers1
Mean Academic Metrics Experiences Demographics Other Data
Importance
Ratings2
Highest • GPA: cumulative • Community • U.S. citizenship/ • Interview
Importance biology, chemistry, service/volunteer: permanent residency results4
Ratings physics, and math medical/clinical (public)3
(≥ 3.0) • MCAT total score • Community • State residency (public)3
• GPA: grade trend service/volunteer: • Rural/urban, underserved
• GPA: cumulative total not medical/clinical background
• GPA: cumulative total • Physician shadowing/
from postbaccalaureate clinical observation
premedical program • Leadership
• MCAT total score trend
• Completion of
premedical course
requirements
Medium • Completion of • Paid employment: • Race/ethnicity
Importance challenging upper-level medical/clinical • U.S. citizenship/
Ratings science courses • Research/lab permanent residency
(≥ 2.5 and • GPA: cumulative “all • Other extracurricular (private)3
< 3.0) other” (not biology, activities • Parental education/
chemistry, physics, and • Military service occupation/
math) socioeconomic
status (SES)
Lowest • Degree from graduate or • Teaching/tutoring/ • First-generation
Importance professional program teaching assistant immigrant status
Ratings • Completion of • Paid employment: not • Fluency in multiple
(< 2.5) challenging medical/clinical languages
nonscience courses • Intercollegiate athletics • Gender
• Selectivity of • Honors, awards, • English language
undergraduate recognitions learners
institution(s) • Conferences attended, • State residency (private)3
• Undergraduate major presentations, posters, • Legacy status
publications • Community college
attendance
• Age
Notes
1. Admissions officers at 130 medical schools completed a 2015 AAMC survey on the use and importance of data in admissions decision-making. The
survey asked, “How important were the following data about academic preparation, experiences, attributes/personal competencies, biographic/
demographic characteristics, and interview results in identifying the applicants to [interview, offer an acceptance]?”
2. Importance was rated on a scale ranging from 1 to 4 (“Not Important,” “Somewhat Important,” “Important,” and “Very Important,” respectively). For
each variable, we computed an overall mean importance rating based on admissions officers’ ratings of importance for making decisions about whom
to interview and whom to accept (the mean importance rating for the interview variable is the exception to this rule because interview data were not
available until applicants were invited to interview). We chose to classify variables using overall mean importance ratings because their mean importance
ratings were similar for the interview and the acceptance phases. Variables are ordered by overall mean importance rating.
3. Overall mean importance ratings for public and private institutions were significantly different from one another.
4. Only available at the admissions stage where admissions committees make a decision to offer an acceptance.
Association of
15
American Medical CollegesUsing MCAT Data in 2022 Medical Student Selection
National-level data on the academic credentials of applicants whom admissions committees accept
reinforce the messages the survey data provide. Table 2 shows the percentages of applicants with different
undergraduate GPAs and MCAT total scores who were accepted into one or more medical schools in 2018,
2019, or 2020. These data show that although undergraduate GPAs and MCAT scores are important factors
in admissions, they are not the sole determinants of admissions decisions.
Some applicants with high undergraduate GPAs and MCAT scores do not receive
any acceptances, while other applicants with modest credentials are accepted
by at least one medical school.
Each year, some applicants with high MCAT scores and undergraduate GPAs are rejected by all the medical
schools to which they applied. In contrast, other applicants with more modest MCAT scores and undergraduate
GPAs are accepted by at least one medical school. In 2018, 2019, and 2020 student selection, 13% of
applicants with GPAs of 3.8 or above and MCAT total scores of 518 or above were rejected by all the medical
schools to which they applied. In contrast, about 14% of applicants with GPAs of 3.00 to 3.19 and MCAT total
scores ranging from 498 to 501 were accepted by at least one medical school.
Table 2. Percentage and Number of 2018, 2019, and 2020 Applicants Accepted Into at Least One Medical
School, by MCAT Total Score and Undergraduate GPA Ranges
Notes
1. Dark-green shading = acceptance rates ≥75%; light-green shading = acceptance rates of 50%-74%; gray shading = acceptance rates
of 25%-49%.
2. Dashes = cells with fewer than 10 observations; blank cells = cells with zero observations.
3. For students who took the MCAT exam multiple times, the most recent MCAT total score was used in this analysis.
4. Table summarizes data for 2018, 2019, and 2020 applicants who reported MCAT scores from the current exam and undergraduate
GPAs (N = 155,161).
Association of
16
American Medical CollegesUsing MCAT Data in 2022 Medical Student Selection
How well do undergraduate GPAs and MCAT scores
predict students’ performance in medical school?
This section describes how well undergraduate GPAs and MCAT scores predict medical student performance
in preclerkship courses, on the Step 1 exam, in clerkships, on the Step 2 CK (Clinical Knowledge) exam, and
their graduation from medical school within four years. Subsequent editions of this guide will present findings
related to graduation from medical school in five years for these and future cohorts.
The pages that follow describe the relationships among undergraduate GPAs, MCAT scores, and a variety of
medical student performance outcomes from entry through graduation. Some outcomes, such as preclerkship
and clerkship grades or test scores, reveal how well academic metrics like MCAT scores and undergraduate
GPAs predict the full range of medical student performance. Other outcomes, such as passing the Step 1 and
Step 2 CK exams or graduating within four years, home in on how well MCAT scores and undergraduate
GPAs predict student success on important milestones but do not distinguish between those that are close to
and those that are well above or below the pass/fail standards. Examining the associations of undergraduate
GPAs and MCAT scores with these varied outcomes provides different vantage points about the likelihood of
success for applicants with different ranges of undergraduate GPAs and MCAT scores.
Examining how undergraduate GPAs and MCAT scores relate to
medical students’ performance on varied outcomes provides a more
complete picture of applicants’ likely success in medical school.
Table 3 summarizes the medical student performance outcomes included in this guide. The left column lists
each outcome. The middle column describes what each outcome is and how it is measured or calculated.
The right column describes the sample of medical students used to examine each outcome, which varies
due to data availability.
Association of
17
American Medical CollegesUsing MCAT Data in 2022 Medical Student Selection
Table 3. Summary of Medical Students’ Performance Outcomes
Performance Outcome Description Sample
Preclerkship performance Preclerkship performance is based on each student’s 2,756 students from 17 validity
mean performance across preclerkship courses.1 schools2 who entered in 2016 or
2017
Step 1 score (first attempt) The Step 1 score comes from each student’s first 22,814 students who entered in
attempt at the USMLE Step 1 exam. 2016 or 2017 and took the Step 1
exam by the end of 2020
Passing Step 1 on the first The Step 1 pass/fail outcome comes from each 25,695 students who entered in
attempt students’ first attempt at the USMLE Step 1 exam. 2016 or 2017 and took the Step 1
exam by the end of 2020
Clerkship exam score The clerkship exam score is based on the mean score 2,324 students from 16 validity
across the exams administered in clerkship rotations.3 schools who entered in 2016 or
20174
Clerkship GPA The clerkship GPA is based on the mean performance 2,097 students at 14 validity schools
across core clerkship courses using each validity who entered in 2016 or 20176
school’s rating or grading scale.5
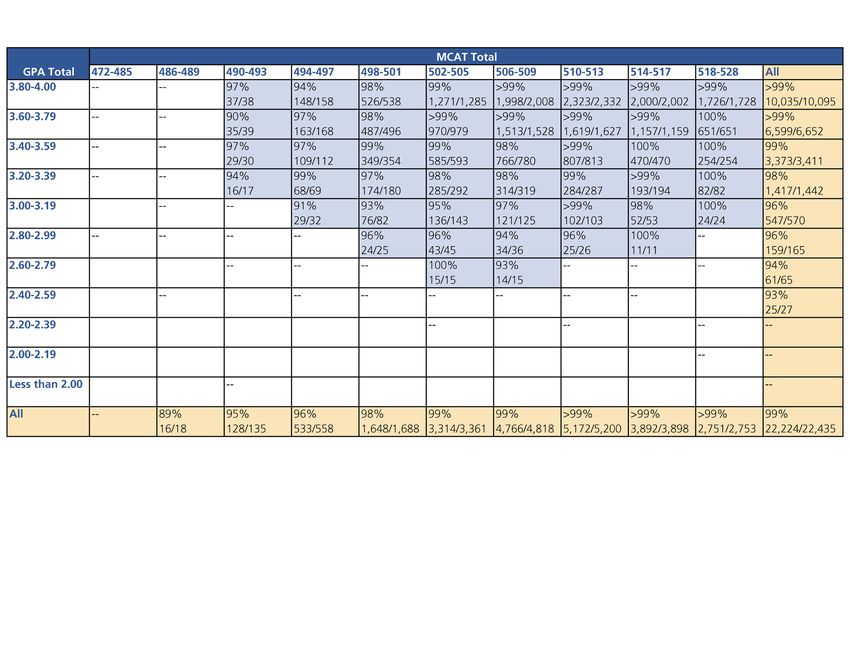
Step 2 CK score (first attempt) The Step 2 CK score comes from each student’s first 20,794 students who entered in
attempt at the USMLE Step 2 CK exam. 2016 or 2017 and took the Step
2 CK exam by the end of 2020
Passing Step 2 CK on the first The Step 2 CK pass/fail outcome comes from each 22,435 students who entered in
attempt student’s first attempt at the USMLE Step 2 CK exam. 2016 or 2017 and took the Step
2 CK exam by the end of 2020
Graduating in four years Graduation is defined as graduation within the 7,502 students who entered in 2016
expected calendar year. and are enrolled in regular MD
programs
Notes
1. Each school identified the preclerkship courses that have reliable performance measures (e.g., written exams, practical exams, case
studies, and other evaluations). Examples of preclerkship courses are: Biochemistry, Cell and Molecular Biology, Cardiovascular
and Pulmonary Systems, Behavioral Medicine and Health, Health Care Ethics, Introduction to Clinical Anatomy, and Community
Engagement. Although the selected courses vary widely in the extent to which they relate to the knowledge and skills the MCAT
exam tests, most teach natural sciences subjects. Because the courses selected by each validity school made up the majority of
preclerkship courses at the school, the measure of performance used here, which ranges from 0 to 100, correlated highly with the
preclerkship GPAs calculated by the medical schools or with class ranks at each school.
2. Students enrolled at 17 medical schools in the United States and Canada, referred to here as “validity schools,” volunteered for
validity research about locally defined medical student performance outcomes tied to their school’s curriculum, academic support,
and learning environment. These students’ performance data were analyzed for relevant outcomes.
3. The vast majority of the clerkship exam scores are from National Board of Medical Examiners (NBME) Clinical Science Subject Exams.
4. Sixteen out of 17 validity schools provided available data for this outcome.
5. Each clerkship “grade” reflects a student’s overall evaluation based on a combination of clinical performance evaluations, exam
scores, and other evaluations required by each clerkship at each school.
6. Fourteen out of 17 validity schools provided available data for this outcome.
Association of
18
American Medical CollegesUsing MCAT Data in 2022 Medical Student Selection
In the remainder of this section, we use figures and text to integrate and present findings related to the range
of medical student performance outcomes and samples described in Table 3. Some results are summarized at
the aggregate school level, and others show what the data look like for individual students. Together, these
findings tell the following story:
• MCAT scores strongly predict medical student performance in preclerkship and clerkship courses, as well
as on USMLE licensure exams (Step 1 and Step 2 CK).
• Some students perform better in medical school than their MCAT scores predict, and others perform less
well.
• MCAT scores predict students’ performance better than undergraduate GPAs. Together, they provide
better prediction than either academic metric alone.
• Using MCAT scores and undergraduate GPAs together provides a better signal about students’ likely
success in medical school, including passing Step 1 and Step 2 CK exams and graduating within four
years.
Relationships of MCAT scores with students’ preclerkship, Step 1, clerkship, and Step 2 CK
performance
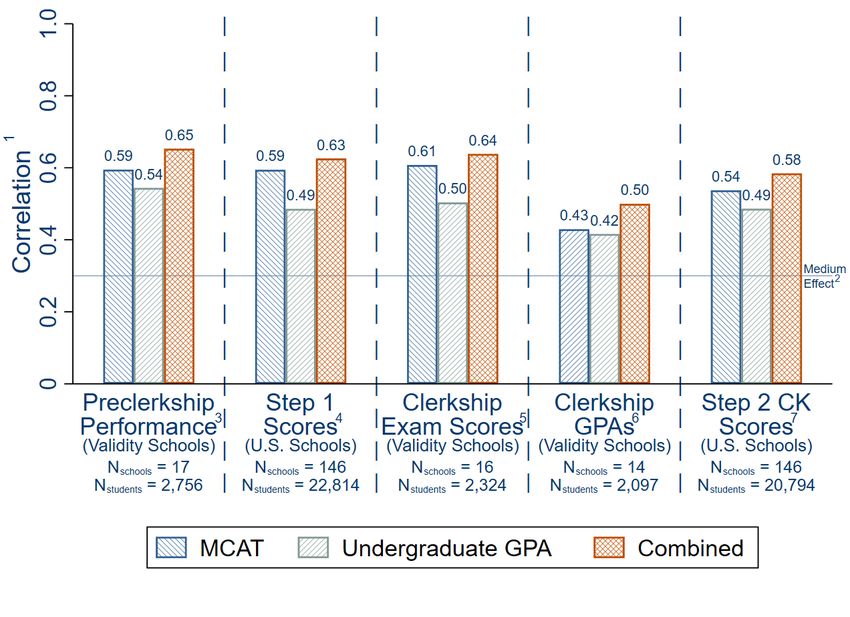
Figure 12 shows how well MCAT total scores predict students’ preclerkship performance, Step 1 scores
from the first attempt, clerkship exam scores, clerkship GPAs, and Step 2 CK scores from the first attempt.
Correlational analyses were done individually at each school with students who entered medical school
in 2016 or 2017, both combined and separately, on each of the five performance outcomes. Then, the
correlations for each outcome were grouped together to identify the midpoint of these correlations across
all schools for the two entering classes combined, as well as the midpoints for the 2016 and 2017 entering
classes separately. Conducting these correlational analyses by school and entering class allows us to see how
the correlations of MCAT scores and student performance outcomes vary across schools, each of which has
its own approach to teaching, evaluating, and supporting students, which also may change over time.
The preclerkship and clerkship findings in Figure 12 are based on local outcomes from validity schools, and
the Step 1 and Step 2 CK findings are based on national data from U.S. medical schools. Figure 12 shows the
median correlation of MCAT scores with each outcome across schools for the combined cohorts. For each
outcome, it also shows the median outcome for 2016 entrants and the median outcome for 2017 entrants.
In each panel of Figure 12, the large circle shows the median correlation coefficient (the correlation at the
50th percentile) across all schools, the square shows the median correlation coefficient for 2016 entrants, and
the diamond shows the median correlation for 2017. The two ends of the gray bar show the correlations at
the 25th and 75th percentiles (the interquartile range) for the two entering classes combined.
The x-axis in Figure 12 shows the medical student performance outcome in each panel. The y-axis shows
the strength of the relationship between MCAT scores and each performance outcome, which helps with
the comparison of correlation sizes across the preclerkship, Step 1, clerkship, and Step 2 CK outcomes. The
horizontal line at a correlation of 0.3 provides a reference point by showing the threshold for a medium effect
size in the social sciences.13
The “Preclerkship Performance” panel in Figure 12 shows the median and interquartile range of correlations
of MCAT total scores with preclerkship performance at the 17 validity schools, as well as the median
correlations for the 2016 and 2017 entering classes. The median correlation of MCAT total scores with
students’ preclerkship performance is 0.59 for the two entering classes combined, which is the same as the
median correlation for each entering class. The “Step 1 Scores” panel in Figure 12 shows the correlations of
Association of
19
American Medical CollegesYou can also read