Potential Energy Impacts of the EPA Proposed Clean Power Plan
←
→
Page content transcription
If your browser does not render page correctly, please read the page content below
Potential Energy Impacts of the EPA Proposed
Clean Power Plan

Prepared for:
American Coalition for Clean Coal Electricity
American Fuel & Petrochemical Manufacturers
Association of American Railroads
American Farm Bureau Federation
Electric Reliability Coordinating Council
Consumer Energy Alliance
National Mining Association

October 2014
Project Directors
David Harrison, Jr., Ph.D.
Anne E. Smith, Ph.D.

Project Team
Paul Bernstein, Ph.D.
Scott Bloomberg
Andrew Foss
Andrew Stuntz
Sugandha Tuladhar, Ph.D.

NERA Economic Consulting
200 Clarendon St, 11th Floor
Boston, Massachusetts 02116
Tel: +1 617 927 4500
Fax: +1 617 927 4501
www.nera.com

NERA Economic Consulting
Report Qualifications/Assumptions and Limiting Conditions
Information furnished by others, upon which all or portions of this report are based, is believed
to be reliable, but has not been independently verified, unless otherwise expressly indicated.
Public information and industry and statistical data are from sources we deem to be reliable;
however, we make no representation as to the accuracy or completeness of such information.
The findings contained in this report may contain predictions based on current data and historical
trends. Any such predictions are subject to inherent risks and uncertainties. NERA Economic
Consulting accepts no responsibility for actual results or future events.

The opinions expressed in this report are valid only for the purpose stated herein and as of the
date of this report. No obligation is assumed to revise this report to reflect changes, events or
conditions, which occur subsequent to the date hereof. The opinions expressed in this report are
those of the authors and do not necessarily represent the views of NERA Economic Consulting,
other NERA consultants, or NERA’s clients.

All decisions in connection with the implementation or use of advice or recommendations
contained in this report are the sole responsibility of the client. This report does not represent
investment advice nor does it provide an opinion regarding the fairness of any transaction to any
and all parties.

NERA Economic Consulting
Contents
EXECUTIVE SUMMARY ....................................................................................................... S-1

I.        INTRODUCTION..............................................................................................................1
       A. Background on EPA Proposal .............................................................................................1
       B. Objectives of This Evaluation ..............................................................................................2
       C. Organization of This Report ................................................................................................2

II.       EPA CLEAN POWER PLAN PROPOSAL ....................................................................4
       A. Building Blocks Used to Calculate State Targets ................................................................4
       B. CO2 Emission Rate Formula ................................................................................................6
       C. State CO2 Emission Rate Targets ........................................................................................8

III.      MODELING METHODOLOGY AND STATE COMPLIANCE SCENARIOS ......11
       A. NewERA Model ..................................................................................................................11
       B. Modeling and Input Assumptions ......................................................................................11
       C. Compliance Scenarios ........................................................................................................13

IV.       RESULTS FOR STATE COMPLIANCE SCENARIOS .............................................15
       A. Impacts on U.S. Energy System ........................................................................................15
       B. Impacts on Regional Energy Systems................................................................................21
       C. Impacts on Electricity Prices .............................................................................................23

V.          REFERENCES .................................................................................................................28

APPENDIX A: THE NEWERA MODEL ............................................................................... A-1

APPENDIX B: REGIONAL SCENARIO ...............................................................................B-1

APPENDIX C: COMPLICATIONS IN MODELING ENERGY EFFICIENCY .............. C-1

NERA Economic Consulting                                                                                                                 i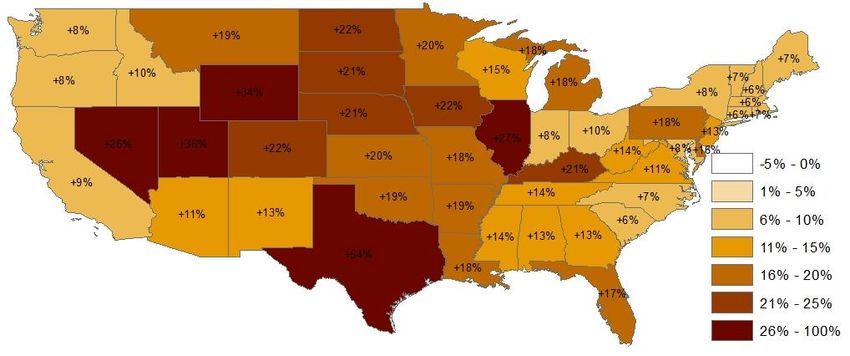
Index of Figures
Figure ES-1: Overview of Energy System Impacts of State Unconstrained (BB1-4) and State
       Constrained (BB1-2) Scenarios (Annual Average, 2017-2031) ...................................... S-6
Figure ES-2: Energy System Costs of State Unconstrained (BB1-4) and State Constrained (BB1-
       2) Scenarios ...................................................................................................................... S-7
Figure 1: Calculation of U.S. 2030 CO2 Emission Rate Target from 2012 Rate and Building
       Blocks ................................................................................................................................. 8
Figure 2: 2030 CO2 Emission Rate Targets for EPA Option 1 (lbs/MWh) ................................... 9
Figure 3: CO2 Emission Rate Reduction for 2030 Target Relative to 2012 Rate........................ 10
Figure 4: Overview of Energy System Impacts of State Compliance Scenarios (Annual Average,
       2017-2031) ........................................................................................................................ 15
Figure 5: CO2 Emission Impacts of State Compliance Scenarios (Million Metric Tons) ........... 16
Figure 6: Coal Unit Retirement Impacts of State Compliance Scenarios .................................... 17
Figure 7: Capacity Impacts of State Compliance Scenarios (GW).............................................. 18
Figure 8: Generation Impacts of State Compliance Scenarios (TWh) ........................................ 19
Figure 9: Coal and Natural Gas Consumption Impacts of State Compliance Scenarios ............. 20
Figure 10: Natural Gas Wholesale Price (Henry Hub) Impacts of State Compliance Scenarios 20
Figure 11: Energy System Cost Impacts of State Compliance Scenarios (billion 2013 dollars) 21
Figure 12: Coal Unit Retirement Impacts by Region Through 2031 ........................................... 22
Figure 13: Natural Gas Combined Cycle Generation Impacts by Region of State Scenarios
       (Annual Average, 2017-2031, TWh) ................................................................................ 23
Figure 14: Natural Gas Combined Cycle Fuel Consumption Impacts by Region of State
       Scenarios (Annual Average, 2017-2031, TBtu) ............................................................... 23
Figure 15: All Sectors Delivered Electricity Price Impacts of State Scenarios ........................... 24
Figure 16: Ratepayer Class Delivered Electricity Price Impacts of State Scenarios (Annual
       Average, 2017-2031, 2013 cents per kWh) ...................................................................... 25
Figure 17: State All Sectors Delivered Electricity Price Impacts of State Unconstrained (BB1-4)
       Scenario (Annual Average, 2017-2031) ........................................................................... 25
Figure 18: State All Sectors Delivered Electricity Price Impacts of State Constrained (BB1-2)
       Scenario (Annual Average, 2017-2031) ........................................................................... 26
Figure 19: Consumer Electricity-Related Cost Impacts of State Scenarios (Annual Average,
       2017-2031, billion 2013 dollars)....................................................................................... 27
Figure A-1: NewERA Modeling System Representation ........................................................... A-2
Figure A-2: NewERA Electric Sector Model – U.S. Regions .................................................... A-4
Figure A-3: Interdependent Economic Flows in NewERA’s Macroeconomic Model ............... A-6

NERA Economic Consulting                                                                                                                       ii
Figure A-4: Household Consumption Structure in NewERA’s Macroeconomic Model ............ A-6
Figure A-5: Commercial Transportation and Trucking Sector Production Structure in NewERA’s
       Macroeconomic Model ................................................................................................... A-7
Figure A-6: Production Structure for Other Sectors in NewERA’s Macroeconomic Model...... A-8
Figure A-7: NewERA Macroeconomic Model Regions ............................................................ A-10
Figure B-1: 2030 Regional CO2 Emission Rate Targets (lbs/MWh) ......................................... B-2
Figure B-2: Overview of Energy System Impacts of Regional Unconstrained (BB1-4) Scenario
       (Annual Average, 2017-2031) ........................................................................................ B-2
Figure B-3: CO2 Emission Impacts of Regional Unconstrained (BB1-4) Scenario .................. B-3
Figure B-4: Coal Unit Retirement Impacts of Regional Unconstrained (BB1-4) Scenario ...... B-3
Figure B-5: Capacity Impacts of Regional Unconstrained (BB1-4) Scenario (GW) ................ B-4
Figure B-6: Generation Impacts of Regional Unconstrained (BB1-4) Scenario (TWh) ........... B-5
Figure B-7: Coal and Natural Gas Consumption Impacts of Regional Unconstrained (BB1-4)
       Scenario........................................................................................................................... B-5
Figure B-8: Natural Gas Wholesale Price (Henry Hub) Impacts of Regional Unconstrained
       (BB1-4) Scenario .......................................................................................................... B-6
Figure B-9: Regulation Cost Impacts of Regional Unconstrained (BB1-4) Scenario (billion 2013
       dollars) ............................................................................................................................ B-6
Figure B-10: Coal Unit Retirement Impacts by Region of Regional Unconstrained Scenario
       Through 2031 .................................................................................................................. B-7
Figure B-11: Natural Gas Combined Cycle Generation Impacts by Region of Regional
       Unconstrained (BB1-4) Scenario (Annual Average, 2017-2031, TWh) ........................ B-7
Figure B-12: Natural Gas Combined Cycle Fuel Consumption Impacts by Region of Regional
       Unconstrained (BB1-4) Scenario (Annual Average, 2017-2031, TBtu) ........................ B-8
Figure B-13: All Sectors Delivered Electricity Price Impacts of Regional Unconstrained (BB1-
       4) Scenario ...................................................................................................................... B-8
Figure B-14: Ratepayer Class Delivered Electricity Price Impacts of Regional Unconstrained
       (BB1-4) Scenario (Annual Average, 2017-2031, 2013 cents per kWh) ......................... B-9
Figure B-15: State All Sectors Delivered Electricity Price Impacts of Regional Unconstrained
       (BB1-4) Scenario (Annual Average, 2017-2031) ........................................................... B-9
Figure B-16: Consumer Electricity-Related Cost Impacts of Regional Unconstrained (BB1-4)
       Scenario (Annual Average, 2017-2031, billion 2013 dollars) ...................................... B-10

NERA Economic Consulting                                                                                                                     iii
EXECUTIVE SUMMARY
This report evaluates the potential energy market impacts and energy costs of the U.S.
Environmental Protection Agency’s (EPA) proposed Clean Power Plan (CPP) to reduce carbon
dioxide (CO2) emissions from existing power plants. EPA proposed the CPP in June 2014 as a
nationwide regulation (to be implemented by the states) under Section 111(d) of the Clean Air
Act.

           Overview of the Proposed Clean Power Plan
The proposed CPP sets state-specific CO2 emission rate targets (in lbs/MWh) based upon EPA’s
calculation of the emission rates that EPA believes could be achieved in each state by
implementing four types of changes, referred to as Building Blocks. The Building Blocks
include heat rate improvements at coal units (Building Block 1), increased utilization of existing
natural gas combined cycle (NGCC) units (Building Block 2), increases in renewables and
nuclear energy (Building Block 3), and increases in end-use energy efficiency (Building Block
4). EPA identified two options based upon alternative stringencies and compliance timeframes.
Option 1, which is EPA’s preferred option, is projected by EPA to reduce U.S. CO2 power plant
emissions by 30% in 2030 (relative to the 2005 emission level). Option 2 would have less
stringent emission rate targets and is projected by EPA to reduce U.S. CO2 power plant
emissions by about 24% by 2025 (relative to the 2005 level). This report focuses on Option 1,
EPA’s preferred option.

In its proposal, EPA emphasized that states would have flexibility to meet the CPP state targets.
According to EPA, this means that, provided EPA’s overall target emission rate is met, states
would not be required to apply each of the Building Blocks at the levels that were used to set the
target rates but could determine their preferred combination of the four Building Blocks. (The
formula to show compliance would, nevertheless, still be limited to the emissions and generation
from the covered sources EPA has specified in the Building Blocks; thus, for example,
compliance accounting would exclude emissions from new NGCC units.1)

There are some questions, however, as to whether all of the Building Blocks actually would be
available for compliance. Some legal analysts have questioned whether EPA has the statutory
authority to require states to extend regulation under Section 111(d) to account for emissions
other than those from the specific existing electricity generation units in the listed source
category. This concern calls into question whether the use of Building Blocks 2, 3, and 4 could
be included for demonstrating compliance even though the proposed state targets have been

1
    In its proposal, EPA mentioned the possibility of including new NGCC units as part of the rate limit, and asked for
    comments on this possibility (EPA 2014a, p. 34924).

NERA Economic Consulting                                                                                             S-1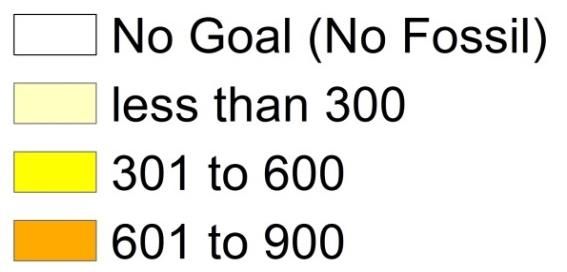
computed on the assumption they would be allowed.2 In addition, some states may require
legislation in order to impose measures that would be needed to implement Building Blocks 3
and 4 (such as renewable portfolio standards and energy efficiency resource standards), which
could lead to constraints on the use of those Building Blocks. Also, it is the opinion of some
legal analysts that EPA could not enforce Building Blocks 2, 3, and 4 if the Agency imposed a
Federal Implementation Plan on states.

           Study Objectives and Compliance Scenarios
Our principal objective is to evaluate the potential energy market impacts and energy costs of the
CPP, focusing on results over the period from 2017 through 2031. (2017 marks the beginning of
the ramp up of EPA’s assumed end-use energy efficiency and renewable generation, and 2031
represents the most stringent rates that are achieved by 2029).3 We develop impact estimates
under two scenarios, both of which presume least-cost compliance by each state; while
appropriate for modeling, this least-cost presumption may lead to understating the real-world
impacts and costs of the CPP. The first scenario assumes that states are able to use all four
Building Blocks and the second addresses the impact of legal and other potential constraints on
state and Federal plans by assuming that states can only use Building Blocks 1 and 2 to show
compliance with the targets set in the CPP.4

       1. State Unconstrained (BB1-4). Each state complies with its targets, with all four Building
          Blocks available as compliance options.

       2. State Constrained (BB1-2). Each state complies with its targets, but this scenario
          presumes that neither end-use energy efficiency (Building Block 4) nor renewables and
          additional nuclear energy (Building Block 3) would be available as compliance options.

We refer to the first scenario as a “state unconstrained” scenario to indicate that each state is
presumed to comply using the least-cost mix across all four Building Blocks without any legal or
implementation constraints. Further, the Building Blocks measures must occur within each state
individually. (An appendix to the report provides results for a scenario that assumes states can
meet the target rates on a regional, rather than state-by-state, basis.) We refer to the second
scenario as a “state constrained” scenario to illustrate the impact of state-by-state compliance

2
    EPA requests comment on a separate set of target calculations based upon only Building Blocks 1 and 2 (EPA
    2014a, p. 34878); however, the targets actually proposed by EPA assume all four Building Blocks would be
    allowed. This analysis focuses on the proposed targets.
3
    States are presumed to comply with the rate-based form of the goal, rather than with a translation of the CPP
    requirements to a mass-based form; EPA has not yet specified how such a translation could be accomplished.
4
    This report does not take a position on the legal and practical issues associated with use of the various Building
    Blocks, including whether EPA has authority under the Clean Air Act to base Section 111(d) standards on
    requirements concerning how generating units are dispatched. The second scenario reflects the likelihood that if
    coal-fired generation is to be used less, gas-fired generation will be used more.

NERA Economic Consulting                                                                                                 S-2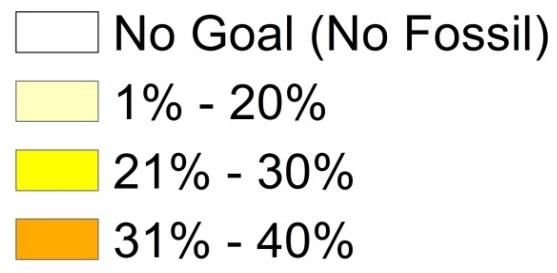
with constraints, where states would only be able to use two of the four Building Blocks to
demonstrate compliance with the state targets proposed by EPA. Despite the label
“constrained,” even in this scenario the states could still choose their preferred compliance mix,
given the CO2 rate constraint. For our analysis, we have assumed that each state chooses its own
least-cost compliance strategy under both scenarios.

       NERA Methodology
NERA evaluated the potential impacts of the various CPP scenarios using its proprietary
NewERA model and baseline conditions based upon U.S. government information. We reviewed
the assumptions that EPA used in its Building Blocks and made various corrections and
adjustments in modeling the likely effects of the proposed CPP.

           NewERA Model

The NewERA model is an economy-wide integrated energy and economic model that includes a
bottom-up unit-specific representation of the U.S. electricity sector and a top-down
representation of all other sectors of the economy including households and governments. It has
substantial detail for all of the energy sources used by the economy, with separate sectors for
electricity, coal, natural gas, crude oil, and refined petroleum products. The model performs its
analysis with regional and state detail, accounting for more than 30 electricity regions and 11
macroeconomic regions. NewERA is a long-term model that includes the assumption that
households and firms make optimal decisions over the entire modeling period, within regulatory
constraints, and with full knowledge of future policies.

The NewERA model used in this study is calibrated to the U.S. Energy Administration (EIA)
Annual Energy Outlook (AEO) 2014 Reference Case projection. This reference case reflects
current environmental regulations (e.g., Mercury and Air Toxics Standards) and other policies, as
well as the EIA’s most recent projections of energy and economic activity. The Reference Case
includes the effects of the two major existing programs to reduce CO2 emissions, the Regional
Greenhouse Gas Initiative (RGGI) and the California cap-and-trade program.

           Building Block Assumptions

We developed assumptions about the costs and effectiveness of the different compliance options.
As discussed above these compliance options (or Building Blocks) are heat rate improvements of
coal units (Building Block 1), increased utilization of existing natural gas combined cycle
(NGCC) units (Building Block 2), increases in renewable and nuclear energy (Building Block 3),
and increases in end-use energy efficiency (Building Block 4). Below we discuss our
assumptions for each building block (details are provided in the main body of the report).

NERA Economic Consulting                                                                        S-3
Building Block 1 – Heat Rate Improvements for Coal Units
In its calculations of state targets, EPA assumed that all coal units could achieve a 6%
improvement in their efficiency (i.e., reduction in heat rate), and in its cost modeling EPA also
assumed this 6% improvement could be achieved at a capital cost of $100/kilowatt (kW). We
understand that various industry experts have concluded that these assumptions are unrealistic in
light of practical engineering considerations, actual industry experience, and the incentives
owners of electricity generators already have to improve plant efficiency. Our clients suggested
an alternative set of assumptions, in particular, (a) for a cost of $100/kW, a maximum efficiency
improvement of 1.5% would be achievable for the most inefficient existing units and a 0.75%
improvement would be available for units with average efficiency, and (b) no efficiency
improvements would be available to the most efficient units. We investigated the significance to
our incremental energy cost estimates of these alternative sets of assumptions regarding potential
heat rate improvements and found that this set of assumptions did not have a major effect on the
results; using EPA’s heat rate assumption rather than the alternative set resulted in less than a 1%
change in our estimate of the overall energy system cost of the CPP in the unconstrained
scenario. Thus, although we are not indicating that we attempted to determine the most realistic
set of assumptions, we adopted the alternative industry set of assumptions regarding potential
heat rate improvements. We note that while this set of assumptions has de minimis impact on
our estimates of the impacts of the proposed CPP, this issue would be much more significant if
the Section 111(d) limits for legal reasons had to be based solely on systems of emissions
controls that can be achieved on the existing fossil units themselves. In that legal situation, this
uncertainty would warrant a more thorough treatment of heat rate improvement assumptions than
we determined was necessary for our present analysis.
Building Block 2 – Increased Utilization of Existing NGCC
In its calculation of state targets, EPA assumed that existing NGCC units could increase their
utilization to a 70% annual capacity factor (subject to the availability of coal- and oil-fired units
to be backed down) regardless of any engineering, regulatory, or infrastructure constraints.5
Increasing utilization of existing NGCC units up to each unit’s maximum availability6 is an
option in all of our scenarios. The estimated incremental cost of this action depends upon the
relative costs of the alternative sources of generation, which vary by electricity market region;
the specific units backed down to achieve any increase in generation from existing NGCC units
are determined in NewERA.
5
Not all states are able to ramp up to 70%. Some states do not have sufficient coal- and oil-fired generation to be
backed down; in this case, NGCC units were assumed to be able to ramp up to a level based upon backing out all
coal- and oil-fired generation.
6
For most units, the maximum availability is assumed to exceed 85%.
NERA Economic Consulting S-4Building Block 3 – Increases in Renewable and Nuclear Generation
EPA’s calculation of state targets includes the effects of added generation from existing and new
non-hydroelectric units, existing nuclear generation termed “at risk,” and new nuclear generation
currently under construction. In all of our scenarios that include Building Block 3, additions of
non-hydroelectric renewable and nuclear generation are presumed to be able to contribute to
lowering emission rates, at the capital and operating costs that are standard in NewERA.
Building Block 4 – Increases in End-Use Energy Efficiency
EPA’s calculation of state targets was based upon its estimates of the quantities of end-use
energy efficiency by state that could be added in each year based upon the programs adopted to-
date in states with ambitious energy efficiency programs. EPA also provided estimates of the
cost for this energy efficiency, with the first-year cost varying based on whether a state was
adding less than 0.5% incremental energy efficiency ($550/MWh), between 0.5% and 1.0%
($660/MWh), or more than 1.0% ($770/MWh). EPA has translated the three first-year costs to
levelized costs of 6.5¢/kWh, 7.8¢/kWh, and 9.1¢/kWh, respectively. We reviewed the literature
and updated the cost estimates based upon a recent review by two prominent academic
researchers (Allcott and Greenstone, 2012); the recommendation in this review implies a
levelized cost of 10.6¢/kWh based on historical energy efficiency costs (including both utility
costs and participant costs), which we presume relates to the EPA value for states adding less
than 0.5% incremental energy efficiency. We scaled up EPA’s first-year costs by the ratio of this
value to the equivalent levelized cost for EPA (6.5¢/kWh), resulting in first-year energy
efficiency costs of $896/MWh. We are not aware of any assessment regarding the extent to
which energy efficiency costs may increase as the targets become more ambitious that is similar
to the Allcott and Greenstone assessment on historical energy efficiency costs. Thus, we used the
same assumptions as EPA regarding the changes, resulting in estimates of $1,075/MWh and
$1,253/MWh (2011$) for the second and third levels of energy efficiency.
We modeled the adoption of energy efficiency as a compliance option based upon its cost
relative to alternative means of reducing CO2 compliance emission rates to comply with the CPP
(using the same approach as EPA). As discussed in Appendix C, however, there is a strong
conceptual argument that cost-effective energy efficiency would be adopted in the absence of the
CPP, i.e., in the baseline case to which the CPP case is compared in deriving the cost and
impacts of the CPP.
Results for the State Compliance Scenarios
The following are estimates of the energy sector impacts and energy costs of the two state
compliance scenarios. The first scenario presumes that compliance costs are minimized using all
four of the Building Blocks identified by EPA for the CPP targets. The second presumes that the
same interim and final CPP state targets would have to be met, but that states would be
constrained to using only Building Blocks 1 and 2.
NERA Economic Consulting S-5Figure ES-1 provides an overview of the average annual energy system impacts of these two
scenarios over the period from 2017 through 2031. Chapter IV provides information on annual
effects for individual years from 2017 through 2031, with effects that are both higher and lower
in individual years than these average values.
The energy market impacts of the CPP would be substantial in the State Unconstrained (BB1-4)
scenario. The annual average electricity sector CO2 emissions would be reduced by about 22%
relative to the reference case (not relative to 2005 emission levels) over the period from 2017
through 2031. Coal unit retirements would increase by about 45 gigawatts (GW). Coal-fired
generation would decline by about 29% on average over the period, with natural gas-fired
generation increasing by about 5% on average. The Henry Hub natural gas price would increase
by about 2% on average. Delivered electricity prices would increase by about 12% on average
over 2017 through 2031. However, these figures omit several factors that could add to impacts
and costs.7
Figure ES-1: Overview of Energy System Impacts of State Unconstrained (BB1-4) and State
Constrained (BB1-2) Scenarios (Annual Average, 2017-2031)
Total Coal Natural Gas- Henry Hub Delivered Electricity
Retirements Coal-Fired Fired Natural Gas Electricity Sector CO2
Through 2031 Generation Generation Price Price Emissions
GW TWh TWh 2013$/MMBtu 2013 ¢/kWh MM metric tons
Baseline 51 1,672 1,212 $5.25 10.8 2,080
State Unconstrained (BB1-4) 97 1,191 1,269 $5.36 12.0 1,624
Change from Baseline +45 -481 +57 +$0.11 +1.3 -456
% Change from Baseline +18% -29% +5% +2% +12% -22%
State Constrained (BB1-2) 220 492 2,015 $6.78 12.6 1,255
Change from Baseline +169 -1,180 +802 +$1.53 +1.9 -825
% Change from Baseline +69% -71% +66% +29% +17% -40%
Note: Coal retirements are cumulative from 2014. Percentage change in coal retirements is relative to total
baseline 2031 coal capacity.
Source: NERA calculations as explained in text.
In the State Constrained (BB1-2) scenario, reductions in average annual electricity sector CO2
emissions over the 2017 through 2031 timeframe would be 40%, almost twice the amount under
7
Potential infrastructure costs related to natural gas pipelines, electricity transmission, and voltage support or
ancillary services are not included. Low projected capacity utilization of non-retired coal units would lead to
decreases in efficiency (i.e., increases in heat rates), additional wear and tear costs from operating coal units in a
cycling mode, and potentially additional retirements, none of which are included in our modeling. Costs related to
unit ramp rate constraints, minimum load constraints, and delays in new build or retirement permitting are also not
accounted for in our cost estimates.
NERA Economic Consulting S-6the State Unconstrained (BB1-4) scenario.8 Such a constrained compliance scenario would result
in very large changes in the electricity system, including 169 GW of coal retirements, a 29%
average increase in natural gas prices and a 17% increase in average delivered electricity prices.
Figure ES-2 shows the energy system costs of the two scenarios, expressed as present values in
2014 of spending incurred over the period from 2017 through 2031. The costs are broken down
into three categories: (1) costs to serve electricity load; (2) costs of the end-use energy efficiency
programs, both to the utilities and to the participants; and (3) costs of non-electricity natural gas
use. Under the State Unconstrained (BB1-4) scenario, energy system costs are dominated by the
costs to the utilities and to participants of the additional state energy efficiency programs, which
are estimated to cost about $560 billion (in present value) over the period from 2017 through
2031. The reduction in electricity demand over the period 2017 through 2013 results in a net
decrease in production costs to meet electricity load that has a present value in 2014 of about
$209 billion; this partially offsets the investment costs of the energy efficiency programs.
Higher gas prices are part of the higher cost to serve load, but they also affect consumers who
purchase natural gas for non-electricity energy services; the higher consumer cost for direct
consumption of natural gas adds another $15 billion to the present value of the CPP over the
years 2017-2031. The net result is that energy system costs would be greater by about $366
billion in present value terms over the period from 2017 through 2031 under the State
Unconstrained (BB1-4) scenario.
Figure ES-2: Energy System Costs of State Unconstrained (BB1-4) and State Constrained (BB1-
2) Scenarios
State State
Unconstrained Constrained
(BB1-4) (BB1-2)
Present Value (Billion 2013$)
Cost of Electricity, Excluding EE -$209 $335
Cost of Energy Efficiency $560 $0
Cost of Non-Electricity Natural Gas $15 $144
Total Consumer Energy Costs $366 $479
Notes: Present value is from 2017 through 2031, taken in 2014 using a 5% real discount rate
Source: NERA calculations as explained in text.
The net cost of the State Constrained (BB1-2) scenario—which excludes end-use energy
efficiency, renewables and additional nuclear energy from compliance—is substantially greater
than the State Unconstrained (BB1-4) scenario. There would be no costs for end-use energy
8
While states are required to meet the same target CO2 rates in both state scenarios, the State Constrained (BB1-2)
scenario does not allow energy efficiency, renewables, and nuclear generation to contribute to the CO 2 rates
(lbs/MWh) used to demonstrate compliance with the CPP targets. In order to achieve the compliant CO2 rates
using only fossil sources, states rely more heavily on reducing existing coal and natural gas generation in the State
Constrained (BB1-2) scenario, which is replaced by new, lower emitting generation sources, resulting in lower
total emissions than in the State Unconstrained (BB1-4) scenario.
NERA Economic Consulting S-7efficiency (because this would not be allowed as part of compliance), but the additional costs of providing electricity services would be about $335 billion. The higher natural gas prices would result in an increase in natural gas costs for non-electricity uses of about $144 billion. The net result would be an increase in energy system costs by about $479 billion in present value terms over the period from 2017 through 2031. NERA Economic Consulting S-8
I. INTRODUCTION
This report provides an assessment of the U.S. Environmental Protection Agency’s (EPA) Clean
Power Plan (CPP) proposal to reduce carbon dioxide (CO2) emissions from existing power plants
nationwide. In particular, we use the state-of-the-art NewERA model to analyze the potential
impacts of the proposal on U.S. energy markets and on energy sector costs.

      A. Background on EPA Proposal
EPA proposed the CPP in June 2014 as a nationwide regulation under Section 111(d) of the
Clean Air Act (EPA 2014a). The proposal would set maximum limits on CO2 emission rates
(measured in pounds of CO2 per megawatt-hour (MWh) of generation and end-use energy
efficiency according to a formula described below) for electricity systems within relevant states.9
In EPA’s preferred regulatory approach (labeled “Option 1”), the final CO2 emission rate
standards would apply in 2030, and in that year total U.S. power sector CO2 emissions would be
30% below their level in 2005. EPA also developed and evaluated an alternative approach
(labeled “Option 2”) with final standards in 2025. EPA developed interim limits in addition to
the final limits for each regulatory approach. The proposal would allow states to develop
regional programs for collective CO2 emission reduction, as in the Regional Greenhouse Gas
Initiative (RGGI) in nine Northeastern states that began in 2009.

EPA set the state CO2 emission rate limits based on their analysis of emission reduction
opportunities in each state. EPA evaluated the opportunities in terms of four Building Blocks that
can be summarized as follows:

      1. Building Block 1—Heat rate improvements at coal units;

      2. Building Block 2—Increased utilization of existing natural gas combined cycle (NGCC)
         units;

      3. Building Block 3—Increases in renewables and nuclear energy; and

      4. Building Block 4—Increases in end-use energy efficiency.

Chapter II of this report describes EPA’s calculations for these four Building Blocks as well as
the CO2 emission rate formula and state limits that result under the CPP.

9
    The proposal does not set CO2 emission rate limits for Vermont or Washington, D.C., because these jurisdictions
    do not have any affected fossil-fired power plants.

NERA Economic Consulting                                                                                              1
B. Objectives of This Evaluation
Our principal objective is to evaluate the potential energy market impacts and energy costs of the
CPP, focusing on results over the period from 2017 through 2031 (2017 marking the beginning
of the ramp up of EPA’s assumed end-use energy efficiency and renewable generation, and 2031
representing the most stringent rates that are achieved by 2029). We develop impact estimates
under two scenarios, both of which presume least-cost compliance by each state. (While
appropriate for modeling, this least-cost presumption may lead to understating the real-world
impacts and costs of the CPP.) The first scenario assumes that states are able to use all four
Building Blocks and the second scenario assumes that states are constrained by the legal
considerations described above but nonetheless use Building Blocks 1 and 2 to show compliance
with the targets set in the CPP.10
1. State Unconstrained (BB1-4). Each state complies with its targets, with all four Building
Blocks available as compliance options.
2. State Constrained (BB1-2). Each state complies with its targets; this scenario presumes
that neither end-use energy efficiency (Building Block 4) nor renewables and additional
nuclear energy (Building Block 3) would be available as compliance options.
We refer to the first scenario as a “state unconstrained” scenario to indicate that each state is
presumed to comply using the least-cost mix across all four Building Blocks, although the
specific mix of Building Blocks is limited to each state individually, and we assume there are no
legal or implementation constraints to using all four Building Blocks. (Appendix B provides
results for a scenario that assumes states can meet the target rates on a regional rather than state-
by-state basis.11) We refer to the second scenario as a “state constrained” scenario to illustrate the
impact of state-by-state compliance with constraints, where states would only be able to use two
of the four Building Blocks to demonstrate compliance. Despite the label “constrained,” even in
this scenario the states could still choose their preferred compliance mix, given the constraint.
For our analysis, we have assumed that each state chooses its own least-cost compliance strategy
under both scenarios.
C. Organization of This Report
The remainder of this report is organized as follows.
10
States are presumed to comply with the rate-based form of the goal, rather than with a translation of the CPP
requirements to a mass-based form; EPA has not yet specified how such a translation could be accomplished.
11
Both the state-by-state and regional results assume CPP targets are based upon the EPA compliance formula
(which excludes some CO2 emission sources) and that CPP targets would need to be met each year.
NERA Economic Consulting 2 Chapter II describes the EPA proposal, including information on the CPP CO2 emission
rate formula, the four Building Blocks, and the state emission rate targets resulting from
EPA’s calculations;
Chapter III describes the modeling methodology and compliance scenarios for this study;
and
Chapter IV presents energy system modeling results for the State Unconstrained (BB1-4)
and State Constrained (BB1-2) scenarios.
Appendices provide additional information on the methodology and results. Appendix A
documents the key features of the NewERA model. Appendix B provides our results for the
regional compliance scenario that EPA also analyzed in its Regulatory Impact Analysis
Appendix C discusses how EPA’s decision to not incorporate cost-effective energy efficiency
into the baseline alters the impact estimates.
NERA Economic Consulting 3II. EPA CLEAN POWER PLAN PROPOSAL
This chapter provides information on EPA’s CPP proposal, including calculations for the four
Building Blocks, the formula for calculating the CO2 emission rate, and state CO2 emission rate
limits resulting from EPA’s calculations. This information serves as the basis for our
evaluation’s methodology and inputs, as discussed below in Chapter III.
A. Building Blocks Used to Calculate State Targets
As noted above, EPA used four Building Blocks to estimate levels of CO2 emission rate
reductions in each state that it translated into state targets in the CPP. The CPP proposal does not
require each state to achieve the specific measures assumed for each Building Block. Instead,
each state would need to achieve the interim and final CO2 emission rates calculated from the
combination of all four Building Blocks. States might choose not to implement some of the
Building Blocks at all and might develop entirely different strategies for lowering their CO2
emission rates to the required levels. This subsection provides information related to EPA
assumptions for each Building Block.
1. Building Block 1: Heat Rate Improvements at Coal Units
The first Building Block involves improving the heat rate (i.e., fuel efficiency and hence CO2
emission rate) at existing coal units. Based on engineering analyses by Sargent & Lundy and
EPA, EPA estimated that existing coal units could improve their heat rate by 6% through a
combination of operational measures (4% improvement) and equipment upgrades (additional 2%
improvement). EPA also estimated that the heat rate improvements would require costs of
$100/kW measured in 2011 dollars (EPA 2014b, Chapter 2).
2. Building Block 2: Increased Utilization of Existing NGCC Units
The second Building Block involves increasing the utilization (i.e., capacity factor) of existing
NGCC units. According to EPA (2014c), the average utilization of existing NGCC units across
the country was 44% in 2012. The goal of this Building Block is to increase average utilization
in each state to 70%.
EPA assumed that utilization of coal- and oil-fired units would decrease in order for utilization
of existing NGCC units to increase. States with little generation from coal- and oil-fired units
under baseline conditions (and hence little opportunity for fuel switching) would not achieve the
70% utilization target for existing NGCC units. Beyond the availability of coal- and oil-fired
generation, EPA did not account for any potential regulatory, engineering, or infrastructure
barriers to increasing the utilization of existing NGCC units.
NERA Economic Consulting 43. Building Block 3: Renewables and Nuclear
The third Building Block involves renewable energy, new nuclear units under construction, and
at-risk nuclear units (as described above regarding relevant MWh for the CO2 emission rate
formula). EPA estimated feasible reductions in CO2 emission rates for each state with this
Building Block based on current state renewable portfolio standards (RPS), recent historical
renewable energy percentages relative to total generation, conversion to MWh, and information
on under-construction and at-risk nuclear units.
Many states already have RPSs with goals in terms of MW of capacity, MWh of generation,
percentage of total state generation, or other measures. EPA grouped states into regions and used
current RPS targets in individual states to estimate renewable energy percentage targets (relative
to total state generation) and annual growth rates for each region.12 EPA then applied these
annual growth rates to each state’s 2012 renewable energy percentage to develop targets for
individual years through 2029. In EPA’s calculations, state target renewable energy percentages
are never allowed to exceed the target for the corresponding region, and some states with low
2012 starting points do not reach the target for their region even by 2029 after many years of
applying the corresponding regional growth rate.
EPA converted the state target renewable energy percentages to MWh in each year using 2012
generation in each state. EPA added MWh from under-construction and at-risk nuclear units to
estimate total MWh for this building block.
4. Building Block 4: Increased End-Use Energy Efficiency
The fourth Building Block involves increases in end-use energy efficiency programs. To
evaluate opportunities for increased energy efficiency in each state, EPA began by reviewing the
annual incremental savings in electricity sales (measured as a percentage of the previous year’s
sales) from energy efficiency programs across the country. Based on this review, EPA concluded
that implementation of “best practices” for energy efficiency programs would enable all states to
achieve 1.5% annual incremental savings in the long term. In the calculations for this Building
Block, EPA assumed that states would begin in 2017 with an initial annual incremental savings
rate equal to their 2012 incremental savings. Thereafter, the incremental savings rate would
increase by 0.20% until it ramped up to a final rate of 1.5% per year. This trajectory would
reduce total U.S. electricity sales in 2029 by about 10% relative to the baseline total sales
projection for that year (EPA 2014c).
From its review of energy efficiency program information, EPA concluded that at annual
incremental savings rates less than 0.5%, the energy efficiency programs for compliance with the
12
EPA did not account for existing RPSs in Texas and Iowa, which have RPS targets specified in terms of MW
(rather than specified in MWh). On the other hand, EPA based the renewable energy target for the entire South
Central region on Kansas, which also has a RPS target in terms of capacity (MW) rather than generation (MWh).
NERA Economic Consulting 5CPP would require upfront costs of $550/MWh measured in 2011 dollars, with 50% borne by
utilities and 50% borne by consumers. For annual incremental savings between 0.5% and 1.0%,
EPA assumed that the upfront costs would increase by 20%, to $660/MWh. For annual
incremental savings above 1.0%, EPA assumed the upfront costs would increase by 40%
(relative to the initial cost), to $770/MWh (EPA 2014b, p. 5-54).
B. CO2 Emission Rate Formula
As noted above, the EPA proposal would address CO2 emissions from power plants by setting
maximum limits on the CO2 emission rate (measured in lbs/MWh) for each relevant state. The
limits would first take effect in 2020. They would tighten over time until reaching final levels in
2030 (for EPA’s preferred regulatory approach labeled “Option 1”) or 2025 (for the alternative
regulatory approach labeled “Option 2”).
The proposal uses a specific formula to calculate CO2 emission rates that are to be compared to
the proposed target emission rate for each state:
This section discusses the formula’s numerator (relevant CO2 emissions) and denominator
(relevant MWh) and illustrates the impact of the EPA Building Block assumptions on the CO2
rate calculation.
1. Numerator: Relevant CO2 Emissions
The numerator in the CO2 emission rate formula is CO2 emissions from relevant sources. These
include existing coal units (this includes the under-construction IGCC unit with carbon capture
in Mississippi), existing NGCC units, and certain combustion turbine or steam units consuming
oil or natural gas. CO2 emissions from combined heat and power (CHP) units that produce
“useful thermal output” according to EPA terminology also count in the numerator.
Note that the numerator does not include CO2 emissions from future NGCC additions. Nor does
it include emissions from “peaker” units smaller than 73 MW with annual production less than
219,000 MWh (EPA 2014a, p. 34954).
2. Denominator: Relevant Megawatt-hours
The denominator in the CO2 emission rate formula is relevant MWh. This includes generation
from the fossil units listed above (and does not include generation from future NGCC additions
or “peaker” units). It also includes generation from renewables (except existing hydro), new
nuclear units (i.e., nuclear units currently under construction as well as future nuclear
NERA Economic Consulting 6additions)13, and “at-risk” nuclear units (i.e., the 5.8% of existing nationwide nuclear capacity
that are at-risk for shut down for financial reasons under baseline conditions according to EPA
and EIA analysis).
In addition, the denominator includes avoided MWh from increased end-use energy efficiency
based on the actual levels of incremental energy efficiency. The use of additional energy
efficiency as a compliance measure raises several important impact estimation issues, however,
as discussed in Appendix C.
3. Summary of CO2 Emission Rate Impacts of EPA Building Blocks
Figure 1 illustrates the hypothetical impact of each EPA Building Block on CO2 emission rates
(calculated using the formula above) based on analysis of state information in EPA (2014b, p.
25) and EPA (2014c). In particular, state information has been weighted by relevant MWh in
2012 in each state to develop U.S. averages. The starting U.S. average emission rate of 1,474
lbs/MWh is based upon EPA’s application of 2012 historical generation and emissions
information; the different components of the CO2 rate formula are then modified from the 2012
values to reflect EPA assumptions about the Building Block measures. According to EPA, full
implementation of all four Building Blocks would reduce the U.S. CO2 emission rate (again
calculated using the formula above) to 1,016 lbs/MWh by 2030. As discussed below, some of
the assumptions behind these calculations are not correct.
EPA information indicates that full implementation of the Building Blocks would have the
following impacts on U.S. average CO2 rates:
1. Building Block 1—heat rate improvements at coal units—would reduce the U.S. CO2
emission rate by 67 lbs/MWh (assuming no retirements or reduced utilization of coal
units). Note that if any coal units were to retire as a result of the Building Block 1
contribution to emission rate targets, this would result in more emission reductions than
would be achieved if those units were to achieve a 6% heat rate reduction and continue
operating. In addition, the potential for emission rate reductions due to coal heat rate
improvements is diminished by the other Building Blocks, which tend to reduce coal
generation.
2. Building Block 2—increased utilization of existing NGCC units—would reduce the U.S.
CO2 emission rate by 177 lbs/MWh. This calculation is based upon EPA’s assumptions
regarding the capacity of NGCC units and their emission rates; as discussed below, these
assumptions overstate the likely reductions in CO2 rates.
13
We interpret the CPP proposal as including generation from new nuclear units in the denominator for purposes of
compliance.
NERA Economic Consulting 73. Building Block 3—increases in renewables and nuclear energy—would reduce the U.S.
CO2 emission rate by 103 lbs/MWh.
4. Building Block 4—increases in end-use energy efficiency—would reduce the U.S. CO2
emission rate by 112 lbs/MWh. This calculation assumes that these energy efficiency
programs would not be developed in the baseline even if baseline market conditions
would mean that the energy efficiency was cost-effective. The implications of this
assumption for impact estimates are discussed in Appendix C.
Figure 1: Calculation of U.S. 2030 CO2 Emission Rate Target from 2012 Rate and Building Blocks
Source: NERA calculations as explained in text.
C. State CO2 Emission Rate Targets
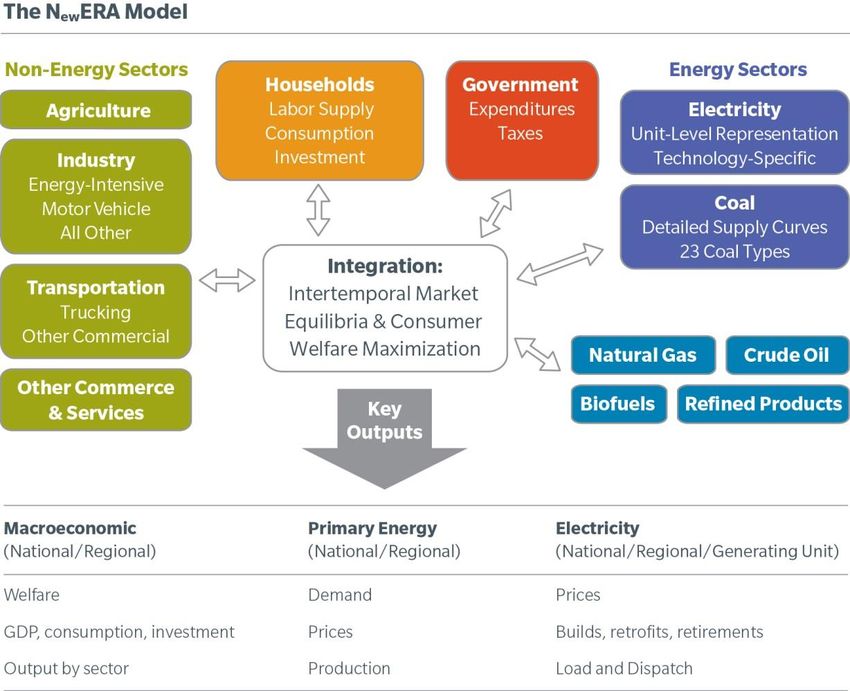
Figure 2 shows each state’s final CO2 emission rate target for 2030 under EPA’s preferred
regulatory approach (“Option 1”) in lbs/MWh. These final state targets that apply for 2030 and
thereafter—as well as the interim targets before 2030—are inputs to the modeling scenarios for
this evaluation, as described in the following chapter.
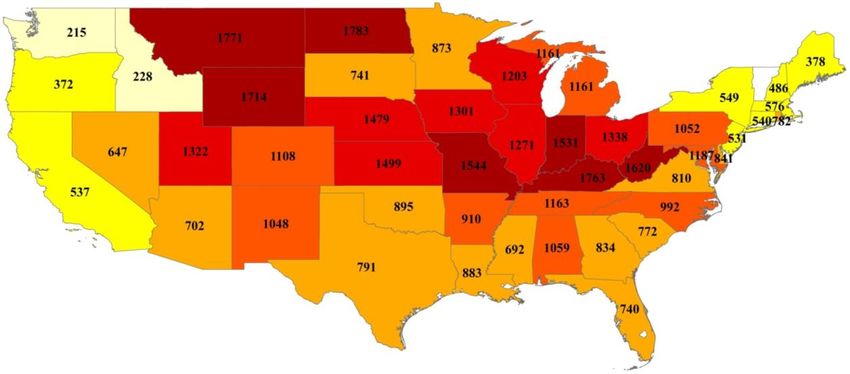
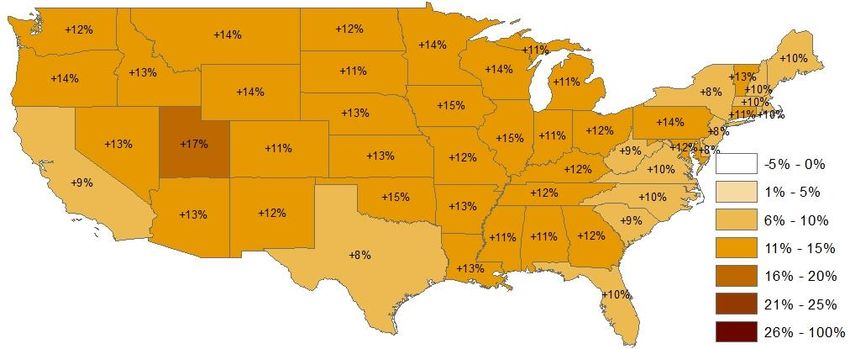
NERA Economic Consulting 8Figure 2: 2030 CO2 Emission Rate Targets for EPA Option 1 (lbs/MWh) Source: NERA calculations as explained in text. Figure 3 shows each state’s reduction in CO2 emission rate by 2030 as a percentage relative to each state’s CO2 emission rate in 2012 based on EPA’s emission rate formula and calculations. NERA Economic Consulting 9
Figure 3: CO2 Emission Rate Reduction for 2030 Target Relative to 2012 Rate

Source: NERA calculations as explained in text.

NERA Economic Consulting                                                      10
III. MODELING METHODOLOGY AND STATE COMPLIANCE
SCENARIOS
This chapter describes the modeling methodology and scenarios. The first two sections describe
the integrated energy-and-economy model used in this evaluation (NewERA) and the specific
modeling assumptions. The third section describes the compliance scenarios evaluated in this
study.
A. NewERA Model
NERA’s NewERA modeling system is an integrated energy and economic model that includes a
bottom-up representation of the electricity sector, including unit-level details that affect costs of
compliance options. NewERA integrates the electricity sector model with a macroeconomic
model that includes all other sectors of the economy (except for the electricity sector) using a
top-down representation. The model produces integrated forecasts for future years; the modeling
for this study was for the period from 2014 through 2038 with modeling inputs and results for
every third year in that period. The model outputs include the following information.
Unit-level dispatch decisions in the electric sector – changes in unit dispatch in response
to different operating constraints (e.g., emission rate limits).
Unit-level investments in the electric sector – retrofits in response to environmental
policies, new builds (full range of new generation technologies represented), and
retirements based on economics.
Energy prices – wholesale electricity prices for each of 34 U.S. regions, capacity prices
for each U.S. region, delivered electricity prices by sector, Henry Hub natural gas prices
and delivered natural gas prices to the electric sector for each U.S. region, minemouth
coal prices for 24 different types of coal, delivered coal prices by coal unit, refined oil
product prices (gasoline and diesel fuel), renewable energy credit (REC) prices for each
state/regional renewable portfolio standard (RPS), emissions prices for all regional and
national programs with tradable credits, and prices for the EPA state/regional rate limits.
Appendix A provides additional information on the NewERA modeling system.
B. Modeling and Input Assumptions
For this study, NewERA’s baseline conditions were calibrated to reflect projections developed by
Federal government agencies, notably the Energy Information Administration (EIA) as defined
in its Annual Energy Outlook 2014 (AEO 2014) Reference case. This baseline includes the
effects of environmental regulations that have already been promulgated (e.g., Mercury and Air
Toxics Standards) as well as other factors that lead to changes over time in the U.S. economy
and the various sectors. Key assumptions drawn from AEO 2014 include natural gas prices,
regional electricity demand, capital costs for new electric generators, GDP growth, and non-
NERA Economic Consulting 11electric sector fuel use and emissions. The baseline includes two major existing programs to
reduce CO2 emissions, the Regional Greenhouse Gas Initiative (RGGI) and the California cap-
and-trade program.
The following sections provide information on other important assumptions used in the analysis.
1. Energy Efficiency Availability and Cost
For purposes of this analysis, we assumed that the quantities of end-use energy efficiency that
EPA assumed in its analyses of the CPP were available to each state. We assumed the same rate
of growth by state, the same quantities of annual incremental energy efficiency, and the same
decay rate as EPA used.
For the costs of energy efficiency, we started with a base of EPA’s energy efficiency costs, but
scaled them up based on the ratio of the levelized costs of energy efficiency derived from Allcott
& Greenstone (2012) to that for EPA. Allcott & Greenstone (2012) reviewed the literature and
recommended a levelized utility cost of end-use energy efficiency of 5.3¢/kWh (2011$)
estimated by Arimura et al (2011). Assuming equal utility and participant costs of end-use
energy efficiency (as in EPA’s analysis), this implies a total levelized cost per kWh of 10.6¢
(2011$) compared to EPA’s levelized rate of 6.51¢ (EPA 2014b, p. 5-56). We applied this ratio
of 1.63 to EPA’s total cost of initial energy efficiency to obtain an upfront cost of $896/MWh.
The costs of energy efficiency programs will depend crucially on the trajectory of expected
increases in the costs of state energy efficiency programs as increasingly ambitious standards are
developed. Assessing this trajectory is complicated because of the potential diversity of the
underlying energy efficiency programs (e.g., residential versus commercial, light bulb
replacement versus equipment retrofit), differences in the empirical techniques to assess such
costs (engineering, statistical, modeling), and differences among states. We are not aware of any
study that has provided a literature review on this topic equivalent to the review by Allcott &
Greenstone of the historical cost information. Thus, in the absence of other information, we
applied the same trajectory as used by EPA to the values for more ambitious targets. This results
in energy efficiency costs of $896/MWh for states adding less than 0.5%, $1,075/MWh for states
adding between 0.5% and 1.0%, and $1,254/MWh for states adding more than 1.0% incremental
energy efficiency. As discussed in Appendix C, these cost assumptions, combined with the
assumption that electric customers do not adopt cost-effective energy efficiency in the absence of
state government programs under the proposed CPP, have important influences on the results.
2. Coal Efficiency Retrofit
In its calculations of state targets, EPA assumed that all coal units could achieve a 6%
improvement in their efficiency (i.e., reduction in heat rate), and in its cost modeling EPA also
assumed this 6% improvement could be achieved at a capital cost of $100/kilowatt (kW). We
understand that various industry experts have concluded that these assumptions are unrealistic in
NERA Economic Consulting 12You can also read