Energy efficiency investment pathways in Ireland - Sustainable Energy Authority of Ireland - Element ...
←
→
Page content transcription
If your browser does not render page correctly, please read the page content below
Energy efficiency investment pathways
                             in Ireland

                                           for

Sustainable Energy Authority of Ireland

             Appendix: Methodology and
                 technical assumptions

                          © Element Energy Ltd.
                   www.element-energy.co.uk
Purpose of this document

•   SEAI commissioned Element Energy to undertake a detailed analysis of the potential for energy efficiency improvements across
    all major energy-consuming sectors in Ireland to 2020. This work forms a key evidence base to inform Ireland’s national strategy
    to meet its on-going obligations with respect to the Re-cast Energy Performance in Buildings Directive (2010) and Energy
    Efficiency Directive (2012).

•   This study provides valuable new information for Ireland as it continues to develop its energy efficiency strategy, offering a
    detailed analysis of the range of measures which could contribute to the target and the variety of policy interventions which could
    ensure the target is met most cost-effectively.

•   This document is the Final Appendix and accompanies the Final Report on the energy efficiency investment pathways in Ireland.
    This Final Appendix provides further details on the methodology and key technical assumptions.

•   In addition to the Final Report and Final Appendix, we have published two reports describing a series of surveys carried out in
    the commercial building sector as part of this study.

•   Please send comments to:
     –    Emrah.Durusut@element-energy.co.uk, or
     –    Sam.Foster@element-energy.co.uk

      Disclaimer
      While Element Energy Limited considers that the information and opinions provided in this document are sound, all
      parties must rely upon their own skill and judgement when interpreting or making use of it. Element Energy Limited
      does not accept liability for losses incurred, whether direct or consequential, arising out of any reliance on this analysis.

                                                                                                                                          2
Contents
Technical energy savings potential
Commercial and Public buildings
Public utilities
Residential buildings
Transport
Industry
Energy efficiency cost curves
Energy efficiency scenarios to 2020
3
Technical potential for commercial buildings is estimated using the outputs of
 the SBEM model based on the data collected in site visits and data from ND-
 BER database

    Process                                                                                   Key aspects of methodology

                                                      •     1,500 site visits completed on time
          Survey statistically                        •     Information collected for a variety of commercial building types on building fabric, building
       representative sample of                             type/shape, size, activity, HVAC and fuel type, lighting, heating and lighting controls
         commercial buildings                         •     See the report for “Extensive survey of commercial buildings in Ireland” for further details

      Link survey database with                                Characterise commercial buildings
     detailed ND-BER and NCM                                   by sub-sector using GeoBusiness*
              databases

                                                                                                                                          Survey design maximising the
     Select archetypes for use in                               Statistically robust sampling                                               value out of the survey, and
     national stock model based                               ensuring sufficient data points for all                                    considering data requirements for
     on coverage of final energy                                     sub-sectors identified                                               energy modelling and other data
                                                                                                                                                 sources available

      Construct national stock
      model using outputs from
       Element Energy SBEM                                                                       1,500 site visits completed on-time
               model

     Estimate technical potential
        energy savings using                                                                       Dataset of the Irish commercial
       outputs from EE SBEM                                                                               buildings stock
                model                                Source: Element Energy analysis for SEAI

* GeoBusiness, an electronic register of every business address in the State, provides a complete geographical database covering close
to 200,000 businesses across the Republic of Ireland.                                                                                                                        4
Technical potential for commercial buildings is estimated using the outputs of
the SBEM model based on the data collected in site visits and data from ND-
BER database

    Process                                                                         Key aspects of methodology

                                                 •   It was possible to collect a wide range of useful data to use as inputs to the energy modelling.
         Survey statistically                        However, to collect all required inputs for the modelling, additional data sources were
      representative sample of                       required.
        commercial buildings                     •   Filtered ND-BER database, which provides detailed data such as U values of the building
                                                     elements for over 10,000 commercial buildings in Ireland, linked with survey results
                                                 •   Detailed activity data gathered by linking the ND-BER with NCM activity database* using
     Link survey database with                       activity IDs and areas of individual zones for all buildings
    detailed ND-BER and NCM
             databases
                                                     Data source                   Data gathered

                                                                                   Building activity (sub-sector), Size (floor area), HVAC type, Heating fuel,
    Select archetypes for use in                                                   Fraction of double glazing, Wall type, Commercial only or
    national stock model based                       Survey results                commercial/residential, Building type, Number of storeys, Building height,
                                                                                   Listed/heritage status, Existence of heat pump, Fraction of low energy
    on coverage of final energy                                                    lighting, Lighting and heating controls
                                                                                   Building activity (sub-sector), Size (floor area), HVAC type, Heating fuel,
      Construct national stock                       ND-BER database               Wall, window, roof, floor, door U values, Infiltration rate, Heating
      model using outputs from                                                     seasonal efficiency, Cooling seasonal efficiency
       Element Energy SBEM                                                         Peak occupancy density (person/m2), Hot water (l/day/m2), Illuminance
               model                                                               (lux), Display lighting (W/m2), Heating schedules (hourly), Cooling set
                                                     NCM activity database         point, Cooling schedules (hourly), Occupancy schedules (hourly),
                                                                                   Metabolic rate (W/person), Ventilation requirement (l/sm2), Equipment
    Estimate technical potential                                                   (W/m2), Equipment schedules (hourly)
       energy savings using
      outputs from EE SBEM
               model                            Source: Element Energy analysis for SEAI

* National Calculation Methodology (NCM) activity database is available at:
http://www.seai.ie/Your_Building/BER/Non_Domestic_buildings/Download_SBEM_Software/Download_SBEM_Software.html                                                   5
Technical potential for commercial buildings is estimated using the outputs of
the SBEM model based on the data collected in site visits and data from ND-
BER database

 Process                                                           Key aspects of methodology

                                •      Buildings in the survey categorised based on building activity, size (floor area), HVAC type,
     Survey statistically              heating fuel, wall type/condition, window condition, building type (detached or mid-terrace)
  representative sample of             and whether the building is commercial only or commercial and residential.
    commercial buildings        •      In order to select the final archetypes, the energy consumption of each possible archetype
                                       was estimated based on the floor area from survey and the kWh/m2 value from ND-BER. Out
                                       of ~340 possible archetypes, 115 commercial building archetypes are selected based on
  Link survey database with            total final energy covering more than 80% of final energy and floor area for each sub-
 detailed ND-BER and NCM               sector. Detailed energy consumption of the final archetypes was calculated using the SBEM
          databases                    model, as shown in the next slide.
                                •      In order to achieve a reasonable number of archetypes, a limited number of options are
                                       included for each category:
 Select archetypes for use in
 national stock model based         Category              Options for category
 on coverage of final energy        Building activity    “Office”, “Retail”, “Hotel”, “Restaurant/public house” or “Warehouse/storage”
                                    Size                 “Large” (>=1,000 m2) or “Small” (=0.6 W/m2K) or “Good” (
Technical potential for commercial buildings is estimated using the outputs of
the SBEM model based on the data collected in site visits and data from ND-
BER database
Process Key aspects of methodology
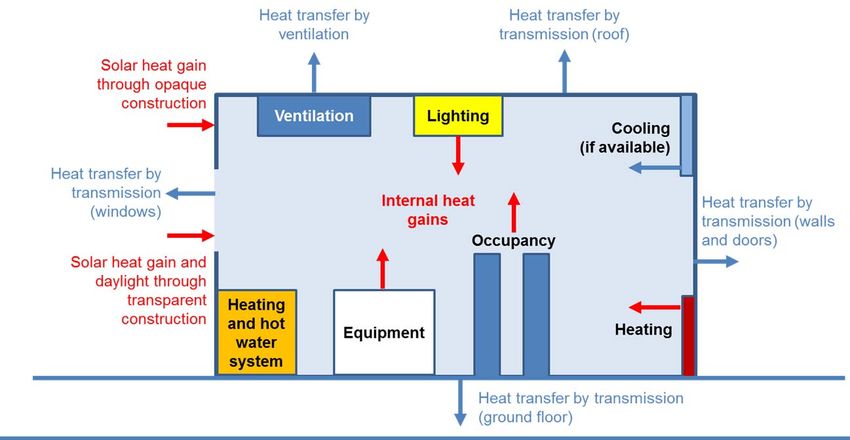
• All the data collected for all of our archetypes are then used as model inputs for Element
Survey statistically Energy’s SBEM-based energy model. SBEM is a model that provides an analysis of a
representative sample of building’s energy consumption and is also used for the ND-BER assessments in Ireland.
commercial buildings • The calculation is based on the building fabric properties, geometry, activity, HVAC system,
lighting systems, space heating, cooling, ventilation, lighting, equipment, hot water and
auxiliary energy demand, solar irradiance and weather data in Ireland, etc. The diagram
Link survey database with below illustrates the calculation process in the model.
detailed ND-BER and NCM
• EE SBEM model tested for a number of building types in each sub-sector and model outputs
databases
for baseline consumption are consistent with estimates in ND-BER database.
Select archetypes for use in
national stock model based
on coverage of final energy
Construct national stock
model using outputs from
Element Energy SBEM
model
Estimate technical potential
energy savings using
outputs from EE SBEM
model Source: Element Energy analysis for SEAI
7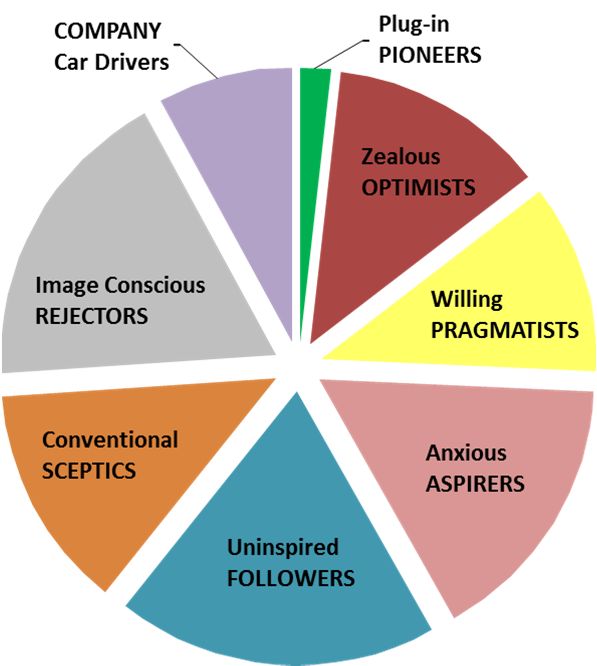
Technical potential for commercial buildings is estimated using the outputs of
the SBEM model based on the data collected in site visits and data from ND-
BER database

 Process                                                           Key aspects of methodology

                                •     Impacts of a variety of energy efficiency measures as identified in the project inception
     Survey statistically             report modelled using EE SBEM model
  representative sample of      •     Detailed results such as savings per archetype, sector, technology and fuel type are
    commercial buildings              available in the model
                                •     See “Energy efficiency measures” slides for the technical assumptions on target values and
                                      suitability factors
  Link survey database with
 detailed ND-BER and NCM
                                    Measures included in the analysis
          databases
                                                     Wall insulation                              More efficient boiler replacement

 Select archetypes for use in                        Roof insulation                              Air source heat pump
 national stock model based         Fabric                                         HVAC
 on coverage of final energy                         Glazing                                      Heating controls

                                                     Draught proofing                             More efficient air conditioning
  Construct national stock
  model using outputs from                           Energy efficient lighting                    Reducing room temperature
                                    Lighting
   Element Energy SBEM
                                                     Lighting control              Behavioural    Turn off lights for extra hours
           model
                                    Appliances       Energy efficient appliances                  Reducing hot water use
 Estimate technical potential
    energy savings using
   outputs from EE SBEM
            model               Source: Element Energy analysis for SEAI

                                                                                                                                      8
Commercial buildings stock

     Commercial building stock (total ~ 109,000)

             ‘000s of Commercial buildings

                        42
           Large         2                  40
                                             3

           Small        40
                                            37          16

                                                        16
                                                                      8
                                                                      1
                                                                                    4
                                                                       6                   1
                                                                               3

                       Office              Retail   Restaurant/    Warehouse       Hotel
                                                    public house

Source: Element Energy analysis for SEAI                                                       9
Baseline energy consumption – Commercial buildings

    Primary energy demand by fuel type in the commercial buildings sector (Total = ~17 TWh)
                                6.2
                              0.2 0.1

            Natural Gas
            Oil                               3.3
                                                         3.2
                                 6.0             0.2                     2.7
            Electricity                    0.4             0.4
                                                       0.6                  0.2
                                                                      0.4
                                                                                         1.5
                                             2.8
                                                         2.1            2.1
                                                                                       0.1 0.0
                                                                                         1.3

                               Retail       Office      Hotel     Restaurant/public   Warehouse
                                                                       house          and storage

    Final energy demand by fuel type in the commercial buildings sector (Total = ~9 TWh)

                                  2.9
                               0.1 0.1

                                             1.7         1.9
            Natural Gas
                                               0.1       0.4            1.5
            Oil                   2.7      0.3                          0.2
                                                         0.6            0.4
            Electricity                                                                   0.8
                                              1.3                                      0.1 0.0
                                                         0.9            0.9
                                                                                          0.6

                                Retail      Office      Hotel     Restaurant/public   Warehouse
                                                                       house          and storage

Source: Element Energy analysis for SEAI                                                            10
Technical potential for public buildings is estimated using the SBEM model
outputs based on the data from ND-BER and DEC databases
Process Key aspects of methodology
• DEC database, which includes data for more than 2,000 public buildings in Ireland, suggests
Estimate total number of energy usage in public buildings dominated by “Offices”, “Education” and “Healthcare”.
public buildings based on • Based on the previous Byrne Ó Cleirigh estimation, there are around 2,000 healthcare
GeoBusiness and literature buildings and the total number of Public buildings is 10,000* in Ireland*.
• This also suggests that there are in total around 8,000 buildings in “Education” and “Public
office” sub-sectors.
Obtain detailed data from
• 8,000 buildings are allocated into “Education” and “Public offices” proportional to their number
DEC, ND-BER and NCM
databases of addresses in the GeoBusiness database (Using GeoBusiness, around 4,500 and 2,400
addresses are identified as “Education” and “Public Office”, respectively. However, the total
number of public buildings could in reality be higher as there might be more than one building
Select archetypes for use in with the same address).
national stock model based • Estimates consistent with previous BOC and SEAI publications*
on coverage of final energy • The fraction of small/large public buildings is based on their fraction in the ND-BER database.
It is estimated that there are more than 3,000 public buildings with floor area above 1,000 m2
in Ireland, which is also consistent with previous SEAI estimates*.
Construct national stock
model using outputs from
Element Energy SBEM Public building Number of public Number of large public Number of small public
sub-sector buildings estimated buildings (>=1000m2) buildings (4,000 buildings) 11
Public office buildings: More than 1,000 justice & defence buildings. OPW manages more than 2,000 public buildings (mainly offices)Technical potential for public buildings is estimated using the SBEM model
outputs based on the data from ND-BER and DEC databases
Process Key aspects of methodology
• ND-BER database and DEC database, which includes data for more than 2,000 public
Estimate total number of buildings in Ireland, filtered and linked using sub-sector, size, HVAC and fuel type
public buildings based on • Detailed activity data gathered by linking the ND-BER with NCM activity database* using
GeoBusiness and literature activity IDs and areas of individual zones for all buildings
Obtain detailed data from
DEC, ND-BER and NCM
databases
Data source Data gathered
Building activity (sub-sector), Size (floor area), HVAC type,
Select archetypes for use in DEC database
Heating fuel
national stock model based
on coverage of final energy Building activity (sub-sector), Size (floor area), HVAC type,
ND-BER database Heating fuel, Wall, window, roof, floor, door U values, Infiltration
rate, Heating seasonal efficiency, Cooling seasonal efficiency
Construct national stock
model using outputs from Peak occupancy density (person/m2), Hot water (l/day/m2),
Element Energy SBEM Illuminance (lux), Display lighting (W/m2), Heating schedules
model (hourly), Cooling set point, Cooling schedules (hourly),
NCM activity database
Occupancy schedules (hourly), Metabolic rate (W/person),
Ventilation requirement (l/sm2), Equipment (W/m2), Equipment
Estimate technical potential schedules (hourly)
energy savings using
outputs from EE SBEM
model Source: Element Energy analysis for SEAI
* National Calculation Methodology (NCM) activity database is available at:
http://www.seai.ie/Your_Building/BER/Non_Domestic_buildings/Download_SBEM_Software/Download_SBEM_Software.html 12Technical potential for public buildings is estimated using the SBEM model
outputs based on the data from ND-BER and DEC databases
Process Key aspects of methodology
• The coverage of large public buildings and small education buildings is high in the DEC
Estimate total number of database; however, small office and healthcare buildings are not well represented.
public buildings based on • ND-BER database is used to develop the archetypes for small office and small healthcare as
GeoBusiness and literature ND-BER has higher coverage for these building categories (see the table below)
• Public buildings in the ND-BER and DEC databases categorised based on sub-sector, size,
HVAC type, heating fuel, wall condition and window condition
Obtain detailed data from
• In order to achieve a reasonable number of archetypes, a limited number of options are
DEC, ND-BER and NCM
databases included for each category (similar to the commercial buildings)
• Overall, 46 public building archetypes are selected based on total final energy covering at
least 80% of final energy for each sub-sector and size.
Select archetypes for use in
national stock model based Coverage in DEC database Database used to develop
on coverage of final energy (based on number of buildings) archetypes
Public building
sub-sector Large public Small public Large public Small public
Construct national stock buildings buildings buildings buildings
model using outputs from (>=1000m2) (=1000m2) (Technical potential for public buildings is estimated using the SBEM model
outputs based on the data from ND-BER and DEC databases
Process Key aspects of methodology
• All the data collected for all of our archetypes are then used as model inputs for Element
Estimate total number of Energy’s SBEM-based energy model. SBEM is a model that provides an analysis of a
public buildings based on building’s energy consumption and is also used for the ND-BER assessments in Ireland.
GeoBusiness and literature • The calculation is based on the building fabric properties, geometry, activity, HVAC system,
lighting systems, space heating, cooling, ventilation, lighting, equipment, hot water and
auxiliary energy demand, solar irradiance and weather data in Ireland, etc. The diagram
Obtain detailed data from below illustrates the calculation process in the model.
DEC, ND-BER and NCM
• EE SBEM model is tested for a number of building types in each sub-sector and model
databases
outputs for baseline consumption are consistent with estimates in ND-BER database.
Select archetypes for use in
national stock model based
on coverage of final energy
Construct national stock
model using outputs from
Element Energy SBEM
model
Estimate technical potential
energy savings using
outputs from EE SBEM
model Source: Element Energy analysis for SEAI
14Technical potential for public buildings is estimated using the SBEM model
outputs based on the data from ND-BER and DEC databases
Process Key aspects of methodology
• Impacts of a variety of energy efficiency measures as identified in the project inception
Estimate total number of report modelled using EE SBEM model
public buildings based on • Detailed results such as savings per archetype, sector, technology and fuel type are
GeoBusiness and literature available in the model
• See “Energy efficiency measures” section for the technical assumptions on target values and
suitability factors
Obtain detailed data from
DEC, ND-BER and NCM
Measures included in the analysis
databases
Wall insulation More efficient boiler replacement
Select archetypes for use in Roof insulation Air source heat pump
national stock model based Fabric HVAC
on coverage of final energy Glazing Heating controls
Draught proofing More efficient air conditioning
Construct national stock
model using outputs from Energy efficient lighting Reducing room temperature
Lighting
Element Energy SBEM
Lighting control Behavioural Turn off lights for extra hours
model
Appliances Energy efficient appliances Reducing hot water use
Estimate technical potential
energy savings using
outputs from EE SBEM
model Source: Element Energy analysis for SEAI
15Public buildings stock
Public building stock (total ~ 13,000)
‘000s of Public buildings
6
1
5
Large 2
5
2
1
Small 3
2
Education Office Healthcare
Source: Element Energy analysis for SEAI 16Baseline energy consumption – Public buildings
Primary energy demand by fuel type in the public buildings sector (Total = ~7 TWh)
2.8
2.3 0.6
2.2 • Total final energy consumption of public
0.3 0.2
Natural Gas 0.5 buildings estimated based on bottom-up
modelling has been calibrated using the
Oil 0.9 0.3 confidential SEAI data submitted by large
Electricity public sector organisations.
2.0
1.4 • Bottom-up estimate of baseline energy
1.1 consumption is consistent with the total primary
energy demand in Energy Demand 2012 and
2013; however, fuel shares are different.
Education Healthcare Office
Final energy demand by fuel type in the public buildings sector (Total = ~4 TWh)
1.6 1.6
0.3 1.3 0.5
0.4
Natural Gas 0.2
0.8
Oil 0.2
Electricity
0.9
0.6
0.5
Education Healthcare Office
Source: Element Energy analysis for SEAI 17Energy efficiency measures for commercial and public buildings (1)
More efficient
Energy Energy Energy
Cavity wall Solid wall Draught boiler
efficient Roof insulation efficient efficient
insulation insulation proofing replacement
glazing lighting appliances
(gas, oil)
Fraction of Seasonal
Equipment
Variable Wall U-value Wall U-value Window U-value Roof U-value Infiltration rate energy efficient efficiency of
(W/m2)
lighting boiler
Reduction in
100% energy
infiltration by 1/3
efficient lighting
or infiltration Depending on
(replace
Target value 0.55 0.35 1.5 0.25 rate of 10 sector (see 92%
incandescent
m3/m2hr , separate slide)
with LED
whichever is
lighting)
larger
Ireland Part L*
Table 5 -
double-glazed, Ireland Part L*
Source for Ireland Part L* Ireland Part L* Element Energy See separate
air filled (low-E, Table 5 for flat Ireland Part L* HARP database
target value Table 5 Table 5 assumption slide
Ân = 0.05, soft roof
coat) 12 mm
gap
“Poor” non- All buildings
cavity walls except buildings
Suitable Gas, oil boilers
“Poor” cavity excluding U value higher with 100% All buildings are
commercial “Poor” windows “Poor” windows with efficiencies
walls curtain wall and than 0.3 W/m2K energy efficient suitable
buildings less than 90%
heritage lighting based
buildings on survey
Suitability is
assumed to be
“Poor” non- 50% for public
Gas, oil boilers
Suitable public “Poor” cavity cavity walls U value higher buildings (based All buildings are
“Poor” windows “Poor” windows with efficiencies
buildings walls (solid and than 0.3 W/m2K on the survey suitable
less than 90%
concrete) average for
commercial
buildings)
Source: Element Energy analysis for SEAI
* Ireland Building Regulations 2011, Technical Guidance Document L, available at:
http://www.environ.ie/en/Publications/DevelopmentandHousing/BuildingStandards/FileDownLoad,27316,en.pdf
18Energy efficiency measures for commercial and public buildings (2)
Heating controls Enable
(room-by-room More Reducing Turn off Reducing standby
Lighting
Heat pump time and efficient air room lights for hot water features on
control
temperature conditioning temperature extra hours use all PCs and
control) monitors
Seasonal
Internal
efficiency of Lighting
Seasonal efficiency of Seasonal efficiency Occupancy temperature Hot water Equipment
Variable air consumption
heat pump of heating system sensing set point for (l/day/m2) (W/m2)
conditioning (W/m2)
heating (ºC)
(SEER)
30%
2.7 for heating (all 22%
reduction in
buildings) reduction in 10% 10%
Target value 3% increase 4.5 1ºC reduction PC and
1.0 for hot water***** lighting reduction reduction
monitor
(small buildings) demand
energy use
AECOM zero Carbon Trust
Element Carbon Trust Element
Source for European Commission SBEM technical LBNL, carbon non- Technology
Energy guidance for Energy
target value guidance* manual** 2012****** domestic Overview
assumption retail**** assumption
buildings*** CTV005
(i) Buildings with both
“poor “walls and “poor”
Buildings with
Suitable windows, (ii) premises
Based on the survey All buildings cooling and All buildings All buildings All buildings All buildings
commercial without roof (iii) heritage
results are suitable SEER less are suitable are suitable are suitable are suitable
buildings buildings and (iv)
than 3.5
buildings with heat
pumps are not suitable
Buildings with
Buildings with both All public buildings
Suitable public All buildings cooling and All buildings All buildings All buildings All buildings
“poor” walls and “poor” are assumed to be
buildings are suitable SEER less are suitable are suitable are suitable are suitable
windows are not suitable suitable
than 3.5
Source: Element Energy analysis for SEAI
* European Commission Guidelines, C(2013) 1082, 2013/114/EU, available at: http://eur-lex.europa.eu/LexUriServ/LexUriServ.do?uri=OJ:L:2013:062:0027:0035:EN:PDF
** SBEM technical manual v3.5.a for SEAI, available at: http://www.seai.ie/Your_Building/BER/Non_Domestic_buildings/Download_SBEM_Software/SBEM%20Technical%20Manual%20V3-
4a%20Oct%202009.pdf
***AECOM, 2011, Zero carbon non-domestic buildings, Phase 3 final report, available at: https://www.gov.uk/government/uploads/system/uploads/attachment_data/file/6329/1940106.pdf
**** Carbon Trust, Retail overview, available at: http://www.carbontrust.com/media/39228/ctv001_retail.pdf
***** AEA, 2012, RHI Phase II – Technology Assumptions
******LBNL, 2012, “Quantifying National Energy Savings Potential of Lighting Controls in Commercial Buildings”
19Savings potential due to upgrade to energy efficient appliances in
commercial and public buildings is included in the analysis
Key aspects of methodology
• Savings potential in appliances considered for all public and commercial buildings
• Efficiency improvements in office equipment and electronics, and in refrigeration considered
• Office equipment and electronics: measures include greater use of standby features for PCs and monitors, 7-day time controls for
printers and photocopiers, use of low-energy printers and high efficiency charging devices for consumer electronics
• Share of appliance energy use in each category estimated per sector using literature sources
Technical assumptions
Appliance category Technical savings potential Source
Office equipment and electronics 33% • “CTV005 Technology Overview: Office equipment”, Carbon Trust
• “Ireland’s Low Carbon Opportunity”, SEI/McKinsey (2009)
Refrigeration 20% • “CTG046 Technology Guide: Refrigeration systems”, Carbon Trust
• “Energy Star Guide for Restaurants: Putting Energy into Profit”, EPA (2012)
Other 0%
Share of final energy Overall
Sector Source
Office equip. Refrigeration Other potential
Office 100% 0% 0% 34% • “CTV005 – Technology Overview: Office equipment”, Carbon Trust
• “CTV007 – Sector Overview: Office-based companies”, Carbon Trust
Retail 24% 23% 53% 13%
• “CTV001 – Sector Overview: Retail”, Carbon Trust
Hotel 20% 18% 62% 10% • “CTV013 – Sector Overview: Hospitality”, Carbon Trust
Restaurant/pub 0% 58% 42% 12% • “Energy Smart Tips for Restaurants”, SEDAC (2011)
• “CTV019 – Sector Overview: Schools”, Carbon Trust
Education 14% 23% 63% 9%
• “CTV024 – Sector Overview: Hospitals”, Carbon Trust
Healthcare (Large) 15% 17% 68% 9% • “CTV025 – Sector Overview: Primary Healthcare”, Carbon Trust
Healthcare (Small) 29% 6% 35% 11%
Source: Element Energy analysis for SEAI 20Contents
Technical energy savings potential
Commercial and Public buildings
Public utilities
Residential buildings
Transport
Industry
Energy efficiency cost curves
Energy efficiency scenarios to 2020
21Technical potential for public utilities estimated by applying a set of
efficiency measures as identified in the SEAI Working Group reports
Process Key aspects of methodology
• Existing number of public lighting and energy demand identified in the SEAI Public Lighting
Overview Report
Derive baseline energy
• Baseline energy consumption in the water services covers pumping and waste water
consumption for public lighting
treatment plants
and water services
• Existing street lighting is assumed to be replaced by LEDs (including central management
Determine energy saving system e.g. dimming and trimming)
potential of a set of measures • Nine energy efficiency measures chosen for water services having immediate, short and
for public lighting and water medium payback times based on SEAI Water Services Overview report
services
• Incremental energy savings potential for public lighting estimated compared to incandescent
(see the slide for street lighting in the “Energy efficiency cost curves” section)
Estimate technical potential • Rules-of-thumb estimations of energy efficiency measures for water services are based on the
energy savings SEAI Working Group reports (see next slide for further information)
Source: Element Energy analysis for SEAI 22Estimations of energy efficiency measures for water services are based
on the SEAI Working Group reports
Water services
Fraction of Typical
Payback
Measures stock suitable energy saving
time*
for measure (single unit)
Higher efficiency pump retrofit 40% 30% Short
Elimination of parasitic loads in pump house 80% 10% N/A
Pumping optimisation
Optimising operation through duty & assist control 20% 15% Immediate
Install Variable Speed Drive (VSD) instead of throttling 20% 15% Short
Retrofit of fine bubble diffused air systems 40% 40% Medium
Elimination of excess air to an appropriate level 75% 15% Immediate
Wastewater treatment
Dissolved oxygen control of aeration systems 20% 25% Medium
plant
Retrofit of blowers with VSD 25% 20% Medium
Retrofit of high efficiency motors in aeration systems 60% 5% Medium
Source: Element Energy analysis for SEAI
* Energy efficiency measures having long payback periods are not included in the analysis 23Contents
Technical energy savings potential
Commercial and Public buildings
Public utilities
Residential buildings
Transport
Industry
Energy efficiency cost curves
Energy efficiency scenarios to 2020
24SEAI Residential model has been reviewed and measures added for
energy-efficient appliances and behaviour change
Process Key aspects of methodology
• Residential model recently upgraded by SEAI and external consultants
• Model estimates technical (and economic) energy savings potential of 12 energy efficiency
Review SEAI Residential measures and several packages of measures across the Irish housing stock
model • As requested by SEAI, model reviewed and initial quality control undertaken
• Baseline appliance energy consumption based on the energy consumption patterns of Irish
households*
Add energy-efficient • Technical savings potential of upgrading current stock of appliances to best-in-class based on
appliances measure UK data (see next slide for further information)
• Energy consumption by end-use category available in the SEAI Residential model
• Technical savings potential of behavioural measures applied to appropriate end-use
Add behavioural categories based on a study for DECC in the UK (see later slide for further information)
measures
• Primary energy consumption of measures and packages derived
Estimate technical potential
energy savings
Source: Element Energy analysis for SEAI
* SERVE Energy Monitoring Project – Report on Implementation and Analysis (Tipperary Rural and Business Development Institute)
25Savings potential due to upgrade to energy efficient appliances in
residential buildings is included in the analysis
Sector and measure Key aspects of methodology
• Fractional savings potential due to upgrading from current appliance stock to best-in-class
Residential appliances derived using UK data
buildings: Efficient • Appliance energy consumption in Ireland based on ESRI data
appliances • Electricity consumption disaggregated by end-use to allow integration with UK data
Technical assumptions
Appliance Appliance Appliance share of Technical savings Source
segment segment potential
Cold Refrigerator 13% 60% • “Household Electricity Survey: A study of domestic electrical product
usage”, Intertek, Final Report Issue 4 for AEA (2012)
Freezer 26% 59% • Haines et al., “How Trends in Appliances Affect Domestic CO2 Emissions:
A Review of Home and Garden Appliances – Technical Annex”. Report
Fridge-freezer 61% 62%
prepared for DECC (2010)
Wet Tumbledrier 33% 22%
Dishwasher 17% 20%
Washer-drier 17% 0%
Washing machine 33% 33%
Consumer TV 32% 88%
electronics
Other 68% 0%
Cooking Electric hob 50% 0%
Electric oven 50% 30%
Parameter Appliance segment Baseline Technical potential Source
Appliance Cold 473 287 • Baseline taken from “Electrical Appliance Ownership and Usage in
consumption Ireland”, Working Paper No. 421, ESRI, 2012
(kWh p.a.) Wet 387 84 • Technical potential calculated using data in above table
Consumer electronics 559 156
Cooking 516 77
Total 1,935 604
Source: Element Energy analysis for SEAI 26Savings potential due to a range of behavioural measures is
included in the analysis
Sector and measure Key aspects of methodology
• Savings potential of six behavioural measures is included
Residential
• Data for the energy consumption across four end-use categories (space heating, hot water,
buildings: lighting, pumps and fans) is available for dwellings in the Residential model provided by SEAI
Behavioural measures • Energy consumption of appliances (including tumble drier) added by Element Energy
• Savings potential of the measures is estimated by applying percentage reductions in the
appropriate end-use category based on a UK study for DECC
Technical assumptions
Behavioural measure End-use Technical potential Additional assumption Source
category reduction in end-use
addressed category (%)
Reduce thermostat by 1ºC Space heating 13% • Cambridge Architectural Research,
"How much energy could be saved by
Delay start of heating from Oct to Nov Space heating 5% making small changes to everyday
household behaviours?“. Report for
Turn off heating in unused rooms Space heating 4% Apartments not suitable
DECC (2012)
Install low-flow shower head Hot water 12% • Haines et al., “How Trends in
Appliances Affect Domestic CO2
Air dry instead of using tumble drier Appliances Varies* Emissions: A Review of Home and
Garden Appliances – Technical Annex”.
Turn of unnecessary lights Lighting 25% Report prepared for DECC (2010)
Source: Element Energy analysis for SEAI
*Average Baseline consumption due to tumble drier 126 kWh per household per annum – reduces to zero with air dry 27Residential buildings stock
Residential stock (total ~ 1,649,000)
‘000s of Dwellings
718
A1-B2
B3-C1
459
C2-C3
D1-D2
E1-E2
280
F
191 G
Detached House Semi-Detached House Terraced House Apartment
Source: Element Energy analysis for SEAI 28Baseline energy consumption – Residential buildings
Primary energy demand by fuel type in the residential sector (Total = ~45 TWh)
22.8
1.8
Natural Gas 8.7
Oil • Total energy consumption of
11.2 residential buildings estimated based
Electricity on bottom-up modelling has been
3.5
7.9 6.5 calibrated to Energy Demand 2012.
Solid 2.1
1.9 4.5
4.8 0.7 0.2 0.6
4.4 3.3 3.6
0.8 0.6 0.1
Detached House Semi-Detached Terraced House Apartment
House
Final energy demand by fuel type in the residential sector (Total = ~31 TWh)
16.8
1.6
7.9
Natural Gas
Oil 7.8
Electricity 3.3 3.2
4.3
Solid 1.9 1.7 2.3 0.5
4.0 2.0 0.6 0.2
1.4 1.5 0.1
0.8 0.5
Detached House Semi-Detached Terraced House Apartment
House
Source: Element Energy analysis for SEAI 29Contents
Technical energy savings potential
Commercial and Public buildings
Public utilities
Residential buildings
Transport
Industry
Energy efficiency cost curves
Energy efficiency scenarios to 2020
30Technical potential for private cars is based on a bottom-up stock
model, developing scenarios using the ECCo powertrain uptake
model, published literature and Element Energy analysis
Process Key aspects of methodology
• Stock, activity and MJ/km disaggregated by powertrain, fuel and segment up to 2020
Construct bottom-up car stock • Final energy in 2008 consistent to within 6% of value in SEAI National Energy Balances1
model disaggregated by
powertrain, fuel and segment
• Effect of policy measures including EU regulation and VRT re-balancing determined in detail
Develop set of scenarios • Potential effect of a range of additional measures, including modal shift to public transport or
incorporating recent policy and walking/cycling, eco-driving and segment shift, quantified in a series of ‘what if?’ scenarios
potential additional measures
• ECCo powertrain uptake model2 includes Willingness to Pay data derived from a
Model uptake of alternative quantitative survey of over 2,700 new car buyers in the UK in 2010
powertrain technologies in • Updated for Ireland for tax policy, grant schemes, EV charging point roll out and fuel prices
each scenario using ECCo
• Model outputs 2010-2013 consistent with real-world EV market shares in Ireland
• Range of academic papers and other published literature used alongside Element Energy
Apply segment and fuel shares analysis
for each scenario using • Market share, stock, activity and MJ/km determined for each vehicle type in each scenario
literature and own analysis
• Technical potential final and primary energy savings derived for each year up to 2020
Estimate technical potential • Individual and cumulative effect of measures can be determined
energy savings
Source: Element Energy analysis for SEAI
1Without calibration of bottom-up parameters; due predominantly to (i) differences in vehicle segmentation used in the Element Energy
model and in the Energy Balances calculation, leading to small discrepancies in average MJ/km and mileage, and (ii) use of different 31
‘real-world’ factors from the literature; 2ECCo model, Element Energy (2013)A bottom-up private car stock model has been developed
Sector Description of methodology
Private cars • Stock, activity and MJ/km disaggregated across nine vehicle types by powertrain, fuel and
segment up to 2020
Petrol ICE 1200 cc
1990 2020
Diesel ICE 1900 cc Historic stock by vintage
Vehicle-km by vintage
Petrol HEV New car MJ/km by vintage
Historic scrappage rates Stock, vehicle-km and
Diesel HEV energy consumption in
various scenarios
Petrol PHEV Future sales
Future vehicle-km scenarios
Future new car MJ/km scenarios
Diesel PHEV
BEV
Transport Omnibus (CSO)
Energy in Transport (SEAI/EPSSU)
Daly et al., Energy Policy (2011)
Element Energy assumptions
Element Energy uptake model
SEAI forecasts
AEA (2012)
Other literature sources
Source: Element Energy analysis for SEAI 32Bottom-up private car stock model is constructed using CSO and
SEAI data
Sector Description of methodology
Private cars • Stock model constructed with base year 2008 using CSO and SEAI/EPSSU data
• 2008 stock disaggregated into the four internal combustion engine (ICE) vehicle types
• First sales of the five further vehicle types (HEVs, PHEVs and BEVs) assumed in 2008
Stock model for private cars
2008 stock by vintage (thousands)
by vintage (millions)
Vehicle-km driven in 2008
200 3.5
Petrol 1200 cc
150 2.5
Diesel 1900 cc 2.0
100
1.5
1.0
50
0.5
0 0.0
Pre-
1990
1991
1992
1993
1994
1995
1996
1997
1998
1999
2000
2001
2002
2003
2004
2005
2006
2007
2008
Pre-
1990
1991
1992
1993
1994
1995
1996
1997
1998
1999
2000
2001
2002
2003
2004
2005
2006
2007
2.8 2008
New car MJ/km by vintage (Test Cycle)
Transport Omnibus Energy in Transport
2.6 2009-2010 (CSO) 2009 (SEAI/EPSSU)
2.4
Stock
2.2
2.0 Vehicle-km
1.8
Extrapolating 2000-2007 trend Data MJ/km
1.6
1990
1991
1992
1993
1994
1995
1996
1997
1998
1999
2000
2001
2002
2003
2004
2005
2006
2007
2008
Element Energy stock model
Source: Element Energy analysis for SEAI
“Transport Omnibus”, CSO (2010); Howley et al., “Energy in Transport”, SEAI/EPSSU (2009); Daly et al., Energy Policy (2011) 33Stock modelling to 2020 based on SEAI projections of car sales and
car stock projections from the HERMES model, with Baseline
activity derived using an econometric analysis
Sector Description of methodology
Private cars • Private car sales to 2020 based on SEAI projections
• Car stock to 2020 derived using historic retirement rates per vehicle type calibrated to be
consistent with the HERMES car stock projection
• Activity (vehicle-km) to 2020 derived using an econometric analysis following the study of
Daly et al.
Private car sales, stock and vehicle-km assumptions
Values
Case Parameter Source
2008 2015 2020
All Private car sales (thousands) 147 90 100 • SEAI projection
Private car stock (millions) 1.92 1.93 2.08 • Historic retirement rates from Hennessy and Tol,
Economic and Social Review (2011)
• Calibrated for consistency with HERMES “Medium
Term Recovery” scenario
All except Private car vehicle-km (billion km) 32.6 29.5 32.4 • Derived using econometric equation following Daly
Modal shift et al., Energy Policy (2011)
• Economic growth assumptions provided by SEAI
(HERMES “Medium Term Recovery” scenario)
• Fuel price assumptions provided by SEAI
(PROMETHEUS scenario)
Source: Element Energy analysis for SEAI 34Underlying reduction in energy intensity of new ICE vehicles is
driven by EU regulation
Sector and measure Description of methodology
Private cars: EU • EU regulation 443/2009 imposes a mandatory emissions target for manufacturers for the new
car fleet in 2015 and 2021 (compliance date recently amended from 2020 to 2021)
regulation
• Ricardo-AEA has developed a database of future vehicle characteristics consistent with this
regulation up to 2020 for mid-segment vehicles
• ‘Pre-2008 trend’ models a continuation of the weak trend of improvement in new car energy
intensity before 2008; ‘EU regulation’ incorporates the Ricardo-AEA pathway up to 2020
• Vehicle efficiencies scaled across engine size segments according to SEAI/EPSSU data
Private car ICE efficiency assumptions
Values
Measure Parameter Segment Case Source
2008 2015 2020
EU regulation New car MJ/km Petrol 1900cc Pre-2008 trend 2.32 2.37 2.40
EU regulation 2.19 1.91 1.68
Petrol HEV All 1.74 1.56 1.37 • AEA (2012)
Diesel HEV All 1.45 1.34 1.22
Petrol PHEV All 1.37 1.20 1.02
Diesel PHEV All 1.18 1.05 0.93
BEV All 0.56 0.53 0.50
Source: Element Energy analysis for SEAI 35Re-balancing of the VRT has led to a strong and enduring shift
towards the purchase of diesel cars
Sector and measure Description of methodology
Private cars: • Re-balancing of the Vehicle Registration Tax (VRT) in July 2008 has already led to a strong
improvement in the average energy efficiency of new vehicles purchased
VRT/AMT re-balancing
• VRT re-balancing led to a clear shift in purchasing from petrol to diesel, strongly
accelerating an existing trend
• No systematic shift in engine size has been observed as a result of the change
• ‘Pre-2008 trend’ models a continuation of the existing trend in ICE market share; ‘VRT/AMT’
models an enduring shift towards the purchase of diesel cars to 2020
ICE petrol and diesel share assumptions
Values
Measure Parameter Segment Case Source
2008 2015 2020
VRT/AMT New ICE vehicle Petrol Pre-2008 trend 70% 58% 49% • CSO data
re-balancing petrol-diesel • Rogan et al., Transportation
share Shift to diesel 65% 25% 25% Research Part A (2011)
Diesel Pre-2008 trend 30% 42% 51% • Leinert et al., Energy Policy (2013)
Shift to diesel 35% 75% 75%
Source: Element Energy analysis for SEAI 36Market share of ICE and ‘alternative fuel’ vehicles up to 2020 has
been derived using Element Energy’s ECCo uptake model
Sector and measure Description of methodology
Private cars: High • ECCo is a consumer choice model developed for Energy Technologies Institute in 2010-11,
AFV support extended and updated for the UK Department for Transport in 2012
• It incorporates the Ricardo-AEA vehicle cost and performance data for a range of vehicles
• Uses consumer preference data from a survey of 2,700 UK new car buyers
• Powertrains included: ICE (conventional, stop-start, pure hybrid) and plug-in hybrid (PHEV,
RE-EV) for both petrol and diesel, and BEV
• Prediction of the market share of each vehicle type is based on a multinomial logit model
Overview of ECCo (Electric Car Consumer Model)
VEHICLE ATTRIBUTES ECONOMICS AND GRID
Cost, range, performance… Energy prices, grid carbon intensity,
total sales.
CONSUMERS POLICY/ INCENTIVES
Attribute preferences Several types of policies can be
Travel and charging patterns CHOICE MODEL programmed
Yearly sales based on combined
attributes and coefficients
INFRASTRUCTURE
Charging points in place, cost
PARC MODULE
Current fleet – includes a scrappage model
OUTPUTS: Vehicle sales, CO2 emissions, electricity use, policy costs…
Source: Element Energy analysis for SEAI 37ECCo has been updated with data on Irish taxation policy, grant
schemes, electric vehicle charging point roll-out and fuel prices
Sector and measure Description of methodology
Private cars: High • ECCo updated extensively with data for the Irish case
AFV support • Updated with battery costs from recent Element Energy analysis
Key input data for ECCo
Key inputs based on Irish data Other key inputs
Policy levers Cost and performance of powertrain technologies
• Vehicle Registration Tax and Annual Motor Tax based on • Detailed database based on dataset compiled by
CO2 emissions Ricardo-AEA up to 20503
• SEAI Electric Vehicle Grant scheme • Battery costs updated for recent Element Energy analysis
• VAT and fuel duty (2012)
Charging infrastructure cost and roll-out Consumer behaviour
• Electric vehicle charging point roll-out in Ireland based on • Quantitative survey of 2,700 new car buyers in the UK
ESB1 data and targets
• Consumer access to off-road parking at home and work
in Ireland2
Fuel prices
• Fossil fuel price projections from SEAI
ECCo CHOICE MODEL
Technology uptake: market share of ICE, hybrid and electric
vehicles
Source: Element Energy analysis for SEAI
1www.esb.ie/electric-cars (accessed 22/01/2014); 2National Travel Survey, CSO (2009); 3AEA (2012) 38Choice model is based on Willingness to Pay data and consumer
preferences derived from a survey of UK consumers
Sector and measure Description of methodology
Private cars: High • Survey found Willingness to Pay for vehicle attributes: price, running costs, electric range,
AFV support acceleration and charging time, as well as ‘symbolic’ factors such as status, novelty and
environmental impact)
• Most consumer segments have a bias against electric vehicles (EVs), particularly pure
battery EVs, citing concerns such as limited range, practicality of re-charging and an
‘embarrassment’ factor
• A small fraction of consumers, ‘Pioneers’ and ‘Optimists’, are willing to pay a premium for a
plug-in EV with the same key attributes as a conventional vehicle
Consumer segmentation for EV market
Willingness to Pay for EV versus conventional vehicle
Require larger discount for Willing to pay larger
EV over conventional vehicle premium for EV
Pioneers
Zealous optimists
Willing pragmatists
Anxious aspirers
Uninspired followers
Conventional sceptics
Image conscious rejecters
Company car drivers
Plug-in hybrid electric vehicle Pure battery electric vehicle
Source: Element Energy analysis for SEAI
Results from “Plug-in Vehicles Economics and Infrastructure” project carried out for Energy Technologies Institute (ETI). Choice
experiment designed and analysed by Element Energy; qualitative survey analysed by University of Aberdeen. 39Effect on uptake of purchase grants and tax exemptions for PHEVs
and BEVs is modelled in ECCo
Sector and measure Description of methodology
Private cars: High • In the ‘Baseline AFV support’ case, effect of the existing SEAI Electric Vehicle Grant for
PHEVs and BEVs is modelled
AFV support
• In the ‘High AFV support’ case, strong support for EVs remains in place up to 2020
• A scenario with no AFV incentive, ‘No AFV support’, is modelled for comparison
Scenarios for EV support
Description
Measure Case Segment
2011-2014 2015-2020
High AFV No AFV support BEV No support No support
PHEV No support No support
Baseline AFV support BEV 20% of purchase price, capped at €10,000* No support
PHEV 22% of purchase price, capped at €7,500* No support
High AFV support BEV 20% of purchase price, capped at €10,000 24% of purchase price, capped at €10,000
PHEV 22% of purchase price, capped at €7,500 25% of purchase price, capped at €7,500
Source: Element Energy analysis for SEAI
* Based on purchase of typical BEV or PHEV costing €49k and €33k respectively in 2013 40Effect on uptake of purchase grants and tax exemptions for PHEVs
and BEVs is modelled in ECCo
Sector and measure Description of methodology
Private cars: High • In the ‘Baseline AFV support’ case, effect of the existing SEAI Electric Vehicle Grant for
PHEVs and BEVs is modelled
AFV support
• In the ‘High AFV support’ case, strong support for EVs remains in place up to 2020
• A scenario with no AFV incentive, ‘No AFV support’, is modelled for comparison
ECCo model outputs: market share for EVs in the various support scenarios
Measure Parameter Segment Case Values Source
2008 2015 2020
High AFV Market share of new PHEV No AFV support 0.0% 0.7% 3.8% • ECCo powertrain uptake model,
vehicles Element Energy (2013)
Baseline AFV support 0.0% 0.7% 3.9%
High AFV support 0.0% 2.1% 9.6%
BEV No AFV support 0.0% 0.0% 0.1%
Baseline AFV support 0.0% 0.0% 0.1%
High AFV support 0.0% 0.2% 0.3%
Source: Element Energy analysis for SEAI 41Potential savings of modal shift from private cars to walking,
cycling and public transport are estimated
Sector and measure Description of methodology
Transport: Modal shift • National Travel Survey (CSO, 2009) used to disaggregate passenger-km by mode, distance
and purpose
• Modal shift from private car to walking and cycling: fraction of all driven/walked/cycled
journeys (all purposes) less than 4 km undertaken by walking increases to 12.5%, and
fraction of all driven/walked/cycled journeys less than 6 km undertaken by cycling increases
to 12.5%
• Modal shift to public transport: decrease in the modal share of private car driving for
commuting (to work and education) from 66% to 55% of journeys by 2020 (corresponding to
achieving half the shift targeted in the “Smarter Travel” policy document)
Scenarios for modal shift
Measure Parameter Case Mode Values Source
2008 2015 2020
Modal shift Modal share of all Baseline Private car driver 64% 64% 64% • “National Travel Survey”, CSO (2009)
journeys • “Smarter Travel: A Sustainable
Walk 15% 15% 15% Transport Future”, Department of
Cycle 1% 1% 1% Transport (2009)
• Element Energy analysis
Public bus 4% 4% 4%
Other 16% 16% 16%
Modal shift* Private car driver 64% 61% 58%
Walk 15% 16% 17%
Cycle 1% 3% 5%
Public bus 4% 4% 4%
Other 16% 15% 15%
Source: Element Energy analysis for SEAI
*N.B. this corresponds to the “Modal shift (Moderate)” option in the accompanying model 42Potential savings of an eco-driving scheme estimated using sources
including real-world data from the Dutch scheme
Sector and measure Description of methodology
Private cars: Eco- • Effect of an Eco-driving scheme modelled through improvements in the ‘Real-World’ (RW)
factor (the correction factor between Test Cycle MJ/km values and the MJ/km typically achieved
driving on the road)
• Base case RW factors for each car segment are taken from AEA/CCC (2012)
• Based on the literature, a reduction of up to 5% in RW factor is possible including the effects of
driving school curricula, re-education of licensed drivers, promotion of fuel-saving in-car devices
(incl. on-board computers, gear shift indicators) and education regarding optimal tyre pressure
• The eco-driving measure here entails a reduction in RW factor of 2%*. We note that this still
entails widespread uptake of eco-driving behaviour.
Eco-driving assumptions
Measure Parameter Segment Case Values Source
(selected examples)
2008 2015 2020
Eco-driving Real-World Petrol 1200-1900cc Baseline 1.20 1.20 1.20 • AEA (2012)
(RW) factor • Wilbers et al., “The Dutch national
Eco-driving 1.20 1.19 1.18 eco-driving programme Het Nieuwe
Rijden: A success story” (2007)
Diesel 1200-1900cc Baseline 1.22 1.22 1.23 • Smokers et al., “Review and analysis
of the reduction potential and costs
Eco-driving 1.22 1.22 1.21
of technological and other measures
BEV Baseline 1.25 1.25 1.25 to reduce CO2-emissions from
passenger cars” (2006)
Eco-driving 1.25 1.24 1.23 • Barkenbus, Energy Policy (2010)
• “Easy on the Gas – The
effectiveness of eco-driving”, RAC
(2012)
Source: Element Energy analysis for SEAI
*N.B. this corresponds to the “Eco-driving (Moderate)” option in the accompanying model 43Potential savings due to a behavioural change involving a shift
towards the use of smaller vehicles is quantified
Sector and measure Description of methodology
Private cars: Shift to • Consider effect of a shift in market share from larger vehicle segments to smaller vehicle
segments (as a behaviour change)
smaller vehicle
• Potential shift based on historical market shares and market shares of proxy countries
segment
Scenarios for segment share of ICE vehicles
Measure Parameter Segment Case Values Source
2008 2015 2020
Shift to smaller Market share of 1900 cc Baseline 19% 20% 20%
Shift to smaller segment 19% 17% 14%
Source: Element Energy analysis for SEAI 44Analysis of savings potential in public and freight transport is based
on an energy intensity model
Sub-sector Key aspects of methodology
Public passenger: buses • High-level analysis combining data from CSO National Travel Survey 2009, CSO Transport
Omnibus, SEAI/EPSSU Energy in Transport and AEA/CCC vehicle database*
• In addition to modal shift, effect of improvement in bus efficiency and of eco-driving
modelled using literature sources
Road freight: HGVs • HGV freight baseline projection of activity and energy based on academic literature** and is
consistent with our economic growth assumptions
• Potential improvement in HGV efficiency based on UK DfT National Transport Model
• Potential effect of a shift to larger weight class HGVs and eco-driving quantified in ‘what
if?’ scenarios
Road freight: LDVs • Particular absence of detailed and reliable data on LDVs
• High-level analysis estimating LDV activity using CSO data and combining with AEA/CCC
data, linking future activity projection to GDP
• Effects of EU regulation for LDV efficiency and of eco-driving are modelled
Source: Element Energy analysis for SEAI
* A review of the efficiency and cost assumptions for road transport vehicles to 2050”, AEA/CCC (2012)
** Whyte et al., Energy 50 (2013)
45Baseline public transport activity derived using CSO and SEAI data
Sector Description of methodology
Public transport • Public transport analysis based on energy intensity model (with activity metric MJ/vehicle-
km), not a stock model as for private cars
• Baseline vehicle-km derived from SEAI/EPSSU and CSO data
• Passenger-km derived from the analysis of the CSO National Travel Survey and private car
sector analysis
• Growth in passenger-km assumed to be small enough in all cases that vehicle-km can be
assumed fixed
Public passenger vehicle-km and passenger-km assumptions
Case Parameter Values Source
2008 2015 2020
Baseline Vehicle-km (million km) 311 311 311 • “Energy in Transport”, SEAI/EPSSU (2009)
• “Transport Omnibus”, CSO (2011)
• Vehicle-km assumed fixed up to 2020
Passenger-km (million km) 2,244 2,460 2,640 • “National Travel Survey”, CSO (2009); passenger-
km based on analysis of NTS such that modal
share is consistent with private car sector analysis
Source: Element Energy analysis for SEAI 46You can also read