Harbor Health Study - Harbor Watch | 2019 - Earthplace
←
→
Page content transcription
If your browser does not render page correctly, please read the page content below

Harbor Health Study

                 Harbor Watch | 2019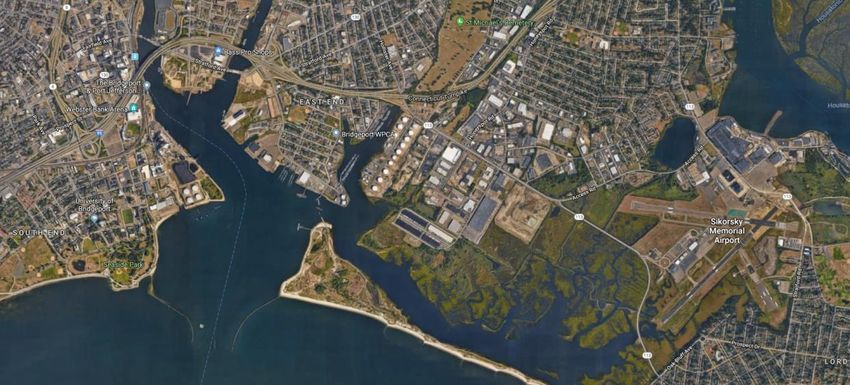
Harbor Health Study: 2019

                              Sarah C. Crosby1
                              Richard B. Harris2
                              Peter J. Fraboni1
                              Devan E. Shulby1
                              Nicole C. Spiller1
                               Kasey E. Tietz1

           1
               Harbor Watch, Earthplace Inc., Westport, CT 06880
                   2
                     Copps Island Oysters, Norwalk, CT 06851

This report includes data on:
Demersal fish study in Norwalk Harbor and dissolved oxygen studies in Stamford
Harbor, Five Mile Harbor, Norwalk Harbor, Saugatuck Harbor, Bridgeport Harbor
(Johnson’s Creek and Lewis Gut sections), and New Haven Harbor (Quinnipiac
River section)

                                          Harbor Health Study 2019, Harbor Watch | 1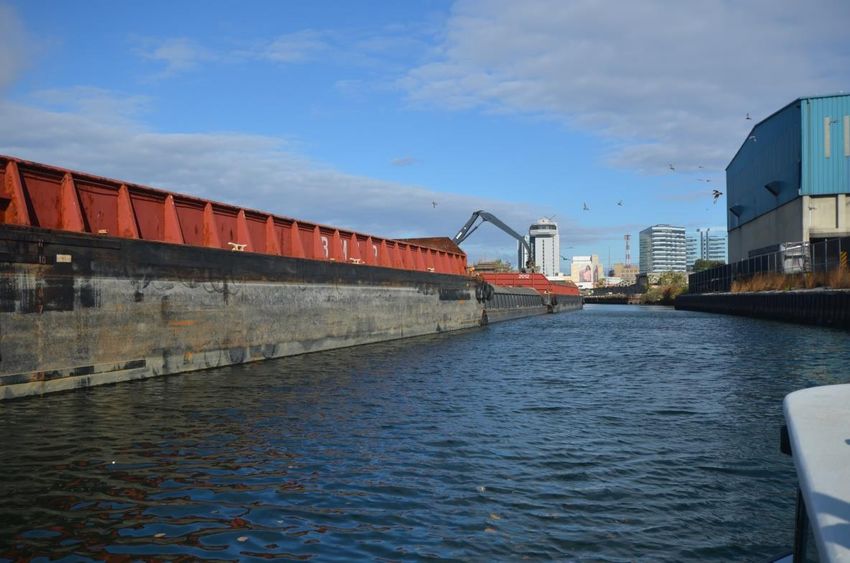
Acknowledgements
The authors would like to thank Sue Steadham and the Wilton High School Marine Biology Club,
Katie Antista, Melissa Arenas, Rachel Bahouth, JP Barce, Maria and Ridgway Barker, Dave Cella,
Helen Cherichetti, Christopher Cirelli, Ashleigh Coltman, Matthew Carrozza, Dalton DiCamillo,
Vivian Ding, Julia Edwards, Alec Esmond, Joe Forleo, Natalia Fortuna, Lily Gardella, Sophie
Gaspel, Cem Geray, Camille Goodman, William Hamson, Miranda Hancock, Eddie Kiev,
Samantha Kortekaas, Alexander Koutsoukos, Lucas Koutsoukos, Corey Matais, Sienna
Matregrano, Liam McAuliffe, Kelsey McClung, Trisha Mhatre, Maya Mhatre, Clayton Nyiri,
“Pogy” Pogany, Rachel Precious, Joe Racz, Sandy Remson, Maddie SanAngelo, Janak Sekaran,
Max Sod, Joshua Springer, Jacob Trock, JP Valotti, Margaret Wise, Liv Woodruff, Bill Wright, and
Aby Yoon, Gino Bottino, Bernard Camarro, Joe DeFranco, Sue Fiebich, Jerry Frank, John Harris,
Rick Keen, Joe Lovas, Dave Pierce, Eric Riznyk, Carol Saar, Emmanuel Salami, Robert Talley, Ezra
Williams . We would also like to extend our gratitude to Norm Bloom and Copps Island Oysters
for their tremendous support, donation of a dock slip and instrumental boating knowledge to
keep our vessel afloat. Support for this research project was provided by Copps Island Oysters,
City of Norwalk, Elizabeth Raymond Ambler Trust, General Reinsurance, Hillard Bloom Shellfish,
King Industries, Long Island Sound Futures Fund, National Fish and Wildlife Foundation, New
Canaan Community Foundation, Norwalk Cove Marina, Norwalk River Watershed Association,
NRG Power – Devon, Palmer’s Grocery, Pramer Oyster Company, Rex Marine Center, and
Outdoor Sports Center. Additional support was provided by the generosity of individual donors.

This report should be cited as:
S.C. Crosby, R.B. Harris, P.J. Fraboni, D.E. Shulby, N.C. Spiller, K.E. Tietz,. 2019. Harbor Health
Study 2019. Harbor Watch, Earthplace, Inc. 1-64p.

                                                       Harbor Health Study 2019, Harbor Watch | 2
Table of Contents
Introduction .................................................................................................................................................. 4
1. Benthic Fish Study ..................................................................................................................................... 5
   Methods .................................................................................................................................................... 6
   Results and Discussion .............................................................................................................................. 8
2. Dissolved Oxygen Surveys ....................................................................................................................... 13
   Methods .................................................................................................................................................. 18
   Results and Discussion ............................................................................................................................ 20
       A. Stamford Harbor ............................................................................................................................. 20
       B. Five Mile River Harbor .................................................................................................................... 27
       C. Norwalk Harbor............................................................................................................................... 33
       D. Saugatuck Harbor ........................................................................................................................... 44
       E. Bridgeport Harbor (Johnson’s Creek and Lewis Gut sections) ........................................................ 51
       F. New Haven Harbor (Quinnipiac River section) ............................................................................... 57
   Citations .................................................................................................................................................. 64

                                                                                      Harbor Health Study 2019, Harbor Watch | 3
Introduction
Harbor Watch is a water quality research and education program based out of Earthplace in
Westport, CT. Our mission is to improve water quality and ecosystem health in Connecticut. In
this report, we present research conducted in 2019 on the fish community in Norwalk Harbor,
Connecticut, as well as water quality conditions in six harbors along the Connecticut coast. The
harbor monitoring effort was led by our partner at Copps Island Oysters, Richard Harris.

Harbor Watch began conducting a dissolved oxygen profile study in Norwalk Harbor in 1986. A
fish study of that harbor was added in 1990 under the guidance of the State of Connecticut’s
Department of Environmental Protection (now known as the Department of Energy and
Environmental Protection) Fisheries Bureau. Since then, the program has grown to include the
study of up to 6 harbors annually for dissolved oxygen conditions and up to 3 harbors for fish.

From May through November 2019, water quality data were collected in six harbors (Stamford,
Five Mile, Norwalk, Saugatuck, Bridgeport Harbor (Johnson’s Creek and Lewis Gut sections), and
New Haven Harbor (Quinnipiac River section), and the fish study was conducted in one harbor
(Norwalk). All six harbors were monitored for dissolved oxygen, salinity, water temperature,
turbidity and chlorophyll a. Dissolved oxygen is important for the survival of estuarine species;
low oxygen or “hypoxic” conditions can impede the use of a harbor as habitat. Water
temperature is another critical ecosystem parameter because many species require specific
temperature ranges for spawning in and inhabiting an area. Turbidity is a measurement of
water clarity, which can indicate sediment loading or water column productivity. Chlorophyll a
measures the presence of phytoplankton and other photosynthetic organisms in the water,
which are important food resources. Finally, fish can be used as an indicator of harbor health
and the harbor’s functionality as a refuge.

                                                   Harbor Health Study 2019, Harbor Watch | 4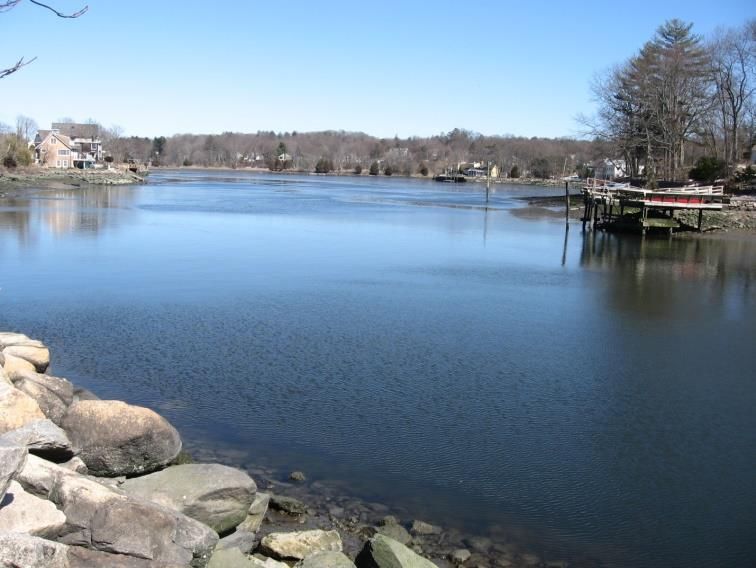
1. Benthic Fish Study
                    Report written by: Nicole C. Spiller and Sarah C. Crosby
                     Harbor Watch, Earthplace Inc., Westport, CT 06880

Norwalk Harbor is an active harbor, used year-round both commercially and recreationally. The
harbor is most recognized for its renowned shellfishing industry, which has risen to national
prominence since beginning in the 1800s. Within the local community, the harbor is also known
for its beaches, dining, boating, and other attractions. Positioned just outside the harbor are
the Norwalk Islands, which help to protect the inner harbor from the effects of extreme
weather events like hurricanes. These islands are part of the Stewart B. McKinney National
Wildlife Refuge and serve valuable and important environmental roles to the harbor (Steadman
et al., 2016).

During Harbor Watch’s 29 years of studying fish in the harbor, there has been a notable
increase in development along the harbor banks. As a result of shoreline hardening, there has
been a reduction in riparian buffer and loss of salt marshes (personal observations, R. Harris).
These factors have potentially contributed to an altered composition of the benthos, from
healthy microalgal populations to a silty bottom, particularly in the upper harbor. A shift in
animal species found in Norwalk Harbor has also been observed. There appears to have been
an increase of Canada geese, osprey, swans, and cormorants (R. Harris, personal observations).
Similarly, Harbor Watch has observed changes in fish diversity since 1990 (Figure 1.4). Estuaries
provide refuge, habitat, and other services to many species. Because of their sensitivity to
environmental conditions, fish can be used as an indicator to assess the health of an estuary. In
Norwalk Harbor, Pseudoplueronectes americanus (winter flounder) is of particular interest
because it is a commercially viable species that uses embayments to spawn. Numbers (catch
per trawl) have declined dramatically for this species during recent years (Crosby et al. 2018c).

Harbor Watch and a dedicated network of volunteers, including the Wilton High School Marine
Biology Club, have been quantifying the abundance and species composition of fish in Norwalk
Harbor, focusing on demersal species. Sampling was conducted from 1990 through 1994.
Trawling was not conducted from 1995-2001, but was resumed in 2002 and has continued
annually since. It should be noted that the inner harbor was dredged in 2006 and the outer
harbor was dredged in 2010 which may have impacted the study (Figure 1.4).

Please see our paper in Estuaries and Coasts for a more in-depth analysis:
Crosby SC, Cantatore NL, Smith LM, Cooper JR, Fraboni PJ, & Harris RB (2018) Three Decades of
Change in Demersal Fish and Water Quality in a Long Island Sound Embayment. Estuaries and
Coasts, 41: 2135–2145.

                                                    Harbor Health Study 2019, Harbor Watch | 5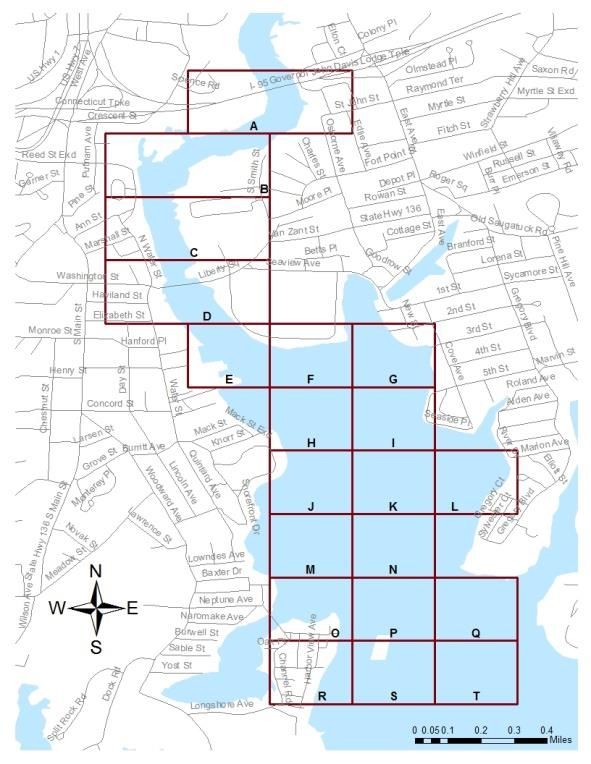
Methods

Trawling was conducted from the R.V. Annie, a 26’ converted oyster scow equipped with a pot
hauler for trawl retrieval. The crew was comprised of 2 Harbor Watch staff members who
served as pilot and deck hand. They were joined by up to 6 additional staff and/or trained
volunteers to assist the deck hand. A grid system that divided the harbor into twenty 300m²
sampling areas (Figure 1.1) was used to identify the location in the harbor where each trawl
was conducted. This grid system was established by the CT DEEP in 1990 when the study
started. During each trawling session, typically a minimum of 3 of those 20 “boxes” were
selected to trawl, one in the upper harbor (box A-F), one in the middle harbor (box G-N), and
one in the outer harbor (box O-T). When the research vessel was positioned within the selected
box, the 1m beam trawl was launched off the starboard stern. The trawl, which was connected
to the boat by approximately 13 meters of line, was equipped with a tapered ¼” mesh net,
tickler chain, and rescue buoy. Each box was trawled for 3 minutes at 3 miles per hour.
Coordinates were recorded where the trawl was launched and where it was retrieved. At the
end of 3 minutes, the trawl was pulled back onto the boat using the pot hauler. The net was
removed from the trawl and emptied into a sorting bin. The catch was recorded by species and
the number of individuals caught. For one particular species of interest, winter flounder
(Pseudopleuronectes americanus), the total length of each individual caught was also recorded
to the nearest millimeter using a ruler. Invertebrates were also identified and counted. All
organisms present in each trawl net were returned to the harbor following identification and
counting.

Over the study’s 29 years, there has been slight variance in data collection due to weather
patterns, fish kills, boat repairs, and occasional requests from the CT DEEP for Harbor Watch to
trawl outside of Norwalk Harbor, which disrupted trawling activity. To standardize the data and
enable comparisons from year to year, data are reported as “catch per trawl” or the total
number of fish caught in a period of time divided by the total number of trawls conducted
during that same time period.

                                                   Harbor Health Study 2019, Harbor Watch | 6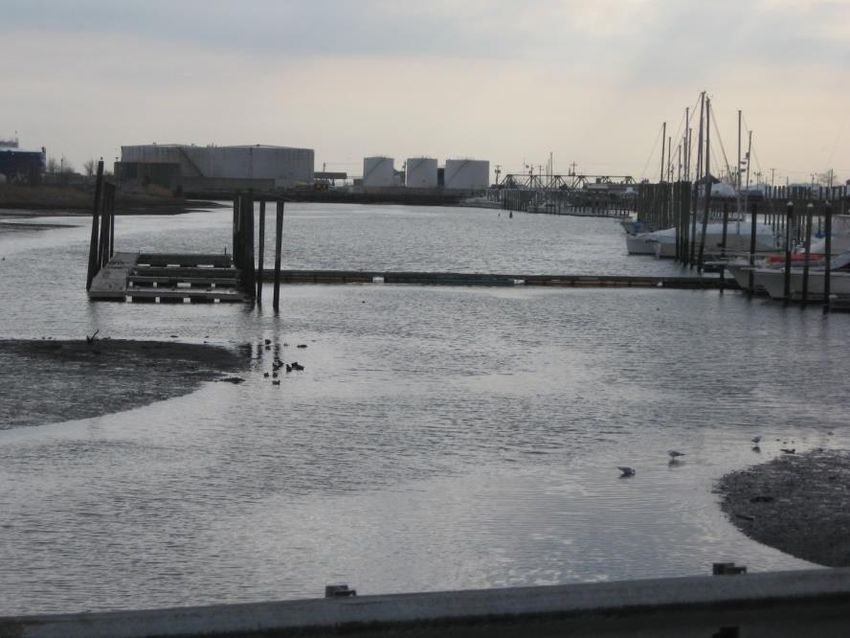
Figure 1.1. Location of trawl sampling areas or “boxes” within Norwalk Harbor.

                                                  Harbor Health Study 2019, Harbor Watch | 7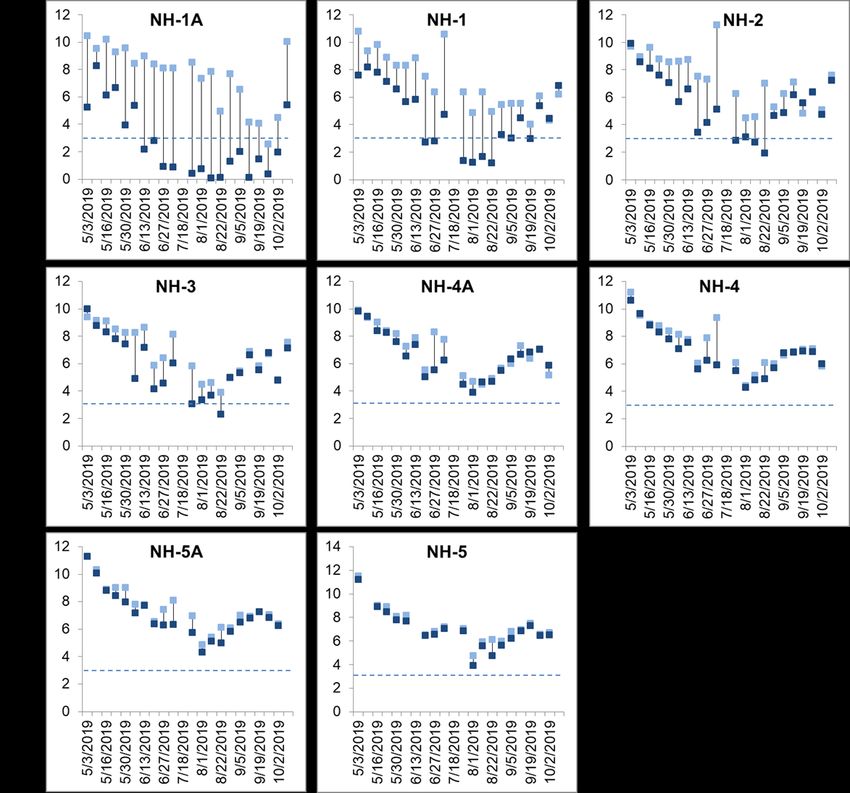
Results and Discussion

Fish
During the 2019 sampling season, 249 individual fish from 17 different species were caught in
Norwalk Harbor. The 3 most abundant species caught in 2019 were northern searobin
(Prionotus carolinus), northern pipefish (Syngnathus fuscus), and porgy (Stenotomus chrysops)
making up 63% of the total number of individuals (Figure 1.2). Fish were observed in 18 of the
19 boxes sampled with no fish observed in box “A”. Box “S” had the greatest number of fish per
trawl during 2019, with 17.33 fish per trawl (total number of individuals over whole season
divided by number of trawls in that box; Figure 1.3). Box “S” was trawled 3 times, with a total of
52 fish caught in the three trawls, and no empty nets (Table 1.1, Figure 1.3). While sampling
was typically conducted in the upper, middle, and outer harbor during each trawling trip, tidal
cycles impeded access to some of the boxes during some sampling sessions as they were
inaccessible during low tide (Table 1.1).

Table 1.1. Total number of trawls per box, June through October 2019
 Box     # Trawls
  A          2
  B          5
  C          2
 C-B         1
  D          1
 D-E         1
  E          4
  F          2
  G          4
  H          5
  I          4
  J          2
  K          5
  L          4
  M          3
  N          6
  O          3
  P          3
  Q          4
  S          3
  T          7
Total       71

                                                    Harbor Health Study 2019, Harbor Watch | 8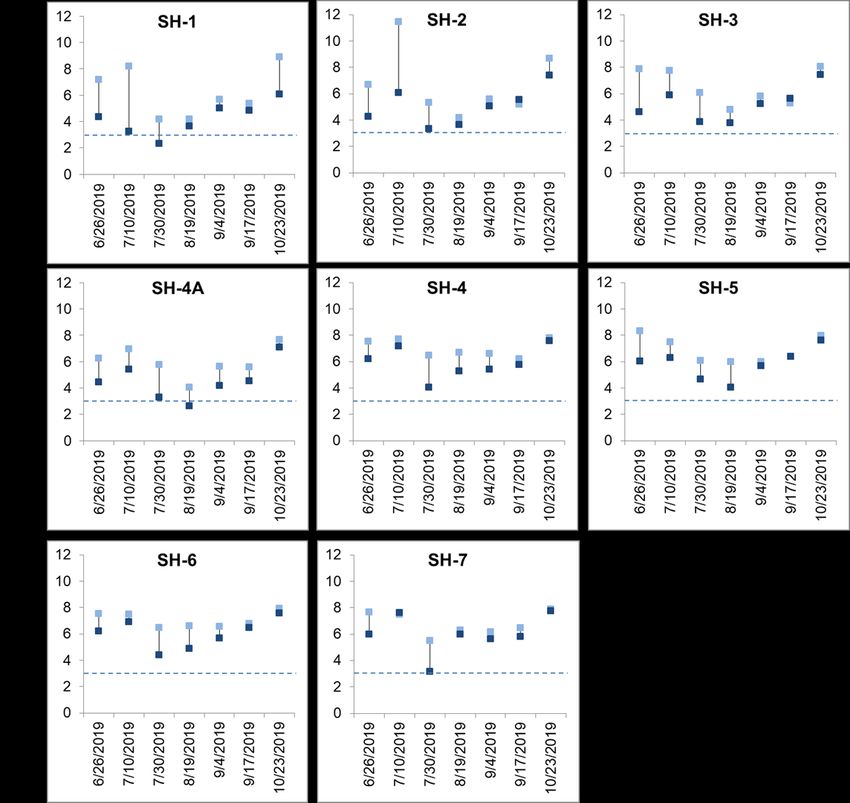
Figure 1.2. Total number of individuals caught for each species observed in Norwalk Harbor,
June through October 2019. *Unknown fish is believed to be a white fish but species could not
be confirmed.

Figure 1.3. Number of trawls with fish or without fish in each “box” in Norwalk Harbor from
June through October 2019.

                                                      Harbor Health Study 2019, Harbor Watch | 9
The overall number of fish per trawl in 2019 was 3.51 fish. This was the highest number of fish
per trawl since 2015 (Table 1.2, Figure 1.4). The Winter Flounder catch per trawl was 0.08 (only
6 individuals were caught), the lowest since 2002 which is likely an artifact of the very few
trawls conducted in 2002. Potential drivers of the apparent overall decline in catch over time
may include increasing water temperatures, low dissolved oxygen values, or predation from
other species inhabiting the estuary (with an observed increase in the number of cormorants;
personal observation R.B. Harris). Additional research is needed to evaluate the contribution of
these and other factors, and this study is expected to continue in 2020.
Figure 1.4. Number of fish caught per trawl (total number of individuals divided by total
number of trawls) of species of interest from 1990 to 2019 in Norwalk Harbor.
Harbor Health Study 2019, Harbor Watch | 10Table 1.2 Catch per trawl for select species of interest from 1990 to 2019 in Norwalk Harbor
Winter Windowpane Northern Northern
Cunner Blackfish Other Total
Flounder Flounder Pipefish Searobin
1990 3.44 0.00 0.14 0.58 0.35 0.30 0.37 5.19
1991 5.38 0.03 0.12 0.48 0.36 0.12 0.33 6.83
1992 11.97 0.05 0.70 0.93 1.47 0.10 0.58 15.80
1993 4.42 0.23 0.07 0.96 0.26 0.01 0.12 6.07
1994 15.14 0.00 0.55 0.76 0.52 0.00 0.62 17.59
2002 0.00 0.00 0.67 0.17 0.17 0.33 0.33 1.67
2003 1.39 0.00 0.09 0.17 1.15 0.02 0.50 3.33
2004 3.05 0.05 0.03 0.03 1.48 0.00 0.34 4.98
2005 5.33 0.00 0.48 0.56 0.85 0.04 1.85 9.13
2006 0.51 0.03 0.12 0.20 0.03 0.00 0.25 1.13
2007 1.78 0.00 0.22 0.39 0.70 0.04 0.52 3.65
2008 0.38 0.02 0.44 0.26 0.10 0.06 0.54 1.80
2009 0.79 0.00 0.03 0.29 0.66 0.00 0.12 1.90
2010 0.41 0.00 0.00 0.16 0.12 0.00 0.07 0.75
2011 0.97 0.00 0.05 0.38 0.18 0.05 0.20 1.84
2012 0.87 0.00 0.13 0.22 0.28 0.03 0.29 1.82
2013 5.37 0.03 0.02 0.16 0.12 0.00 0.35 6.06
2014 0.76 0.05 0.01 0.47 0.32 0.10 0.27 1.97
2015 2.88 0.01 0.03 0.13 2.36 0.03 1.21 6.65
2016 0.32 0.00 0.20 0.33 0.15 0.02 0.44 1.45
2017 0.14 0.01 0.58 0.32 0.34 0.01 0.41 1.82
2018 0.12 0.00 0.36 0.39 0.51 0.04 0.52 1.97
2019 0.08 0.00 0.14 0.73 0.75 0.01 1.79 3.51
Harbor Health Study 2019, Harbor Watch | 11Crustaceans
2,369 individual crustaceans representing 12 species were observed in 2019. The catch was
dominated by shore shrimp, black fingered mud crabs, and long clawed hermit crabs, with
those three species accounting for approximately 79% of the total (Figure 1.5).
Figure 1.5. Total number of crustaceans caught by species in Norwalk Harbor from June
through October 2019.
Harbor Health Study 2019, Harbor Watch | 122. Dissolved Oxygen Surveys
Report written by: Nicole C. Spiller1, Sarah C. Crosby1, and Richard B. Harris2
1
Harbor Watch, Earthplace Inc., Westport, CT 06880
2
Copps Island Oysters, Norwalk, CT 06851
Norwalk Harbor, Saugatuck Harbor, Five Mile Harbor, Stamford Harbor, Bridgeport Harbor
(Johnson’s Creek and Lewis Gut sections), and New Haven Harbor (Quinnipiac River section)
were studied in 2019. These harbors are used year-round for recreational activities such as
boating, swimming, and fishing as well as for commercial activities and play an important role in
the Long Island Sound shellfish industry. In 2019, monitoring of these 6 harbors was led by
Richard Harris (formerly the Director of Harbor Watch, now on staff at Copps Island Oysters),
with assistance from Harbor Watch staff and volunteers.
Dissolved oxygen surveys were conducted to evaluate harbor health and assess their ability to
support marine life and in particular shellfish beds. The parameters measured in this study
included dissolved oxygen, salinity, water temperature, turbidity, and chlorophyll a.
The harbors monitored in this study are estuaries, which are marine embayments with a fresh
water source (resulting in brackish water). The mixing of these freshwater and salt water
sources in many harbors consists of a “tidal wedge” (Figure 2.1), which is comprised of salt
water underlying a freshwater surface layer, which is usually incoming water from a river. The
more dense salt water layer oscillates laterally within the harbor in response to the semidiurnal
tides. Because of this density-driven stratification within estuaries, the bottom water often
becomes depleted of dissolved oxygen when exposed to oxygen demanding (reducing) bottom
sediments and poor flushing. As freshwater moves seaward above the tidal wedge, salt water is
entrained in the freshwater layer, reducing the stratification. This mixing of fresh and salt water
occurs along the length of a harbor, with the salinity of the surface layer increasing as the
distance from the freshwater source increases. Removing salt water from the tidal wedge
(Figure 2.1) causes a net flow of fresh marine water to enter the estuary, bringing nutrients and
oxygen-rich water with it.
Figure 2.1. Sketch of estuary tidal wedge, water flow, and water column mixing.
Harbor Health Study 2019, Harbor Watch | 13Another factor assisting with the flushing of an estuary is the presence of salt marshes. Marshes
provide large expanses of low-lying land that serve as a biological filter for the water flowing
over and through them during flood tides. Ebb tides return this large volume of marine water to
the main harbor channel, where it is then flushed out of the estuary. Unfortunately, all too
often these valuable natural resources are filled in for shoreline development and are replaced
with man-made bulk-heading. Two harbors monitored in this study where large marshes are
present and contribute to flushing efficiency are New Haven Harbor (Quinnipiac River section)
and Lewis Gut. In many harbors throughout New England, the majority of historic salt marshes
have been reduced or lost (Bromberg and Bertness 2005).
Two natural forces that can affect flushing in a harbor are winds and air temperature. Strong
winds, especially from the north, facilitate the movement of the surface layer of water seaward,
and decreases in air temperatures can drive vertical mixing by increasing the density of the
surface water layers causing them to sink. As the surface water sinks, it causes the (often
oxygen-depleted) bottom waters to be forced upward (upwelling and downwelling). This
vertical movement of water can help to increase oxygen concentrations at the bottom.
Rainfall can have negative or positive effects on hypoxia in the harbors. Rain adds water to the
system, which increases the flow and turbulence of the water on the surface which is one way
for rivers and harbors to renew dissolved oxygen in the water column. Rain also increases flow
within a river system which can increase vertical mixing and promote cycling within the tidal
wedge, in turn increasing dissolved oxygen levels. Conversely, rain can be a conduit to flush
nutrients and other pollutants into a waterway via runoff which negatively impacts dissolved
oxygen levels. Excess nutrients (eutrophication) can cause plant growth which will initially add
oxygen to the system, but as the plants begin to die and decompose the available dissolved
oxygen is consumed, raising stress levels for many marine species.
Rainfall totals varied widely along the coast during 2019. The largest amount of rainfall fell
during May (5.35 inches) with the smallest accumulation in September (1.05 inches), based on
the average of data from four rain gauges across the coast (Figure 2.2, Weather Underground
Historical Weather, Norwalk Health Department Raingauge). Rainfall totals were highest in the
Norwalk area, totaling 25.52 inches from May through September (Weather Underground
Historical Weather, Norwalk Health Department Raingauge). Although rainfall in the harbor
area itself is important, rainfall inland can also greatly increase river flow into an estuary.
Harbor Health Study 2019, Harbor Watch | 14Figure 2.2. 2019 monthly rainfall totals for each geographical area monitored. Stamford,
Bridgeport and New Haven precipitation data was collected from Wunderground.com while
Norwalk precipitation data was collected from the Norwalk Health Department rain gauge.
Figure 2.3. May through September rainfall totals from 2016 to 2019 for each geographical area
monitored. Stamford, Bridgeport and New Haven precipitation data were collected from
Wunderground.com, while Norwalk precipitation data were collected from the Norwalk Health
Department rain gauge.
Harbor Health Study 2019, Harbor Watch | 15Observed chlorophyll a concentrations can indicate the quantity of phytoplankton in a marine
environment and are used as a measure of the primary productivity of the system. Many
different environmental conditions affect the volume of phytoplankton present such as
available nutrients, sunlight, temperature, and turbidity. Other influential factors can include
harbor flushing rates, water depth and the number of grazing animals in the water column.
Phytoplankton blooms and seasonal die-off cycles should be considered when conducting a
chlorophyll a assessment of an estuary (Bricker et al., 2003). The chlorophyll a results presented
here should be considered a preliminary assessment only for the period of sampling (May to
September). Additional year-round studies will be needed to fully assess the productivity status
of these 6 harbors using chlorophyll a.
In 2019, Norwalk Harbor had the greatest percentage of observations below 3 mg/L (16%) and
Stamford Harbor had the greatest percentage of observations below 5 mg/L (39%; Figure 2.4).
Norwalk Harbor has a history of poor flushing and extended periods of hypoxia in the upper
reaches of the harbor. Hypoxia (defined as values < 3 mg/L) was not observed in Five Mile
Harbor, Bridgeport Harbor, or New Haven Harbor during this sampling. In recent years,
conditions have varied across the 6 harbors studied. In 2017, 81% of sampling stations had
dissolved oxygen values at the harbor bottom above 3 mg/L (Crosby et al. 2018b). In 2018,
conditions overall had improved, with 93% of the observed dissolved oxygen levels being above
3 mg/L (Crosby et al. 2018c). In 2019, 93% of the observed bottom dissolved oxygen levels were
also above 3mg/L.
In the following pages, a detailed analysis of each harbor will be discussed. Please note that the
duration of the sampling season varied among harbors, such that mean values for the studied
parameters may not be directly comparable among them. In particular, some harbors’ datasets
started later in the summer than others and as a result may have been less likely to capture
oxygen rich and/or low temperature conditions. In addition, some harbors were sampled in
November, while our monitoring season typically ends in October. These temporal differences
should be kept in mind when interpreting the data and when comparing results with past years.
Harbor Health Study 2019, Harbor Watch | 16Figure 2.4. Percentage of sampling days where bottom dissolved oxygen values fell below 5
mg/L in 2019 in the western harbors (top) and the eastern harbors (bottom).
Harbor Health Study 2019, Harbor Watch | 17Methods
Dissolved Oxygen Profiling:
Seasonal monitoring was conducted in each of the six harbors from May through November by
Richard Harris accompanied by Harbor Watch staff, high school and college interns, employees
of Norm Bloom and Son (Copps Island Oysters), and volunteers. Each harbor had five to eight
monitoring stations which were tested a minimum of 6 times. Protocols used in all harbor
surveys followed those in Quality Assurance Project Plan (QAPP) RFA #19102 for Fairfield
County Embayment Profile Surveys approved by the EPA on 8/7/14.
Testing for each harbor was scheduled to begin between 7:00 AM and 8:30 AM on each
monitoring day. A research vessel, staffed with a project leader/captain (usually Richard Harris)
and a crew of at least two trained staff or volunteers proceeded to the northernmost station in
the estuary to begin testing. The dissolved oxygen meter was calibrated at the first station
according to the manufacturer’s recommendation (as in the QAPP). The probe was then
securely attached to a weighted PVC platform which facilitated vertical descent of the probe
into the water column, especially where strong currents existed. The platform was lowered
over the side of the research vessel at each station and readings for dissolved oxygen, salinity,
temperature, and turbidity (when available) were recorded at the surface. Then the platform
was lowered to one half meter below the surface and readings were recorded again. Readings
were then recorded at each full meter interval below the surface until the bottom was reached.
Ancillary data collection included readings for barometric pressure (first and last station only),
wind speed with a Dwyer wind speed gauge, water clarity with a Secchi disk, air temperature
with a Fisherbrand pocket thermometer, and a visual estimate of wave height.
Monitoring was conducted sequentially downstream for all stations until each was profiled. The
calibration was checked on the dissolved oxygen meter at the end of each survey to assure that
significant calibration drift (± 5%) did not occur. Harbor surveys were completed within
approximately 2 hours on each monitoring day. Testing in the outer Norwalk Harbor was
conducted by trained Coast Guard Flotilla 72 volunteers. The Coast Guard Flotilla 72 volunteers
followed the same protocols for data collection, except for the timing of their surveys.
Chlorophyll a Sampling:
Chlorophyll a samples were collected a minimum of 3 times for each harbor over the course of
the monitoring season. On days when samples were collected, two water samples were taken
at each station using a grab sampler for collecting a surface sample, and a 2.2 liter silicone
Kemmerer water sampler for collecting a sample at 2 meters below the surface. All samples
were collected in clean, opaque, one-liter plastic bottles, and stored on ice in a cooler. Upon
returning to shore, water samples were transported to the water quality lab at the Norm Bloom
and Son oyster facility in East Norwalk. Using a graduated cylinder, 50 mL of water from each
sample bottle was poured into a filtration apparatus and vacuumed through a 20 mm glass
filter. The filter was then folded in half, wrapped in aluminum foil, and labeled with harbor
station information and date of collection. Filters were frozen at -20 °C for storage. The filters
Harbor Health Study 2019, Harbor Watch | 18were transported in batches on ice in a cooler to the Harbor Watch laboratory in Westport, CT
where they were analyzed by Nicole Spiller. Filtered samples were processed at the Harbor
Watch Laboratory using a Turner Trilogy fluorometer employing a testing method modified by
Welschmeyer (1994). Results were compared to the estuarine classification system described in
Bricker et al., 2003 (Table 2.1).
Table 2.1. Chlorophyll a surface concentrations and resulting classifications for estuaries (from
Bricker et al., 2003)
Classification Concentration µg/L
Hyper-eutrophic > 60 µg/L
High (eutrophic) > 20 µg/L, ≤ 60 µg/L
Medium (eutrophic) > 5 µg/L, ≤ 20 µg/L
Low (eutrophic) > 0 µg/L, ≤ 5 µg/L
Rainfall:
Rainfall data were collected at individual rain stations and reported online. Rainfall for Norwalk,
Saugatuck, and Five Mile River Harbors was assessed using the Norwalk Health Department
website (Norwalk Health Department Raingauge). Stamford, Bridgeport, and New Haven rainfall
was taken from the Weather Underground website (Weather Underground Historical Weather).
Harbor Health Study 2019, Harbor Watch | 19Results and Discussion
A. Stamford Harbor
Stamford Harbor is a large estuary with two freshwater sources. The harbor has two main
channels, the east branch and the west branch. The west branch receives the freshwater
discharge of the Rippowam River, whereas the east branch receives approximately 24 million
gallons per day in discharge of treated effluent from the Stamford waste water treatment plant
(City of Stamford Website: “The Plant”). With the exception of differences in freshwater input,
both east and west branches are very similar regarding anthropogenic use of the shoreline.
Both channels are devoid of natural riparian features, which have long since been replaced by
shoreline fill and commercial bulk-heading that has been punctuated with storm drain outfalls.
Commercial sand and gravel and industrial facilities are located near the northern ends on both
branches (Figure 2.A.1). Industrial uses require barge deliveries and tug boat traffic can be
heavy at times in these restricted waterways. Extra barges are usually anchored near the
harbor breakwater to the south. Down both branches and below the industrial sections, there is
a dramatic change in land use. The west branch has marinas on both shorelines while the east
branch has marinas on its east bank with Koscuiszko Park on the opposite shore.
Figure 2.A.1. Industrial development and barge traffic on the east branch of Stamford Harbor.
Harbor Health Study 2019, Harbor Watch | 20Figure 2.A.2. Map of Stamford Harbor sampling stations for 2019. Colored dots represent the %
of sampling events with bottom dissolved oxygen levels less than 5 mg/L.
Table 2.A.1. Coordinates and descriptions for each sampling station in Stamford Harbor
Site Name Latitude Longitude Description
SH-1 41.041283 -73.545000 Off Sand and Gravel Facility
SH-2 41.037817 -73.543833 Nun Buoy #10
SH-3 41.034350 -73.543083 Can Buoy #7
SH-4 41.029150 -73.538400 Can Buoy #1
SH-4A 41.040500 -73.530850 East branch off Woodland Cemetery
SH-5 41.026100 -73.537550 Can Buoy #9
SH-6 41.022183 -73.537450 Can Buoy #7
SH-7 41.013600 -73.537650 No Wake Buoy
Harbor Health Study 2019, Harbor Watch | 21Dissolved Oxygen
Profiles of the water column were taken at 8 sites along the length of the Harbor (Figure 2.A.2,
Table 2.A.1). Sampling occurred on 7 days during the monitoring season from late June through
October. Mean dissolved oxygen values in Stamford Harbor ranged from a minimum of 4.22
mg/L on the bottom at SH-1 to a mean dissolved oxygen of 7.04 mg/L on the surface at SH-6
(Figure 2.A.3). There were wider differences observed between the surface and bottom
dissolved oxygen levels in the upper end of the west channel than the east channel and lower
half of the harbor (Figure 2.A.3). Over the course of the monitoring season, there was a
seasonal downward trend in dissolved oxygen values at both the surface and the bottom as the
summer progressed, but a recovery of dissolved oxygen levels began in late August with the
seasonal cooling for surface waters (Figure 2.A.4). Thirty-nine percent of the bottom dissolved
oxygen concentrations observed were less than 5 mg/L, and 4% were less than 3 mg/L
(hypoxic).
Figure 2.A.3. Mean dissolved oxygen concentrations at the surface and bottom at each
sampling station in Stamford Harbor in 2019. Error bars represent standard error.
Harbor Health Study 2019, Harbor Watch | 22Figure 2.A.4. Surface and bottom dissolved oxygen values at each Stamford Harbor sampling
station on each monitoring date during the 2019 season. Light blue squares represent surface
dissolved oxygen values and dark blue squares represent bottom dissolved oxygen values. The
dotted line represents hypoxic conditions (3 mg/L).
Harbor Health Study 2019, Harbor Watch | 23Chlorophyll a
Chlorophyll a samples were taken on 3 of the 7 Stamford Harbor sampling dates; 6/19, 7/30,
and 9/17/2019 (Figure 2.A.5). While the harbor was classified in the medium or highly
eutrophic range in 2017, the concentrations observed in 2018 were generally much lower
allowing for a medium eutrophic classification (Table 2.1). In 2019, average chlorophyll a
concentrations placed Stamford Harbor in the medium eutrophic range (Figure 2.A.5).
Figure 2.A.5. Surface and 2m below the surface chlorophyll a values in Stamford Harbor in
2019. Light green bars represent surface samples and dark green bars represent samples
collected at 2m below the surface.
Harbor Health Study 2019, Harbor Watch | 24Rippowam River Discharge
The figures below illustrate discharge in cubic feet per second recorded at the United States
Geological Survey (USGS) monitoring station on the Rippowam River in Stamford, CT. Yellow
triangles represent the daily median value over the last 21 years, and the blue line represents
the recorded discharge for a particular date in either 2018 (top) or 2019 (bottom). In the
summer of 2019, discharge was observed to be lower than was observed in 2018 and closer to
historic norms.
Figure 2.A.7. USGS flow data in ft3/s for the period of May 1 through October 31 2018 (top) and
2019 (bottom) for the Rippowam River near Stamford, CT (Graphs courtesy of the U.S.
Geological Survey). Please note the difference in scale on the x-axis.
Harbor Health Study 2019, Harbor Watch | 25Temperature and Salinity
Temperature differences observed between the surface and the bottom in the more inland,
shallower water in Stamford Harbor were typically not as pronounced as temperature
differences observed in deeper water at the mouth of the harbor (Figure 2.A.8). Reasons for
this anomaly are unknown. Lower surface salinity at the stations SH-1 and SH-4A likely reflects
seasonal riverine and stormwater inputs to the upper reaches of the harbor for the west branch
(Figure 2.A.9). A constant flow of treated sewage effluent, estimated at 24 million gallons per
day, is a significant fresh water source for the east branch.
Figure 2.A.8. Mean water temperature at the surface and bottom at each sampling station in
Stamford Harbor in 2019. Error bars represent standard error.
Figure 2.A.9. Mean salinity at the surface and bottom at each sampling station in Stamford
Harbor in 2019. Error bars represent standard error.
Harbor Health Study 2019, Harbor Watch | 26B. Five Mile River Harbor
Five Mile River Harbor forms the border between the City of Norwalk and the Town of Darien. It
is approximately 2 miles long, and is supplied with fresh water from the Five Mile River with
headwaters north of New Canaan, Connecticut. An additional source of fresh water to the
estuary is Indian Creek, located on the east side of the harbor just north of station FMRH-5
(Figure 2.B.1). Very little salt marsh remains, most of which is located in the Tokeneke cut
between stations FMRH-2 and FMRH-1. Land use along the shoreline of the harbor consists
primarily of marinas and residential areas on the Norwalk side with large residential areas
occupying the Darien side. The east side of the channel has been dredged by the U.S. Coast
Guard for slips and moorings up to station FMRH-5, while the west side of the estuary remains
too shallow to accommodate most vessels at low tide.
Figure 2.B.1. Map of Five Mile River Harbor
sampling stations. Colored dots represent the %
of sampling events with bottom dissolved
oxygen levels less than 5 mg/L in 2019.
Table 2.B.1. Coordinates and descriptions for each sampling station in Five Mile River Harbor
Site Name Latitude Longitude Description
FMRH-1 41.056250 -73.445767 Buoy 4
FMRH-2 41.061317 -73.446250 Buoy 6
FMRH-3 41.064967 -73.445317 Five Mile River Works
FMRH-4 41.067233 -73.444733 DownUnder Kayaking dock
FMRH-5 41.069333 -73.444550 Mouth of Indian Creek
Harbor Health Study 2019, Harbor Watch | 27Dissolved Oxygen
Profiles of the water column were taken at 5 sites along the length of the harbor (Figure 2.B.1,
Table 2.B.1) on 9 days during the monitoring season from May through November. Station
FMRH-5, the site furthest inland, had the lowest observed mean bottom level. This may have
resulted from the bottom waters at FMRH-5 being in proximity to the oxygen reducing
sediments along the length of the harbor for the longest duration as the waters of the tidal
wedge slowly moved toward station FMRH-5 under the frictional drag of seagoing river water.
Dissolved oxygen replenishment at the surface may have been limited by density-driven
stratification from the overlying layer of brackish water (resulting from the riverine flow) as well
as a decrease in mixing (including wind- and wave-generated turbulence) as the harbor
becomes narrower further inland (Figure 2.B.1). During the 2019 season, mean bottom
dissolved oxygen values increased downstream from 5.70 mg/L at station FMRH-5 to 6.62 mg/L
at station FMRH-1 (Figure 2.B.2). Mean surface dissolved oxygen at stations FMRH-5 and FMRH-
1 were 6.84 mg/L and 7.51 mg/L respectively (Figure 2.B.2). Dissolved oxygen concentrations
generally decreased from May through early August, after which there was evidence of a
recovery continuing into the fall (Figure 2.B.3). The highest concentration of dissolved oxygen
observed was 10.14 mg/L at the surface at station FMRH-3 and the lowest observed was 3.54
mg/L at the bottom at station FMRH-5. Twenty-seven percent of the bottom dissolved oxygen
observations were less than 5 mg/L, but no observations fell below 3 mg/L.
Figure 2.B.2. Mean dissolved oxygen concentrations at the surface and bottom at each
sampling station in Five Mile River Harbor in 2019. Error bars represent standard error.
Harbor Health Study 2019, Harbor Watch | 28Figure 2.B.3. Surface and bottom dissolved oxygen values at each Five Mile River Harbor
sampling station on each monitoring date during the 2019 season. Light blue squares represent
surface dissolved oxygen values and dark blue squares represent bottom dissolved oxygen
values. The dotted line represents hypoxic conditions (3 mg/L).
Harbor Health Study 2019, Harbor Watch | 29Chlorophyll a
Chlorophyll a samples were taken on 6 of the 9 sampling days in Five Mile River Harbor; 5/22,
6/7, 6/18, 6/28, 7/9, and 7/29/2019. All monitoring stations had chlorophyll a concentrations
within the medium euphotic range (> 5 µg/L, ≤ 20 µg/L; Figure 2.B.4, Table 2.1). These results
were similar to those observed during the 2018 study (Crosby et al. 2018c).
Figure 2.B.4. Surface and 2m below the surface chlorophyll a values in Five Mile River Harbor in
2019. Light green bars represent surface samples and dark green bars represent samples
collected at 2m below the surface.
Harbor Health Study 2019, Harbor Watch | 30Five Mile River Discharge
The figures below illustrate discharge rates recorded at the United States Geological Survey
monitoring station on the Five Mile River in New Canaan, CT. Yellow triangles represent the
daily median value over the last 19 years, and the blue line represents the recorded discharge
for a particular date. In 2019, discharge closely matched the daily median value with more
frequent, but small events that increased discharge above what was observed in 2018. Unlike
2019, several major storm events with heavy discharge rates were observed in August and
September 2018 which exceeded 2019 discharge almost ten-fold.
Figure 2.B.5. USGS flow data in ft3/s for the period of May 1 through October 31 2018 (top) and
2019 (bottom), respectively for the Five Mile River in New Canaan, CT (Graph courtesy of the
U.S. Geological Survey). Please note the difference in scale on the x-axis.
Harbor Health Study 2019, Harbor Watch | 31Temperature and Salinity
Average water temperature in Five Mile River Harbor differed between the surface and bottom
from a minimum of 0.63°C at station FMRH-2 to a maximum 0.93°C at station FMRH-5, though
on average the water at the harbor bottom was cooler at all sites (Figure 2.B.6). Lower salinity
observed at the surface in the landward end of the estuary reflects the impact of riverine input
from the north, where the harbor is less well mixed (Figure 2.B.7).
Figure 2.B.6. Mean water temperature at the surface and bottom at each sampling station in
Five Mile River Harbor in 2019. Error bars represent standard error.
Figure 2.B.7. Mean salinity at the surface and bottom at each sampling station in Five Mile
River Harbor in 2019. Error bars represent standard error.
Harbor Health Study 2019, Harbor Watch | 32C. Norwalk Harbor
Norwalk Harbor, located in Norwalk, CT, is fed with freshwater from the Norwalk River. The
harbor once had extensive acres of wetlands on both shorelines (Figure 2.C.1) which have now
been filled in or removed and replaced with hardened shoreline to accommodate the many
industrial and commercial businesses located along the shores. Land use around the edges of
the harbor includes landfills, marinas, and housing developments ranging from high density
apartments to single-family homes. Two sections of the harbor will be discussed in this section
of the report. The inner harbor, which includes the length of the estuary from Wall Street to the
Norwalk Islands, has 8 monitoring stations (Figure 2.C.2). The outer harbor has 8 additional
monitoring stations that covered the area from just outside the mouth of Five Mile River
Harbor east along the apron of Norwalk Harbor to a point just south of the Norwalk Islands off
of Westport. The latter was monitored by volunteers from USCG Flotilla 72. This expanse of
water is considered prime oyster grounds (R. Harris, personal observation).
Figure 2.C.1. Norwalk Harbor estuary in 1847. Extensive wetlands once dominated both
shorelines. Image credit: Norwalk Historical Society.
Harbor Health Study 2019, Harbor Watch | 33Figure 2.C.2. Map of Norwalk Harbor sampling stations in the inner harbor for 2019. Colored
dots represent the % of sampling events with bottom dissolved oxygen levels less than 5 mg/L.
Table 2.C.1. Coordinates and descriptions for each sampling station in Norwalk Harbor
Site Name Latitude Longitude Description
NH-1A 41.117389 -73.411056 Wall Street
NH-1 41.108000 -73.411167 I-95 Bridge
NH-2 41.102056 -73.416000 Maritime Aquarium dock
NH-3 41.098472 -73.414194 Public boat launch
NH-4A 41.093861 -73.410028 Ischoda Yacht Club moorings
NH-4 41.087278 -73.404250 Buoy 19
NH-5A 41.079402 -73.400727 Buoy 15
NH-5 41.069611 -73.397472 Oyster stakes off Shae Island
Buoy G11 41.0728 -73.396617 Buoy G11
Buoy R8 41.07665 -73.38115 Buoy R8
Buoy G5 41.075233 -73.364867 Buoy G5
Buoy R24 41.075733 -73.33065 Buoy R24
Norwalk Channel Buoy G3 41.058583 -73.419433 Norwalk Channel Buoy G3
Sheffield Harbor 41.04875 -73.420217 Sheffield Harbor
FMR Buoy G3 41.046667 -73.434083 FMR Buoy G3
FMR Buoy G1 41.051083 -73.449417 FMR Buoy G1
Harbor Health Study 2019, Harbor Watch | 34Inner Harbor Dissolved Oxygen
Profiles were taken in the inner harbor at 8 sampling stations. Sampling occurred 21 times
between May and October 2019. Mean dissolved oxygen concentrations ranged from a
minimum of 2.67 mg/L at the bottom to a maximum 7.57 mg/L at the surface at station NH-1A
(Figure 2.C.3). Station NH-1A also had the widest range between surface and bottom mean
dissolved oxygen concentrations in Norwalk Harbor. Thirty-five percent of the bottom dissolved
oxygen observations were less than 5 mg/L, while 16% were less than 3 mg/L.
Wide ranges in dissolved oxygen concentrations at the surface and bottom were observed in
most of the upstream sampling locations (Figure 2.C.3, Figure 2.C.4). In the sampling locations
further seaward in the harbor, the differences in dissolved oxygen concentrations were lower,
presumably from the wider area of the harbor and increased mixing reducing stratification. The
upper 3 stations, NH-1A, NH-1 and NH-2 likely had a highly stratified water column throughout
the season driven by a steadily increasing flow of fresh water entering the harbor from the
Norwalk River (Figure 2.C.3, Figure 2.C.9, Figure 2.C.11). This stratification led to station NH-1A
consistently being the site with the most impaired water in the harbor for dissolved oxygen. A
large difference between surface and bottom dissolved oxygen readings on 7/11 at stations NH-
1 and NH-2 and the higher surface readings than were observed on other adjacent sampling
dates may have been due to a phytoplankton bloom (Figure 2.C.4; R. Harris, personal
observation).
The toe of the tidal wedge at the bottom of station NH-1A represents marine water that spends
the longest time in the estuary and is oxygen depleted due to biotic processes occurring in and
near the bottom sediments. As the fresh water flowing along the surface from the Norwalk
River moves seaward, the mixing increases, in particular near station NH-2 with 18 million
gallons per day of treated effluent being discharged from the Norwalk waste water treatment
plant (Figure 2.C.2, Norwalk WPCA Website).
The 3 upper harbor sites have historically experienced prolonged periods of hypoxia because
they have limited flushing and are often exposed to a variety of inputs from storm drain
networks and anthropogenic waste on the harbor bottom. The stations south of NH-4A exhibit
less stratification as the fresh water becomes more brackish and better flushed by the tides.
Typically, dissolved oxygen concentrations tend to decrease when air temperatures rise as the
summer progresses, as observed in 2019 when July’s temperatures hit new records (Figure
2.C.4; Northeast Regional Climate Center). There was a slight recovery in dissolved oxygen
concentrations mid-August, but some stations did observe a second smaller drop-off towards
the end of September into October.
Harbor Health Study 2019, Harbor Watch | 35Figure 2.C.3. Mean dissolved oxygen concentrations at the surface and bottom at each
sampling station in Norwalk Harbor during 2019. Error bars represent standard error.
Harbor Health Study 2019, Harbor Watch | 36Figure 2.C.4. Surface and bottom dissolved oxygen values at each Norwalk Harbor sampling
station on each monitoring date during the 2019 season. Light blue squares represent surface
dissolved oxygen values and dark blue squares represent bottom dissolved oxygen values. The
dotted line represents hypoxic conditions (3 mg/L).
Harbor Health Study 2019, Harbor Watch | 37Outer Harbor Dissolved Oxygen
Profiles in the outer harbor were conducted at sampling locations by Coast Guard Flotilla 72
members. Dissolved oxygen levels observed in this area can be indicative of whether dissolved
oxygen-impaired water may be entering the harbor from the east or west between the Norwalk
Islands and the mainland. It is important to note that the data collected for the outer harbor
sites was collected in the evenings rather than the early morning, so the two Norwalk Harbor
datasets are not directly comparable.
The observed dissolved oxygen data collected as a result of this partnership with Flotilla 72 is
presented in context of the last 12 years. Unfortunately, the dissolved oxygen conditions in the
outer harbor stations have worsened. The mean across the stations of the minimum dissolved
oxygen level (i.e., the lowest reading observed on a given monitoring day) has declined (Figure
2.C.5). Also, the percentage of all readings with concentrations below 5 mg/L has steadily risen
since 2009 (Figure 2.C.6). Finally, the mean of the dissolved oxygen levels within a given year
has also slowly declined (Figure 2.C.7). These trends are consistent with those observed in the
inner harbor over the past 30 years (Crosby et al. 2018a) and are likely indicative of the
combined effects of warming temperatures and eutrophication.
Figure 2.C.5 (Left). Mean of the minimum dissolved oxygen levels observed at all of the 8 outer
harbor sites. Error bars represent standard error. Figure 2.C.6 (Right). Percentage of all
readings across all outer harbor sites in a given year that fell below a dissolved oxygen
concentration of 5 mg/L.
Harbor Health Study 2019, Harbor Watch | 38Figure 2.C.7. Mean of the mean dissolved oxygen level observed at all outer harbor sites.
Harbor Health Study 2019, Harbor Watch | 39Chlorophyll a
Water samples for chlorophyll a monitoring were collected during 7 of the 21 monitoring
events in Norwalk Harbor; 5/3, 5/16, 6/13, 6/27, 7/23, 8/1, and 8/29/2019. Average chlorophyll
a in the harbor during the 2019 sampling season classified the harbor as medium eutrophic
(Table 2.1). Individual stations, NH-1A, NH-2, NH-3, NH-4, did have observed chlorophyll a
values on one date above 20µg/L putting them in the high eutrophic category. These higher
values were observed on different dates for each site and some were observed at the surface
while others were observed at 2m below the surface. Similar results were observed in 2018
with the majority of the harbor classified as medium eutrophic with station NH-3 falling in the
high eutrophic category (Table 2.1, Crosby et al. 2018c).
Figure 2.C.8. Surface and 2m below the surface chlorophyll a values in Norwalk Harbor in 2019.
Light green bars represent surface samples and dark green bars represent samples collected at
2m below the surface.
Harbor Health Study 2019, Harbor Watch | 40Norwalk River Discharge
The figures below illustrate discharge in cubic feet per second recorded at the United States
Geological Survey monitoring station on the Norwalk River in South Wilton, CT. Yellow triangles
represent the daily median value over the last 56 years, and the blue line represents the
recorded discharge for a particular date. Noticeable differences between discharge in 2018 and
2019 were that there were many high flow, large volume rainfall events in 2018 that did not
occur in 2019 (Figure 2.C.9).
Figure 2.C.9. USGS flow data in ft3/s for the period of May 1 through October 31 2018 (top) and
2019 (bottom), respectively for the Norwalk River in South Wilton, CT (Graph courtesy of the
U.S. Geological Survey). Please note the difference in scale on the x-axis.
Harbor Health Study 2019, Harbor Watch | 41Temperature and Salinity
On average, water temperature in the inner Norwalk Harbor station was cooler at the bottom
than the surface (Figure 2.C.10). The exceptions are stations NH-1A and NH-1, where bottom
temperatures were 1.02°C and 0.23°C higher than surface temperatures respectively. Salinity
was lower at the surface than the bottom in the inner harbor stations, reflecting the impact of
the riverine inputs from the north where the harbor is less well mixed (Figure 2.C.10, Figure
2.C.11). This salinity stratification was more pronounced in Norwalk Harbor than the other
harbors studied.
Figure 2.C.10. Mean water temperature at the surface and bottom at each sampling station in
Norwalk Harbor in 2019. Error bars represent standard error.
Figure 2.C.11. Mean salinity at the surface and bottom at each sampling station in Norwalk
Harbor in 2019. Error bars represent standard error.
Harbor Health Study 2019, Harbor Watch | 42Turbidity
Turbidity readings were collected throughout the water column in Norwalk Harbor during 16 of
the 21 monitoring days for the first time in 2019. There were no observed trends in turbidity
during the monitoring season. Average turbidity readings varied from station to station along
the length of the harbor with the average maximum turbidity of 13.58 NTU at the surface at
station NH-4 and the average minimum turbidity of 1.75 at the surface at station NH-1A (Figure
2.C.12).
Figure 2.C.12. Mean turbidity at the surface and bottom at each sampling station in Norwalk
Harbor in 2019. Error bars represent standard error.
Harbor Health Study 2019, Harbor Watch | 43D. Saugatuck Harbor
Fed by the Saugatuck River, Saugatuck Harbor is approximately three miles long and relatively
narrow with the exception of two basins. The first of these is a large basin located just to the
north of station SR-6 (Figure 2.D.1, Figure 2.D.2). The second smaller basin is located just to the
north of station SR-4 (Figure 2.D.2). The combined effect of these basins on ebb tide provides a
strong flushing current for the estuary. The estuary then broadens into a wide but shallow
harbor just to the south of station SR-3 (Figure 2.D.2). The land area on both sides of the upper
estuary and the main harbor is almost fully developed. The commercial area of the Town of
Westport borders the northeastern side of the harbor above the Route 1 bridge. From this
point moving southward the east bank of the harbor is developed with single-family homes that
continue to the Longshore Country Club area and to the Compo Boat Basin Marina. The west
bank of the harbor is developed with a mixture of commercial businesses including a rowing
club and a few small marinas. The Saugatuck Shores area on the western bank of Saugatuck
Harbor is developed with single-family homes and two yacht clubs. Some salt marshes are
present along the harbor margins south of the Canal Street bridge and just to the north of the I-
95 bridge. Much of the shoreline has been filled for development but several large strip
marshes are also still present along the western bank as the harbor opens into a larger basin
near the mouth (Figure 2.D.2).
Figure 2.D.1. Looking upstream at the first basin the harbor from the uppermost station, SH-6.
Harbor Health Study 2019, Harbor Watch | 44Figure 2.D.2. Map of Saugatuck Harbor sampling stations in 2019. Colored dots represent the %
of sampling events with bottom dissolved oxygen levels less than 5 mg/L.
Table 2.D.1. Coordinates and descriptions for each sampling station in Saugatuck Harbor
Site Name Latitude Longitude Description
SR-1 41.102050 -73.360533 Buoy 9
SR-2 41.101733 -73.373833 Buoy 18
SR-3 41.112167 -73.373317 Buoy 27
SR-4 41.119067 -73.368517 Railroad bridge
SR-5 41.124617 -73.369233 VFM marina (in the channel)
SR-6 41.132683 -73.366383 Sunoco (in the channel)
Harbor Health Study 2019, Harbor Watch | 45Dissolved Oxygen
Profiles were taken at 6 stations on 7 sampling days from late-June to September 2019. Mean
dissolved oxygen levels ranged between 4.71 mg/L at the bottom of station SH-6 to 6.74 mg/L
at the surface of station SH-1 (Figure 2.D.3). The reason these values may be lower than
observed in prior years may be due to the fact that sampling began in late June 2019 where
sampling has historically began in May when water and air temperatures are lower and more
conducive to holding more dissolved oxygen, and sampling ended in September rather than
October/November like some of the other harbors studied. Only 5% of bottom dissolved oxygen
observations fell below 3 mg/L, while 36% of bottom dissolved oxygen observations fell below 5
mg/L. Dissolved oxygen values dropped from June through July, but a strong recovery began
during early August (Figure 2.D.4).
Figure 2.D.3. Mean dissolved oxygen concentrations at the surface and bottom at each
sampling station in Saugatuck Harbor in 2019. Error bars represent standard error.
Harbor Health Study 2019, Harbor Watch | 46Figure 2.D.4. Surface and bottom dissolved oxygen values at each Saugatuck Harbor sampling
station on each monitoring date during the 2019 season. Light blue squares represent surface
dissolved oxygen values and dark blue squares represent bottom dissolved oxygen values. The
dotted line represents hypoxic conditions (3 mg/L).
Harbor Health Study 2019, Harbor Watch | 47Chlorophyll a
Chlorophyll a sampling was conducted during 3 of the 7 monitoring events; 5/31, 6/12, and
9/10/2019. Based on the Bricker classification system this harbor can be classified as medium
eutrophic (Table 2.1). During 2017, observed chlorophyll a values were elevated at the upper
stations SR-6, SR-5, and SR-4 reaching as high as 40 µg/L (station SR-6, 7/12/18) and 52 µg/L
(station SR-4, 8/11/17), classifying the harbor as highly eutrophic. Distribution of chlorophyll
along the length of the harbor was more uniform during 2018, and classified as medium
eutrophic (Crobsy et al. 2018c).
Figure 2.D.5. Surface and 2m below the surface chlorophyll a values in Saugatuck Harbor in
2019. Light green bars represent surface samples and dark green bars represent samples
collected at 2m below the surface.
Harbor Health Study 2019, Harbor Watch | 48You can also read