Mesoscale Morphological Changes of Nearshore Sand Banks since the Early 19th Century, and Their Influence on Coastal Dynamics, Northern France - MDPI
←
→
Page content transcription
If your browser does not render page correctly, please read the page content below
Journal of
           Marine Science
           and Engineering

Article
Mesoscale Morphological Changes of Nearshore Sand
Banks since the Early 19th Century, and Their
Influence on Coastal Dynamics, Northern France
Alexa Latapy 1, *, Arnaud Héquette 1 , Nicolas Pouvreau 2 , Nicolas Weber 2 and
Jean-Baptiste Robin-Chanteloup 3
 1    Laboratoire d’Océanologie et de Géosciences, University Littoral Côte d’Opale, Univ. Lille, CNRS,
      UMR 8187, LOG, 62930 Wimereux, France; arnaud.hequette@univ-littoral.fr
 2    Shom, 13 Rue du Châtellier CS92803, 29228 Brest CEDEX 02, France; nicolas.pouvreau@shom.fr (N.P.);
      nicolas.weber@shom.fr (N.W.)
 3    Littoral Environnement et Sociétés, UMR 7266 LIENSS, CNRS - Université de La Rochelle,
      2 rue Olympe de Gouges, 17000 La Rochelle, France; jeanbaptiste.robinchanteloup@gmail.com
 *    Correspondence: alexa.latapy@gmail.com

 Received: 13 February 2019; Accepted: 16 March 2019; Published: 20 March 2019

 Abstract: Tidal sand banks are common along the coast of northern France facing the North Sea,
 where they form linear shore-parallel or slightly oblique sand bodies from shallow coastal areas to
 depths of tens of meters. Hydrographic surveys have been carried out since the 1830s for mapping the
 seabed of the coastal zone. An analysis of the bathymetry evolution shows significant morphological
 changes have occurred across the shoreface since the early 19th century, largely due to cross-shore
 and longshore sand bank migration. Our results show that nearshore sand banks mainly migrated
 onshore and gained sediment, especially during the 20th century; acting as temporary sediment
 sinks, which can in turn serve as sand sources for providing sediment to the coast. Alongshore, the
 migration and elongation of sand banks can be related to tidal asymmetry that is mostly directed
 to the east-north-east in the region. Shore-perpendicular movement can likely be explained by
 the action of shore-normal storm-waves in the nearshore zone after their refraction over shallow
 offshore sand banks. A seaward displacement of sand banks was also observed. This may be related
 to the combined action of waves and tidal currents which can induce erosion on one side of the
 bank, decreasing its width, and eventually leading to its seaward migration. Our observations
 point out that some nearshore sand banks respond to the action of currents and waves, and interact
 between each other via feedback morphodynamic processes induced by sand bank morphological
 changes. The substantial morphologic changes that affected the nearshore zone of northern France
 during the last centuries probably had large impacts on coastal hydrodynamics and associated
 shoreline evolution.

 Keywords: shoreface evolution; tidal sand banks; macrotidal coast; Dover Strait; Southern North Sea

1. Introduction
     Different types of tidal sand banks are present in a wide range of water depths from the outer
continental shelves to the shallow coastal environments, and several theories have been proposed to
explain their origin and maintenance. Tidal flows, as well as storm-generated shear stress, but also
the post-glacial rise in sea level, have all been called upon as mechanisms that are responsible for
the formation of sand banks [1–8]. Tidal sand ridges are a characteristic feature of tide-dominated
continental shelves, with large available sand volumes. Their generation requires a source of mobile

J. Mar. Sci. Eng. 2019, 7, 73; doi:10.3390/jmse7030073                           www.mdpi.com/journal/jmse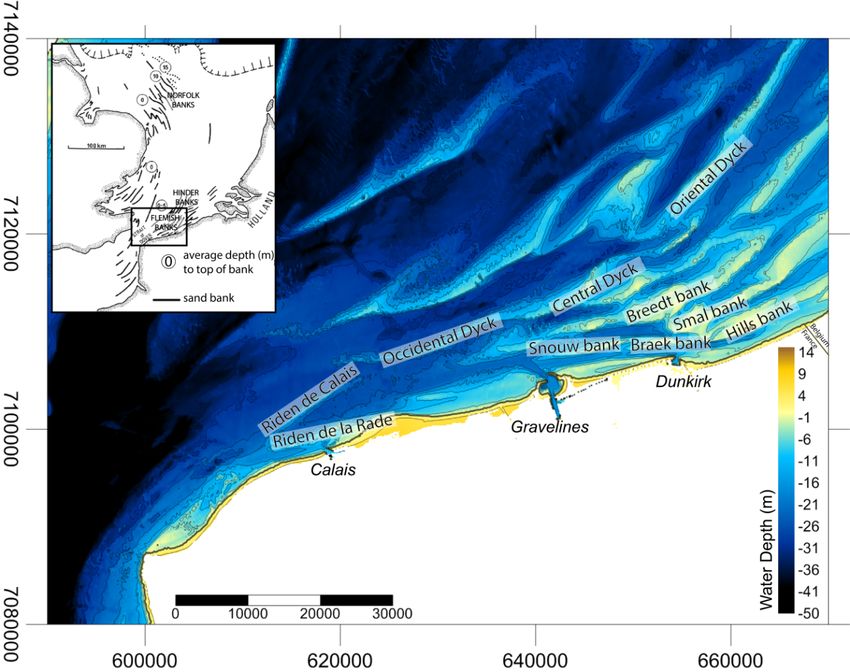
J. Mar. Sci. Eng. 2019, 7, 73 2 of 25
sediment, either from the local seabed or from coastal erosion, and their morphology results from2 of
J. Mar. Sci. Eng. 2019, 7, x FOR PEER REVIEW
an25
equilibrium between tidal current dynamics, seafloor morphology, and sediment supply [9].
Elongatetidal
Elongate tidalbanks
banksabound
aboundin inthe
the southern
southern North
North Sea
Sea [2,5,10–13]
[2,5,10–13] (Figure
(Figure 11 inset)
inset)and
andmay
maybebe
either active or moribund. Active sandbanks are generally formed at water depths
either active or moribund. Active sandbanks are generally formed at water depths shallower than 30–shallower than
5030–50 m, where
m, where tidal tidal currents
currents are strong,
are strong, exceeding
exceeding 0.5
0.5 m·s −1 m ·s−and
[14],
1 [14], and may migrate in response to
may migrate in response to present
present hydrodynamic
hydrodynamic processes processes [9,15,16]. sand
[9,15,16]. Moribund Moribund
bankssand banks are
are generally generally
present present
in deeper in deeper
waters where
waters where the current regime is too weak to cause active sediment movement,
the current regime is too weak to cause active sediment movement, or in low-energy shallow water or in low-energy
shallow
areas water areas [9,17].
[9,17].
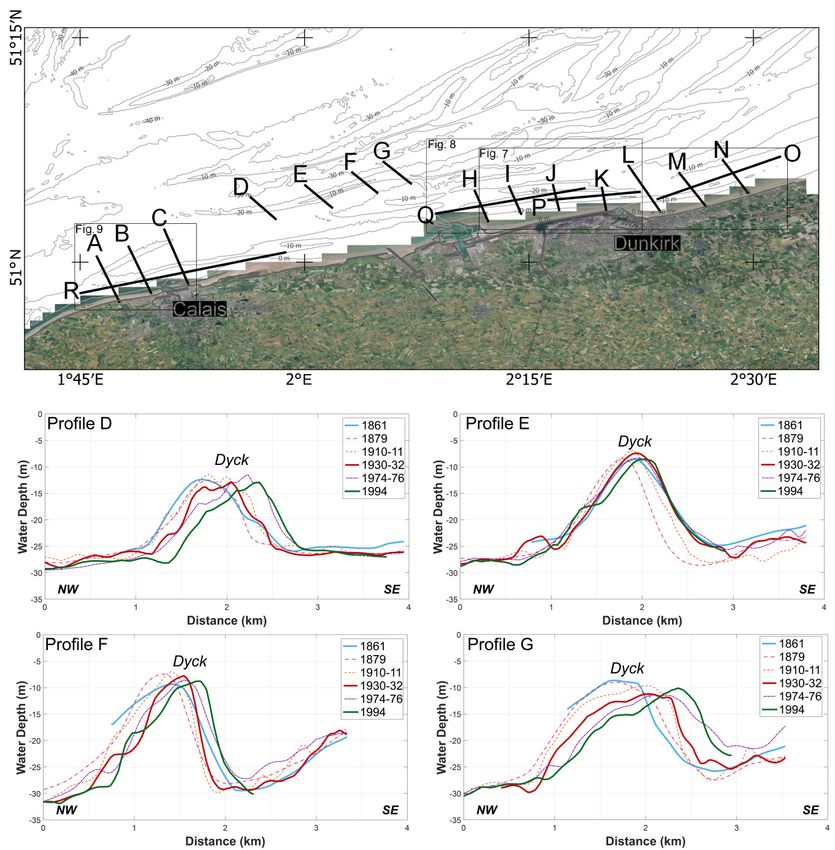
Locationmap
Figure1.1.Location
Figure mapofofthe
thestudy
studyarea,
area, showing
showing the position of the
the Northern
NorthernFrance
Francenearshore
nearshoresand
sand
banks(inset
banks (insetmap
mapfrom
from[14]).
[14]).The
Thedepth
depthcontours
contours are
are in meters below
below the
the lowest
lowestastronomical
astronomicaltide
tidelevel
level
(LAT),and
(LAT), andthey
theycorrespond
correspondtotothe
theHOMONIM
HOMONIMDigital
DigitalElevation
ElevationModel
Model(© (©Shom).
Shom).
InInrecent
recentyears,
years,there
therehas
hasbeen
been an an increasing
increasing degree
degree of of interest
interest in
in the
the dynamics
dynamicsof ofthe
theNorth
NorthSeaSea
sand banks, notably because they represent a source of marine aggregate (sand and
sand banks, notably because they represent a source of marine aggregate (sand and gravel) [18,19] that gravel) [18,19] that
willlikely
will likelyexperience
experienceincreasing
increasingextraction
extraction in in the
the near
near future,
future, due
due toto aa growing
growingdemand
demandofofaggregate
aggregate
materialfor
material forconstruction
constructionpurposes
purposes[20].[20].InInaddition,
addition,coastal
coastalerosion
erosionisiswidespread
widespreadalongalongthethecoasts
coastsof
of the North Sea [21–23], which also augments the demand for suitable mineral
the North Sea [21–23], which also augments the demand for suitable mineral material for coastal defensematerial for coastal
defensesuch
schemes schemes suchnourishment
as beach as beach nourishment [24,25].
[24,25]. In this In this
context, context,studies
numerous numerous
havestudies have beenin
been conducted
conducted
the North Sea infor
theaNorth
better Sea for a better understanding
understanding of the sedimentologyof the and
sedimentology
stratigraphyand stratigraphy
of the tidal sandofbanks
the
tidal sand banks of the region [26–29]. Numerical modelling was also carried out
of the region [26–29]. Numerical modelling was also carried out to predict the medium to long-term to predict the medium
to long-term morphological
morphological evolution of theevolution
tidal sandofbanksthe tidal
of thesand
North banks of the [10,30–33].
Sea region North Sea Numerous
region [10,30–33].
studies
Numerous studies on sand bank dynamics have analyzed the interactions
on sand bank dynamics have analyzed the interactions between sand bank morphology, hydrodynamic between sand bank
morphology, hydrodynamic processes and sediment transport. Relatively
processes and sediment transport. Relatively few studies though have been conducted nearshore few studies though haveto
been conducted
evaluate the effectnearshore
of shallow tosand
evaluate
bankstheoneffect of shallow
coastal sand banks
hydrodynamics andonassociated
coastal hydrodynamics and
sediment transport
[34–36]. Long-term morphodynamic behavior have been investigated in the UK coastal zone using
historical charts over a 150 year-long period [16,37,38], whereas in the coastal zone of northern France,
the available dataset is more restricted (less than 150 km2) and/or limited to the last few decades.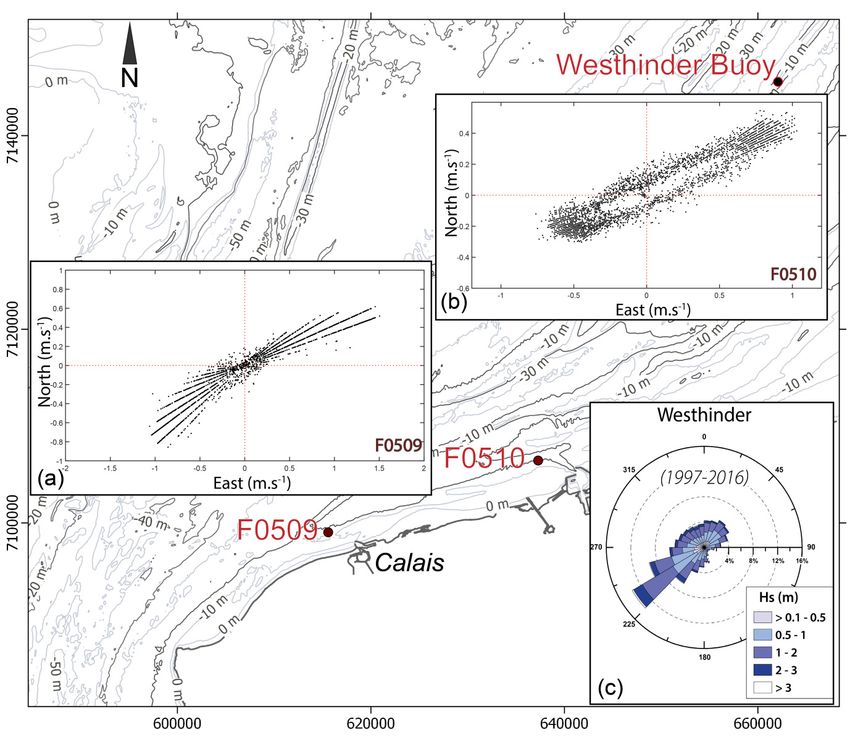
J. Mar. Sci. Eng. 2019, 7, 73                                                                        3 of 25

associated sediment transport [34–36]. Long-term morphodynamic behavior have been investigated
in the UK coastal zone using historical charts over a 150 year-long period [16,37,38], whereas in the
coastal zone of northern France, the available dataset is more restricted (less than 150 km2 ) and/or
limited to the last few decades. Nevertheless, hydrographic surveys were made to map the seabed
of the coastal zone since the beginning of the 19th century. These covered an area from the Belgian
border to the Dover Strait down to the 30 to 40 m water depths, which enables the examination of
the nearly-continuous bathymetry evolution over two centuries on large spatial scales (more than
370 km2 ).
     In Northern France, anthropogenic impacts on coastal morphology are significant, with the notable
extension of the Dunkirk and Calais harbors during the second half of the 20th century [39]. In order
to better understand the large-scale evolution of this area, which is exposed to strong hydrodynamic
forcing, this study aimed to analyze the evolution of the nearshore morphology between the Belgian
border and the Dover Strait (Figure 1) and to assess the potential impacts of changes in sand bank
morphology and position on coastal dynamics. Particular focus was made on three particular areas
where bathymetry data was available since the 1830s: two shallow coastal areas (Dunkirk and Calais)
and one sand bank located 10 km offshore (Occidental Dyck). The morphological evolution and
migration of nearshore and offshore sand banks was characterized and quantified over historical
time periods, based on the analysis of old hydrographic field sheets and recent digital bathymetry
data. This paper not only documents the migration of nearshore sand banks off the coast of northern
France since the early 19th century, but also aimed at analyzing the relationship between sand bank
morphometric evolution and volume change. An attempt was also made to connect the observed sand
bank evolution with forcing hydrodynamics, particularly the tidal currents and the wave-climate.

2. Regional Setting

2.1. Morphological and Sedimentological Characteristics
      The North Sea coast of France generally consists of wide, gently sloping, sandy barred beaches [40].
Sand banks are particularly widespread in this area, where they form linear shore-parallel or slightly
oblique sand bodies about 10–30 km long and 1–3 km wide (Figure 1). These banks belong to the
Flemish Banks [1] and generally occur as groups of banks from shallow coastal areas near beaches
to depths of several tens of meters [41–43]. The ridges display an asymmetry: the southern flanks
(i.e. landward), are generally steeper than the northern (i.e., seaward), due to the net wave and
current-induced transport. Sediment distribution is controlled by the bathymetry, with fine to coarse
sand in the interbank channels, while the shallower sectors of the banks and upper shoreface generally
consist of better sorted fine to medium sand [44,45].
      Near Calais are both the Riden de Calais (Figure 1), a 11.5 km long, linear sandbank located at
a distance of 3–5 km from the coast, with an orientation of 10◦ with respect to the coastline, and the
Riden de la Rade (Figure 1), which is closer to the shore and extends over 13 km alongshore, almost
parallel to the shoreline. These two banks have a shared origin at the western end, forming a V-shaped
sediment body with an angle of 20◦ .
      The Dyck bank is a 60 km long offshore sand bank, located 10 km off the coast and divided
between the Occidental Dyck, the Central Dyck, and the Oriental Dyck. The Occidental and Central
Dycks are almost parallel to the shoreline, with a height reaching 25 m above the surrounding sea
floor and a crest lying at depths of about −10 m. The oldest hydrographic field sheets cover only the
western part of the bank (i.e., the Occidental Dyck). Therefore, the results presented here have only
been obtained for this part of this bank, and for the sake of clarity, the Occidental Dyck is simply called
the Dyck bank in the paper.
      Finally, from Gravelines to the Belgium border, the shoreface and nearshore zones are
characterized by the presence of several sand banks that belong to the Dunkirk’s banks. These banks
are 8 to 32 km long, 1.5 to 3 km wide, and up to 15–20 m high and their crest may be exposed at low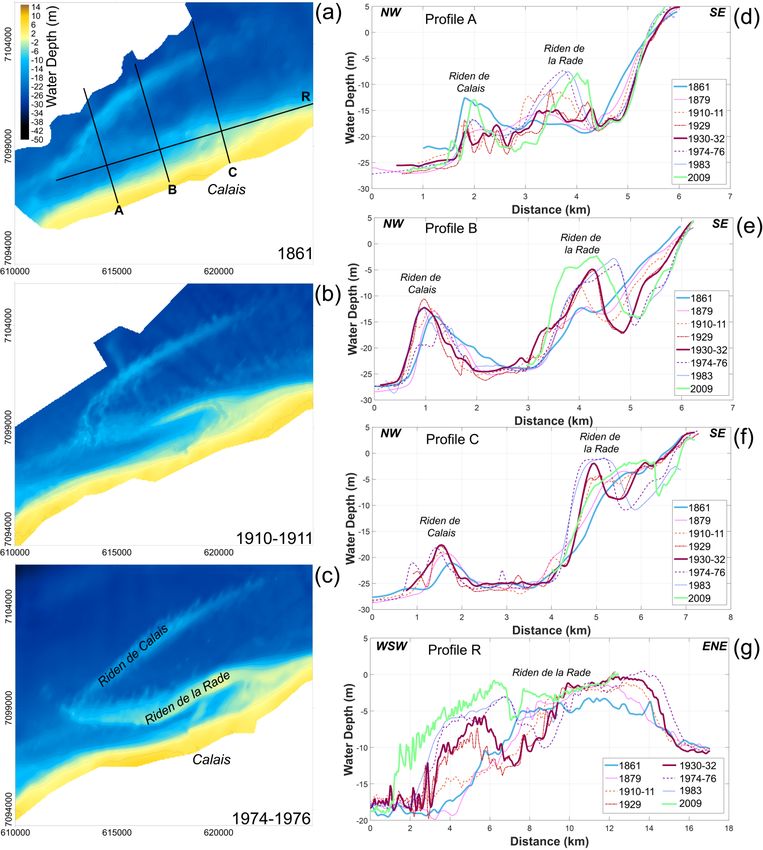
J. Mar. Sci. Eng. 2019, 7, 73 4 of 25
spring tide (e.g., the Hills and Smal banks). In this paper, we will focus on four shallow sand banks:
the Snouw, Braek, Smal, and Hills banks (Figure 1).
J. Mar. Sci. Eng. 2019, 7, x FOR PEER REVIEW 4 of 25
2.2. Tide
The
Thetidal
tidalregime
regimeininthis
thisarea
areaisissemi-diurnal
semi-diurnaland andmacrotidal,
macrotidal, with
witha tidal range
a tidal range increasing
increasing from the
from
north-east
the north-eastto thetosouth-west (the mean
the south-west spring
(the mean tidal tidal
spring rangerange
is approximately
is approximately 5.4 m5.4
at mDunkirk and 6.5
at Dunkirk andm
at6.5
Calais [46]). Tidal currents are alternating in the coastal zone, flowing almost
m at Calais [46]). Tidal currents are alternating in the coastal zone, flowing almost parallel to parallel to the shoreline
and
theoriented
shorelinetoward the east-northeast
and oriented toward theduring flood, and
east-northeast toward
during the west-southwest
flood, and toward theduring ebb (Figure
west-southwest
2a,b).
during Due ebbto (Figure
a large tidal
2a,b).range,
Due to tidal currents
a large tidalare strong,
range, reaching
tidal currentsa are
maximum
strong, near-surface velocity of
reaching a maximum
1.5 m·s
near-surface velocity of 1.5 m·s during ebb and 1.8 m·s during flood [47]. Current eastward,
−1 during ebb and 1.8 m·s−1−during 1 flood [47]. Current −velocity
1 generally diminishes velocity
due to the decreasing
generally diminishes tidal amplitude
eastward, due tointhe thedecreasing
same direction (Figure 2a,b).
tidal amplitude Flood
in the samecurrent velocities
direction (Figureexceed
2a,b).
those of the ebb in various sectors of the coastal zone (Figure 2b), resulting
Flood current velocities exceed those of the ebb in various sectors of the coastal zone (Figure 2b), in a flood-dominated
asymmetry
resulting inthat is responsible for
a flood-dominated a net regional
asymmetry that issediment
responsible transport
for a netto regional
the east-northeast [48]. Locally,
sediment transport to
numerous
the east-northeast [48]. Locally, numerous sand banks can modify the bottom circulation and result inon
sand banks can modify the bottom circulation and result in opposite transport directions
both sidestransport
opposite of the banks (Figureon
directions 3) both
[11,42].
sides of the banks (Figure 3) [11,42].
Locationmap
Figure2.2.Location
Figure mapofofthe
thecurrent
current meters
meters (Shom)
(Shom) and
and offshore
offshorewave
wavebuoy
buoy(map
(mapprojection:
projection:Lambert
Lambert
93);(a,b):
93); (a,b):Directional
Directionaldistribution
distributionofof the
the mean
mean currents
currents recorded
recordedin in55m
mwater
waterdepths
depthsononthe
theshoreface
shorefaceatat
Calaisand
Calais andDunkirk
Dunkirk(F0509:
(F0509: from
from 25
25 April
April 1975
1975 to
to 13
13 May
May 1975;
1975; F0510:
F0510:from
from55July
July1978
1978toto1919July
July1978)
1978)
(©Shom); (c): wave rose at the Westhinder buoy (from
(©Shom); (c): wave rose at the Westhinder buoy (from [24]). [24]).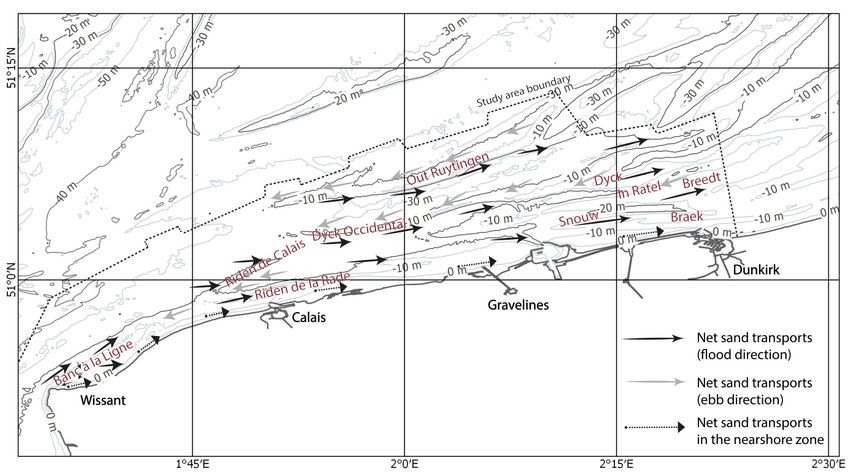
J. Mar. Sci. Eng. 2019, 7, 73 5 of 25
J. Mar. Sci. Eng. 2019, 7, x FOR PEER REVIEW 5 of 25
Figure3.3. Offshore
Figure Offshoretidal
tidalsand
sandbanks
banksand netnet
and sand transport
sand direction
transport in theinsouthern
direction bight ofbight
the southern the North
of the
Sea (map projection: WGS84) (adapted from the regional study of Augris et al. [42] based on
North Sea (map projection: WGS84) (adapted from the regional study of Augris et al. [42] based on sediment
tracing). tracing).
sediment
2.3.
2.3.Waves
Waves
The
Theoffshore
offshore wave regimeisisdominated
wave regime dominated byby waves
waves from
from the the southwest
southwest to thetowest,
the west, originating
originating from
the English
from Channel,
the English followed
Channel, by waves
followed by waves fromfrom
the northwest to northeast,
the northwest generated
to northeast, in theinNorth
generated Sea
the North
(Figure 2c) [49,50]. The modal offshore significant wave height is approximately
Sea (Figure 2c) [49,50]. The modal offshore significant wave height is approximately 0.6 m, with wave 0.6 m, with wave
periodstypically
periods typicallyranging
ranging from
from 44 to
to 88 s,s, but
but the
the maximum
maximum wavewave height
height may
mayepisodically
episodicallyexceed
exceed4 4m,m,
withperiods
with periodsofof 99 to
to 10
10 ss during
duringmajor
majorstormsstorms [51]. Wave
[51]. heights
Wave are are
heights significantly lower
significantly at theatcoast,
lower due
the coast,
to significant shoaling and energy dissipation over the shallow offshore sand banks,
due to significant shoaling and energy dissipation over the shallow offshore sand banks, resulting in resulting in wave
heights
wave that hardly
heights exceed
that hardly 1 m in1the
exceed m inintertidal zone, even
the intertidal during
zone, even storms
during[52,53].
storms [52,53].
3.3.Methodology
Methodology
Themorphological
The morphological evolution
evolution of of the
the sand
sand banks
banks and
and the adjoining seafloor
the adjoining seafloorwas wasstudied
studiedusingusing
hydrographic field sheets from the Shom (French hydrographic service), spanning from theearly
hydrographic field sheets from the Shom (French hydrographic service), spanning from the early19th
19th
century to the beginning of the 21st century (Table 1). Most of the original hydrographic field sheets
century to the beginning of the 21st century (Table 1). Most of the original hydrographic field sheets
were printed paper documents, consequently, the first step was to make an inventory of those available
were printed paper documents, consequently, the first step was to make an inventory of those available
and to digitize them, which was done with the ScanBathy software [54]. Then, a conversion into the
and to digitize them, which was done with the ScanBathy software [54]. Then, a conversion into the
present-day geodesic system was performed, with the positioning accuracy being controlled by using
present-day geodesic system was performed, with the positioning accuracy being controlled by using
fixed landmark (e.g. lighthouse, church or tower). Bathymetric data consisted of depth soundings that
fixed landmark (e.g. lighthouse, church or tower). Bathymetric data consisted of depth soundings that
were obtained along a series of transect, using a sounding line (SL).
were obtained
Along thealong a series
survey of transect,
transects, usingbetween
the intervals a sounding line (SL).
the depth soundings ranged from about 250 m
Along the survey transects, the intervals between the
for the oldest surveys (1836) to less than 50 m after 1894 (Table 1). depth soundings ranged
The distance from about
between 250 m
the survey
for the oldest surveys (1836) to less than 50 m after 1894 (Table 1). The distance
transects was around 500 m in 1836, between 250 and 130 m until the mid-20th century, and less than between the survey
transects was1950
100 m since around 5001).
(Table mSingle
in 1836, between
channel 250 and 130(ES)
echo-sounders m until
werethe mid-20th
used century,
in the second halfand less20th
of the than
100 m since
century, but1950
more(Table 1). bathymetric
recently, Single channel dataecho-sounders
has been obtained (ES) were
with used in echo-sounder
multibeam the second half of the
systems
20th century, but more recently, bathymetric data has been obtained with multibeam echo-sounder
(MES).
systems (MES).
These changes in measuring techniques are not only responsible for the differences in the density
of depth
These soundings
changes in(Table 1), but
measuring also in the
techniques aremeasurement accuracy.
not only responsible forInthethis work, weinconsider
differences a
the density
maximum vertical error (MVE) based on the error range of the instrument (Z
of depth soundings (Table 1), but also in the measurement accuracy. In this work, we consider aerr), the error due to the
inaccuracyvertical
maximum in ship error
positioning
(MVE)(XY err) and
based on the
the digitalization
error range of error
the (Digit err). For(Z
instrument example,
err ), the for thedue
error 1879to
the inaccuracy in ship positioning (XYerr ) and the digitalization error (Digiterr ). For example, for the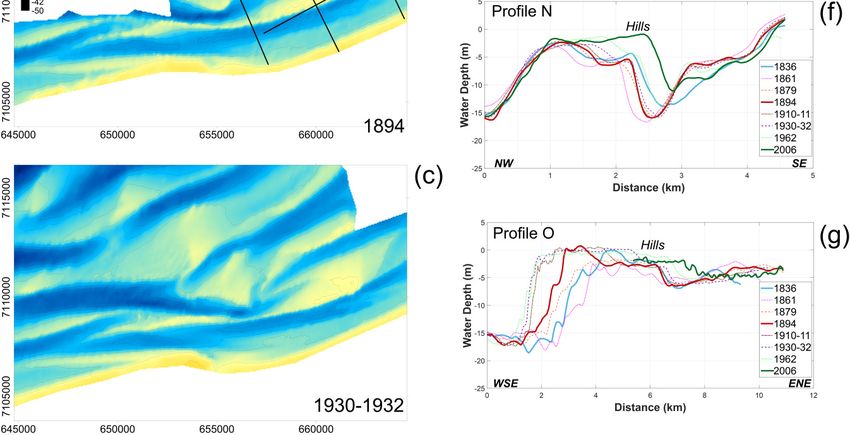
J. Mar. Sci. Eng. 2019, 7, 73 6 of 25
J. Mar. Sci. Eng. 2019, 7, x FOR PEER REVIEW 6 of 25
1879 survey’s, the ship positioning error (XYerr ) is ±15 m and the ScanBathy software enables the
digitization
survey’s, of depth
the ship soundings
positioning errorwith
(XYerra )horizontal
is ±15 m and error ±4 m (Digit
theofScanBathy err ). Considering
software enables thea digitization
maximum
ofseabed slope of 3%,
depth soundings withtheamean horizontal
horizontal error of error
±4 m(MHE)
(Digitresults in a vertical
err). Considering error of 0.9
a maximum m. Adding
seabed slope of
3%, the mean horizontal error (MHE) results in a vertical error of 0.9 m. Adding this value to the Zerrof
this value to the Z err of 1 m (line sounding) results in a total vertical error for the 1879 survey of
1m±1.9 m sounding)
(line (MVE). results in a total vertical error for the 1879 survey of ±1.9 m (MVE).
AnAninterpolation
interpolationofofthe thez-value
z-value was was calculated
calculated to to obtain
obtain a Digital
Digital Model
Model Elevation
Elevation (DEM)
(DEM)
consisting of a grid of 50 m resolution
consisting of a grid of 50 m resolution (except for the (except for the 1861 surveys whose grid
grid spacing of 200 mm
spacing of 200
corresponded
corresponded toto
thethe mean
mean initial
initial datadata sampling).
sampling). TheThe 1836 1836
depthdepth soundings
soundings were were
not not interpolated,
interpolated, due
todue
the to the
low low survey
survey density, density,
but theybutwere
they used
were to
used to extract
extract the cross-shore
the cross-shore and long-shore
and long-shore profiles.
profiles.
The
The krigging
krigging method
method waswas used
used to to perform
perform thethe interpolation,
interpolation, because
because it was
it was proven
proven to be
to be oneone of
of the
the most
most appropriate
appropriate approaches
approaches for spatially
for spatially heterogeneous
heterogeneous datadata [55–58].
[55–58]. Variograms
Variograms werewere calculated
calculated for
for each dataset, and they are used to make the interpolation. In addition,
each dataset, and they are used to make the interpolation. In addition, to check the reliability of the to check the reliability
of the conversion
conversion and interpolation
and interpolation processes,processes,
comparisons comparisons
of the water of depths
the water depths on
on different different
dates (1879,dates
1910–
(1879,
1911 and1910–1911
1974–1976 andsurveys)
1974–1976 oversurveys)
rocky over rocky areas—considered
areas—considered as stable overas stable over time—were
time—were carefully
carefully(Figure
examined examined (Figure
4 right). 4 right).
Results Results
obtained on obtained
submarine onrocky
submarine
outcropsrocky outcrops
located in thelocated in the
westernmost
westernmost
part of the study partarea
of the study4area
(Figure left)(Figure
indicated4 left) indicatedvertical
a maximal a maximalrangevertical
of 1.6range
m forofthe1.6 coastward
m for the
coastward
outcrop and outcrop
of 1.1 mand for of
the1.1 m for the
seaward seaward
one, which one, whichthe
validates validates
computed the computed
error marginserrorofmargins of
the earlier
the earlier
surveys. surveys.
Figure
Figure4. Left: Seabed
4. Left: sediment
Seabed distribution
sediment map of
distribution Wissant
map bay (©bay
of Wissant Shom), with thewith
(© Shom), location of the cross-
the location of
shore profile shown
the cross-shore in right-hand
profile figure. Right:
shown in right-hand Superimposition
figure. of bathymetric
Right: Superimposition profiles recorded
of bathymetric profilesat
different
recorded periods (1879,periods
at different 1910–1911, and
(1879, 1974–1976)
1910–1911, over
and a rocky outcrop.
1974–1976) over a rocky outcrop.
The shoreface evolution was analyzed through the generation of differential bathymetric maps
(changes in water depth between two successive surveys). Individuals errors can be propagated
into the differential bathymetric maps, using the method developed by Brasington et al. [59,60]
(Equation (1)): q
δdi f f = ( MVE1 )2 + ( MVE2 )2 (1)
where δdiff is the propagated error in the differential bathymetric map, and MVE1 and MVE2 are the
individual errors in the DEM, as calculated in Table 1. Depending on the dates of the water depth
measurements, δdiff ranges from 0.7 m to 2.7 m. For each of the differential maps, only the bed level
changes higher than δdiff are supposed to be significant, and these were used for the calculation of
changes in water depths and associated volume changes due to erosion or sediment accumulation.
It must be noted, however, that additional vertical errors may be induced by the presence of migrating
sand waves on the sand banks, which can be responsible for some random elevation variations.
Nevertheless, the influence of the apparent water depth variations caused by these migrating sediment
bodies on computed sediment volume changes was probably moderate, due to the relatively small
dimensions of these bedforms (less than 1 m high and 200 m long), compared to those of the sand
banks (generally 10–20 m high and 5–10 km long).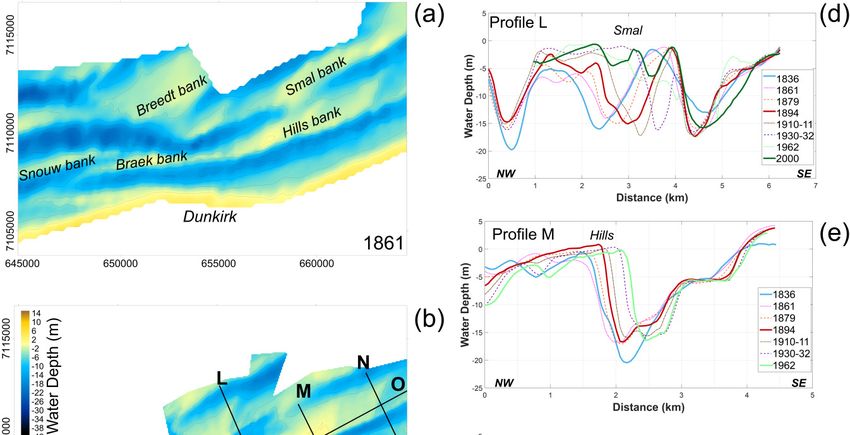
J. Mar. Sci. Eng. 2019, 7, 73                                                                                                                                                    7 of 25

      Table 1. Bathymetric surveys used in this study (source: Shom, except for 2000 made by the Dunkirk harbor *, 2006, made by the Belgium Hydrographic Service, †
      and 2009, made by the Calais Harbour ‡ ). Abbreviations: MHE: Mean horizontal error; MVE: Maximum vertical error; LS: Line Sounding; ES: Echo Sounder; MES:
      Multibeam Echo Sounder; RC: Repeating circle; DC: Decca; TR: Toran; TD: Trident.

                                                                                                                                                Vertical
                                               Number of     Transect   Sounding
                                                                                   Sounding      Ship                  Digiterr               Propagated
       Year               Survey Area          Bathymetric   Distance    Spacing                           XYerr (m)              MHE (m)                     Zerr (m)   MVE (m)
                                                                                   Technique   Positioning              (m)                 Error with a 3%
                                               Soundings       (m)         (m)
                                                                                                                                               Slope (m)
       1836                     Dunkirk           3304         500        250         LS          RC         15.0        4.0        15.5          0.9            1         1.9
       1861        Dunkirk-Gravelines-Calais      7386         250        150         LS          RC         15.0        4.0        15.5          0.9            1         1.9
       1879        Dunkirk-Gravelines-Calais     51,471        250         50         LS          RC         15.0        4.0        15.5          0.9            1         1.9
       1894                     Dunkirk          29,782        150         40         LS          RC         15.0        4.0        15.5          0.9            1         1.9
    1910–1911      Dunkirk-Gravelines-Calais     97,598        130         30         LS          RC         15.0        4.0        15.5          0.9            1         1.9
       1929                     Calais            1263         130         30         LS          RC         15.0        4.0        15.5          0.9            1         1.9
    1930–1932      Dunkirk-Gravelines-Calais     165,648       130         30         LS          RC         15.0        4.0        15.5          0.9            1         1.9
       1962                     Dunkirk          20,194        100         50         ES          DC         10.0        4.0        10.8          0.7           0.5        1.2
    1974–1976           Gravelines-Calais        161,827       100         50         ES          DC         10.0      No digit     10.0          0.6           0.5        1.1
       1983                     Calais            6815         100         50         ES          TR          5.0      No digit     5.0           0.3           0.5        0.8
       1994                     Calais           123,912       50          50         ES          TD          5.0      No digit     5.0           0.3           0.5        0.8
      2000 *                    Dunkirk          64,602         50         50        MES         GPS          3.0      No digit     3.0           0.2           0.3        0.5
      2006   †                  Dunkirk          190,878       200         5         MES         GPS          3.0      No digit     3.0           0.2           0.3        0.5
      2009 ‡                    Calais          9,936,655       5          5         MES         GPS          3.0      No digit     3.0           0.2           0.3        0.5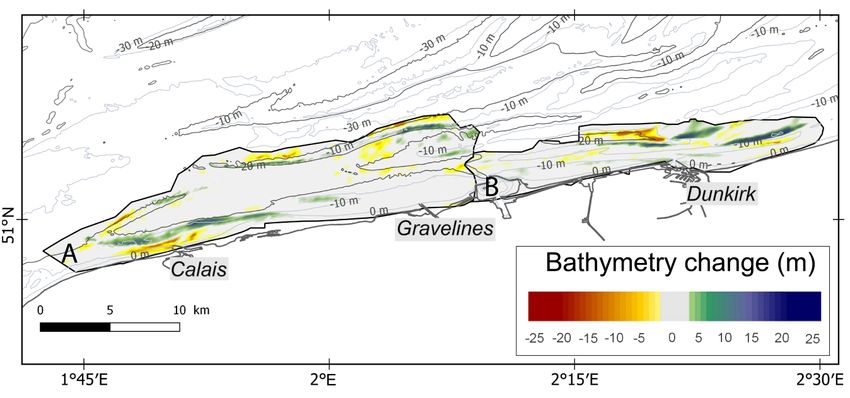
J. Mar. Sci. Eng. 2019, 7, 73                                                                                     8 of 25

     Cross-shore and longshore bathymetric profiles (corresponding the sounding lines of the oldest
surveys) were selected for identifying areas that were submitted for either erosion or accretion, and for
analyzing shoreface evolution, particularly sand bank migration. The lateral extent of the longshore
transects along the sand banks were variable, depending on the sand bank length at the time of the
survey. Cross-shore profiles extended from the coast (i.e., from the shoreward-most sounding point) to
the channel located seaward of the bank (except for the Dyck bank, located further offshore, which is
flanked by two interbank channels). In order to examine in detail the morphological evolution of these
sediment bodies, the height and width of the sand banks was calculated from each of the cross-shore
profiles. The shoreward or seaward movement of the bank crests, and the changes in bank width were
also calculated on each bathymetric profile. In addition, variations in sediment volumes between each
survey were computed in the four studied areas from the differential bathymetric maps, using the
same spatial extent. Volume changes were then compared to sand bank migration, to determine the
gain or loss of sediments.

4. Results

4.1. Regional Evolution
     Bathymetric difference maps show a significant variability of seabed through the years. Based
on the oldest and most recent bathymetric data available, three sectors are characterized by a strong
evolution, where different patterns could be observed (Figure 5):

•     The Calais nearshore area, where the Riden de la Rade is characterized by a net seabed accretion,
      which is associated with an erosion of the channel located between the bank and the beach.
•     The offshore area between Calais and Gravelines, where the Dyck bank experienced a lowering
      of its seaward side, whereas the landward side of the bank recorded a vertical accretion of 20 m
      during this period, due to a shift in position.
•     The coastal zone around Dunkirk shows spatially variable morphological evolutions. Locally, a
      vertical accretion of more than 20 m was measured, accompanied by a lowering of the sea bed of
      20 m in other areas.
     J. Mar. Sci. Eng. 2019, 7, x FOR PEER REVIEW                                                             9 of 25

      Figure   5. Bathymetric
          Figure               differential
                   5. Bathymetric differentialmap
                                               mapofofNorthern
                                                       Northern France   duringthe
                                                                 France during  thestudy
                                                                                    studyperiod
                                                                                          period  (map
                                                                                                (map    projection:
                                                                                                     projection:
      WGS84).
          WGS84).(A):(A):
                      Bathymetry   changes
                          Bathymetry  changesbetween
                                               between1861
                                                        1861 and
                                                             and 1975; (B):Bathymetry
                                                                 1975; (B): Bathymetrychanges
                                                                                        changes  between
                                                                                               between    1861
                                                                                                       1861 andand
      1962.1962.
             Isobaths  from
                 Isobaths    HOMONIM
                          from HOMONIMDEM    DEM (©
                                                  (© Shom).
                                                     Shom).

         A detailed
     A detailed      description
                 description   ofofthe
                                     themorphological
                                         morphological evolution
                                                          evolution ofofthese
                                                                         thesethree
                                                                                threeareas
                                                                                       areasis is
                                                                                               given thereafter
                                                                                                  given          by by
                                                                                                        thereafter
    analyzing
analyzing   thethe bathymetricmaps
                bathymetric      mapsand andprofiles,
                                             profiles, to
                                                       to quantify
                                                           quantify the
                                                                     theevolution
                                                                          evolutionofof thethesand
                                                                                                sandbanks
                                                                                                      banksandand
                                                                                                                the the
    adjoining
adjoining     seafloor.
           seafloor. ToTo  completethese
                        complete      these observations,
                                            observations, volume
                                                            volume changes  andand
                                                                      changes    morphometric
                                                                                      morphometric evolution of the of
                                                                                                         evolution
     sand banks were computed, in order to gain insights into the morphodynamic of these prominent
     sediment bodies.

     4.2. Offshore Area: The Dyck Bank
           The Dyck bank (Figure 1) is the most offshore sand bank analyzed in this paper. A seabed lowering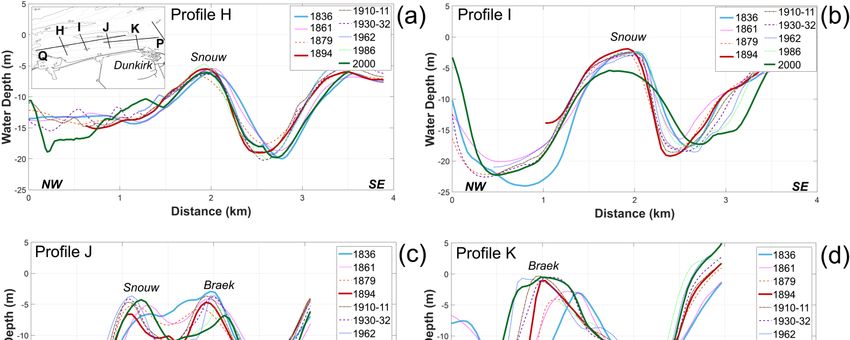
J. Mar. Sci. Eng. 2019, 7, 73                                                                                           9 of 25

the sand banks were computed, in order to gain insights into the morphodynamic of these prominent
sediment bodies.

4.2. Offshore Area: The Dyck Bank
      The Dyck bank (Figure 1) is the most offshore sand bank analyzed in this paper. A seabed
lowering near a sand bank may not necessarily be due to sea floor erosion, but it may indicate the
incidence of bathymetry changes, caused by sand bank mobility. The differential bathymetric map
(Figure 5) reveals a linear lowering of the seafloor of more than 10 m, even exceeding 15 m locally, on
the seaward side of the Dyck bank. Conversely, sediment accumulation by up to more than 10 m was
observed on the shore-facing side of the bank, which can be explained by an onshore movement of the
sand bank since 1861.
      Cross-shore profiles (Figure 6) show that the western and eastern parts of the Dyck migrated over
500 m landward from 1861 to the 1990s, (profiles D, F, G). Contrariwise, the central part (profile E)
remained relatively stable, with no significant sand bank movement. Most of the Dyck bank displayed
an asymmetry in cross-sectional morphology, with the steeper side of the bank being located on its
landward      side,
    J. Mar. Sci.      except
                 Eng. 2019,      in the
                            7, x FOR    central
                                     PEER REVIEWpart (cf., profile E), where the sand bank is symmetrical.
                                                                                                        10 of 25

          Figure
      Figure      6. Top:
              6. Top:      Locationofofthe
                       Location          thecross-shore
                                              cross-shore and
                                                            and long-shore
                                                                 long-shore profiles
                                                                             profiles(map
                                                                                      (mapprojection:  WGS84);
                                                                                             projection:  WGS84);the the
          rectangles
      rectangles     show
                  show   thethe geographicextent
                              geographic     extent of
                                                     of the
                                                         the Dunkirk
                                                             Dunkirk and
                                                                       andCalais
                                                                            Calaisnearshores
                                                                                   nearshoresshown
                                                                                                shownin Figures 7–9. 7–9.
                                                                                                        in Figures
          Bottom:
      Bottom:      Cross-shore
                Cross-shore     profilesD,
                              profiles   D,E,
                                            E, F,
                                               F, and
                                                  and G
                                                      G along
                                                          alongthe
                                                                theDyck
                                                                    Dyck bank.
                                                                           bank.

     4.3. Dunkirk
          Analyses of nearshore sand bank evolution in front of the Dunkirk harbor (Figure 1) indicate that
     these banks were affected by a long-shore, as well as a cross-shore displacement for almost two
     centuries.
          During the 19th century, the Hills bank was characterized by a progressive lengthening of its bank,
J. Mar. Sci. Eng. 2019, 7, 73                                                                                   10 of 25

4.3. Dunkirk
     Analyses of nearshore sand bank evolution in front of the Dunkirk harbor (Figure 1) indicate
that
J. Mar.these   banks
        Sci. Eng. 2019, 7,were
                          x FORaffected by a
                               PEER REVIEW long-shore, as well as a cross-shore displacement for almost        11 of 25
two centuries.
     Nowadays,
     During the the19thHills bank the
                         century, is connected
                                       Hills bank to the
                                                     wasSmal   bank at itsby
                                                          characterized    western    end, which
                                                                              a progressive         was initially
                                                                                                 lengthening    of not
                                                                                                                   its
the case
bank,    (Figures 1towards
       particularly  and 7). The  differential(Figure
                              the southwest     map of7,bathymetry
                                                           Profile O). changes
                                                                       The Hillsbetween       1836 and
                                                                                   bank, initially      1962
                                                                                                     4 km     (Figure
                                                                                                           long,  had
5) shows
almost     an eastward
        doubled           displacement
                   in length  and reached of the
                                              7 kmSmal
                                                     longbank. On the
                                                           by 1962.     shoreward
                                                                     During    the 20thsidecentury,
                                                                                             of the bank,   sediment
                                                                                                     the sand   bank
accumulation
started to migrate about 700 m to the northeast. This longshore displacement is associated with of
                of up to more  than  20 m  thick  occurred,  which  resulted  in  a 2 km    shoreward   migration    a
the bank (profile
progressive         L). This
              onshore        onshoreofmovement
                         movement                   was accompanied
                                         400 m (Profiles    M, N), withby    a transformation
                                                                         migration                 of the
                                                                                         rates of up      Smal
                                                                                                      to 5.5 m·yrbank
                                                                                                                   −1
morphology    (Figure 7a–c)
during the 1894–1962      timethrough
                               period. time.   Mapping
                                         The last         of the seabed
                                                   bathymetric    survey morphology
                                                                          in this area was  changes  revealed
                                                                                                carried  out in that
                                                                                                                2006,a
segment   of an offshore  sand  bank, the  Breedt  bank,  detached  from   the  initial bank,  moved
and covered the eastern part of the Hills bank. These measurements (profile N) show that the eastern    onshore,  and
merged   with the  historic Smal bank   (Figure  7a–c). Nowadays,    the Smal    bank   is higher,
part of the bank continued to migrate onshore and towards the northeast over the last few decades. wider,  and  closer
to the shoreline, compared to its former configuration in the 19th century (profile L).

      Figure
      Figure 7.7.(a),(a–c):
                      (b) & (c): Nearshore
                              Nearshore      bathymetryoffshore
                                           bathymetry     offshore of Dunkirk
                                                                       Dunkirkinin1861,   1894,
                                                                                      1861,     and and
                                                                                              1894,  1930–1932 (map
                                                                                                         1930–1932
      projection:  Lambert
      (map projection:       93). (d–g):
                          Lambert    93). Bathymetry  profile evolution
                                          (d–g): Bathymetry               across the
                                                               profile evolution     Hillsthe
                                                                                  across   and  Smal
                                                                                              Hills   banks
                                                                                                    and Smalbetween
                                                                                                             banks
      1836 and 1836
      between   2006.and
                       L, M,  N are
                            2006. L, the
                                     M, Ncross-shore profiles, and
                                           are the cross-shore     O is aand
                                                                profiles, longshore  profile. profile.
                                                                              O is a longshore

    The Braek and the Snouw banks were the westernmost banks of the Dunkirk banks, and they are
separated from the shoreline by a navigation channel. As with other sand banks off Dunkirk, the Braek
and the Snouw underwent progressive longshore migration. Since 1836, the eastern part of the Braek
bank moved more than 1.5 km to the northeast (Figure 8, profile P). For the Snouw bank (Figure 8,
J. Mar. Sci. Eng. 2019, 7, 73 11 of 25
Nowadays, the Hills bank is connected to the Smal bank at its western end, which was initially
not the case (Figures 1 and 7). The differential map of bathymetry changes between 1836 and 1962
(Figure 5) shows an eastward displacement of the Smal bank. On the shoreward side of the bank,
sediment accumulation of up to more than 20 m thick occurred, which resulted in a 2 km shoreward
migration of the bank (profile L). This onshore movement was accompanied by a transformation of
the Smal bank morphology (Figure 7a–c) through time. Mapping of the seabed morphology changes
revealed that a segment of an offshore sand bank, the Breedt bank, detached from the initial bank,
moved onshore, and merged with the historic Smal bank (Figure 7a–c). Nowadays, the Smal bank is
higher, wider, and closer to the shoreline, compared to its former configuration in the 19th century
(profile L).
The Braek and the Snouw banks were the westernmost banks of the Dunkirk banks, and they are
separated from the shoreline by a navigation channel. As with other sand banks off Dunkirk, the Braek
J.and
Mar. the Snouw
Sci. Eng. 2019,underwent
7, x FOR PEERprogressive
REVIEW longshore migration. Since 1836, the eastern part of the Braek 12 of 25
bank moved more than 1.5 km to the northeast (Figure 8, profile P). For the Snouw bank (Figure 8,
profileQ),
profile Q),the
themain
maindisplacement
displacement occurred
occurred during
during thethe
19th19th century,
century, with
with a northeast
a northeast migration
migration of
of 1 km;
1 km; during
during the 20th the 20th century,
century, the position
the position of theremained
of the bank bank remained relatively
relatively stable,stable,
but thebut thesurvey
latest latest survey
(dating
(dating
from 2000)from 2000)a shows
shows a substantial
substantial loweringlowering of the
of the bank bank
crest. crest. Cross-shore
Cross-shore profiles profiles
revealedrevealed more
more complex
complex morphological
morphological changes. changes.
Figure
Figure8.8.Bathymetry
Bathymetry profiles
profiles evolution acrossthe
evolution across theBraek
BraekandandSnouw
Snouwbanks
banks
fromfrom 1836
1836 to 2000.
to 2000. (a),are
(a–d) (b),
cross-shore
(c), profiles H,profiles
(d) are cross-shore I, J, K; (e,f) are
H, I, J, longshore
K; (e,f) areprofiles P & profiles
longshore Q (see Figure
P & Q6 (see
for the location
Figure 6 forofthe
profiles).
location
of profiles).
The eastern part of the Braek moved progressively offshore (Figure 8, Profile K). During the same
period,
The aeastern
widening
partofofthe
theeastern and central
Braek moved parts of the
progressively bank occurred,
offshore (Figure 8,which
Profileparticularly
K). Duringaffected
the same
period, a widening of the eastern and central parts of the bank occurred, which particularly affected the
seaward-facing flank of the bank (Profile K). The evolution of the western part of the Break was
characterized by onshore displacement accompanied by a lowering and a decrease in size of its crest
(Figure 8, Profile J).
The eastern part of the Snouw bank is separated from the Braek bank by a channel, and it is theJ. Mar. Sci. Eng. 2019, 7, 73 12 of 25
the seaward-facing flank of the bank (Profile K). The evolution of the western part of the Break was
characterized by onshore displacement accompanied by a lowering and a decrease in size of its crest
(Figure 8, Profile J).
The eastern part of the Snouw bank is separated from the Braek bank by a channel, and it is
the most offshore sand bank visible in the Profile J. The eastern Snouw bank exhibits alternating
onshore and offshore movements, depending on the period considered (Figure 8, Profile J). The central
and western segments of the Snouw bank (Figure 8, profile H, I) showed only minor movements
in comparison with the other banks, but different patterns can be identified. The crest of the bank
was closer to the shoreline, and it remained stable during the oldest survey period (1836–1861), then
seaward migration occurred until 1879 (Figure 8, Profile H, I) and from the end of the 19th century
onward, the Snouw bank experienced a 200 m onshore migration.
Sand bank migration resulted in some areas in a landward/seaward displacement of channels
depending on the sand bank evolution trend. The seaward displacement of the Braek bank, for
example, induced an offshore migration of the channel between the Braek and the Smal banks (Figure 8,
Profile K); conversely, the Hills bank movement resulted in an onshore movement of the coastal channel
and a seabed lowering of the foreshore landward of the bank (Figure 7, Profile M, N).
4.4. Calais
The seabed morphology seaward of Calais harbor changed considerably during the study period,
which was largely due to significant variations in the morphology and position of nearshore sand
banks such as the Riden de la Rade (Figure 9). Since 1861, an elongation of this sediment body was
clearly visible on bathymetric maps (Figure 9a–c). A longshore growth to the east-northeast and to
the west-southwest was responsible for a growth of an 8 km-long bank to a 15 km-long sediment
body (Figure 9, Profile R). The lengthening of the bank was accompanied by an elevation of the crest
(Figure 5) with a vertical sediment gain of 7 to 9 m. The analysis of cross-shore profiles confirms this
vertical accretion and reveals an increase in the width of the Riden de la Rade (Figure 9, Profiles A, B
and C). Profile C highlights also a coastward migration of 1 km of the bank from the time of the first
hydrographic charts in 1861.
Three main steps of evolution of the Riden de la Rade are clearly discernible:
• From 1861–1911, the period of the oldest bathymetric surveys, the Riden de la Rade was hardly
visible (Figure 9a); it started to develop significantly at the end of the 19th century as revealed by
cross-shore profiles (Profiles A, B and C) that clearly shows an increase of both width and height
throughout this time period.
• During the 1911–1983 period, the Riden de la Rade gradually migrated onshore, with a maximum
displacement of up to 800 m. A maximum degree of movement took place in the central part of
the Riden de la Rade (Profile B), which resulted in a curved morphology of the sand bank at the
end of the 1970s (Figure 9c). In the western part of the Calais harbor, the foreshore was affected
by a strong lowering of the seabed (Figure 5). This can be attributed to the shoreward movement
of the bank that was responsible for the onshore displacement of the channel between the coast
and the bank (Profile B). Based on the position of the lowest low-water spring level, it can be
estimated that the channel migration led to a shoreface retreat of 200 m. The easternmost part of
the bank experienced a vertical growth, and continued its landward migration (Profile C).
• Between 1983 and 2009, the distal parts of the Riden de la Rade continued to migrate onshore.
The westernmost part moved about 400 m shoreward and underwent a reduction of its width
(Profile A). The easternmost part of the bank progressively merged to the shore, creating a wide
and gently sloping foreshore that gradually widened to about 500 m during the 20th century
(Profile C). In contrast, central segments of the Riden de la Rade revealed a 500 m seaward
movement (Profile B), resulting in a general linearization of the sand bank from the start of
the 1980s.on bathymetric maps (Figure 9a–c). A longshore growth to the east-northeast and to the west-southwest
was responsible for a growth of an 8 km-long bank to a 15 km-long sediment body (Figure 9, Profile R).
The lengthening of the bank was accompanied by an elevation of the crest (Figure 5) with a vertical
sediment gain of 7 to 9 m. The analysis of cross-shore profiles confirms this vertical accretion and reveals
an increase
J. Mar. in 2019,
Sci. Eng. the width
7, 73 of the Riden de la Rade (Figure 9, Profiles A, B and C). Profile C highlights
13 also
of 25 a
coastward migration of 1 km of the bank from the time of the first hydrographic charts in 1861.
Figure 9. (a–c) Nearshore bathymetry offshore of Calais area in 1861, 1910–1911, and 1974–1976
(map projection: Lambert 93). (d–g): Bathymetry profiles evolution from 1861 to 2009; A, B and C are
cross-shore profiles and R is a longshore profile.
Comparatively, the evolution of the Riden de Calais was more moderate (Figure 9). Nevertheless,
an elongation of the bank of more than 1 km towards the northeast, accompanied by a 400 m
width-reduction of the bank, was measured during a period of about 150 years (Profiles B and
C). The differential map (Figure 5) shows that the vertical changes in the interbank area were less than
2.4 m, which is within the vertical margin of error, and for this reason, was considered to be relatively
stable over the study period.J. Mar. Sci. Eng. 2019, 7, 73 14 of 25
4.5. Morphometric and Volume Change
The first part of this work allowed us to examine the morphological evolution of the coastal zone
of Northern France, which was strongly controlled by sand banks that migrated in cross-shore, as well
as in longshore directions. To complete these observations, the volume change calculations of each
sand bank were carried out, to assess the patterns of sand bank morphodynamic. Heights and widths
of sand banks at different dates were also computed as indicators of morphometric changes.
Volume change of the Hills, Braek and Snouw, Dyck banks, and of the Riden de la Rade, were
computed between successive surveys (Figure 10). As previously explained, the Riden de la Rade
experienced growth during the 20th century. Volume change computations show that the bank
underwent sediment accumulation since the end of the 19th century, and maximum accumulation
was recorded between 1930 and 1975, with a gain of +1.79 × 10⁷ m3 (Figure 10c). The Hills bank also
showed an overall positive volume change since the 19th century, with a minimum accumulation of
8.37 × 10⁵ m3 between 1879 and 1894, and an increase in sediment volume reaching +1.45 × 10⁷ m3
between 1930 and 1962 (Figure 10b). These results clearly show that the Riden de la Rade and the Hills
banks acted as sediment sinks during the 20th century.
The evolution of the Braek, Snouw, and Dyck banks was more complex. The volume changes
of the Braek and Snouw banks were computed together, due to their proximity, and the possible
interactions between them both. These two sand banks underwent sediment accumulation during the
J. Mar. Sci. Eng. 2019, 7, x FOR PEER REVIEW 15 of 25
1879–1910 and 1930–1962 time periods, which did not exceed +0.59 × 10⁷ m3 (Figure 10a). In total,
the sediment
sediment budget
budget waswas negative,
negative, with
with a massive
a massive amount
amount sediment
sediment lossloss between
between 1962
1962 andand 2000,
2000, of
of approximately − 3.36 × 10 7 m3 (Figure 10a). The Dyck bank also shows a contrasted evolution,
approximately −3.36 × 10 m (Figure 10a). The Dyck bank also shows a contrasted evolution, alternating
7 3
alternating betweenand
between positive positive and negative
negative sedimentsediment
volume volume variations
variations over
over the the study
study period,period,
withwith
onlyonly
one
7 3
one significant
significant accumulation
accumulation phasephase between
between 19301930
andand 1975,
1975, withwith a gain
a gain of +1.82 × 10×
of +1.82 10
7 m m (Figure
3 (Figure 10d). 10d).
Figure 10. Sediment volume variation for (a) the Braek and the Snouw bank, (b) the Hills bank, (c) the
Figure 10. Sediment volume variation for (a) the Braek and the Snouw bank, (b) the Hills bank, (c) the
Riden de la Rade bank, and (d) the Dyck bank.
Riden de la Rade bank, and (d) the Dyck bank.
Analyses of volume change highlighted that the Hills and the Riden de la Rade sand banks
Analyses of volume change highlighted that the Hills and the Riden de la Rade sand banks had a
had a positive sediment budget from the late 19th century, whereas the Braek, the Snouw, and the
positive sediment budget from the late 19th century, whereas the Braek, the Snouw, and the Dyck banks
Dyck banks are characterized by a more complex degree of evolution, with alternating periods of
are characterized by a more complex degree of evolution, with alternating periods of accretion and
accretion and erosion. In order to investigate possible relationships between the volume change and
erosion. In order to investigate possible relationships between the volume change and the
the morphometric sand bank evolution, and the height/width ratios of sand banks were computed
morphometric sand bank evolution, and the height/width ratios of sand banks were computed and
and compared with bank volume changes. Figure 11 presents the variations in height/width ratio for
compared with bank volume changes. Figure 11 presents the variations in height/width ratio for each
each transect of the Dyck bank and the Riden de la Rade, and their volume changes over time.
transect of the Dyck bank and the Riden de la Rade, and their volume changes over time.positive sediment budget from the late 19th century, whereas the Braek, the Snouw, and the Dyck banks
are characterized by a more complex degree of evolution, with alternating periods of accretion and
erosion. In order to investigate possible relationships between the volume change and the
morphometric sand bank evolution, and the height/width ratios of sand banks were computed and
compared with
J. Mar. Sci. Eng. bank
2019, 7, 73 volume changes. Figure 11 presents the variations in height/width ratio for
15 each
of 25
transect of the Dyck bank and the Riden de la Rade, and their volume changes over time.
Figure
Figure 11.
11.Changes
Changesininheight/width
height/width ratio computed
ratio computedon perpendicular
on perpendiculartransects across
transects (a) the
across (a)Dyck bank
the Dyck
and
bank(b)
andacross the Riden
(b) across de la Rade
the Riden de la (see
RadeFigure 6 for location
(see Figure of transects);
6 for location sediment
of transects); volumevolume
sediment change
(erosion/accumulation) of the (c) of
change (erosion/accumulation) Dyck
the bank andbank
(c) Dyck of theand
(d) of
Riden de la
the (d) Rade.
Riden de la Rade.
For these
For these two sand banks,
banks, when
when thethe height/width ratio increases
height/width ratio increases at one transect,
transect, itit generally
generally
increases at the others (Figure 11a,b), pointing out that the
the morphological
morphological evolution
evolution of
of these
these sediment
sediment
bodies
bodies was
was uniform
uniformatatthe
thesand
sandbank
bankspatial scale.
spatial ForFor
scale. the the
Riden de ladeRade,
Riden the height/width
la Rade, the height/widthratios
increased from 1910
ratios increased fromonward, and nearly
1910 onward, anddoubled at the end
nearly doubled at of the
the 20th
end of century,
the 20thwhich
century,waswhich
consistent
was
consistent with the vertical growth of the bank and the overall positive sediment budget observed
during the 20th century (Figure 11d). More recently, height/width ratios tended to decrease, due to a
widening of the bank atits central and eastern parts (Figure 9e,f). However, in the case of the Dyck
bank, height/width ratios, remained relatively stable over time, except for 1974, when the ratio values
decreased (Figure 11a) after a period of important sediment accumulation (Figure 11c), revealing that
the bank developed and mostly gained sediment through lateral growth, rather than vertical accretion.
These two examples highlight that modes of sand bank growth could radically, differ depending on
bank morphology and distance from the coast.
Height/width ratio is a good indicator of sand bank morphometric evolution, but in order to
investigate how these parameters are related with each other, measurements were taken of samples of
cross-bank transects for every year available (Figure 12a). Figure 12a shows that for these nearshore
sand banks, there was a fairly good relationship between bank width and bank height, with the bank
crest tending to increase with the bank width, but mostly for sand banks (or sand bank sections) with
widthsinvestigate how these parameters are related with each other, measurements were taken of samples of cross-bank transects for every year available (Figure 12a). Figure 12a shows that for these nearshore sand banks, there was a fairly good relationship between bank width and bank height, with the bank crest tending to increase with the bank width, but mostly for sand banks (or sand bank sections) with widths
J. Mar. Sci. Eng. 2019, 7, x FOR PEER REVIEW                                                              17 of 25

change of the bank crest position (∆ crest/year), as measured on individual transects. Figure 13b displays
the results obtained for the three nearshore banks (Riden de la Rade, Hills and Smal banks), and Figure
13a   for
 J. Mar. Sci.aEng.
               sand   bank
                   2019, 7, 73 located further offshore (Dyck bank). The Braek and Snouw banks were 17 ofnot
                                                                                                          25
considered in this analysis, due to their minor cross-shore movements in comparison to the other banks.

     Figure
     Figure 13.
             13. Relationship
                 Relationshipbetween
                                betweenthe
                                        the changes
                                            changes in
                                                     in sand
                                                        sand bank width and the cross-shore
                                                                                cross-shore displacement
                                                                                            displacement of
                                                                                                         of
     bank
     bankcrest
           crestfor
                 for(a)
                     (a)an
                         anoffshore
                            offshorebank
                                     bankand
                                          and(b)
                                              (b)the
                                                  thenearshore
                                                      nearshorebanks.
                                                                banks.

 5. Discussion
       The outer points in Figure 13b concern the Riden de la Rade and are the result of the recent
formation    of this bank,ofwhich
       The digitization           has
                             almost    experienced
                                     two             thehistoric
                                          centuries of    greatest morphological
                                                                 hydrographic      evolution.
                                                                                field sheets hasResults obtained
                                                                                                   allowed  us to
for  this shallow  bank  near Calais clearly show  that the landward   migration  of the bank  is predominantly
 reconstruct the seabed evolution of Northern France’s coastal. The complexity of this coastal zone
associated
 is the resultwith  an increase
                of the  presenceinofbank
                                      manywidth
                                             sandand   thatand
                                                   banks    the their
                                                                 opposite occursto(decrease
                                                                      response      the actioninofwidth) when
                                                                                                    currents anda
seaward
waves. In   displacement   is complexity
              addition, this  observed. Although    the the
                                           arises from   rates of crest movement
                                                             interaction             were moresand
                                                                         between individual       limited for via
                                                                                                       banks  the
Hills and Smal banks, a similar relationship was visible between the bank crest displacement and the
 morphodynamic processes induced by morphological changes. Several previous studies focusing on
changes in bank width. In the case of the Dyck bank, the crest of the bank mainly moved shoreward,
 the evolution of the Flemish sand banks in the North Sea have noted that the sand bank configurations
but the width of the bank either increased or decreased independently of the direction of crest
 recorded on hydrographic charts issued after 1800 differed only slightly from their present-day
movement (Figure 13a). When considering only the three nearshore banks, the rate of bank crest
 shape [1,61,62]. From these observations, it was generally concluded that the Flemish banks underwent
displacement showed a very strong correlation with the variation in bank width (a linear regression
 only minor changes during the last centuries. In the present study, a reconstructed historical dataset
coefficient of determination R2 of 0.95, statistically significant 2to the 2σ confidence level, i.e., 95%), with
 spanning almost two centuries over an extensive area (370 km ) was carried out. This data enabled us to
an onshore movement being generally accompanied by a widening of the bank, and a seaward
 confirm that the general orientation and morphology of these sand banks effectively remained relatively
displacement being mostly characterized by a decrease in bank width (Figure 13b). According to these
 constant at a regional scale, however, some distinctive changes were observed. The construction of
results, coastal sand banks seem to have a similar behavior, tending to grow laterally when migrating
 DEMs from the historical hydrographic charts revealed sand bank mobilities that resulted in longshore
onshore, whereas their width generally decrease when a seaward shift in position occurs. Based on the
 and cross-shore migrations which exceeded 1 km in some areas. Our results also suggest that sand
observed evolution of the Dyck bank, banks that are located further offshore display more variable
 bank evolution (i.e., changes in morphology, volume, and location) appears to be related to the position
morphological responses to hydrodynamic forcings.
 and distance (or water depth) of the sand banks relative to the coastline. Changes in sand bank shape
 and
5.     volume can be related to their height/width ratio (Figure 11). The Dyck bank, located 10 km from
   Discussion
 the shoreline, experienced some changes in width variation during its progressive onshore migration
       The digitization
(Figures                 of almostover
            5 and 13). However,     two almost
                                         centuries
                                                 twoof centuries,
                                                        historic hydrographic  field sheets
                                                                   the height/width    ratios has  allowed
                                                                                              of the        us to
                                                                                                      Dyck bank
reconstruct the seabed evolution of Northern France’s coastal. The complexity of this coastal zone is the
 remained relatively constant (Figure 11), indicating a state of morphodynamic equilibrium. This sand
result of the presence of many sand banks and their response to the action of currents and waves. In
 bank was characterized by small changes in volume over most time periods, except during substantial
addition, this complexity arises from the interaction between individual sand banks via
 sediment accumulation between 1933 to 1975 (Figure 10) that resulted in a change of the shape of
morphodynamic processes induced by morphological changes. Several previous studies focusing on
 the bank, essentially in its width rather than its height (Figure 6). Conversely, in the shallower water
the evolution of the Flemish sand banks in the North Sea have noted that the sand bank configurations
 depths of the coastal zone, significant vertical accretion of the sand banks was commonly observed,
 e.g., Hills Bank (Figure 7) and Riden de la Rade (Figure 9), resulting in an increase in the height/width
 ratios (Figure 11).
       Based on the sand bank morphological evolution, variations in the morphometric parameters
(height and width, and height/width ratios) were calculated. Interdependence of morphological
You can also read