Rainier Beach: A Beautiful Safe Place for Youth
←
→
Page content transcription
If your browser does not render page correctly, please read the page content below
Center for Evidence-Based Crime Policy
                 Department of Criminology, Law & Society

Rainier Beach:
A Beautiful Safe Place for Youth

2019 Evaluation Update

Charlotte Gill, PhD
Heather Prince, MS

Report prepared for the City of Seattle

April 30, 2020

Contract Number: DC19-1603
The Center for Evidence-Based Crime Policy (CEBCP) in the Department of Criminology, Law and Society at George Mason University seeks to make scientific research a key component in decisions about crime and justice policies. The CEBCP carries out this mission by advanc- ing rigorous studies in criminal justice and criminology through research-practice collabora- tions, and proactively serving as an informational and translational link to practitioners and the policy community. Learn more about our work at http://cebcp.org and about the De- partment of Criminology, Law and Society at http://cls.gmu.edu. Charlotte Gill is Deputy Director of the Center for Evidence-Based Crime Policy and Associate Professor in the Department of Criminology, Law and Society at George Mason University. Heather Prince is a Graduate Research Assistant in the Center for Evidence-Based Crime Pol- icy and a doctoral student in the Department of Criminology, Law and Society at George Mason University. This evaluation update was funded by the City of Seattle Human Services Department, Con- tract # DC19-1603. Prior support for this research through 2016 was provided by the Bureau of Justice Assistance, U.S. Department of Justice (Byrne Criminal Justice Innovation grant # 2012-AJ-BX-0006) and funding from 2016 to 2018 was provided by the City of Seattle Human Services Department (Contract #s DC16-1603, DC17-1603, and DC18-1603). The opinions, findings, and conclusions or recommendations expressed in this report are those of the au- thors and do not necessarily reflect those of the U.S. Department of Justice, the Bureau of Justice Assistance, or the City of Seattle.
Contents

List of Tables                                                                                                                                                            ii

List of Figures                                                                                                                                                            v

Summary of Findings                                                                                                                                                       vi

1   Background                                                                                                                                                            1

2   2019 Intervention Update                                                                                                                                              2
    2.1 Intervention summary . . . . . . . . . . . . . . . . . . . . . . . . . . . . . . . . . . . . . . .                                                                2

3   2019 Evaluation Update: Summary of Methods                                                                                                                            5
    3.1 Changes to police data in 2019 . . . . . .       .   .   .   .   .   .   .   .   .   .   .   .   .   .   .   .   .   .   .   .   .   .   .   .   .   .   .   .    6
    3.2 Police crime data definitions . . . . . . . .    .   .   .   .   .   .   .   .   .   .   .   .   .   .   .   .   .   .   .   .   .   .   .   .   .   .   .   .    7
    3.3 Community survey . . . . . . . . . . . . .       .   .   .   .   .   .   .   .   .   .   .   .   .   .   .   .   .   .   .   .   .   .   .   .   .   .   .   .    8
    3.4 Analytic strategy . . . . . . . . . . . . . .    .   .   .   .   .   .   .   .   .   .   .   .   .   .   .   .   .   .   .   .   .   .   .   .   .   .   .   .    9

4   Updated Evaluation Findings                                                                                                                                          10
    4.1 The hot spots continue to get less “hot” over time, but we should not lose focus on small
        changes . . . . . . . . . . . . . . . . . . . . . . . . . . . . . . . . . . . . . . . . . . . . . . .                                                            10
    4.2 Calls for service and youth incidents were higher in the Rainier Beach hot spots while the
        interventions were active, but violent and property crimes were lower . . . . . . . . . . .                                                                      14
    4.3 Higher rates of calls and offenses in the Rainier Beach hot spots may be a result of people
        calling the police more . . . . . . . . . . . . . . . . . . . . . . . . . . . . . . . . . . . . . . .                                                            15
    4.4 Recognition of and satisfaction with ABSPY interventions have decreased in Rainier Beach                                                                         15
    4.5 Most people in Rainier Beach believe crime has gotten better in the past year, but fewer
        said so than last year . . . . . . . . . . . . . . . . . . . . . . . . . . . . . . . . . . . . . . . .                                                           16
    4.6 Social cohesion fell slightly, but there was a small improvement in collective efficacy . . .                                                                    16
    4.7 People’s impressions of the police in Rainier Beach are less positive than last year . . . . .                                                                   17

5   Conclusions and Recommendations                                                                                                                                      18
    5.1 Recommendations for 2020 . . . . . . . . . . . . . . . . . . . . . . . . . . . . . . . . . . . .                                                                 20

Statistical Appendix                                                                                                                                                     A.1

                                                         i
List of Tables
A1 Number of surveys completed, by site and wave . . . . . . . . . . . . . . . . . . . . . . . . A.1
A2 Sample characteristics by wave and by group at baseline (wave 1) . . . . . . . . . . . . . . A.2
A3 Descriptive statistics for survey outcomes . . . . . . . . . . . . . . . . . . . . . . . . . . . . A.4
A4 Difference-in-differences Poisson regression on calls for service . . . . . . . . . . . . . . . A.5
A5 Difference-in-differences Poisson regression on selected offenses . . . . . . . . . . . . . . A.6
A6 Difference-in-differences Poisson regression on NIBRS offense categories . . . . . . . . . . A.7
A7 Survey participants who noticed ABSPY interventions in Rainier Beach . . . . . . . . . . . A.8
A8 Satisfaction with ABSPY interventions in Rainier Beach . . . . . . . . . . . . . . . . . . . . A.9
A9 Has crime gotten better, worse, or stayed the same in the past year? (Rainier Beach only) . A.10
A10 Has crime gotten better, worse, or stayed the same in the past year? (Rainier Beach vs.
comparison spots) . . . . . . . . . . . . . . . . . . . . . . . . . . . . . . . . . . . . . . . . . A.11
A11 Perceptions of safety, crime, and disorder (Rainier Beach only) . . . . . . . . . . . . . . . . A.12
A12 Perceptions of safety, crime, and disorder (Rainier Beach vs. comparison spots) . . . . . . A.13
A13 Social cohesion and collective efficacy (Rainier Beach only) . . . . . . . . . . . . . . . . . . A.14
A14 Social cohesion and collective efficacy (Rainier Beach vs. comparison spots) . . . . . . . . A.15
A15 Perceptions of police (Rainier Beach only) . . . . . . . . . . . . . . . . . . . . . . . . . . . . A.16
A16 Perceptions of police (Rainier Beach vs. comparison spots) . . . . . . . . . . . . . . . . . . A.17
List of Figures
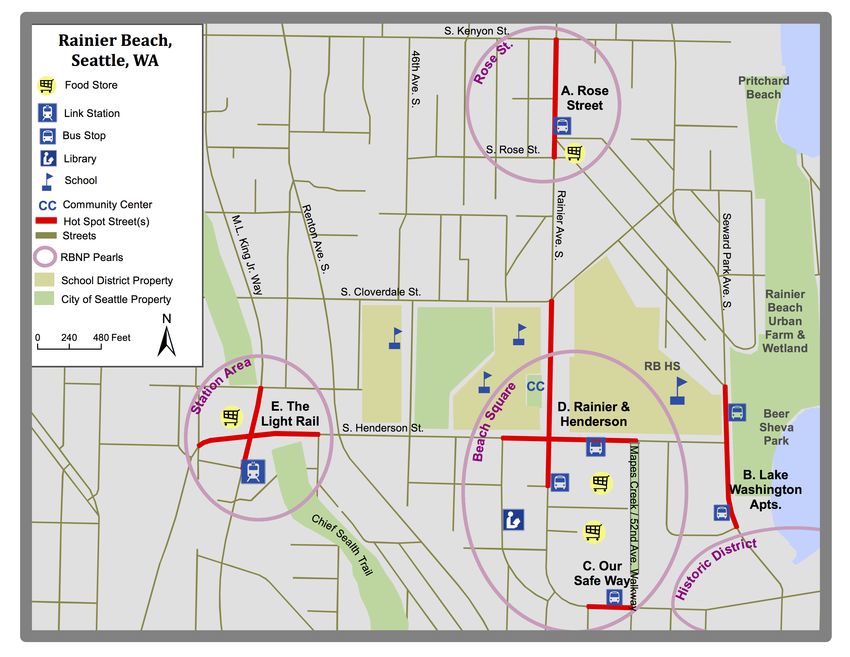
1 Rainier Beach hot spots identified for ABSPY intervention . . . . . . . . . . . . . . . . . . . 1
2 Offenses and incidents in all Rainier Beach hot spots, September 2011-August 2019 . . . 10
3 Offenses and incidents at Rose Street, September 2011-August 2019 . . . . . . . . . . . . 11
4 Offenses and incidents at Rainier & Henderson, September 2011-August 2019 . . . . . . . 12
5 Offenses and incidents at Light Rail, September 2011-August 2019 . . . . . . . . . . . . . 13
6 Offenses and incidents at Lake Washington, September 2011-August 2019 . . . . . . . . . 13
7 Offenses and incidents at Safeway, September 2011-August 2019 . . . . . . . . . . . . . . 14
A1 Percent change in calls for service in hot spots, Rainier Beach, and South Precinct, pre/post
May 2014 . . . . . . . . . . . . . . . . . . . . . . . . . . . . . . . . . . . . . . . . . . . . . . A.18
A2 Percent change in offenses in hot spots, Rainier Beach, and South Precinct, pre/post May
2014 . . . . . . . . . . . . . . . . . . . . . . . . . . . . . . . . . . . . . . . . . . . . . . . . . A.18
A3 Percent change in youth offenses in hot spots, Rainier Beach, and South Precinct, pre/post
May 2014 . . . . . . . . . . . . . . . . . . . . . . . . . . . . . . . . . . . . . . . . . . . . . . A.19
A4 Percent change in violent offenses in hot spots, Rainier Beach, and South Precinct, pre/post
May 2014 . . . . . . . . . . . . . . . . . . . . . . . . . . . . . . . . . . . . . . . . . . . . . . A.19
A5 Percent change in NIBRS Group A Person offenses in hot spots, Rainier Beach, and South
Precinct, pre/post May 2014 . . . . . . . . . . . . . . . . . . . . . . . . . . . . . . . . . . . . A.20
A6 Percent change in NIBRS Group A Property offenses in hot spots, Rainier Beach, and South
Precinct, pre/post May 2014 . . . . . . . . . . . . . . . . . . . . . . . . . . . . . . . . . . . . A.20
A7 Percent change in NIBRS Group B offenses in hot spots, Rainier Beach, and South Precinct,
pre/post May 2014 . . . . . . . . . . . . . . . . . . . . . . . . . . . . . . . . . . . . . . . . . A.21
A8 Percent change in calls for service at Rose Street and its comparison site, pre/post May 2014A.21
A9 Percent change in all offenses at Rose Street and its comparison site, pre/post May 2014 . A.22
iiRainier Beach: A Beautiful Safe Place for Youth 2019 Update
A10 Percent change in youth offenses at Rose Street and its comparison site, pre/post May 2014A.22
A11 Percent change in violent offenses at Rose Street and its comparison site, pre/post May
2014 . . . . . . . . . . . . . . . . . . . . . . . . . . . . . . . . . . . . . . . . . . . . . . . . . A.23
A12 Percent change in NIBRS Group A person offenses at Rose Street and its comparison site,
pre/post May 2014 . . . . . . . . . . . . . . . . . . . . . . . . . . . . . . . . . . . . . . . . . A.23
A13 Percent change in NIBRS Group A property offenses at Rose Street and its comparison site,
pre/post May 2014 . . . . . . . . . . . . . . . . . . . . . . . . . . . . . . . . . . . . . . . . . A.24
A14 Percent change in NIBRS Group B offenses at Rose Street and its comparison site, pre/post
May 2014 . . . . . . . . . . . . . . . . . . . . . . . . . . . . . . . . . . . . . . . . . . . . . . A.24
A15 Percent change in calls for service at Rainier & Henderosn and its comparison site, pre/post
May 2014 . . . . . . . . . . . . . . . . . . . . . . . . . . . . . . . . . . . . . . . . . . . . . . A.25
A16 Percent change in all offenses at Rainier & Henderson and its comparison site, pre/post
May 2014 . . . . . . . . . . . . . . . . . . . . . . . . . . . . . . . . . . . . . . . . . . . . . . A.25
A17 Percent change in youth offenses at Rainier & Henderson and its comparison site, pre/post
May 2014 . . . . . . . . . . . . . . . . . . . . . . . . . . . . . . . . . . . . . . . . . . . . . . A.26
A18 Percent change in violent offenses at Rainier & Henderson and its comparison site, pre/post
May 2014 . . . . . . . . . . . . . . . . . . . . . . . . . . . . . . . . . . . . . . . . . . . . . . A.26
A19 Percent change in NIBRS Group A person offenses at Rainier & Henderson and its compar-
ison site, pre/post May 2014 . . . . . . . . . . . . . . . . . . . . . . . . . . . . . . . . . . . . A.27
A20 Percent change in NIBRS Group A property offenses at Rainier & Henderson and its com-
parison site, pre/post May 2014 . . . . . . . . . . . . . . . . . . . . . . . . . . . . . . . . . . A.27
A21 Percent change in NIBRS Group B offenses at Rainier & Henderson and its comparison site,
pre/post May 2014 . . . . . . . . . . . . . . . . . . . . . . . . . . . . . . . . . . . . . . . . . A.28
A22 Percent change in calls for service at Light Rail and its comparison site, pre/post May 2014 A.28
A23 Percent change in all offenses at Light Rail and its comparison site, pre/post May 2014 . . A.29
A24 Percent change in youth offenses at Light Rail and its comparison site, pre/post May 2014 A.29
A25 Percent change in violent offenses at Light Rail and its comparison site, pre/post May 2014 A.30
A26 Percent change in NIBRS Group A person offenses at Light Rail and its comparison site,
pre/post May 2014 . . . . . . . . . . . . . . . . . . . . . . . . . . . . . . . . . . . . . . . . . A.30
A27 Percent change in NIBRS Group A property offenses at Light Rail and its comparison site,
pre/post May 2014 . . . . . . . . . . . . . . . . . . . . . . . . . . . . . . . . . . . . . . . . . A.31
A28 Percent change in NIBRS Group B offenses at Light Rail and its comparison site, pre/post
May 2014 . . . . . . . . . . . . . . . . . . . . . . . . . . . . . . . . . . . . . . . . . . . . . . A.31
A29 Percent change in calls for service at Lake Washington and its comparison site, pre/post
May 2014 . . . . . . . . . . . . . . . . . . . . . . . . . . . . . . . . . . . . . . . . . . . . . . A.32
A30 Percent change in all offenses at Lake Washington and its comparison site, pre/post May
2014 . . . . . . . . . . . . . . . . . . . . . . . . . . . . . . . . . . . . . . . . . . . . . . . . . A.32
A31 Percent change in youth offenses at Lake Washington and its comparison site, pre/post
May 2014 . . . . . . . . . . . . . . . . . . . . . . . . . . . . . . . . . . . . . . . . . . . . . . A.33
A32 Percent change in violent offenses at Lake Washington and its comparison site, pre/post
May 2014 . . . . . . . . . . . . . . . . . . . . . . . . . . . . . . . . . . . . . . . . . . . . . . A.33
A33 Percent change in NIBRS Group A person offenses at Lake Washington and its comparison
site, pre/post May 2014 . . . . . . . . . . . . . . . . . . . . . . . . . . . . . . . . . . . . . . A.34
A34 Percent change in NIBRS Group A property offenses at Lake Washington and its compari-
son site, pre/post May 2014 . . . . . . . . . . . . . . . . . . . . . . . . . . . . . . . . . . . . A.34
A35 Percent change in NIBRS Group B offenses at Lake Washington and its comparison site,
pre/post May 2014 . . . . . . . . . . . . . . . . . . . . . . . . . . . . . . . . . . . . . . . . . A.35
A36 Percent change in calls for service at Safeway and its comparison site, pre/post May 2014 A.36
iiiRainier Beach: A Beautiful Safe Place for Youth 2019 Update
A37 Percent change in all offenses at Safeway and its comparison site, pre/post May 2014 . . . A.36
A38 Percent change in youth offenses at Safeway and its comparison site, pre/post May 2014 . A.37
A39 Percent change in violent offenses at Safeway and its comparison site, pre/post May 2014 A.37
A40 Percent change in NIBRS Group A person offenses at Safeway and its comparison site,
pre/post May 2014 . . . . . . . . . . . . . . . . . . . . . . . . . . . . . . . . . . . . . . . . . A.38
A41 Percent change in NIBRS Group A property offenses at Safeway and its comparison site,
pre/post May 2014 . . . . . . . . . . . . . . . . . . . . . . . . . . . . . . . . . . . . . . . . . A.38
A42 Percent change in NIBRS Group B offenses at Safeway and its comparison site, pre/post
May 2014 . . . . . . . . . . . . . . . . . . . . . . . . . . . . . . . . . . . . . . . . . . . . . . A.39
A43 Calls for service in treatment and comparison sites, January 2011-August 2019 . . . . . . A.40
A44 Predicted number of calls by treatment assignment and intervention status . . . . . . . . A.40
A45 Offenses in treatment and comparison sites, January 2011-August 2019 . . . . . . . . . . A.41
A46 Predicted number of offenses by treatment assignment and intervention status . . . . . . A.41
A47 Youth offenses in treatment and comparison sites, January 2011-August 2019 . . . . . . . A.42
A48 Predicted number of youth offenses by treatment assignment and intervention status . . A.42
A49 Violent offenses in treatment and comparison sites, January 2011-August 2019 . . . . . . A.43
A50 Predicted number of violent offenses by treatment assignment and intervention status . A.43
A51 NIBRS Group A person offenses in treatment and comparison sites, January 2011-August
2019 . . . . . . . . . . . . . . . . . . . . . . . . . . . . . . . . . . . . . . . . . . . . . . . . . A.44
A52 Predicted number of NIBRS Group A person offenses by treatment assignment and inter-
vention status . . . . . . . . . . . . . . . . . . . . . . . . . . . . . . . . . . . . . . . . . . . . A.44
A53 NIBRS Group A property offenses in treatment and comparison sites, January 2011-August
2019 . . . . . . . . . . . . . . . . . . . . . . . . . . . . . . . . . . . . . . . . . . . . . . . . . A.45
A54 Predicted number of NIBRS Group A property offenses by treatment assignment and in-
tervention status . . . . . . . . . . . . . . . . . . . . . . . . . . . . . . . . . . . . . . . . . . A.45
A55 NIBRS Group B offenses in treatment and comparison sites, January 2011-August 2019 . . A.46
A56 Predicted number of NIBRS Group B offenses by treatment assignment and intervention
status . . . . . . . . . . . . . . . . . . . . . . . . . . . . . . . . . . . . . . . . . . . . . . . . . A.46
A57 Noticed improvements to businesses, 2016 vs. 2019 . . . . . . . . . . . . . . . . . . . . . . A.47
A58 Noticed Corner Greeters, 2016 vs. 2019 . . . . . . . . . . . . . . . . . . . . . . . . . . . . . A.47
A59 Noticed Safe Passage, 2016 vs. 2019 . . . . . . . . . . . . . . . . . . . . . . . . . . . . . . . A.48
A60 Satisfied with improvements to businesses, 2016 vs. 2019 . . . . . . . . . . . . . . . . . . . A.48
A61 Satisfied with Corner Greeters, 2016 vs. 2019 . . . . . . . . . . . . . . . . . . . . . . . . . . A.49
A62 Satisfied with Safe Passage, 2016 vs. 2019 . . . . . . . . . . . . . . . . . . . . . . . . . . . . A.49
A63 Noticed the Be3 , 2019 . . . . . . . . . . . . . . . . . . . . . . . . . . . . . . . . . . . . . . . A.50
A64 Noticed ABSPY, 2019 . . . . . . . . . . . . . . . . . . . . . . . . . . . . . . . . . . . . . . . . A.50
A65 Satisfied with the Be3 , 2019 . . . . . . . . . . . . . . . . . . . . . . . . . . . . . . . . . . . . A.51
A66 Satisfied with ABSPY, 2019 . . . . . . . . . . . . . . . . . . . . . . . . . . . . . . . . . . . . . A.51
A67 In the past year, has crime gotten worse, stayed the same, or gotten better? (Rainier Beach
hot spots) . . . . . . . . . . . . . . . . . . . . . . . . . . . . . . . . . . . . . . . . . . . . . . A.52
A68 In the past year, has crime gotten worse, stayed the same, or gotten better? . . . . . . . . A.52
A69 Change in perceived likelihood of crime in the Rainier Beach hot spots, 2014-2019 . . . . A.53
A70 Change in perceived likelihood of crime in the hot spots and comparison spots, 2014-2019 A.53
A71 Change in perceived frequency of disorder in the Rainier Beach hot spots, 2014-2019 . . . A.54
A72 Change in perceived frequency of disorder in the hot spots and comparison spots, 2014-
2019 . . . . . . . . . . . . . . . . . . . . . . . . . . . . . . . . . . . . . . . . . . . . . . . . . A.54
A73 Change in feelings of safety in the Rainier Beach hot spots, 2014-2019 . . . . . . . . . . . A.55
A74 Change in feelings of safety in the hot spots and comparison spots, 2014-2019 . . . . . . A.55
ivRainier Beach: A Beautiful Safe Place for Youth 2019 Update
A75 Change in social cohesion in the Rainier Beach hot spots, 2014-2019 . . . . . . . . . . . . A.56
A76 Change in social cohesion in the hot spots and comparison spots, 2014-2019 . . . . . . . A.56
A77 Change in collective efficacy in the Rainier Beach hot spots, 2014-2019 . . . . . . . . . . . A.57
A78 Change in collective efficacy in the hot spots and comparison spots, 2014-2019 . . . . . . A.57
A79 Participation in community activities in past year in hot spots and comparison spots, 2019 A.58
A80 Change in satisfaction with police in the Rainier Beach hot spots, 2014-2019 . . . . . . . . A.58
A81 Change in satisfaction with police in the hot spots and comparison spots, 2014-2019 . . . A.59
A82 Change in perceived police legitimacy in the Rainier Beach hot spots, 2014-2019 . . . . . A.59
A83 Change in perceived police legitimacy in the hot spots and comparison spots, 2014-2019 A.60
A84 Overall satisfaction with police in the hot spots and comparison spots, 2019 . . . . . . . . A.60
A85 Direct contact with police in the hot spots and comparison spots, 2019 . . . . . . . . . . . A.61
A86 Change in perceived frequency of police activity in the Rainier Beach hot spots, 2014-2019 A.61
A87 Change in perceived frequency of police activity in the hot spots and comparison spots,
2014-2019 . . . . . . . . . . . . . . . . . . . . . . . . . . . . . . . . . . . . . . . . . . . . . . A.62
vSummary of Findings
What is Rainier Beach: A Beautiful Safe Place for Youth?
Rainier Beach: A Beautiful Safe Place for Youth (ABSPY) is an innovative community-led, place-
based violence prevention initiative. The goal of the program is to reduce youth victimization
and crime in the Rainier Beach neighborhood. The program is named for the vision set out
by the Rainier Beach community in its Neighborhood Plan Update, which is to make Rainier
Beach a Beautiful Safe Place. ABSPY is happening in five small groups of street blocks in the
neighborhood—“hot spots”—where about half of all youth crime incidents in Rainier Beach
happened in 2012. The five hot spots are Rose Street, Rainier and Henderson, Rainier Beach Light
Rail Station, Lake Washington, and Our Safe Way. This report updates our original 2016 evaluation
report and 2017 update.
ABSPY Background
ABSPY is based on a number of research studies, including one from Seattle by David Weisburd
and his colleagues, showing that about half of all crime in cities comes from a very small number—
typically about 5 percent—of street blocks. Crime involving young people is even more likely to
come from a small number of places. Research shows that police efforts to reduce crime at hot
spots through crackdowns and arrests are effective at reducing crime, but arrest and prosecution
can increase the chance of reoffending among high-risk youth. ABSPY focuses on non-arrest
strategies to reduce crime, such as building community leadership and capacity to help solve
problems and addressing environmental risk factors for crime to promote community safety.
ABSPY was originally funded by a $1 million grant from the Byrne Criminal Justice Innovation
Program, an initiative of the U.S. Department of Justice’s Bureau of Justice Assistance, awarded
in 2012, and has been funded by the City of Seattle since 2016. The Byrne Criminal Justice
Innovation Program supports partnerships between cities, communities, and researchers to
develop community-led, place-based, data-driven problem-solving efforts. ABSPY is advised by a
Core Team including representatives from the City of Seattle, the Seattle Neighborhood Group,
Seattle Police Department, the Boys and Girls Club of King County, Seattle Public Schools, and the
Rainier Beach Action Coalition. However, what makes ABSPY unique is that community members
in Rainier Beach itself have taken the lead in developing evidence-informed strategies to address
the root causes of youth crime in the neighborhood.
Community-Led Problem Solving
From 2013 through 2016, in an effort overseen by the Core Team, community members from the
five Rainier Beach hot spots took the lead in developing evidence-informed strategies to address
the root causes of youth crime in the neighborhood. These interventions were tailored to the spe-
cific conditions in each hot spot, and continue to be regularly updated and adjusted based on new
data and changing conditions in the hot spots. ABSPY’s signature interventions include:
• Corner Greeter events, led by the Rainier Beach Action Coalition, in which young people
from the neighborhood set up stations offering refreshments, information, and fun activities
in each hot spot to engage community members and “activate” places that were previously
considered to be unsafe.
• Safe Passage, led by the Boys and Girls Club of King County, which provides guardianship,
supervision, and encouragement to young people as they leave school.
vi• Business engagement, coordinated by Seattle Neighborhood Group and supported by the
Rainier Beach Merchants Association, Seattle Police Department, and local community and
economic development organizations. This intervention focuses on learning about the con-
cerns facing local businesses, building relationships between businesses and with the police,
and increasing business owners’ ability to prevent and report crime.
• Crime Prevention Through Environmental Design (CPTED) interventions and resources,
applied to both public and private property, to improve design, layout, and place manage-
ment.
• Positive Behavioral Interventions and Supports (PBIS) in both school and community
settings, overseen by Seattle Public Schools and the ABSPY Core Team, to collaboratively set
behavioral expectations for young people, reward good behavior, and support youth in need
of services.
Updated Evaluation Findings
The Center for Evidence-Based Crime Policy at George Mason University is the research partner for
ABSPY. We tracked calls for service and reported crime in the five hot spots from September 2011
to August 2019. We paired each Rainier Beach hot spot with a comparison hot spot—a similar
location elsewhere in Seattle Police Department’s South Precinct—and assessed crime rates in the
Rainier Beach hot spots and neighborhood compared to trends in the South Precinct. We have
also conducted five waves of community surveys in the hot spots and comparison areas—one
in the summer of 2014 before the ABSPY interventions began (Wave 1), and follow-ups in the
summers of 2016 (Wave 2), 2017 (Wave 3), 2018 (Wave 4), and 2019 (Wave 5).
Our updated findings for 2019 show that ABSPY continues to have a number of positive
effects, but there has been some slippage that needs to be addressed in 2020. We find that:
• The hot spots have continued to become less “hot” over time, but there has been a slight
uptick in youth crime at Rainier and Henderson, and violent and minor offenses are still much
higher at Safeway than they were pre-ABSPY. However, youth crime has almost disappeared
at Rose Street and the Light Rail.
• Calls for service and crime incidents were higher in the Rainier Beach hot spots while the
ABSPY interventions were active. However, this may be a result of people calling the police
more (i.e. getting more engaged in crime prevention efforts) rather than a backfire effect.
This is a common finding in evaluations of interventions that aim to increase community
involvement in crime prevention.
• Recognition of and satisfaction with ABSPY interventions have decreased in Rainier Beach.
Only about half of people we surveyed in Rainier Beach were aware of ABSPY and its sig-
nature interventions, and satisfaction levels among those who had noticed the interven-
tions was much lower than in previous years. However, satisfaction with the signature
interventions—business improvements, Corner Greeters, and Safe Passage—is still in the
70-80% range.
vii• Most people in Rainier Beach believe crime has gotten better in the past year, but fewer said
so than last year. However, the number of people who said crime had gotten better in the
past year was still significantly higher than it was in 2014 before ABSPY began. Feelings of
safety also continue to steadily improve in Rainier Beach.
• Social cohesion fell slightly this year after improving steadily since ABSPY began, but we
continued to see small improvements in collective efficacy.
• People’s impressions of the police in Rainier Beach were less positive than last year, but re-
spondents said they saw police activity more frequently. This finding may have been affected
by high-profile crime incidents in the neighborhood in 2019 as well as lower engagement
with SPD on the Core Team.
Recommendations for 2020
It is not surprising that interventions intended to create sustainable change at long-term hot spots
of crime can take many years to work. However, the advantage of regular data analysis and evalu-
ation is the ability to catch potential problems early and make course corrections. We recommend
the following focus areas in 2020 to address some of the less positive trends:
• The ABSPY Core Team should continue to consider its role and membership. In particu-
lar, it may be important to revitalize the Implementation Team to ensure that interventions
are being delivered with appropriate dosage and intensity. We recommend engaging with
other community partners in Rainier Beach to share the effort and maximize impact.
• Focus on re-engaging the community and increasing community representation. En-
suring authentic community representation on the Core Team will ensure that ABSPY inter-
ventions continue to reflect community priorities.
• Re-engage SPD in ABSPY and the Core Team. Ensuring Seattle Police Department has con-
tinued representation on the Core Team may assist with relationship-building and improve
community perceptions of the police.
• Consider whether changes need to be made to the focus hot spots. Given that youth
crime has dwindled so much at Rose Street and the Light Rail, the Core Team should consider
whether to discontinue or reduce ABSPY efforts at these locations to focus on addressing
slippage or sustaining successes at the other hot spots.
• Adapt ABSPY and its evaluation strategy in light of the COVID-19 pandemic. While this
recommendation does not stem from our 2019 analysis, the emergence of the COVID-19
pandemic in the first quarter of 2020 presents unprecedented challenges for the implemen-
tation and evaluation of community-led crime prevention efforts. We will need to focus on
how ABSPY operates and responds to community needs amid social distancing and other
disease prevention efforts, and how to assess its effect given the pandemic’s likely impact
on crime rates.
viiiRainier Beach: A Beautiful Safe Place for Youth 2019 Update
1 Background
This report updates the original Rainier Beach: A Beautiful Safe Place for Youth (ABSPY) Final Evaluation
Report (Gill et al., 2016) and subsequent evaluation updates (Gill et al., 2018; Gill & Vitter, 2017) with
new findings from our community survey and crime analysis in 2019. ABSPY is a community-led, place-
based, data-driven, non-arrest based collaboration focused on preventing crime in five juvenile and
youth crime hot spots in the Rainier Beach neighborhood of Seattle (see Figure 1). ABSPY builds on sev-
eral neighborhood and City processes, including the 2011 Rainier Beach Neighborhood Plan Update (RB-
NPU) and the Seattle Youth Violence Prevention Initiative, and is grounded in research evidence showing
that crime—especially crime involving juveniles and youth1 —is highly concentrated at small places (e.g.
Weisburd, 2015; Weisburd et al., 2004; Weisburd et al., 2009). This evidence indicates that policing and
crime prevention efforts focused at these hot spots are effective (Braga et al., 2014; Lum et al., 2011;
Weisburd & Majmundar, 2018). However, proactive policing approaches that focus on law enforcement
strategies such as crackdowns and “busts” to clear offenders from high-crime areas may not be suitable
at hot spots of youth crime, since young people who are arrested and processed through the juvenile
justice system—especially those involved in less serious crimes—are more likely to reoffend than those
who are diverted. Research suggests that community-led, non-arrest strategies may be more appropriate
at such places.
Figure 1: Rainier Beach hot spots identified for ABSPY intervention
1
ABSPY defines “youth” as individuals aged 25 and under. While the juvenile justice system focuses on young people under the
age of 18, ABSPY builds on increasing recognition by researchers and policy makers that the brain does not fully develop until
around age 25, directly impacting decision-making and risky behavior (e.g. Steinberg, 2008).
1Rainier Beach: A Beautiful Safe Place for Youth 2019 Update
The RBNPU explicitly called for a community-led hot spots approach to address crime and improve neigh-
borhood safety in Rainier Beach, which led to the development of ABSPY. The planning process began
in 2012 with the development of a successful $1 million grant proposal to the U.S. Department of Jus-
tice, Bureau of Justice Assistance’s Byrne Criminal Justice Innovation Program (renamed “Innovations in
Community Based Crime Reduction” in 2017). Implementation began in October 2013 with a problem-
solving process undertaken by Community Task Force (CTF) teams representing each of the five hot spots,
and the subsequent development and implementation of a suite of signature interventions (see below).
Federal funding continued through September 2016. Beginning in January 2016, the City of Seattle’s Hu-
man Services Department also began to fund implementation and evaluation on an annual basis. In 2019
ABSPY received funding through 2020 from the city’s Department of Neighborhoods. ABSPY planning
and implementation is overseen by a cross-sector Core Team and supported by a range of community
intervention partners. A detailed description of ABSPY’s history, including key partners, hot spot identi-
fication process, problem-solving process, and intervention development, can be found in the original
evaluation report (Gill et al., 2016).
2 2019 Intervention Update
Our 2017 evaluation update shows the timeline of ABSPY interventions from October 2013, the beginning
of the planning phase, to October 2017 (Gill & Vitter, 2017, p. 3). The interventions continued through
the last few months of 2017 and were consistently implemented through 2018 and 2019. Over time, in-
terventions and focus areas have developed (as described below) in response to data and experiences.
However, funding was not received in 2019 for administration for Safe Passage (the Safe Passage program
itself continued) and a new CPTED youth stewardship program.
The ABSPY initiative faced several challenges in 2019, including a continued focus on relations and power
dynamics on the Core Team (for example, the role of institutional versus grass-roots community partners;
see our 2018 update (Gill et al., 2018) for more details); and gun violence in the Rainier Beach neighbor-
hood, including the high-profile Pritchard Beach shooting in May. Both of these challenges led to ques-
tions about the role of ABSPY in Rainier Beach, particularly around how the team should respond to crisis
situations and how to balance crisis response with year-round community advocacy and support. How-
ever, there were also a number of success stories this year, including two positive meetings with Seattle’s
Mayor, Jenny Durkan, which resulted in sustained funding for ABSPY through 2020.
2.1 Intervention summary
2.1.1 Coordination and planning
The Core Team continues to meet on a monthly basis to oversee ABSPY and related initiatives. Key Core
Team activities and decisions in 2019 included:
• A “messaging exercise” in February, in which Core Team members discussed what ABSPY is and
should be about and how partners should talk about and promote ABSPY for consistency and im-
pact. The Core Team agreed on several core components of ABSPY that should be highlighted for
consistent messaging, including: a public safety action team with a non-arrest focus; place- and
2Rainier Beach: A Beautiful Safe Place for Youth 2019 Update
individual-based activities and interventions; data-driven; and centered on PBIS values.
• Meetings with Mayor Durkan in March and April. These meetings initially focused on the co-
design process for a request for proposals (RFP) that took place toward the end of 2018. Through
this process, community partners gave input to develop funding priorities for 2020, which would
lead to the City of Seattle issuing a RFP to which ABSPY would apply for continued funding. How-
ever, Core Team and Rainier Beach community members were concerned about the lack of empha-
sis on place-based approaches in the co-design process. The subsequent discussions with the City
led to the decision to fund ABSPY in 2020 separately from the RFP and move funding responsibility
to the Department of Neighborhoods, better reflecting the place-based focus.
• Following up on previous retreats and peacemaking processes focused on Core Team relations and
responsibilities, a further one-day retreat was held in July. The key needs and action items arising
from the retreat were to:
– clarify and revisit decision-making processes agreed upon in 2018;
– transition to a policy-level role focused on systems change rather than being “in the weeds”
and focused on programmatic decision-making;
– clarify the purpose of Core Team meetings and how data are used for accountability
– ensure the initiative is truly community-led: although the voting structure was changed, in-
volvement from different community partners is still limited—especially community mem-
bers who are most impacted by the issues ABSPY focuses on.
• A renewed focus on hot spot activation. Lake Washington has been a specific focus area for several
years after our initial evaluation results showed that ABSPY was not having as much of an impact
there compared to other hot spots. However, the Core Team recognized that this may have led
to insufficient focus on other hot spots, especially Safeway and the Light Rail. Safeway has been a
challenge because of decisions by management to have young people arrested rather than work-
ing with ABSPY’s non-arrest approach. However, there have been a number of positive efforts to
activate all the hot spots and reach out to a broader number of partners, including the second “Get
Down” in October and November’s Rainier Beach United event, which brought together different
community partners who may not have engaged with ABSPY before to find out about different
work that is being done and build awareness and alignment. About 50 people attended Rainier
Beach United, representing an inclusive cross-section of people and organizations doing work in
Rainier Beach. Participants expressed a desire to keep the effort going in 2020.
2.1.2 Safe Passage/Campus Safety Initiative
Safe Passage is one of the flagship initiatives of ABSPY. Overseen by the Boys and Girls Club of King
County, Safe Passage provides supervision, guardianship, and a friendly face on the streets in the af-
ternoons (between 1 and 6pm) when children are leaving schools on the Rainier and Henderson campus
and the risk of youth crime at this hot spot is highest. Safe Passage staff work for the Boys and Girls Club
and are community members who have grown up in the neighborhood. They are easily recognizable by
their bright blue jackets or t-shirts with the “Be Safe” slogan, which (along with “Be Safe Bro!”) has become
3Rainier Beach: A Beautiful Safe Place for Youth 2019 Update
a popular greeting between the Safe Passage team and local young people. While Safe Passage staff are
authorized to break up fights, they primarily focus on providing a positive presence and engaging young
people as they walk home or head to the bus stop.
The Safe Passage initiative continues to engage young people beyond school times by supporting lunch
programs and providing participation and support to community events such as the second “Get Down”
pre-game celebration at Rainier Beach High School, which was held at Homecoming in October 2019.
The Safe Passage team also participated in a SMART Moves program at Lake Washington apartments,
which aims to build relationships between the team and young residents through field trips and other
activities. The team plans to add Safeway and Lake Washington to its regular routes.
2.1.3 Corner Greeters
The Corner Greeters initiative, overseen by the Rainier Beach Action Coalition (RBAC), consists of positive
community messaging, mobilization, and outreach; pop-up events and activities such as music, dancing,
crafts, and other fun and culturally-relevant activities at the hot spots; and community data collection.
The goal of the Corner Greeters is to “take back” hot spot spaces for the community and build collective
efficacy and empowerment among residents. The key feature of the Corner Greeters is that the events
are completely youth-led. Young people from the neighborhood collaborate with RBAC to plan different
activities and staff the events. They are also trained to communicate and share ABSPY data and infor-
mation, such as neighborhood crime data reports, with visitors to their events to connect community
members to ABSPY, build collective efficacy, and empower them to take action in the neighborhood.
RBAC is also responsible for the Mobile Discovery Center, a unique community information booth on
wheels that sets up at Corner Greeter and other neighborhood events. The Corner Greeters also conduct
their own surveys regularly at the Rainier Beach hot spots to track community perceptions of safety and
collective efficacy at the hot spots, and support ABSPY at community events.
In 2019 the Corner Greeters continued to conduct surveys and plan events to respond to the results
they were seeing; for example, in November they arranged a ”Light Walk” to identify areas that needed
additional street lighting. They held Rainier Beach Town Halls in October and December, and engaged in
community outreach through over 700 social media posts and almost 30 Corner Greeter events, as well
as the Back to School Bash. Youth representatives from RBAC were key participants in the meetings with
Mayor Durkan in March and April. Importantly, in 2019 the Corner Greeters also mobilized in response to
the Pritchard Beach shooting by setting up “show love stations” where community members could make
cards for victims and reconnect with each other.
2.1.4 Business and community engagement
SPD’s South Precinct Community Policing Team continues to support ABSPY by building relationships
with business and community stakeholders in Rainier Beach. SPD’s activities include engaging with local
businesses to help them learn more about crime reporting, CPTED, and steps they can take to reduce their
risk of victimization; and generating opportunities for positive interactions with community members
through ice-cream socials at the Lake Washington Apartments and participation in the Town Halls, “Get
Down,” and other community events.
4Rainier Beach: A Beautiful Safe Place for Youth 2019 Update
Specific ABSPY engagement activities in 2019 included working with the Rainier Beach Merchants’ As-
sociation and community liaisons to build relationships with local businesses and connect them with
resources, including graffiti removal kits. SPD held a “Cops and Cones” ice-cream social at Lake Washing-
ton Apartments in November, which also featured a multicultural potluck.
2.1.5 Crime Prevention Through Environmental Design (CPTED)
ABSPY partners have continued to work on improvements to local infrastructure (such as landscaping
around sidewalks) and storefront improvements to local small businesses (such as removing security bars,
repainting and improving curb appeal, and improving sight lines). Community and city partners in these
efforts include South East Effective Development (SEED); The Mission Continues, a veterans’ organization;
the Rainier Valley Chamber of Commerce; and the Rainier Beach Merchants Association.
In 2019 ABSPY received specific funding for graffiti removal, safety training for businesses, and CPTED
in public spaces. The team worked with Union Resaurant, Qeerroo Restaurant, and Somali Community
Services to install lights; remove security bars and replace them with CPTED-friendly film; install signage;
remove graffiti; and other CPTED improvements. A number of “work parties” with The Mission Continues
were held throughout the year. RBAC was also involved in addressing CPTED needs in public areas. The
RBAC Clean Crew, made up of young people from the neighborhood, went out three times per week to
conduct clean-ups and litter removal.
2.1.6 Positive Behavioral Interventions and Supports (PBIS) and restorative practices
The NIJ Workgroup of the Core Team continued to meet regularly in 2019 to implement community-wide
PBIS and restorative practices under a grant from the National Institute of Justice. In 2019 the team final-
ized community-wide PBIS and restorative practices plans, conducted community outreach and messag-
ing as part of the PBIS social norms campaign, including hundreds of yard signs around the neighborhood
highlighting the “Be3 ” (Be Safe, Be Respectful, Be Responsible) and a college decision-day party, and hiring
and training of youth “circle keepers” to conduct peace circles. Members of the PBIS team made a pre-
sentation to public library management and worked with the Lake Washington Apartments on bringing
PBIS principles to that space. Team members also attended the Northwest PBIS and Restorative Justice
Forums to learn more about what other communities and schools are working on in these spaces.
3 2019 Evaluation Update: Summary of Methods
A detailed description of the data and methods used for this evaluation can be found in the original
evaluation report and the 2017 update. In this section we summarize the most important aspects of
our approach and the updates we made in 2019. Our 2019 evaluation is based on monthly police data
on calls for service and recorded offenses and incidents from January 2011 to August 2019, provided
by SPD, and five waves of our community survey, which was conducted by trained local researchers in
the summers of 2014, 2016, 2017, 2018, and 2019. Our analytic approach matches each Rainier Beach
hot spot with a comparison location elsewhere in SPD’s South Precinct, which is similar in terms of crime
rates and characteristics such as land use, presence of schools, access to public transit etc. Further details
5Rainier Beach: A Beautiful Safe Place for Youth 2019 Update
about the selection of the hot spots and comparison sites and information about the police data are
available in our original report. We also report the results of crime and survey data analysis for the Rainier
Beach hot spots without the comparison spots. This research design is not as rigorous as the matched
comparison hot spot approach because it does not account for other, non-ABSPY-related factors that
might affect the results. However, we recognize that due to gentrification and population change in
Southeast Seattle some of our matched comparison spots now look very different compared to when
they were first identified in 2012. This can also affect the conclusions of the research.
To make this report easier to read, all of the tables and most graphs are included in the Statistical Ap-
pendix at the end of this report. You can look at any of the tables or graphs in more detail in the electronic
version of this report by clicking on the blue number next to each reference to a table or figure (e.g. Table
A1—click the blue “A1” link to see the table).
3.1 Changes to police data in 2019
In May 2019 SPD rolled out a new records management system (RMS) for its incident reports. This changed
the way incident data are stored and reported. Specifically, the data are now in NIBRS (National Incident-
Based Reporting System) format. The NIBRS program is an update to the FBI’s Uniform Crime Reporting
(UCR) system, to which police departments across the United States report their data. The FBI is in the
process of rolling out this new program nationally. It allows police departments to report crime in more
detail. The new reporting system requires some changes to the way that we categorize incidents and
offenses and determine the seriousness of offenses, but allows us to report numbers that are more in line
with those shared directly by SPD.
As we described in our original evaluation report, in the old data system a single incident could involve
multiple offenses. For example, a carjacking scenario might involve the suspect threatening the victim
with a firearm and then stealing the car. This incident involves two offenses: assault with a deadly weapon
and motor vehicle theft. However, under the old FBI reporting system, police departments only had to re-
port the “main” offense in the incident. This was determined by a complex offense seriousness hierarchy.
We did not have access to the hierarchy that SPD applied, so we created our own, which prioritized vio-
lent offenses/offenses against persons, then property, then other crime types. We would have counted
the carjacking example above as an assault incident, which is a person/violent crime, and not a motor
vehicle theft, which is a property crime. In our previous reports we shared the number of incidents and
offenses, but we mainly focused on incidents. Because we used our own hierarchy to define incidents,
our numbers did not always match SPD’s official numbers.
NIBRS has an offense hierarchy built in, so we no longer need to create our own. The NIBRS system allows
us to determine which offenses are violent and how serious they are in the same way that SPD does, so
our numbers are now more in line with theirs. NIBRS data splits offense types into two categories: Group
A and Group B. Group A offenses are the most serious and violent offenses, and Group B are non-violent
and less serious offenses. All offenses are counted individually, even if they occurred as part of the same
event. Therefore, under the new system, we would count the carjacking example above as two offenses:
the assault and the motor vehicle theft.
The NIBRS system also classifies offense types into four broad categories: person, property, society, and
other. This is a similar classification to the one we created for the old data, except that we called crimes
against society “disorder.” Under the old system, we determined which crimes fell into each of these
6Rainier Beach: A Beautiful Safe Place for Youth 2019 Update
categories. Under the new system, the classification is built in. Therefore, while the broad categories of
crime remain the same, there may be variations in the specific offense types included in each one.
SPD provided us with data from the new system going back to 2011 so that we could continue to com-
pare trends year on year. However, for the reasons described above, it is important to note that the new
incident data cannot be compared to the old incident data, so numbers in this report will differ from
previous reports (although overall trends are the same). We also caution that the 2019 numbers are pre-
liminary as SPD continues to work out challenges with the new system. In particular, a small number of
offenses in the citywide are missing address data, so we cannot tell whether or not they happened in
Rainier Beach or one of the comparison hot spots. The system for reporting calls for service (CAD) data
has not changed.
Finally, to better align with the terminology used by SPD and NIBRS, we will begin referring to incident
data as “offense data” or “recorded offenses.” In the NIBRS system, offenses are crime reports and incidents
are non-criminal events reported by police, such as death by natural causes or impound of a vehicle. For
this reason we will no longer refer to “incident data” to avoid confusion. We will clarify whether numbers
just include offenses, or both offenses and incidents, as necessary.
3.2 Police crime data definitions
We use the following information from official police data provided to us by SPD in our analyses. Each
measure of crime data can tell us different information about how ABSPY is working. Note that we are not
allowed to report the numbers of certain offense types, including homicide, rape, and domestic incidents.
These offenses are included in our statistical models because specific numbers cannot be identified, but
they are not included when we report the numbers of certain offenses.
1. Calls for police service. “Calls for service” include both 911 calls from the public to the police, and
the logs that police record (usually on their in-car computers) while they are out on patrol. Calls
for service tell us what people in the neighborhood are concerned about, what they are willing to
call the police about (which may indicate how much they trust the police), and what the police
see or hear about while they are in the neighborhood. But calls for service don’t tell us the “true”
picture of crime. Sometimes the person calling 911 doesn’t know exactly what they are seeing or
hearing, but when the police arrive they can determine what type of crime has been committed and
record this in their report (see below). Multiple people might call 911 about the same problem, like
hearing shots being fired. And sometimes, even if a person was worried about an issue and called
the police, it might turn out that no crime has been committed or the police can’t find whatever
was going on. Calls for service also don’t tell us who was involved in a crime (e.g. the age, gender,
or race of a suspect or victim). This information is verified by police at the scene and included in
the report.
2. Police reports (offenses). Police write reports when they respond to a call or see something while
on patrol and have reason to believe that a crime may have occurred (such as a victim or witness
willing to make a report). Although not every call for service turns into a report, the reports give
us a better idea of what happened and who was involved. However, police can decide whether or
not to take a report, and sometimes victims don’t want the police to take a formal report, so not all
crimes make it into the data. Data on offenses and incidents reported by police are stored in the
new NIBRS-compliant system described above. This overall category of police reports includes the
7Rainier Beach: A Beautiful Safe Place for Youth 2019 Update
juvenile/youth, violent, and minor crime incidents described in points 3-5 below.
3. Juvenile/youth crime reports. Because ABSPY is focused on creating a “beautiful safe place for
youth,” we also analyze reports of offenses that involve young people (under 18 and age 18-25).
4. Violent crime reports. ABSPY is also focused on violence prevention, so we look at the effects of
the interventions on violent offenses. We define “violent offenses” as murder and non-negligent
manslaughter; aggravated assault; robbery; rape; and simple assault.2
5. Group A person offenses. NIBRS Group A offenses are the most serious or violent offenses. They
are similar to Part I offenses in the older Uniform Crime Reporting (UCR) system, but more offense
types are included. Group A person offenses include the violent incident types described above
and certain other offenses against the person such as intimidation and kidnapping. To create this
category, we selected all offenses that were categorized as both Group A and Person Offenses. A
full list of NIBRS offense definitions is available here.
6. Group A property offenses. Similar to the Group A person offense category, Group A property
offenses include the more serious property offenses. These include crimes like arson, burglary,
larceny/theft (including motor vehicle theft), property damage, and so on. To create this category,
we selected all offenses that were categorized as both Group A and Property Offenses.
7. Group B offenses. NIBRS Group B offenses are typically minor crimes, including things like disor-
derly conduct, drunkenness, non-violent family offenses, and liquor law violations. It is useful to
look at these less serious crimes because if they increase it may suggest that community members
are more likely to call the police and feel more empowered to take action against minor quality of
life issues.
3.3 Community survey
We conducted a fifth wave of our in-person community survey in the five Rainier Beach hot spots and
five comparison hot spots. The survey was conducted in the summer and fall of 2019, five years after
the first (baseline) survey (“Wave 1”), which was conducted in summer 2014, three years after “Wave 2”
(summer 2016), two years after “Wave 3” (summer 2017), and one year after “Wave 4” (summer 2018). We
present results from all five waves in this report for comparison. We asked the same questions in each
wave of the survey in order to measure and compare community members’ views of crime, safety, collec-
tive efficacy and social cohesion, the police, and ABSPY itself. We made a few changes to the questions
in 2019 to eliminate questions that were redundant and had not shown any change over time (some
questions about perceived disorder in the neighborhood) and added some questions about community
engagement and ABSPY interventions. We followed the same approach as we described in our previous
reports: the surveys were conducted on the street, in people’s homes, and in businesses by a team of five
researchers, most of whom came from the local area . As in previous waves, the majority of surveys were
conducted on the street so we did not talk to the same people each year.
In total, we have obtained 1,495 valid surveys over our five years of research: 297 in Wave 1, 300 in Wave
2, 290 in Wave 3, 305 in Wave 4, and 303 in Wave 5 (Table A1). Table A2 in the Statistical Appendix shows
a full description of the characteristics of survey participants in each wave, as well as the similarities and
2
We are not permitted to report homicide and rape offenses separately.
8Rainier Beach: A Beautiful Safe Place for Youth 2019 Update
differences between respondents in the treatment and comparison hot spots at baseline (Wave 1). Over-
all, across both the Rainier Beach and comparison hot spots each year, survey participants each year are
slightly more likely to be male, aged between 18 and 35, and identify as Black or African American, fol-
lowed by White. Around two-thirds were born in the United States and just over half had children of
any age. Most participants have completed high school or equivalent, or some college classes. Most of
the respondents live in the hot spots where they were interviewed; those who did not typically worked
there, shopped there, or used public transit. At Wave 1 there were significant differences in age and race
between participants in Rainier Beach and the comparison spots, which we control for in our analyses of
the survey data. Within the Rainier Beach hot spot participants there were significant differences in the
location where the survey was conducted, race, employment and education status, school attendance,
and main activity at the hot spot across each of the five waves (not shown in a table), so we also control
for these factors in our analyses of Rainier Beach-only effects.
3.4 Analytic strategy
We follow the same analytic strategy from our previous reports in this evaluation update. Specifically,
we used difference-in-differences analysis with Poisson regression and robust standard errors to assess
the effects of ABSPY on calls for service and offenses while the interventions were active and inactive,
accounting for clustering within the hot spots and controlling for seasonal and overall crime trends (Berk
& MacDonald, 2008; Kondo et al., 2015; see also Gill et al., 2016). We also statistically examine pre-post
change in the Rainier Beach hot spots, removing the comparison sites, to address concerns about the
differences between the Rainier Beach and comparison locations. The updated timeframe for the police
data analysis is January 2011 to August 2019 (104 months).3 We also present descriptive graphs showing
offense in each hot spot and across all five Rainier Beach hot spots from September 2011 to August 2019,
and the percentage change in each crime outcome pre- and post-May 2014 (when the first interventions
were rolled out) in each hot spot relative to its comparison site, the overall Rainier Beach neighborhood,
and the South Precinct overall.
As in our 2018 report, we also calculated the crime inflation factor, which is the ratio of calls to offenses in
the pre-intervention and during-intervention periods (Weisburd et al., 2020). The crime inflation factor
assesses whether higher numbers of offenses can be attributed to increased calls to the police (reflecting
improved collective efficacy and trust in police among residents) rather than ABSPY failing to work or
even “backfiring.” This is an important potential source of bias in analyzing the effects of interventions
that aim to decrease crime but increase citizen engagement with crime prevention (which can result
in more calls to the police). We calculated the inflation factor for both the treatment and comparison
hot spots and adjusted the number of incidents in the treatment spots by the difference between the
treatment and comparison group inflation factors. This process and its results are described in section
4.3.
As in our previous reports, we used multilevel mixed effects regression models (e.g. Kochel & Weisburd,
2017) to analyze the effects of ABSPY on community member perceptions measured by the surveys, ac-
counting for the clustering of individual within hot spots. These models include a series of interaction
terms that allow us to compare the short- and longer-term effects of ABSPY with the original, pre-ABSPY
survey findings (Wave 1). As noted above, we controlled for age and race in the models that include both
the Rainier Beach and comparison hot spots, and age, employment, education, and main activity at the
3
Refer to the 2017 Evaluation Update for a table showing pre-intervention monthly average numbers for each crime outcome.
9You can also read