STATS SA - Demographic Profile of Adolescents in South Africa - Statistics South Africa
←
→
Page content transcription
If your browser does not render page correctly, please read the page content below
Demographic Profile of Adolescents in South Africa
                                                                         Report 03-00-10

THE SOUTH AFRICA I KNOW, THE HOME I UNDERSTAND

       STATS SA
       STATISTICS SOUTH AFRICA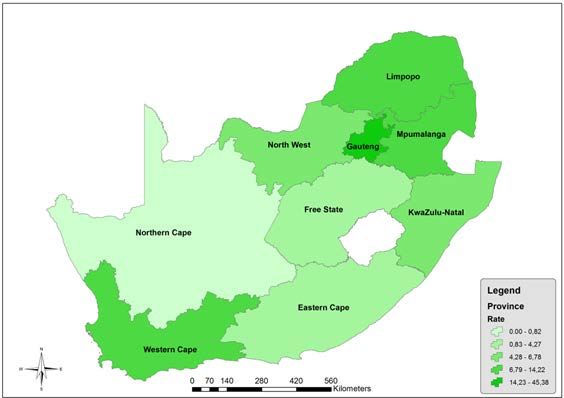
Demographic Profile of Adolescents
                      in South Africa

                                        Statistics South Africa

                                           Risenga Maluleke
Report No. 03-00-10                       Statistician-General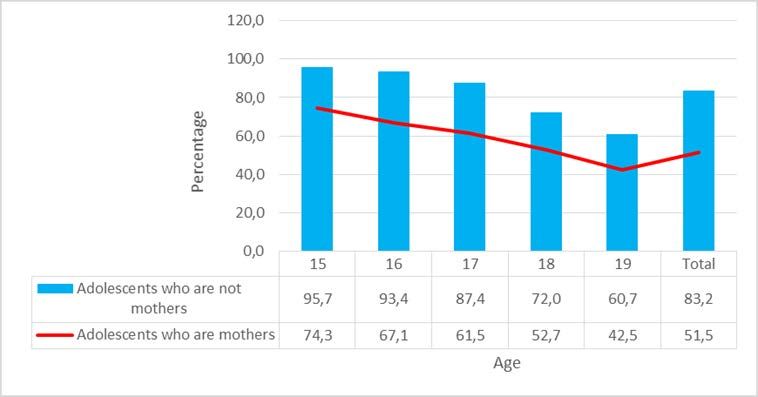
STATISTICS SOUTH AFRICA                               ii

Demographic Profile of Adolescents in South Africa / Statistics South Africa

Published by Statistics South Africa, Private Bag X44, Pretoria 0001

© Statistics South Africa, 2018
Users may apply or process this data, provided Statistics South Africa (Stats SA) is acknowledged as
the original source of the data; that it is specified that the application and/or analysis is the result of the
user's independent processing of the data; and that neither the basic data nor any reprocessed version
or application thereof may be sold or offered for sale in any form whatsoever without prior permission
from Stats SA.

Stats SA Library Cataloguing-in-Publication (CIP) Data
Demographic Profile of Adolescents in South Africa / Statistics South Africa, Pretoria: Statistics
South Africa, 2018

Report number 03-00-10
71pp

ISBN: 978-0-621-46054-4

A complete set of Stats SA publications is available at Stats SA Library and the following libraries:

          National Library of South Africa, Pretoria Division
          National Library of South Africa, Cape Town Division
          Library of Parliament, Cape Town
          Bloemfontein Public Library
          Natal Society Library, Pietermaritzburg
          Johannesburg Public Library
          Eastern Cape Library Services, King William's Town
          Central Regional Library, Polokwane
          Central Reference Library, Mbombela
          Central Reference Collection, Kimberley
          Central Reference Library, Mmabatho

This report is available on the Stats SA website: www.statssa.gov.za

Technical Enquiries
Email: Diegoi@statssa.gov.za
       ItaniN@statssa.gov.za
       OlgaM@statssa.gov.za

Demographic Profile of Adolescents in South Africa
Report: 03-00-10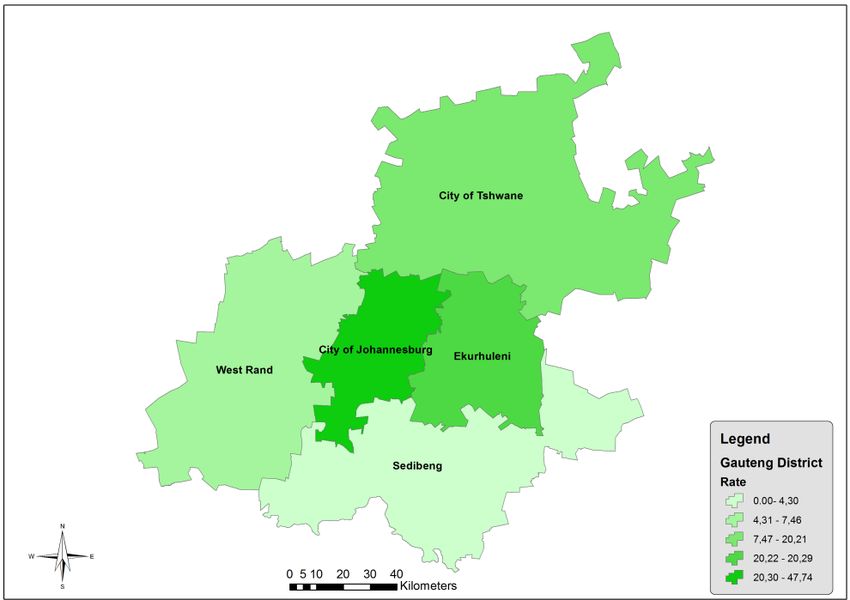
STATISTICS SOUTH AFRICA                                 iii

Preface

The National Development Plan (NDP) Vision 2030, amongst other frameworks, emphasise harnessing
of the demographic dividend through investments in the youth population. It is the goal of this report to
provide an analysis on the state of the adolescent population in South Africa with specific reference to
its age and sex composition, fertility, mortality and migration. Information from this thematic report used
data from Censuses 1996, 2001 and 2011, Community Survey 2016, Mortality and Causes of Death
2015, and the General Household Survey 2016.

                                                 Risenga Maluleke
                                                 Statistician-General

Demographic Profile of Adolescents in South Africa
Report: 03-00-10
STATISTICS SOUTH AFRICA iv
Contents
ACKNOWLEDGEMENTS........................................................................................................................ ix
EXECUTIVE SUMMARY .......................................................................................................................... x
ABBREVIATIONS AND ACRONYMS .................................................................................................... xii
DEFINITIONS OF TERMS .................................................................................................................... xiii
CHAPTER 1: ADOLESCENT COMPOSITION AND STRUCTURE ..................................................... 14
1.1 Overview .......................................................................................................................................... 14
1.2 Adolescents composition and structure........................................................................................... 16
1.2.1 Size and distribution of the adolescent population in South Africa .............................................. 16
1.2.2 Percentage of adolescents 10–19 years by province, 2016 ........................................................ 17
1.2.3 Percentage of adolescents 10–19 by population group and place of residence ......................... 18
1.2.4 Percentage change in the adolescent population in South Africa ................................................ 19
1.2.5 Historical trends of the adolescent population ............................................................................. 20
1.3 Median age and sex ratio of the adolescent population .................................................................. 21
1.4 Summary of findings ........................................................................................................................ 22
CHAPTER 2: ADOLESCENT FERTILITY ............................................................................................. 23
2.1 Introduction ...................................................................................................................................... 23
2.2 Data and methods ........................................................................................................................... 24
2.3 Results ............................................................................................................................................. 25
2.3.1 Motherhood by age, CS 2016 and SADHS 2016 ......................................................................... 25
2.3.2 Trends in adolescent birth rate, 1996–2016 ................................................................................. 26
2.3.3 Adolescent birth rate by population group and province, Census 2001 and Census 2011 ......... 27
2.3.4 Contribution of adolescent birth rate to total fertility, Census 2001 and Census 2011 ................ 28
2.3.5 Distribution of subpopulations according to adolescent birth rate and contribution of
adolescent birth rate to total fertility, 2011 .................................................................................. 29
2.3.6 Marriage as a risk factor for adolescent childbearing, Census 2001, Census 2011
and CS 2016 ............................................................................................................................... 30
2.3.7 Motherhood and education, CS 2016........................................................................................... 30
2.4 Summary of findings ........................................................................................................................ 31
CHAPTER 3: ADOLESCENT MORTALITY .......................................................................................... 32
3.1 Introduction ...................................................................................................................................... 32
3.2 Data and methods ........................................................................................................................... 33
3.3 Results ............................................................................................................................................. 34
3.3.1 Proportion of adolescent deaths reported by households from censuses and
surveys, 2001–2016 .................................................................................................................... 34
3.3.2 Adolescent death rates ................................................................................................................. 38
3.4 Mortality and causes of death amongst adolescents, 2015 ............................................................ 40
3.4.1 The leading causes of death amongst adolescents in South Africa ............................................ 41
3.5 Adolescent medical aid coverage .................................................................................................... 43
3.6 Proportion of adolescents by parental survival status, CS 2016 ..................................................... 44
Demographic Profile of Adolescents in South Africa
Report: 03-00-10STATISTICS SOUTH AFRICA v 3.7 Summary of findings ........................................................................................................................ 44 CHAPTER 4: PROFILE OF FOREIGN-BORN ADOLESCENTS IN SOUTH AFRICA ......................... 45 4.1 Introduction ...................................................................................................................................... 45 4.2 Data source ..................................................................................................................................... 46 4.3 Results ............................................................................................................................................. 46 4.3.1 Spatial profile of foreign-born adolescents ................................................................................... 46 4.3.2 Sociodemographic profile of adolescents..................................................................................... 48 4.3.3 Housing profile of foreign-born adolescents ................................................................................. 54 4.4 Summary of findings ........................................................................................................................ 60 CHAPTER 5: DISCUSSIONS................................................................................................................ 61 5.1 Age composition .............................................................................................................................. 61 5.2 Fertility ............................................................................................................................................. 61 5.3 Mortality ........................................................................................................................................... 63 5.4 Migration .......................................................................................................................................... 63 References ............................................................................................................................................ 67 Demographic Profile of Adolescents in South Africa Report: 03-00-10
STATISTICS SOUTH AFRICA                                                  vi

List of Figures

Figure 1.1:          South African population by age and sex, 2016.............................................................16

Figure 1.2:          Percentage of adolescents aged 10–19 years, by province ..........................................17

Figure 1.3:          Percentage of adolescents aged 10–19 years by population group and
                     geographical type, 2016 .................................................................................................18

Figure 1.4:          Percentage distribution of adolescents in South Africa by sex, 1996–2016 ..................18

Figure 1.5:          Trends in the proportion of the adolescent population (10–19 years) in
                     South Africa, 1996-2016 .................................................................................................20

Figure 1.6:          Trends in the adolescent population (10–19 years) as a proportion of the
                     total population, by province...........................................................................................21

Figure 1.7:          Median age of adolescents ............................................................................................21

Figure 1.8:          Sex ratios of adolescents ...............................................................................................21

Figure 2.1:          Percentage of adolescents who gave birth by age, CS 2016 and SADHS 2016 ...........25

Figure 2.2:          Trends in adolescent birth rate, 1996–2016 ...................................................................26

Figure 2.3:          Median adolescent birth rate and contribution of adolescent birth rate to total
                     fertility by population group and province, Census 2011 ...............................................29

Figure 2.4:          Percentage of adolescent mothers who are attending school by age, CS 2016 ...........31

Figure 3.1:          Proportion of deceased adolescents by province, 2001–2016 ......................................34

Figure 3.2:          Proportion of deceased adolescents by age, 2001–2016 ..............................................35

Figure 3.3:          Proportion of deceased adolescents by sex, 2001–2016 ..............................................36

Figure 3.4:          Proportion of deceased adolescents by population group, 2001–2016 .........................37

Figure 3.5:          Adolescent death rate by population group, 2001–2016 ...............................................38

Figure 3.6:          Adolescent death rates by province 2001–2016 ............................................................39

Figure 3.7:          Trends in the number of registered deaths amongst adolescents, 2006–2015 .............40

Figure 3.8:          Proportion of adolescents covered by medical aid by sex, population group
                     and province of usual residence, 2016 ..........................................................................43

Figure 3.9:          Distribution of adolescents by maternal parental and paternal parental survival
                     status, CS 2016 ..............................................................................................................44

Figure 4.1:          Distribution of foreign-born adolescents by province of enumeration, CS 2016 ............47

Figure 4.2:          Distribution of foreign-born adolescents by district of enumeration in
                     Gauteng, CS 2016 ..........................................................................................................47

Figure 4.3:          Distribution of adolescents by sex selectivity and population group, CS 2016 ..............48

Figure 4.4:          Percentage of foreign-born adolescents by citizenship status, CS 2016 .......................49

Demographic Profile of Adolescents in South Africa
Report: 03-00-10
STATISTICS SOUTH AFRICA vii
Figure 4.5: Distribution of adolescents by relationship to household head, CS 2016 ......................50
Figure 4.6: Distribution of adolescents by parental survival, CS 2016 .............................................51
Figure 4.7: Distribution of adolescents by mother or father residing in household, CS 2016 ..........52
Figure 4.8: Distribution of adolescents by religious affiliation, CS 2016 ..........................................52
Figure 4.9: Distribution of adolescents by ever giving birth, CS 2016 ..............................................53
Figure 4.10: Distribution of adolescents by attendance at educational institution and time
travelled to get to educational institution, CS 2016 ........................................................54
Figure 4.11: Distribution of adolescents by household size, CS 2016 ...............................................55
Figure 4.12: Distribution of adolescents by household tenure status, CS 2016.................................55
Figure 4.13: Distribution of adolescents by main dwelling that household currently lives
in, CS 2016 .....................................................................................................................56
Figure 4.14: Distribution of adolescents by household involvement in agricultural activity
and food security, CS 2016 ............................................................................................58
Figure 4.15: Distribution of adolescents by victim of crime in the past 12 months, CS 2016 ............60
Demographic Profile of Adolescents in South Africa
Report: 03-00-10STATISTICS SOUTH AFRICA viii
List of Tables
Table 1.1: Adolescent (10–19 years) population percentage change by province in
South Africa, 1996–2016 .................................................................................................. 19
Table 2.1: Percentage of adolescents who gave birth by age and population group, CS 2016 ........ 26
Table 2.2: Adolescent birth rate by population group and province, Census 2001
and Census 2011 .............................................................................................................. 27
Table 2.3: Contribution of adolescent birth rate to total fertility by population group and
province (%), Census 2001 and Census 2011 ................................................................. 28
Table 2.4: Percentage of adolescents who have never been married by population group
and province, 2001–2016 ................................................................................................. 30
Table 2.5: Percentage of adolescents who are attending school by age and sex, CS 2016 ............ 31
Table 3.1: Distribution of the leading causes of death amongst adolescent females, 2015 .............. 41
Table 3.2: Distribution of the ten leading causes of death amongst adolescent males, 2015 ........... 42
Table 4.1: Distribution of adolescents by household services, CS 2016 ........................................... 57
Table 4.2: Distribution of adolescents by household assets, CS 2016 .............................................. 57
Table 4.3: Distribution of adolescents by telecommunication devices, CS 2016 .............................. 58
Table 4.4: Distribution of adolescents by difficulties facing the municipality presently, CS 2016...... 59
Demographic Profile of Adolescents in South Africa
Report: 03-00-10STATISTICS SOUTH AFRICA ix ACKNOWLEDGEMENTS Statistics South Africa would like to thank the following contributors for their part in the compilation of this report: Diego Iturralde, Itani Ntsieni, Olga Lesego Bodigelo, Nyiko Tricia Maluleke, Princelle Dasappa-Venketsamy, Leonard Ahuejere, Shiela Dlamini, Tshepo Matlwa and Salmon Lekoko. Acknowledgement is made to the external reviewers, Dr Henry Victor Doctor from the World Health Organization and Dr Sunday Adedini from the University of the Witwatersrand, for their invaluable inputs. Demographic Profile of Adolescents in South Africa Report: 03-00-10
STATISTICS SOUTH AFRICA                                x

EXECUTIVE SUMMARY

This thematic report employed data from Censuses 1996, 2001 and 2011, Community Survey 2016,
Mortality and Causes of Death 2015, and the General Household Survey 2016 to provide data on the
state of the adolescent population in South Africa.

The findings indicate that adolescents made up 18,5% of the total population of South Africa in 2016.
Eastern Cape (22,7%), Limpopo (21,4%) and KwaZulu-Natal (20,7%) are the provinces where
adolescents made up the largest number of the adolescent population, whilst the lowest numbers were
recorded in Gauteng and Western Cape. The results show that the majority of adolescents are amongst
the black African (19,3%) and coloured (18%) population groups. The Indian/Asian (14%) and white
(12%) population groups constituted the lowest proportion of adolescents in the country. Across all the
provinces there was a slight increase in the adolescent population from 1996 to 2001, which later
showed a decreasing pattern between 2001 and 2011. In 2016, Eastern Cape, Western Cape and North
West observed a steady increase in the adolescent population. The median age of adolescents over
time was approximately 14 years.

The report revealed that adolescent fertility increased in 2011 (72 births per 1 000 women aged 15–19)
after reaching low levels in 2001 (65 births per 1 000 women aged 15–19). Data from SADHS 2016
show a consistent level of adolescent fertility of 71 births per 1 000 women aged 15–19. The pattern of
adolescent fertility follows the overall fertility dynamics of the country. Similar to the total fertility rate,
adolescent fertility is much higher amongst black Africans and coloureds and lower amongst
Indian/Asian and white adolescent women. Rural provinces such as Northern Cape, Eastern Cape and
Limpopo reveal high adolescent fertility.

The observation on adolescent mortality showed that there has been a decline in the proportion of
deaths amongst adolescents in the country. Of the ten leading causes of death amongst adolescents in
2015, Tuberculosis (A15-A19), followed by Human immunodeficiency virus [HIV] disease (B20-B24),
other viral diseases (B25-B34), and Influenza and pneumonia (J09-J18), were ranked top four causes
of death amongst both sexes.

Gauteng was home to the majority of foreign-born adolescents (45,4%). About 51% of all foreign-born
adolescents were female, and the majority of foreign-born adolescents in South Africa are black African
(88,3%). Almost three-quarters of foreign-born adolescents are not South African citizens. Only 66,2%
of migrants in this cohort are currently attending an educational institution. Almost three times as many
foreign-born adolescents (21,1%) than South African-born adolescents live in informal dwellings. About
ten per cent of migrant adolescents were concerned about violence and crime in the municipality where
they lived. Nearly 10,54% of migrant adolescents were victims of crime in the year before the survey.

Demographic Profile of Adolescents in South Africa
Report: 03-00-10
STATISTICS SOUTH AFRICA                              xi

The report is organised into five chapters. The first chapter presents an overview of the adolescent age
composition and structure. Chapter two presents the adolescent fertility whilst chapter three presents
the adolescent mortality and causes of death. In chapter four, an analysis of foreign-born adolescents
in South Africa is presented. The last chapter presents discussions and conclusions.

Demographic Profile of Adolescents in South Africa
Report: 03-00-10
STATISTICS SOUTH AFRICA                                       xii

ABBREVIATIONS AND ACRONYMS

 ABR                                 Adolescent Birth Rate
 ADR                                 Adolescent Death Rate
 AIDS                                Acquired immune deficiency syndrome
 DHA                                 Department of Home Affairs
 DoH                                 Department of Health
 HIV                                 Human immunodeficiency virus
 NDP                                 National Development Plan
 NYP                                 National Youth Policy
 PAF                                 Proportion of Fertility in Adolescence
 PRB                                 Population Reference Bureau
 SADHS                               South Africa Demographic and Health Survey
 SAHRC                               South African Human Rights Commission

 SAMRC                               South African Medical Research Council
 SDGs                                Sustainable Development Goals
 TFR                                 Total Fertility Rate
 UN                                  United Nations

 UNAIDS                              Joint United Nations Programme on HIV and AIDS
 UNFPA                               United Nations Population Fund
 UNICEF                              United Nations Children’s Fund
 UNDESA-PD                           United Nations Department of Economic and Social Affairs, Population Division
 WHO                                 World Health Organization

Demographic Profile of Adolescents in South Africa
Report: 03-00-10
STATISTICS SOUTH AFRICA                              xiii

DEFINITIONS OF TERMS

•     Adolescent: The term adolescent refers to the population aged 10–19.
•     Adolescent birth rate: The rate measures the annual number of births to women aged 15–19 per
      1 000 women in that age group.
•     Adolescent death rate: The rate measures the number of deaths amongst persons aged 10–19
      per 100 000 population in that age group.
•    Foreign-born adolescent: Population aged 10–19 who were born outside South Africa.
•    South African-born adolescent: Population aged 10–19 who were born in South Africa.
•    Lifetime migrant: A lifetime migrant is defined as a person who was not born in South Africa, but
     who was enumerated within the borders of South Africa on the night of Community Survey 2016.

Demographic Profile of Adolescents in South Africa
Report: 03-00-10
STATISTICS SOUTH AFRICA 14 CHAPTER 1: ADOLESCENT COMPOSITION AND STRUCTURE 1.1 Overview African states emphasise harnessing of the demographic dividend through investments in the youth population (Population Reference Bureau, 2017). As such, the youth population has been prioritised by the African Union Agenda 2063 – Aspiration 6, which seeks to ensure that opportunities are available for self-realisation of youth, and this can be achieved by enabling access to health, education and jobs, amongst others (African Union Commission, 2015). The same vision is shared by the South African National Policy instruments such as the National Development Plan (NDP) Vision 2030 and the National Youth Policy (NYP) 2015–2020, which additionally puts emphasis on the protection of young people from sexually transmitted diseases and unplanned teenage pregnancies. Also related to youth is the adolescent birth rate, which is prioritised as one of the indicators to monitor progress towards the achievement of Goal 3 of the Sustainable Development Goals (SDGs). This goal aims to ensure healthy lives and promote well-being for all at all ages. The goal target is to ensure universal access to sexual and reproductive health-care services, including family planning, information and education, and the integration of reproductive health into national strategies and programmes (World Health Organization, 2016). About 1,2 billion adolescents (10−19 years old) make up sixteen per cent of the world’s population and nearly 90% of this population live in developing countries (UNICEF, 2017). In recent times, adolescents have benefited from the gains in child survival, improved education, access to safe water, and other areas of development that were driven to meet the Millennium Development Goals and the human development targets at the core of the Declaration (UNICEF, 2011). Adolescents are protected under the Convention on the Rights of the Child, yet, their vulnerabilities and needs often remain unaddressed compared to other segments of the children population (UNICEF, 2012). These vulnerabilities includes teenage pregnancy, mortality, migration, HIV and AIDS, and sexual reproductive health. Globally, almost 16 million girls aged 15–19 years give birth each year; the majority of these girls live in sub-Saharan Africa (Christiansen et al., 2013). Nearly one in five girls worldwide becomes a mother before her 18th birthday, accounting for almost 11% of all births globally (ibid). A large number of these young women undergo unsafe abortions, where risks of dying from pregnancy-related causes are very high (WHO, 2011). The decline in the adolescent birth rate since 1990 is almost universal. Africa has the highest adolescent birth rate and the decline over time has been slow (UN, 2015). In South Africa, 16% of women aged15– 19 have begun childbearing, 12% have given birth, and another 3% were pregnant with their first child at the time of the interview (NDoH, Stats SA, SAMRC and ICF, 2017). Also, an estimated 1,3 million deaths occurred worldwide amongst adolescents (10–19 years) (WHO, 2014). Empirical evidence indicates that road injuries, AIDS-related causes, suicide, lower respiratory infections and interpersonal violence were the top five leading causes of death in adolescents and young Demographic Profile of Adolescents in South Africa Report: 03-00-10
STATISTICS SOUTH AFRICA                               15

people in 2012 (ibid). In 2012, an estimated 1,3 million deaths occurred worldwide amongst
10–19-year-olds; however, there has been a drop in the adolescent mortality rate from 126 deaths per
100 000 in 2000 to 111 per 100 000 in 2012 (ibid). Despite this overall decline in mortality, the estimated
number of global AIDS-related deaths amongst adolescents aged 10–19 has nearly tripled from 21 000
in 2000 to 60 000 in 2014 (UNAIDS, 2014).

South Africa, much like the rest of Africa, remains plagued by the burden of disease and mortality.
Available data indicate that 26 new infections occur every hour amongst adolescents and about half of
those living with HIV are in just six countries: South Africa, Nigeria, Kenya, India, Mozambique and
Tanzania (SAHRC and UNICEF, 2016).

The migration process also confronts young people under the age of 20 and confers to them certain
vulnerabilities. These vulnerabilities include discrimination based on gender, migration status and poor
working conditions (UN, 2016). Amongst the migrants under 20 years of age, the group of 15–19 years is
the largest one, accounting for some 33 % of all migrants under the age of 20, followed by the age group
10–14, which represents around 27% of the total migrant population under 20 years of age (UNICEF,
2010)

Bennett (2013) in her longitudinal study of teens on the move in South Africa, observed that by age 18, 42%
of adolescents who were 12 years old had migrated at least once. Adolescents who shared household
membership with both parents were significantly less likely to move than those who were co-members with
one or neither parent. Almost half (45%) of all movers moved alone, and girls were significantly more likely
to be engaged in unaccompanied migration than boys.

World leaders made a promise to children to help them fulfil their human potential. To date, adolescents
are alive as a result of the significant drop in the child mortality rate and globally, more children are enrolled
in school than any generation of children before them (UNICEF, 2012). However, the adolescent situation
analysis in South Africa suggests that their needs and risky behaviours remain unaddressed. Based on
these contexts, this report is aimed at establishing the current state of adolescents in South Africa.

Demographic Profile of Adolescents in South Africa
Report: 03-00-10
STATISTICS SOUTH AFRICA                                       16

1.2 Adolescents composition and structure

1.2.1 Size and distribution of the adolescent population in South Africa

The adolescent population are cohorts of people aged 10–19 years in a given population structure.
According to literature, the adolescent population structure can be classified into two groups. These are
the early adolescent population aged 10–14 years and the late adolescent population comprising those
aged 15–19 years (Makiwane and Chimere-Dan, 2009; UNFPA, 2009).

Figure 1.1 below shows a pyramid of the South African population by age and sex, 2016. The figure
indicates that 10 294 894 adolescents (10–19) were living in South Africa in 2016. Of these adolescents,
9,3% constituted 10–14 year-olds and 9,1% comprised 15–19 year-olds. These adolescents made up
18,5% of the total population in 2016 (Figure 1.2). In this adolescent population, 5 160 084 (18,9%) were
males and 5 134 202 (18,1%) were females.

Figure 1.1: South African population by age and sex, 2016

    80-84

    70-74

    60-64

    50-54

    40-44

    30-34

    20-24
                    2555343                                                   2549139
    10-14          2604741                                                    2585063

    00-04
        3000000       2000000       1000000           0            1000000   2000000    3000000   4000000

                                                     Female        Male

Demographic Profile of Adolescents in South Africa
Report: 03-00-10
STATISTICS SOUTH AFRICA 17
1.2.2 Percentage of adolescents 10–19 years by province, 2016
In 2016, Eastern Cape (22,7%), Limpopo (21,4%) and KwaZulu-Natal (20,7%) were the provinces with
the largest number of adolescents aged 10–19.Gauteng had the least number of adolescents (14,1%),
followed by Western Cape (16,1%).
Figure 1.2: Percentage of adolescents aged 10–19 years, by province
South Africa 18,5
Limpopo 21,4
Mpumalanga 19,3
Gauteng 14,1
North West 18,2
KwaZulu-Natal 20,7
Free State 18,5
Northern Cape 18,7
Eastern Cape 22,7
Western Cape 16,1
0,0 5,0 10,0 15,0 20,0 25,0
Demographic Profile of Adolescents in South Africa
Report: 03-00-10STATISTICS SOUTH AFRICA 18
1.2.3 Percentage of adolescents 10–19 by population group and place of residence
Results in Figure 1.3 show that in 2016, the majority of adolescents were found amongst the black African
(19,3%) and coloured (18%) population groups. Adolescents were more likely to reside in rural (22,5%)
areas than urban areas (16,2%). Between 1996 and 2001, there were slightly more female than male
adolescents; however, in 2011 and 2016, the number of male and female adolescents appeared to be
consistent (Figure 1.4).
Figure 1.3: Percentage of adolescents aged 10–19 years by population group and geographical
type, 2016
25,00
22,54
20,00
19,33
17,82
15,00 16,20
13,95
10,00 12,38
5,00
0,00
Black African Coloured Indian/Asian White Urban Rural
Population group Place of residence
Figure 1.4: Percentage distribution of adolescents in South Africa by sex, 1996–2016
55,0
50,0
%
45,0
40,0
Yr 1996 Yr 2001 Yr 2011 Yr 2016
Male 49,3 49,5 50,5 50,1
Female 50,7 50,5 49,6 49,9
Demographic Profile of Adolescents in South Africa
Report: 03-00-10STATISTICS SOUTH AFRICA 19
1.2.4 Annual percentage change in the adolescent population in South Africa
Table 1.1 shows the annual percentage change in the adolescent population both nationally and by
province from 1996 to 2016. The results indicate that there have been variations in the annual percentage
change amongst the adolescent population across the provinces and over time. Between 1996 and 2001,
the adolescent population had grown in almost all the provinces, with the exception of Northern Cape (-
0.89%). During the period 2001–2011, Gauteng and Western Cape had the highest increase in the
proportion of adolescent population (1.22%) and (0.58%), respectively). Between 2011 and 2016, all the
provinces showed an increase in the adolescent population. This increase was more pronounced in
Eastern Cape (2.25%), Western Cape (2.07), and North West (2.03%).
Table 1.1: Adolescent (10–19 years) population annual percentage change by province in
South Africa, 1996–2016
1996–2001 2001–2011 2011–2016
annual % annual % annual %
Province 1996 2001 change 2011 change 2016 change
Western Cape 733 225 868 198 3,68 918 965 0,58 1 013 917 2,07
Eastern Cape 1 554 932 1 651 146 1,24 1 424 797 -1,37 1 584 818 2,25
Northern Cape 225 843 215 787 -0,89 217 124 0,06 223 237 0,56
Free State 560 834 608 436 1,70 503 395 -1,73 525 088 0,86
KwaZulu-Natal 1 974 695 2 316 548 3,46 2 158 392 -0,68 2 292 973 1,25
North West 590 281 643 742 1,81 620 245 -0,37 683 179 2,03
Gauteng 1 260 487 1 547 691 4,56 1 736 601 1,22 1 891 947 1,79
Mpumalanga 730 137 829 642 2,73 820 626 -0,11 837 848 0,42
2,62 -1,21 0,72
Limpopo 1 204 382 1 362 449 1 198 219 1 241 278
Total 8 834 816 10 043 638 2,74 9 598 364 -0,44 10 294 285 1,45
Demographic Profile of Adolescents in South Africa
Report: 03-00-10STATISTICS SOUTH AFRICA 20
1.2.5 Historical trends of the adolescent population
Figure 1.5 indicates a somewhat consistent trend of the proportion of adolescents from 1996 to 2001. In
1996 and 2001, the adolescent population made up almost 22% of the total population. This segment of
the population decreased gradually from 2001 to 18,5% in 2016. The national trend is consistent with the
provincial patterns, as shown in Figure 1.6. Across all the provinces there was a slight increase in the
adolescent population from 1996 to 2001, followed by a decreasing pattern from 2001 to 2011. In 2016,
Eastern Cape, Western Cape and North West observed a steady increase in their adolescent population.
Figure 1.5: Trends in the proportion of the adolescent population (10–19 years) in
South Africa, 1996-2016
30,0
21,8 22,4
20,7
18,5 18,5
20,0
10,0
0,0
1996 2001 2007 2011 2016
Demographic Profile of Adolescents in South Africa
Report: 03-00-10STATISTICS SOUTH AFRICA 21
Figure 1.6: Trends in the adolescent population (10–19 years) as a proportion of the total
population, by province
30,00
25,00
20,00
15,00
10,00
5,00
0,00
Year 1996 Year 2001 Year 2007 Year 2011 Year 2016
1.3 Median age and sex ratio of the adolescent population
Over time, the median age of adolescents revolved around 14 years. It increased to 15 years between
2001 and 2011. In 2016, half of the population of adolescents were 14 years old (Figure 1.7). Figure 1.8
indicates that the adolescent population has been dominated by females from 1996 to 2001. The sex
ratios of 102 and 101 males per 100 females suggest that there were more male than female adolescents
from 2011 to 2016 in South Africa.
Figure 1.7: Median age of adolescents Figure 1.8: Sex ratios of adolescents
15 15
14 14 14 103 102
102 101
101 100
100
10 99 98
98 97
97
96
95
5 94
1996 2001 2011 2016 1996 2001 2007 2011 2016
Demographic Profile of Adolescents in South Africa
Report: 03-00-10STATISTICS SOUTH AFRICA 22 1.4 Summary of findings There has been a gradual decrease in the number of adolescents from 1996 to 2011, which remained consistent between 2011 and 2016. The pattern also manifests geographically across all the provinces. Eastern Cape, North West and Western Cape had a noticeable positive gain of adolescents in 2016. The sex ratios have been steadily increasing over time, and the median age (14 years) remained constant except for 2011. Demographic Profile of Adolescents in South Africa Report: 03-00-10
STATISTICS SOUTH AFRICA                              23

CHAPTER 2: ADOLESCENT FERTILITY

2.1 Introduction

Teenage or adolescent pregnancy is simply understood as a pregnancy that occurs amongst young
women under the age of 20 years (UNICEF, 2008). A wide range of factors, including economic and social
factors, have been associated with teenage pregnancy. However, the provision of necessary health
services, preventing the risk of early marriage and ensuring that adolescents remain in school are some
of the key elements of inhibiting unplanned adolescent pregnancies (UNFPA, 2015). Adolescent fertility
receives wide attention due to the undesirable consequences it has on adolescent girls and their babies
(Garenne et al., 2001; Kaufman et al., 2001; UNFPA, 2013). According to UNFPA (2015), the life of a girl
who falls pregnant at an early age changes negatively, and is less likely to change for the better, because
her health and that of the baby are compromised, her educational and future employment prospects
become blurred and her vulnerability to poverty multiplies. Outcomes associated with childbearing
adolescents include maternal and child morbidity and mortality and exposure to sexually transmitted
infections such as HIV/AIDS (Leclerc–Madlala, 2002; Kara and Maharaj, 2015; UNFPA, 2015).

Globally, sub-Saharan Africa remains one of the regions with the highest proportion of adolescent births.
The Population Reference Bureau (PRB) (2017) recorded a birth rate of 119 per 1 000 adolescent girls in
the region. Data from demographic and health surveys reveal an adolescent birth rate (ABR) of 94 in
Lesotho, 82 in Namibia and 141 in Zambia (Ministry of Health [Lesotho] and ICF International, 2016; The
Namibia Ministry of Health and Social Services (MoHSS) and ICF International, 2014; Central Statistical
Office (CSO) [Zambia], Ministry of Health (MOH) [Zambia], and ICF International, 2014). An analysis of
adolescent childbearing in South Africa shows declining trends. However, the decline is not consistent
over time (Panday et al., 2009). The 1998 South Africa Demographic and Health Survey (SADHS)
reported that 13,2% of adolescent aged 15–19 years had a live birth. This percentage declined slightly to
12,4% based on the 2016 SADHS. Furthermore, 16,4% of adolescent women were recorded to have
been pregnant in 1998, while 15,6% were revealed to have commenced childbearing in 2016 (DoH/South
Africa and Macro International, 2002; NDoH, Stats SA, SAMRC and ICF, 2017).

The adolescent birth rate dropped from 76 births per 1 000 women aged 15–19 years in 1998 to 71 births
per 1 000 women aged 15–19 in 2016 (DoH/South Africa and Macro International, 2002; NDoH, Stats
SA, SAMRC and ICF, 2017). Other sources of data highlight the ABR as an indicator that fluctuates over
time (Panday et al., 2009; Moultrie and McGrath, 2007). Nonetheless, research has shown that in the
South African context, fertility (including adolescent childbearing) varies by population group,
geographical location, age, education and marital status (Jewkes et al., 2001; Palamuleni et al., 2007;
Panday et al., 2009; Mkhwanazi, 2010; Udjo, 2001; UNFPA, 2015; NDoH, Stats SA, SAMRC and ICF,
2017).

The causes of adolescent fertility are multifaceted, and its dynamics call for a holistic approach in
attempting to reduce adolescent fertility levels in South Africa. An analysis of recent adolescent fertility
levels remains imperative in assessing the successes of national commitments towards the prevention of
adolescent childbearing in South Africa. Understanding the current patterns of adolescent childbearing is

Demographic Profile of Adolescents in South Africa
Report: 03-00-10
STATISTICS SOUTH AFRICA                              24

important to redirect attention towards subpopulations which are mostly at risk and those whose future
potentials are likely to be compromised.

2.2 Data and methods

The report uses data from Census 2001, Census 2011 and the 2016 Community Survey (CS). Published
indicators from census reports and the 2016 South Africa Demographic Health Survey (SADHS) Key
Indicator Report are also employed for comparisons. Key parameters reported in this section include:
• Adolescent birth rate: Adolescent birth rate is used as a summary indicator of childbearing in young
   women. The rate measures the annual number of births to women aged 15–19 years per 1 000 women
   in that age group. It is computed as a ratio where the total number of births to young women aged 15–
   19 years as a numerator is divided by the total number of women aged 15–19 years, which is the
   denominator. The rate is expressed as births per 1 000 women (UNDESA-PD, 2009).
• Contribution of adolescent birth rate to total fertility or proportion of fertility in adolescence (PAF): This
   indicator summarises fertility attributed to adolescent women. Since all women of childbearing age
   (15–49 years) contribute to TFR, and seeing that ABR is a fraction of TFR, PAF quantifies the
   percentage of total fertility that would occur at ages 15–19 amongst a hypothetical cohort experiencing
   the current age-specific fertility rates over its reproductive lifetime (UNDESA-PD, 2013). It is estimated
   as ABR multiplied by 5 and divided by total fertility. Adolescent birth rates and contribution of ABR to
   total fertility indicators are derived from published fertility estimates from census data.
• Percentage of adolescent women who have given birth: The percentage of adolescent women who
   have given birth shows the number of young women who have entered motherhood. The numerator
   is the number of women aged 15–19 who are reported to have given birth to a child in their lives,
   divided by the total number of women in the same age group.
• Percentage of women who have never married: In demography, marriage signifies the onset of
   childbearing in women and is used as a determinant of fertility. The percentage of women who are
   never married is an indicator of the magnitude with less risk of adolescent fertility. All never married
   women (15–19 years) are divided by the total population of adolescent females to give the percentage.
• School attendance by adolescent women who are already mothers: The percentage of adolescent
   women who have given birth and are attending school is calculated as young mothers who are
   attending school divided by total adolescents aged 15–19. This report acknowledges that non-
   attendance can still promote adolescent fertility. In all calculations, ‘don’t know’ and unspecified cases
   are excluded in the denominator.

Assessment of data quality highlighted that a lower proportion of adolescent women aged 12-14 years
have given birth, therefore analysis focused on adolescent women aged 15-19 years.

Demographic Profile of Adolescents in South Africa
Report: 03-00-10
STATISTICS SOUTH AFRICA                              25

2.3 Results

2.3.1 Motherhood by age, CS 2016 and SADHS 2016

Most censuses and demographic surveys often ask childbearing women aged 12–50 years if they had
ever given birth to a live child even if the child died soon after birth. From this information the percentage
of young women who are mothers can be calculated. Figure 2.1 shows that the percentage of adolescents
who are mothers increases with age. Motherhood started from 1,4% amongst 15-year-old adolescents to
25,0% amongst 19-year-olds. Equally, calculations from 2016 SADHS data indicate that motherhood was
lower at 2,4% amongst women aged 15 years and higher (24,5%) amongst women aged 19 years.

Differentials of motherhood by population group and province are presented in Table 2.1. A higher
percentage of the black African (12,5%) and coloured (11,1%) population groups had a live birth in 2016.
Conversely, motherhood was lower amongst the Indian/Asian and white population. Adolescent
motherhood was predominant at 14,2% and 14,0% in Eastern Cape and Northern Cape, respectively.
Low levels of motherhood in 2016 were noticeable in Western Cape (9,6%) and Gauteng (8,1%).

Figure 2.1: Percentage of adolescents who gave birth by age, CS 2016 and SADHS 2016

Demographic Profile of Adolescents in South Africa
Report: 03-00-10
STATISTICS SOUTH AFRICA                                          26

Table 2.1: Percentage of adolescents who gave birth by population group and province, CS 2016

                          Percentage of adolescents who
                                   gave birth
 Population group
 Black African                                            12,5
 Coloured                                                 11,1
 Indian/Asian                                              2,4
 White                                                     1,8
 Province
 Western Cape                                              9,6
 Eastern Cape                                             14,2
 Northern Cape                                            14,0
 Free State                                               10,3
 KwaZulu-Natal                                            12,6
 North West                                               11,9
 Gauteng                                                   8,1
 Mpumalanga                                               12,8
 Limpopo                                                  12,2
 South Africa                                             11,6

2.3.2 Trends in adolescent birth rate, 1996–2016

Historical trends presented in Figure 2.2 show that ABR was much higher in 1996 at 78 births per 1 000
women aged 15–19 before declining to 65 births per 1 000 women aged 15–19 in 2001. Census 2011
recorded an increase in the ABR to 72 births per 1 000 women aged 15–19, and this rate is almost
consistent with the ABR of 71 births per 1 000 women aged 15–19, as reported by the 2016 SADHS
(NDoH, Stats SA, SAMRC and ICF, 2017).

Figure 2.2: Trends in adolescent birth rate, 1996–2016

Source: DoH/South Africa and Macro International, 2002; Moultrie and Timaeus, 2003; Moultrie and Dorrington, 2004; Stats SA, 2015; NDoH,
Stats SA, SAMRC and ICF, 2017

Demographic Profile of Adolescents in South Africa
Report: 03-00-10
STATISTICS SOUTH AFRICA 27
2.3.3 Adolescent birth rate by population group and province, Census 2001 and Census 2011
Fertility dynamics in South Africa have been documented to differ by population group and province of
residence. Table 2.2 shows that in both the 2001 and 2011 censuses, the ABR was high amongst black
African (71 and 76, respectively) and coloured (60 and 71, respectively) women. However, between 2001
and 2011, the ABR for the coloured population increased by 11 births per 1 000 women, while a reduction
of 5 births per 1 000 women was observed for black Africans. Adolescent childbearing is generally low
amongst the white and Indian/Asian population groups; over the 2001–2011 period, the ABR for white
adolescent women remained unchanged at 14 births per 1 000 women while the birth rate amongst
Indian/Asian women slightly decreased from 22 births per 1 000 women in 2001 to 20 in 2011.
Differentials in ABR are also observed by province of residence. Results indicate that the ABR has
increased from 2001 to 2011 in all the provinces, except Mpumalanga and Limpopo. In 2001,
Mpumalanga (88), Limpopo (85) and KwaZulu-Natal (77) had the highest ABRs. However, in 2011, the
highest ABR was 82 births per 1 000 women for both Mpumalanga and Northern Cape. The two census
years are marked by a lower ABR for Gauteng (48 and 57, respectively), followed by Western Cape (50
and 60, respectively).
Table 2.2: Adolescent birth rate by population group and province, Census 2001 and
Census 2011
Adolescent birth rate per 1 000
women (15–19 years)
2001 2011
Population group
Black African 71 76
Coloured 60 71
Indian/Asian 22 20
White 14 14
Province
Western Cape 50 60
Eastern Cape 60 76
Northern Cape 61 82
Free State 56 71
KwaZulu-Natal 77 78
North West 62 78
Gauteng 48 57
Mpumalanga 88 82
Limpopo 85 76
South Africa 65 72
Source: Estimates derived from published fertility rates by Moultrie and Dorrington, 2004; Stats SA, 2015
Demographic Profile of Adolescents in South Africa
Report: 03-00-10STATISTICS SOUTH AFRICA 28
2.3.4 Contribution of adolescent birth rate to total fertility, Census 2001 and Census 2011
The contribution of the adolescent birth rate (ABR) to total fertility or the proportion of fertility in
adolescence (PAF) is another distinct indicator of adolescent childbearing. Table 2.3 indicates that PAF
for black Africans and coloureds was equal at 12% in 2001. However, in 2011, coloured adolescents
contributed more (14%) to total fertility than other population groups. Over the 2001–2011 period, the
contribution of ABR to total fertility was consistent at 4% amongst white adolescent women, while the PAF
for Indian/Asian women decreased marginally from 6% in 2001 to 5% in 2011.
Provincial differentials indicate that in 2011, the contribution of ABR to total fertility was 14% for four
provinces (Mpumalanga, North West, KwaZulu-Natal and Free State). The highest contribution of 15%
was recorded in Northern Cape. In 2001, a high PAF of 14% was recorded in Mpumalanga, followed by
KwaZulu-Natal (13%) and Northern Cape (13%). An increase of four percentage points in the contribution
of ABR to total fertility was observed in Eastern Cape. In the two census years, the contribution of ABR
to total fertility was constant at 14% and 12% for Mpumalanga and Limpopo, respectively.
Table 2.3: Contribution of adolescent birth rate to total fertility by population group and province
(%), Census 2001 and Census 2011
Contribution of adolescent birth rate to
total fertility (PAF)
2001 2011
Population group
Black African 12 13
Coloured 12 14
Indian/Asian 6 5
White 4 4
Province
Western Cape 10 13
Eastern Cape 9 13
Northern Cape 13 15
Free State 11 14
KwaZulu-Natal 13 14
North West 11 14
Gauteng 10 12
Mpumalanga 14 14
Limpopo 12 12
South Africa 11 13
Estimates derived from published fertility rates by Moultrie and Dorrington, 2004; Stats SA, 2015
Demographic Profile of Adolescents in South Africa
Report: 03-00-10STATISTICS SOUTH AFRICA 29
2.3.5 Distribution of subpopulations according to adolescent birth rate and contribution of
adolescent birth rate to total fertility, 2011
Associations are often made between ABR and the contribution of ABR to total fertility. Therefore, Figure
2.3 shows this association as well as median values of ABR and the contribution of ABR to total fertility
in South Africa. The figure presents the fertility indicators in two clusters, which is high and low. For the
purposes of this report, a PAF that is lower than the median is classified as a low contribution of ABR to
total fertility; equally, birth rates lower than the median are regarded as low ABR. The low fertility
subpopulations in terms of ABR and the contribution of ABR to total fertility are shown to be the white and
Indian/Asian populations. Figure 2.3 show that the PAF and ABR of Western Cape and Gauteng is lower
or equal to the median PAF of 13% and median ABR of 74 births per 1 000 women aged 15-19 years.
Provinces such as Northern Cape, KwaZulu-Natal, North West and Mpumalanga are classified in the high
fertility cluster in terms of adolescent childbearing. Worth noting is that the PAF can be low, even in the
context of a high ABR. This is because the PAF is also influenced by the overall distribution of fertility
across all reproductive ages (UNDESA-PD, 2013).
Figure 2.3: Median adolescent birth rate and contribution of adolescent birth rate to total fertility
by population group and province, Census 2011
Demographic Profile of Adolescents in South Africa
Report: 03-00-10STATISTICS SOUTH AFRICA 30
2.3.6 Marriage as a risk factor for adolescent childbearing, Census 2001, Census 2011 and
CS 2016
Child marriage has been associated with adolescent childbearing – especially in developing countries
(UNFPA, 2015). In South Africa, marriage is less common, and where a marital union is formed, it is
usually late in reproductive life (Panday et al., 2009; Palamuleni, 2010). Table 2.4 shows that the
percentage of adolescent women who have never been married was 95,6% in 2001, 93,8% in 2011 and
then slightly increased to 95,1% in 2016. With the exception of Limpopo and Eastern Cape,
subpopulations mirror the patterns of increases and decreases observed at national level between 2001
and 2016. In 2011, the black African population group recorded the highest number of adolescents who
have never been married (93,9%).
Table 2.4: Percentage of adolescents who have never been married by population group and
province, 2001–2016
Percentage of adolescents who have never been married
2001 2011 2016
Population group
Black African 95,6 93,9 95,2
Coloured 96,0 93,7 95,3
Indian/Asian 95,2 92,2 94,5
White 95,6 92,5 92,6
Province
Western Cape 96,4 93,6 94,9
Eastern Cape 94,5 94,6 96,3
Northern Cape 94,4 94,0 95,5
Free State 96,7 93,4 95,9
KwaZulu-Natal 94,4 94,3 95,1
North West 95,1 93,7 95,0
Gauteng 95,3 91,8 94,9
Mpumalanga 96,8 94,0 94,6
Limpopo 95,8 94,7 94,1
South Africa 95,6 93,8 95,1
2.3.7 Motherhood and school attendance, CS 2016
Early childbearing by adolescent women is widely known to impede schooling by young women, mainly
because the majority do not return to school after having given birth. However, even in contexts where
young women continue with education, they strive to find a balance between schooling and nurturing
infants (Gyan, 2013). Figure 2.4 below highlights a marked difference in school attendance by adolescents
who are mothers and adolescents who have not given birth to a child. Only 51,5% of adolescents who
are mothers were reported to be attending school. Comparatively, 83,2% of childless adolescents in the
same age group were reported to be attending school in 2016.
Demographic Profile of Adolescents in South Africa
Report: 03-00-10STATISTICS SOUTH AFRICA 31
Figure 2.4: Percentage of adolescent mothers who were attending school by age, CS 2016
Findings presented in Table 2.5 do not show a significant difference in school attendance by sex. Overall,
the pattern and level of school attendance is almost similar for both males and females.
Table 2.5: Percentage of adolescents who were attending school by age and sex, CS 2016
Percentage of adolescents attending school
Age Male Female South Africa
15 94,9 95,4 95,2
16 92,1 92,2 92,2
17 85,9 84,8 85,4
18 72,6 68,7 70,6
19 59,4 56,1 57,7
Total 81,1 79,5 80,3
2.4 Summary of findings
The adolescent birth rate decreased in 2001 before increasing in 2011 to 72 births per 1 000 women aged
15–19. The pattern of adolescent fertility follows the overall fertility dynamics of the country. Adolescent
fertility is much higher amongst the black African and coloured population groups, and lower amongst the
Indian/Asian and white adolescent population groups. In 2011, a high ABR was observed in Mpumalanga
(82) and Northern Cape (82). In terms of contribution of ABR to total fertility, the coloured adolescent
population contributed more to total fertility (14%) than other adolescent population groups. Results from
CS 2016 indicated that motherhood increases with age. In 2016, Eastern Cape had the highest
percentage of adolescents who were mothers. The percentage of adolescents who have never been
married was 95,6%, 93,8% and 95,1% in 2001, 2011 and 2016, respectively. The percentage of
adolescent mothers who were attending school was lower compared to that of adolescents who have
never given birth.
Demographic Profile of Adolescents in South Africa
Report: 03-00-10STATISTICS SOUTH AFRICA 32 CHAPTER 3: ADOLESCENT MORTALITY 3.1 Introduction Most studies on mortality focus on infant, under-five and adult mortality; however, between these age groups lies the population of adolescents. The SDG Goal 3 addresses all major health priorities, including reproductive, maternal and child health; communicable, non-communicable and environmental diseases; universal health coverage; and access to safe, effective, quality and affordable medicines and vaccines (United Nations, 2016). In South Africa, the Constitution provides for the right of access to health care services and for other health-related rights (Constitution of South Africa, 1996). In addition to the Constitution, the National Development Plan (NDP) 2030 highlights plans to build a better future for the young people of South Africa. The NDP prioritises policies that will improve the capabilities and life chances of the country’s youthful population (The Presidency, 2011). The National Adolescent and Youth Health Policy 2017 aims for a realistic, practical approach to health programming. It identifies stakeholders involved in the promotion of health amongst youth and emphasises the commitments of the Department of Health (DoH). It foregrounds the critical role of various government departments and agencies in supporting and streamlining the successful implementation of health programmes. The policy advocate for a long and healthy life has identified health priorities for adolescents. Amongst the priorities are adolescent and youth-friendly services; elimination of drug and substance abuse; HIV/AIDS and TB prevention; mental health/illness; sexual and reproductive health; and violence prevention (Department of Health, 2017). The World Health Organization estimated that in 2012, an estimated 1,3 million deaths occurred worldwide amongst adolescents (WHO, 2012). Road injuries, HIV-related causes, suicide, lower respiratory infections, and interpersonal violence were the top five leading causes of death amongst adolescents and young people in 2012. Globally there has been a modest decline in the adolescent mortality rate from 126 deaths per 100 000 in 2000 to 111 per 100 000 in 2012 (WHO, 2012). Despite this overall decline in mortality, the estimated number of global HIV-related deaths amongst adolescents aged 10–19 has nearly tripled from 21 000 in 2000 to 60 000 in 2014, despite a decrease amongst all other age groups (UNAIDS, 2015). During adolescence, particularly amongst older ages, mortality patterns often differ by sex with environmental and behavioural factors beginning to play a central role amongst both boys and girls (Viner, 2011). For instance, the proportion of deaths due to intentional injuries amongst boys rises from 6% at age 10–14 to 22% at age 15–19, while it increases amongst girls from 5 per cent to 14 per cent across the same age groups. For girls between the ages of 15 and 19, however, complications related to pregnancy and childbirth are the second leading cause of death (after self-harm) globally, with little change in the ranking since 2000 (UNICEF, 2014). However, there has been a significant drop in the Demographic Profile of Adolescents in South Africa Report: 03-00-10
You can also read