Myosin-based regulation of twitch and tetanic contractions in mammalian skeletal muscle
←
→
Page content transcription
If your browser does not render page correctly, please read the page content below
RESEARCH ARTICLE

                                         Myosin-based regulation of twitch and
                                         tetanic contractions in mammalian
                                         skeletal muscle
                                         Cameron Hill*, Elisabetta Brunello, Luca Fusi, Jesús G Ovejero, Malcolm Irving

                                         Randall Centre for Cell & Molecular Biophysics, New Hunt’s House, Guy’s Campus,
                                         King’s College London, London, United Kingdom

                                         Abstract Time-resolved X-ray diffraction of isolated fast-twitch muscles of mice was used to
                                         show how structural changes in the myosin-containing thick filaments contribute to the regulation
                                         of muscle contraction, extending the previous focus on regulation by the actin-containing thin
                                         filaments. This study shows that muscle activation involves the following sequence of structural
                                         changes: thin filament activation, disruption of the helical array of myosin motors characteristic of
                                         resting muscle, release of myosin motor domains from the folded conformation on the filament
                                         backbone, and actin attachment. Physiological force generation in the ‘twitch’ response of skeletal
                                         muscle to single action potential stimulation is limited by incomplete activation of the thick filament
                                         and the rapid inactivation of both filaments. Muscle relaxation after repetitive stimulation is
                                         accompanied by a complete recovery of the folded motor conformation on the filament backbone
                                         but by incomplete reformation of the helical array, revealing a structural basis for post-tetanic
                                         potentiation in isolated muscles.

                                         Introduction
*For correspondence:                     The unitary contractile response of skeletal muscle to an action potential in the muscle cell mem-
cameron.hill@kcl.ac.uk                   brane—the twitch—is triggered by a transient increase in intracellular calcium concentration ([Ca2+]i),
                                         leading to calcium binding to troponin in the actin-containing thin filaments. This, in turn, initiates a
Competing interests: The
                                         change in the thin filament structure in which tropomyosin moves from its blocking position in rest-
authors declare that no
                                         ing muscle, allowing myosin head or motor domains from the thick filaments to bind to actin and
competing interests exist.
                                         generate force (Gordon et al., 2000). The duration of the [Ca2+]i transient is much briefer than the
Funding: See page 23                     mechanical response in the twitch, but peak [Ca2+]i is an order of magnitude larger than the dissocia-
Received: 09 March 2021                  tion constant of the Ca2+ regulatory sites on troponin, which become fully occupied with a delay of
Accepted: 11 June 2021                   less than 1 ms after peak [Ca2+]i in mammalian muscle at 28˚C (Baylor and Hollingworth, 2003).
Published: 14 June 2021                  The movement of tropomyosin in the thin filament is also much faster than force development, with
                                         a half-time of about 5 ms as determined by time-resolved X-ray diffraction in amphibian fast-twitch
Reviewing editor: Pekka
Lappalainen, University of
                                         muscles at 22˚C, conditions in which the twitch duration is about 100 ms (Kress et al., 1986).
Helsinki, Finland                           Although the thin filaments are rapidly and fully activated in the twitch, the peak force in the
                                         twitch is much less than that produced at full activation, as produced in intact muscles by repetitive
    Copyright Hill et al. This article
                                         high-frequency stimulation in a tetanus. The force at the tetanus plateau is about four times larger
is distributed under the terms of
                                         than that at the peak of the twitch in mammalian fast-twitch muscles at near-physiological tempera-
the Creative Commons
Attribution License, which               ture. Tetanic stimulation increases the duration, but not the peak amplitude, of the [Ca2+]i transient
permits unrestricted use and             or the peak occupancy of the Ca2+ regulatory sites on troponin compared to that in the twitch
redistribution provided that the         (Baylor and Hollingworth, 2003). It follows that the [Ca2+]i transient provides a ‘start’ signal for con-
original author and source are           traction but does not control either the amplitude or the time course of the twitch in skeletal
credited.                                muscle.

Hill et al. eLife 2021;10:e68211. DOI: https://doi.org/10.7554/eLife.68211                                                                 1 of 26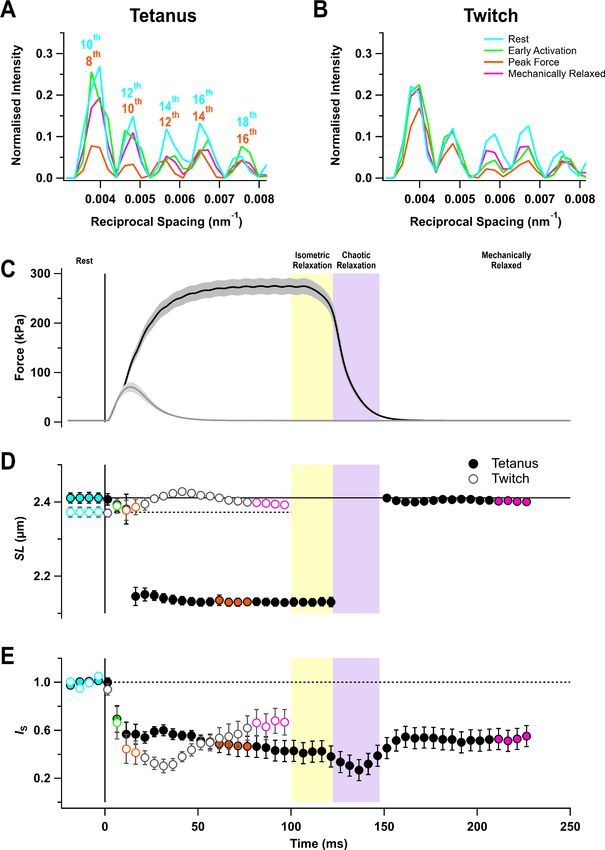
Research article                                                  Physics of Living Systems Structural Biology and Molecular Biophysics

                                        What molecular mechanisms do then determine the strength and speed of the twitch? The rate
                                    of force development is effectively limited by the rate of binding of myosin motors to thin filaments,
                                    as determined from the time course of instantaneous stiffness during force development in tetani of
                                    amphibian muscle at 4˚C after taking filament compliances into account (Brunello et al., 2006;
                                    Fusi et al., 2014a). The question then becomes ‘What determines the rate at which myosin motors
                                    bind to thin filaments?’ One possibility, suggested by mechanical and biochemical studies on
                                    demembranated muscle fibres (Brenner and Eisenberg, 1987; Goldman, 1987), is that a rate-limit-
                                    ing biochemical step in the actin-bound motor controls the transition between weakly and strongly
                                    actin-bound states, the latter being detected by the instantaneous stiffness measurements and
                                    required for active force generation.
                                        An alternative or additional possibility emerged more recently from accumulating evidence that
                                    the thick filament also has a regulatory role. In resting muscle, the myosin motors are not available
                                    to interact with actin and generate contraction because they are folded back against the filament
                                    backbone in a helical array stabilised by interactions with other myosin motors and other thick fila-
                                    ment components, including myosin-binding protein-C (MyBP-C) and titin (Irving, 2017;
                                    Woodhead et al., 2005). This thick filament ‘off’ state, sometimes described as the ‘super-relaxed’
                                    state, minimises ATP hydrolysis and the associated whole-body metabolic cost in resting muscle
                                    (Stewart et al., 2010), but its existence raises the question of how the thick filament, which does
                                    not appear to have a direct calcium signalling mechanism, is activated by electrical stimulation. Part
                                    of the answer to that question was provided by the discovery that the thick filament can be directly
                                    activated by mechanical stress (Fusi et al., 2016; Linari et al., 2015). More generally, X-ray studies
                                    of the rising phase of the tetanus in amphibian muscle at 4˚C showed that switching on the thick fila-
                                    ments is faster than force development (Reconditi et al., 2011). However, the extent to which the
                                    thick filament is switched on during a twitch, or controls the strength and dynamics of the twitch,
                                    has not been investigated.
                                        Finally, the mechanisms that control the strength and speed of contraction in the twitch cannot
                                    be separated from those that control relaxation. From the perspective of [Ca2+]i, and thin filament
                                    regulation, almost the entire time course of the twitch force occurs after [Ca2+]i has returned almost
                                    to baseline, although there may be a small, slow tail in the [Ca2+]i transient (Caputo et al., 1994;
                                    Konishi, 1998), which, even at a very small fraction of the peak, could significantly slow Ca2+ dissoci-
                                    ation from troponin. Moreover, the thin filament may not switch off immediately after Ca2+ has dis-
                                    sociated from troponin because myosin motors that remain bound to actin would hold tropomyosin
                                    in its ‘on’ position in the thin filament. Changes in the length of intact muscle fibres during relaxation
                                    alter the [Ca2+]i transient (Cannell, 1986; Caputo et al., 1994), implying that the extent of [Ca2+]
                                    binding to the thin filament during relaxation is sensitive to muscle length or load. Thick filament
                                    mechano-sensing (Linari et al., 2015) could also contribute to maintaining the ‘on’ state of the thick
                                    filament during relaxation. In isolated myofibrils and in single fibres from amphibian muscle, relaxa-
                                    tion can be clearly separated into a slow, almost linear phase in which sarcomere lengths remain
                                    almost constant (‘isometric relaxation’) followed by mechanical yielding and rapid ‘chaotic relaxation’
                                    in which the remaining force is rapidly lost (Brunello et al., 2009; Poggesi et al., 2005). The extent
                                    to which this phenomenon contributes to the time course of relaxation in intact, fast-twitch mamma-
                                    lian muscle fibres at more physiologically relevant temperatures is unknown.
                                        Here we used time-resolved X-ray diffraction of intact, electrically stimulated, extensor digitorum
                                    longus (EDL) muscles of mice to address these fundamental gaps in understanding the mechanisms
                                    that determine the amplitude and complete time course of the twitch in mammalian muscle, focus-
                                    ing on the X-ray reflections that report the structure and regulatory state of the thick filaments and
                                    the conformations of the myosin motors. The results are complementary to those of a pioneering
                                    time-resolved X-ray study of twitch and tetanus in amphibian muscle that focused on the thin fila-
                                    ment-based X-ray reflections (Kress et al., 1986). All of the present measurements on mouse EDL
                                    muscle were made at 28˚C, a temperature at which the muscles contract reproducibly as required
                                    for signal averaging in X-ray experiments. Moreover, the time course of the [Ca2+]i transient and its
                                    binding to troponin has been characterised in mouse EDL at 28˚C (Baylor and Hollingworth, 2003),
                                    and the peak force is very close to that at the mammalian body temperature (Caremani et al.,
                                    2019). Most importantly, the off structure of the thick filament is preserved in mammalian muscle at
                                    this temperature (Caremani et al., 2021), in contrast with nearly all the published studies of thin fila-
                                    ment regulation, for example, those using pCa titrations with steady-state Ca buffering in skinned

Hill et al. eLife 2021;10:e68211. DOI: https://doi.org/10.7554/eLife.68211                                                                 2 of 26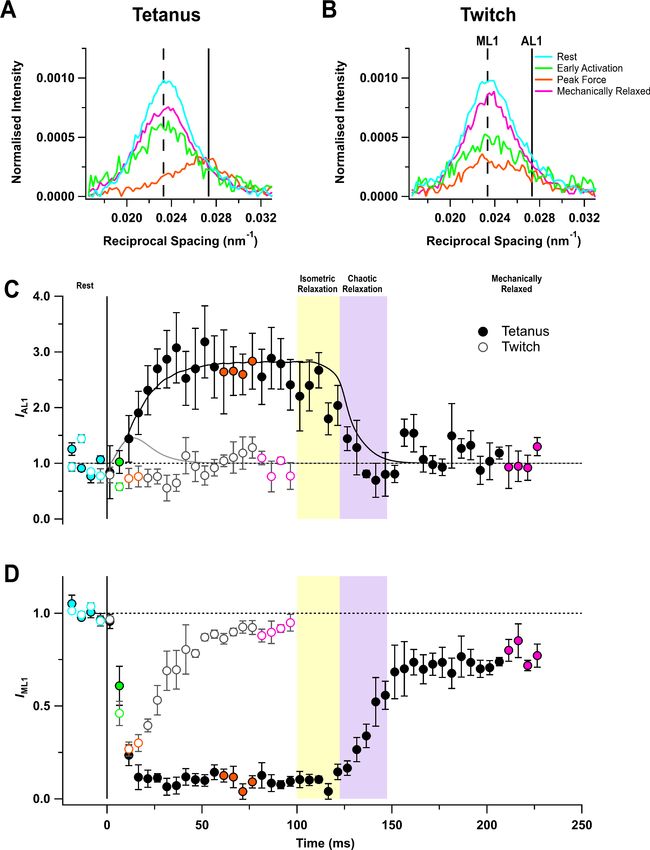
Research article                                                     Physics of Living Systems Structural Biology and Molecular Biophysics

Figure 1. Force and sarcomere length changes in fixed-end twitch and tetanus. (A) Ultra-low-angle X-ray reflections from the sarcomere periodicity with
indicated orders of the fundamental sarcomere length repeat in a tetanus. Cyan, rest; green, early activation; orange, tetanus plateau; magenta,
mechanically relaxed. (B) Corresponding results for the twitch, with orange denoting the peak force in the twitch. (C) Time course of changes in force
with SEM indicated by grey shading. (D) Sarcomere length (SL). (E) Intensity of sarcomere reflections (IS) determined from the average intensities of the
Figure 1 continued on next page

Hill et al. eLife 2021;10:e68211. DOI: https://doi.org/10.7554/eLife.68211                                                                        3 of 26
Research article                                                    Physics of Living Systems Structural Biology and Molecular Biophysics

Figure 1 continued
third and fourth peaks in the region shown in (A) and (B) normalised by the mean resting value. Filled and open symbols in (D) and (E) denote tetanus
and twitch, respectively; coloured symbols denote the time periods used to calculate the profiles in (A) and (B); error bars denote SEM for n = 5
muscles for tetanus and n = 4 muscles for twitch. Yellow- and purple-shaded panels denote isometric and chaotic relaxation. Black horizontal
continuous and dashed lines denote resting values.
The online version of this article includes the following source data for figure 1:
Source data 1. An excel file containing the data for individual muscles from which the mean and SEM shown in Figure 1 were calculated.

                                     muscle fibres, which were made at a relatively low temperature in order to minimise the irreversible
                                     effects of sustained high levels of activation at a high temperature. The role of thick filament regula-
                                     tion was inadvertently excluded from such experiments, because the thick filaments were already
                                     switched on at the low temperature used, even in the absence of calcium.

                                     Results
                                     Sarcomere length changes during twitch and tetanic contractions at
                                     a fixed muscle length
                                     The I22 beamline at the Diamond Light Source allows the X-ray diffraction pattern from intact
                                     muscles to be collected over a wide range of diffraction angles, corresponding to structural perio-
                                     dicities from about 300 to 5 nm. The ultra-low-angle X-ray reflections from the sarcomere periodicity
                                     could therefore be recorded at the same time and from the same region of the muscle as the con-
                                     ventional small-angle reflections that give information about the structure of the thick filaments and
                                     the conformation of the myosin motors. Five sarcomere reflections were observed, corresponding to
                                     even orders of the sarcomere repeat from the 10th to the 18th order in resting muscle (Figure 1A,B,
                                     cyan) (Bordas et al., 1987; Reconditi et al., 2014). Sarcomere length in the resting muscles was
                                     about 2.4 mm (Figure 1D; Table 1).
                                        The sarcomere reflections became much weaker during stimulation, but sarcomere length in the
                                     tetanus reached a roughly constant value of 2.13 mm from about 20 ms after the first stimulus
                                     (Figure 1D, filled circles; Table 1), indicating that the sarcomeres in the central region of the muscle

                                     Table 1. Force, sarcomere length, and X-ray parameters at rest and peak force in twitch and
                                     tetanus.
                                     Rest, average of four frames from 18.5 ms to 3.5 ms for twitch and tetanus; PF tetanus, average of
                                     four frames from 61.5 ms to 76.5 ms; PF twitch, average of two frames at 11.5 ms and 16.5 ms. All
                                     X-ray intensities have been normalised by their resting values. Mean ± SEM for n = 5 for tetanus and
                                     n = 4 for twitch. SL, sarcomere length.
                                                         Tetanus                                                 Twitch
                                                         Rest                   PF                               Rest                    PF
                                     Force (kPa)         -                      273 ± 16                         -                       68 ± 10
                                     SL (mm)             2.41 ± 0.01            2.13 ± 0.01                      2.37 ± 0.01             2.38 ± 0.03
                                     d1,0 (nm)           35.32 ± 0.11           35.74 ± 0.17                     35.07 ± 0.15            35.44 ± 0.25
                                     I1,1/I1,0           0.41 ± 0.02            1.77 ± 0.14                      0.39 ± 0.01             0.93 ± 0.05
                                     IAL1                1                      2.66 ± 0.43                      1                       0.74 ± 0.11
                                     IML1                1                      0.09 ± 0.03                      1                       0.28 ± 0.04
                                     AML1                1                      0.36 ± 0.06                      1                       0.53 ± 0.04
                                     AAL1                1                      1.61 ± 0.13                      1                       0.84 ± 0.07
                                     IM3                 1                      3.21 ± 0.26                      1                       0.69 ± 0.13
                                     SM3 (nm)            14.339 ± 0.003         14.535 ± 0.002                   14.344 ± 0.004          14.425 ± 0.004
                                     IM6                 1                      1.12 ± 0.26                      1                       0.81 ± 0.15
                                     SM6 (nm)            7.173 ± 0.002          7.283 ± 0.001                    7.173 ± 0.002           7.241 ± 0.002

Hill et al. eLife 2021;10:e68211. DOI: https://doi.org/10.7554/eLife.68211                                                                      4 of 26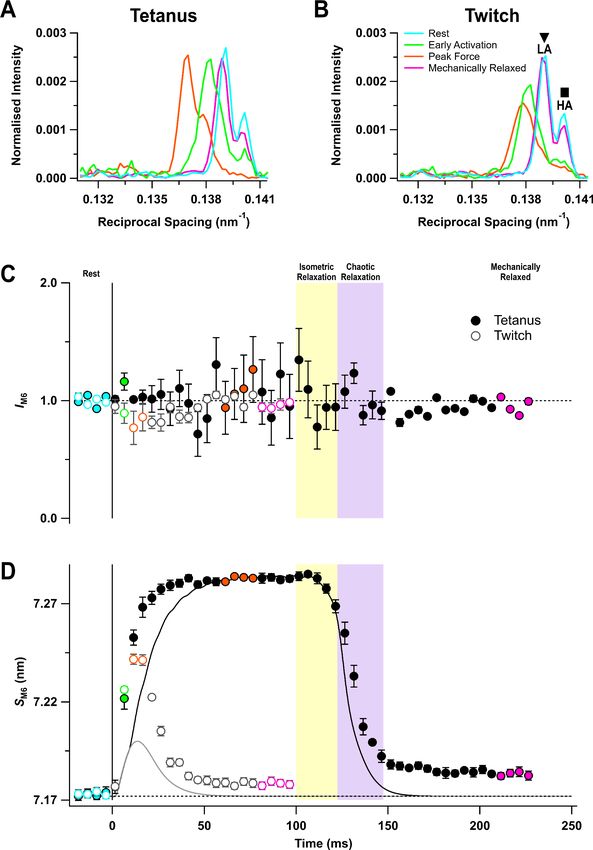
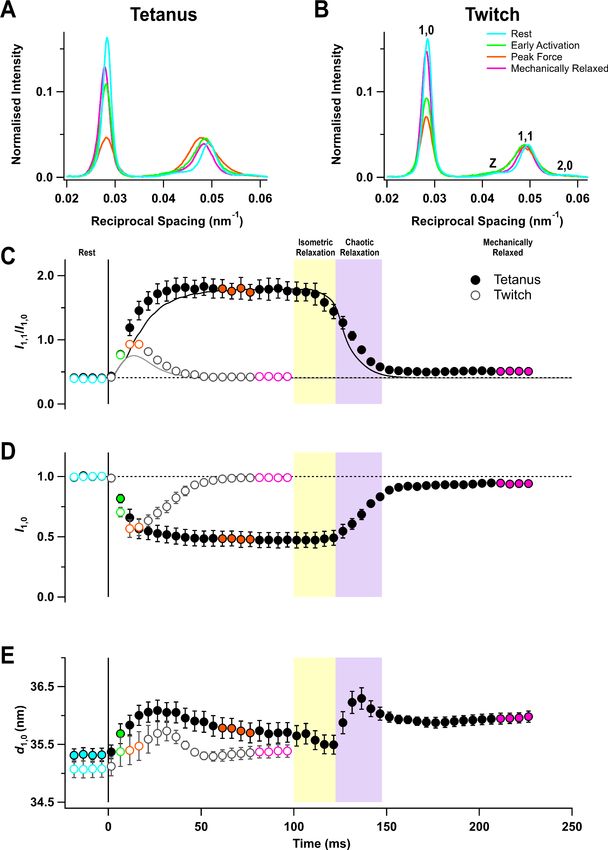
Research article                                                       Physics of Living Systems Structural Biology and Molecular Biophysics

Figure 2. Equatorial X-ray reflections. (A) Distribution of intensity along the equator of the diffraction pattern, perpendicular to the muscle long axis, in
different phases of a tetanus. Cyan, rest; green, early activation; orange, tetanus plateau; magenta, mechanically relaxed. (B) Corresponding results for
the twitch, with orange denoting the peak force in the twitch. (C) Time course of the ratio of the intensities of (1,0) and (1,1) reflections (I1,1/I1,0)
superimposed on the force in the tetanus (black) and twitch (grey). (D) Time course of the intensity of (1,0) reflection (I1,0) normalised by the mean
Figure 2 continued on next page

Hill et al. eLife 2021;10:e68211. DOI: https://doi.org/10.7554/eLife.68211                                                                            5 of 26
Research article                                                  Physics of Living Systems Structural Biology and Molecular Biophysics

Figure 2 continued
resting value. (E) Time course of the filament lattice spacing parameter d1,0. Filled and open symbols in (C), (D), and (E) denote tetanus and twitch
respectively; coloured symbols denote the time periods used to calculate the profiles in (A) and (B); error bars denote SEM for n = 5 muscles for
tetanus and n = 4 muscles for twitch. Yellow- and purple-shaded panels denote isometric and chaotic relaxation. Black horizontal dashed lines denote
resting values.
The online version of this article includes the following source data for figure 2:
Source data 1. An excel file containing the data for individual muscles from which the mean and SEM shown in Figure 2 were calculated.

                                         from which the X-ray signals were recorded had shortened by about 12%, presumably by stretching
                                         the tendons or compliant regions at the ends of the muscle fibres. This sarcomere length was main-
                                         tained for about 20 ms after the last stimulus while force decreased to about 80% of its plateau value
                                         (Figure 1C,D, filled circles). Sarcomere lengths then suddenly became inhomogeneous, and it was
                                         not possible to assign sarcomere reflections or determine sarcomere lengths until ~50 ms after the
                                         last stimulus when force relaxation was more than 95% complete. Relaxation of mouse EDL muscle
                                         from 100-ms tetani, therefore, exhibits clear ‘isometric’ and ‘chaotic’ phases similar to those
                                         described previously in isolated myofibrils and single fibres from amphibian muscle (Brunello et al.,
                                         2009; Poggesi et al., 2005). By 50 ms after the last stimulus, the sarcomere length had recovered
                                         to close to its pre-stimulus value, although sarcomere heterogeneity had not recovered as indicated
                                         by the continued low intensity of the sarcomere reflections (Figure 1E). There appeared to be little
                                         sarcomere shortening in the twitch (Figure 1D, open circles), although the very low intensity of the
                                         sarcomere reflections (Figure 1E, open circles) suggests that sarcomere lengths became inhomoge-
                                         neous, as during the first 20 ms of the tetanus.

                                         Equatorial X-ray reflections
                                         The equator of the X-ray diffraction pattern from resting muscles, reporting the diffraction profile
                                         perpendicular to the long axis of the muscle and filaments (Figure 2A,B, cyan), shows the (1,0 , 1,1)
                                         and (2,0) reflections from the hexagonal lattice of thick and thin filaments and the Z reflection from
                                         the square lattice of thin filaments at the Z-disc. The (1,0) reflection became much weaker on activa-
                                         tion in both the tetanus (Figure 2A, orange) and the twitch (Figure 2B), signalling motion of the
                                         myosin motors away from the thick filament backbone (Haselgrove and Huxley, 1973). The (1,1)
                                         reflection became broader on activation and its integrated intensity increased (Figure 2A,B, orange),

Table 2. Half-times of force and X-ray parameters during activation and relaxation.
Half-times (t1/2) for the rising phase of the tetanus (activation) and for relaxation following tetanus and twitch. t1/2 values for X-ray
parameters were determined by fitting sigmoidal curves to the 5-ms time interval data. t1/2 values for tetanus activation and twitch
relaxation are reported with respect to the first stimulus at time 0 and those for tetanus relaxation with respect to the last stimulus at
100 ms. Rows are sorted by t1/2 for tetanus activation, with the fastest signals at the top. No clear change in AAL1 was observed during
the twitch. LM3, MM3, and HM3 are, respectively, the fractional intensities of the low-, mid- and high-angle peaks of the M3 reflection in
Figure 5E. n = 5 muscles for tetanus and n = 4 muscles for twitch. Data presented are mean ± SEM. *A significant difference in t1/2 for
the X-ray parameter with respect to force in that phase. *p
Research article Physics of Living Systems Structural Biology and Molecular Biophysics Figure 3. Myosin- and actin-based layer line reflections. (A) Axial distribution of diffracted intensity in the region of the mixed myosin/actin first layer line in different phases of a tetanus. Cyan, rest; green, early activation; orange, tetanus plateau; magenta, mechanically relaxed. The vertical dashed and continuous lines denote the global best-fit reciprocal spacings of the myosin- and actin-based layer lines, respectively. (B) Corresponding results for the twitch, with orange denoting the peak force in the twitch. (C) Time course of the intensity of the first actin layer line (IAL1) normalised to the Figure 3 continued on next page Hill et al. eLife 2021;10:e68211. DOI: https://doi.org/10.7554/eLife.68211 7 of 26
Research article                                                      Physics of Living Systems Structural Biology and Molecular Biophysics

Figure 3 continued
mean resting value and superimposed on the force in tetanus (black) and twitch (grey). (D) Time course of the intensity of the first myosin layer line
(IML1) normalised to the mean resting value. Filled and open symbols in (C) and (D) denote tetanus and twitch, respectively; coloured symbols denote
the time periods used to calculate the profiles in (A) and (B); error bars denote SEM for n = 5 muscles for tetanus and n = 4 muscles for twitch. Yellow-
and purple-shaded panels denote isometric and chaotic relaxation. Black horizontal dashed lines denote resting values.
The online version of this article includes the following source data for figure 3:
Source data 1. An excel file containing the data for individual muscles from which the mean and SEM shown in Figure 3 were calculated.

                                     signalling not only increased mass at the trigonal positions of the filament lattice occupied by the
                                     thin filaments, but also increased disorder.
                                         The ratio of the intensities of (1,1) and (1,0) reflections (I1,1/I1,0) signals the movement of myosin
                                     motors from the vicinity of the thick filaments towards the thin filaments (Haselgrove and Huxley,
                                     1973). I1,1/I1,0 was ~0.4 at rest and ~1.8 at the tetanus plateau, similar to values reported previously
                                     for mouse EDL (Caremani et al., 2019), and ~0.9 at the peak of the twitch (Table 1). The increase in
                                     I1,1/I1,0 was faster than force development at the start of the tetanus (Figure 2C, filled circles;
                                     Table 2), as observed in single fibres from amphibian fast skeletal muscle (Cecchi et al., 1991). Since
                                     the fraction of myosin motors strongly attached to actin has the same time course as force
                                     (Brunello et al., 2006), the faster change in I1,1/I1,0 shows that myosin motors move towards the thin
                                     filaments before they bind strongly to actin or generate force. No clear delay was detected in a sin-
                                     gle twitch, but this may be due to the low time resolution of the X-ray framing compared to the
                                     speed of force development (Figure 2C, open circles).
                                         Following tetanic stimulation, I1,1/I1,0 decreased during both isometric and chaotic relaxation.
                                     However, this change was almost entirely due to a decrease in I1,1, and I1,0 did not change during
                                     isometric relaxation (Figure 2D, filled circles), suggesting that myosin motors detached from actin
                                     but did not return to the folded ‘off’ conformation. A small deficit in I1,0 with respect to its pre-stimu-
                                     lus value was apparent when mechanical relaxation was complete.
                                         The lateral spacing of the hexagonal lattice of thick and thin filaments (d1,0; Figure 2E) increased
                                     on activation in both the twitch and tetanus, but its time course did not match with that of either
                                     force or sarcomere length. Moreover, d1,0 did not recover to its pre-stimulus value by the time
                                     mechanical relaxation was complete, which may be related to the incomplete recovery of sarcomere
                                     order (Figure 1E).

                                     Layer line reflections
                                     The quasi-helical arrangement of myosin motors on the surface of the thick filaments in resting mus-
                                     cle produces a series of off-axial layer line reflections, of which the most intense is the first myosin
                                     layer line (ML1), corresponding to a periodicity of 43 nm along the filament axis (Huxley and Brown,
                                     1967; Caremani et al., 2019; Ma et al., 2020). However, the ML1 layer line overlaps the nearby
                                     actin-based layer line (AL1) associated with the fundamental helical periodicity of the actin
                                     filament, ~37 nm (ibid) (Figure 3A,B). The AL1 and ML1 reflections were separated by global Gauss-
                                     ian deconvolution of the time series data under the simplifying assumption that their spacings, SAL1
                                     and SML1 respectively, do not change during contraction (see ’Materials and methods’). This proce-
                                     dure allowed us to determine the time courses of IAL1 (Figure 3C) and IML1 (Figure 3D). The global
                                     best fit values of SAL1 and SML1 were 36.6 ± 0.1 (mean ± SE, n = 5) and 43.0 ± 0.1 nm, respectively.
                                     IAL1 increased by a factor of almost three in the tetanus (Figure 3C) with a time course similar to that
                                     of force development, but recovered faster than force during isometric and chaotic relaxation, show-
                                     ing that myosin motors detach from actin in both phases.
                                         The profile of the mixed ML1/AL1 layer line showed little change during a twitch (Figure 3B), and
                                     global deconvolution failed to identify an AL1 component. When SAL1 was fixed at the value
                                     observed during the tetanus, no increase in IAL1 was detected during the twitch (Figure 3C, open
                                     circles). The intensity of the first myosin layer line (IML1) decreased following the start of stimulation
                                     (Figure 3D) with a time course much faster than that of force development, showing that the loss of
                                     folded helical conformation of myosin motors on activation is much faster than their attachment to
                                     actin (Figure 3D; Table 2). Consistent with this faster response, IML1 decreased almost as much at
                                     the peak of the twitch (Figure 3D, open circles; Table 1) as at the plateau of the tetanus (filled
                                     circles).

Hill et al. eLife 2021;10:e68211. DOI: https://doi.org/10.7554/eLife.68211                                                                         8 of 26
Research article Physics of Living Systems Structural Biology and Molecular Biophysics Figure 4. The M6 reflection. (A) Axial distribution of diffracted intensity in the region of the M6 reflection in different phases of a tetanus corrected by the cross-meridional width. Cyan, rest; green, early activation; orange, tetanus plateau; magenta, mechanically relaxed. (B) Corresponding results for the twitch, with orange denoting the peak force in the twitch. (C) Time course of the width-corrected intensity of the M6 reflection (IM6) normalised to the mean resting value. (D) Time course of the spacing of the M6 reflection (SM6) superimposed on the force in tetanus (black) and twitch (grey). Filled Figure 4 continued on next page Hill et al. eLife 2021;10:e68211. DOI: https://doi.org/10.7554/eLife.68211 9 of 26
Research article Physics of Living Systems Structural Biology and Molecular Biophysics
Figure 4 continued
and open symbols in (C) and (D) denote tetanus and twitch, respectively. Coloured symbols denote the time periods used to calculate the profiles in (A)
and (B); error bars denote SEM for n = 5 muscles for tetanus and n = 4 muscles for twitch. Yellow- and purple-shaded panels denote isometric and
chaotic relaxation. Black horizontal dashed lines denote resting values.
The online version of this article includes the following source data and figure supplement(s) for figure 4:
Source data 1. An excel file containing the data for individual muscles from which the mean and SEM shown in Figure 4 were calculated.
Figure supplement 1. Fractional intensities and spacings of the low-angle and high-angle components of the M6 reflection.
IML1 did not recover during isometric relaxation after tetanic stimulation (Figure 3D, filled circles),
consistent with the above conclusion that myosin motors do not reform the folded helical conforma-
tion in this phase, despite the fall of force and detachment of myosin motors from actin. IML1 recov-
ered rapidly but incompletely during chaotic relaxation; the ‘off’ conformation of the myosin motors
characteristic of the resting state had not been recovered even 120 ms after the last stimulus. A
smaller recovery deficit was observed after mechanical relaxation in a twitch (open circles).
Meridional reflections
The meridional region of the diffraction pattern from skeletal muscle is dominated by a series of
myosin-based reflections that are generally considered to be of orders of the fundamental ~43 nm
axial periodicity of the first myosin layer line, and designated as M1, M2, M3, and so on. Each of
these M meridional reflections is in fact a cluster of closely spaced sub-peaks, and in some cases,
these can be ascribed to X-ray interference between the two arrays of myosin motors in each thick
filament (Caremani et al., 2021; Linari et al., 2000).
The M6 reflection
The M6 reflection is associated with a periodic structure in the thick filament backbone with an axial
repeat of ~7.2 nm (Reconditi et al., 2004; Huxley et al., 2006). It has two closely spaced sub-peaks
both at rest (Figure 4A,B, cyan) and at peak force (orange). The intensity of M6 reflection (IM6) was
roughly constant during activation, within the reproducibility of the data (Figure 4C), but its spacing
(SM6) increased consistently by 1.54 ± 0.02% at the peak of the tetanus (Figure 4D, filled circles;
Table 1), and by 0.95 ± 0.04% at the peak of the twitch (open circles). This spacing increase is associ-
ated with activation of the thick filament (Haselgrove, 1975). SM6 increased much faster than force
at the start of the tetanus (Table 2). Following the last stimulus, SM6 recovered with the same
time course as force during isometric relaxation, but more slowly during chaotic relaxation
(Figure 4D, filled circles). SM6 recovery was still incomplete more than 120 ms after the last stimulus,
and there was a smaller recovery deficit following a twitch.
In resting muscle, the lower angle (LA) sub-peak of the M6 reflection is more intense than the
higher angle (HA) sub-peak (Figure 4A,B), and the relative intensity is similar at the tetanus plateau
(Caremani et al., 2019; Figure 4A – Figure 4—figure supplement 1B). The separation between the
sub-peaks at rest was 0.0011 nm 1, consistent with them being generated by X-ray interference
between diffractors in the region corresponding to the first 45 of the 49 layers of myosin motors in
each half of the thick filament, counting from its midpoint (Caremani et al., 2021). The spacing of
the two sub-peaks increased by almost the same amount during the tetanus (Figure 4—figure sup-
plement 1C, filled symbols), suggesting that the same diffracting structures are responsible for the
M6 reflection during the tetanus. However, at the peak of the twitch (Figure 4B, orange) and early
during the tetanus rise (Figure 4A, green), the HA peak became less intense and the inter-peak sep-
aration was larger (Figure 4—figure supplement 1B,C).
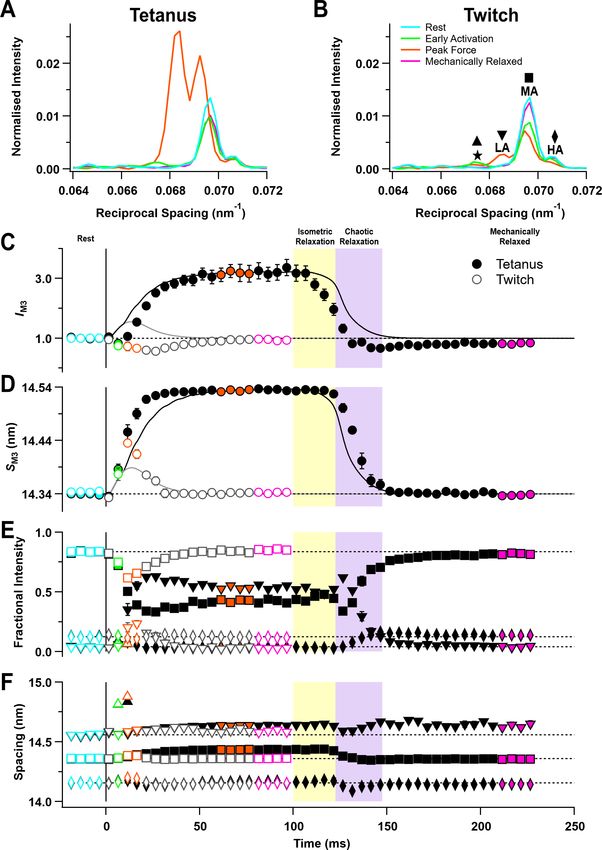
The M3 reflection
The M3 reflection is associated with the axial periodicity of the myosin motors along the thick fila-
ments and has been used extensively to obtain information about the conformation and motion of
myosin motors during activation, force generation, and relaxation (Brunello et al., 2009;
Brunello et al., 2006; Reconditi et al., 2011; Reconditi et al., 2004). The intensity of the M3 reflec-
tion (IM3) decreased transiently in the tetanus before becoming about three times larger than at rest
at the tetanus plateau (Figure 5C, filled circles; Table 1). The initial decrease may be partly due to
Hill et al. eLife 2021;10:e68211. DOI: https://doi.org/10.7554/eLife.68211 10 of 26Research article Physics of Living Systems Structural Biology and Molecular Biophysics Hill et al. eLife 2021;10:e68211. DOI: https://doi.org/10.7554/eLife.68211 11 of 26
Research article Physics of Living Systems Structural Biology and Molecular Biophysics
Figure 5. The M3 reflection. (A) Axial distribution of diffracted intensity in the region of the M3 reflection in different phases of a tetanus corrected by
the cross-meridional width. Cyan, rest; green, early activation; orange, tetanus plateau; magenta, mechanically relaxed. (B) Corresponding results for
the twitch, with orange denoting peak force in the twitch. The star, low-angle (LA), mid-angle (MA), and high-angle (HA) sub-peaks are indicated. (C)
Time course of the width-corrected intensity of the M3 reflection (IM3) normalised to the mean resting value and superimposed on the force in tetanus
(black) and twitch (grey). (D) Time course of the spacing of the M3 reflection (SM3) with force superimposed. (E) Fractional intensities of the star
(triangles), low-angle (LA; inverted triangles), mid-angle (MA; squares), and high-angle (HA; diamonds) sub-peaks with symbols defined in panel (B). (F)
Spacings of the star, LA, MA, and HA sub-peaks with symbols defined in panel (B). Filled and open symbols in (C–F) denote tetanus and twitch,
respectively. Coloured symbols denote the time periods used to calculate the profiles in (A) and (B); error bars denote SEM for n = 5 muscles for
tetanus and n = 4 muscles for twitch. Yellow- and purple-shaded panels denote isometric and chaotic relaxation. Black horizontal dashed lines denote
resting values.
The online version of this article includes the following source data and figure supplement(s) for figure 5:
Source data 1. An excel file containing the data for individual muscles from which the mean and SEM shown in Figure 5 were calculated.
Figure supplement 1. Fractional intensities of the sub-peak components of the M3 reflection.
Figure supplement 2. Spacings of the sub-peak components of the M3 reflection.
the loss of some of the helically folded myosin motors that were present in the resting muscle and
partly due to the destructive interference between the actin-attached and folded populations of
motors (Reconditi et al., 2011). The slower increase is associated with formation of actin-attached
force-generating motors that have their long axes more perpendicular to the filament axis. IM3 only
decreased in the twitch (open circles).
The spacing of the M3 reflection (SM3) increased by 1.36 ± 0.01% at the tetanus plateau and by
0.57 ± 0.05% at the peak of the twitch (Figure 5D, Table 1), slightly smaller than the corresponding
percentage increases in SM6 described above. The increase in SM3 during the rising phase of the tet-
anus was faster than force but slower than SM6 (Table 2). SM3 remained remarkably constant during
isometric relaxation (Figure 5D, filled circles), although IM3 recovered substantially towards its rest-
ing value (Figure 5C), indicating that the motors that detach from actin during isometric relaxation
become disordered. SM3 decreased rapidly at the onset of chaotic relaxation and had completely
recovered to its resting value at the end of mechanical relaxation. IM3 had a small but reproducible
deficit after the tetanus.
The M3 reflection from resting muscle contains three sub-peaks (LA, MA, HA; Figure 5B) with
separations that are consistent with X-ray interference between the two myosin head arrays in each
thick filament (Caremani et al., 2021; Linari et al., 2000). The fractional intensity of the LA peak
increased during the rise of force in the tetanus (Figure 5—figure supplement 1C, filled inverted tri-
angles; Table 1), while that of the MA peak decreased (Figure 5—figure supplement 1D, filled
squares). The time course of these changes was similar to that of SM3 but faster than force (Table 2).
The fractional intensity of the HA peak (Figure 5—figure supplement 1E, diamonds) changed much
less and was almost the same at the tetanus plateau and at rest. The changes in the fractional inten-
sities of the LA and MA peaks during the twitch (Figure 5E, open inverted triangles and squares)
were much smaller than those in the tetanus (filled symbols). The spacings of the LA and MA peaks
(Figure 5—figure supplement 2C,D, inverted triangles and squares) increased during the tetanus,
but those of the HA peak (Figure 5—figure supplement 1E, diamonds) were the same at the teta-
nus plateau and at rest. The fractional intensities and spacings of the M3 sub-peaks were almost con-
stant during isometric relaxation at the end of the tetanus (Figure 5E,F).
Unexpectedly, a new peak appeared transiently on the LA side of the M3 reflection about 10 ms
after the start of stimulation (Figure 5A,B, green), with a spacing of 14.832 ± 0.013 nm during the
tetanus rise (Figure 5—figure supplement 2B, green triangle) and 14.878 ± 0.018 nm at the peak of
the twitch (orange triangle). This peak, labelled the ‘star’ peak in Figure 5B (Caremani et al., 2021),
was not detectable in resting muscle, after mechanical relaxation, or at the tetanus plateau. A peak
with a similar spacing was seen previously on cooling of resting EDL muscle of mice and demembra-
nated fibres from rabbit psoas muscle (Caremani et al., 2021; Caremani et al., 2019), an interven-
tion that mimics activation of the thick filament. The separation between the star and LA peaks was
larger than that between the LA and MA or MA and HA peaks (Figure 5F).
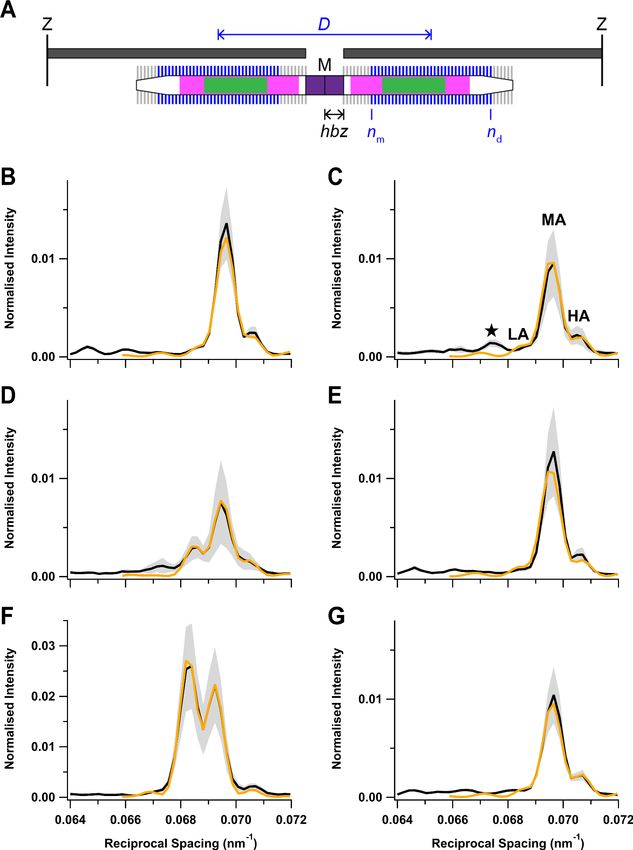
Hill et al. eLife 2021;10:e68211. DOI: https://doi.org/10.7554/eLife.68211 12 of 26Research article Physics of Living Systems Structural Biology and Molecular Biophysics Figure 6. Fitting the axial profile of the M3 reflection with a structural model of the thick filament. (A) Schematic diagram of the sarcomere for the best- fit model parameters at peak force in the twitch. The sarcomere is delimited by Z-disks (black) and contains overlapping actin (dark grey) and myosin (white) filaments. Myosin filament midpoint, M; layers of myosin motors, vertical lines on myosin filament; bare zone at the centre of the sarcomere lacking myosin motors, purple; half-bare zone, hbz; zone of the thick filament containing titin C-type repeats, magenta; myosin-binding protein-C- Figure 6 continued on next page Hill et al. eLife 2021;10:e68211. DOI: https://doi.org/10.7554/eLife.68211 13 of 26
Research article                                                     Physics of Living Systems Structural Biology and Molecular Biophysics

Figure 6 continued
containing C-zone, green. Ordered layers of myosin motors (blue vertical bars between medial layer nm and distal layer nd) in the two half-thick
filaments have a centre-to-centre or interference distance D, shown in blue. Disordered layers are shown in grey. (B–G) Experimental meridional
intensity distribution in the region of the M3 reflection (black) with superimposed best fits from the model (orange). Rest (B); early activation (C); twitch
peak force (D); twitch mechanical relaxation (E); tetanus plateau (F); tetanus mechanical relaxation (G). Shaded grey areas indicate ± SD from nine (B, C),
four (D, E), or five (F, G) muscles.
The online version of this article includes the following source data for figure 6:
Source data 1. An excel file containing the data for individual muscles from which the mean and SEM shown in Figure 6 were calculated.

                                      Modelling the axial profile of the M3 reflection
                                      The relative intensities and spacings of the sub-peaks of the M3 reflection give information about
                                      the axial motion of the diffracting structures—the myosin motors—and their location in the thick fila-
                                      ment (Figure 6A; Brunello et al., 2020). The thick filament is symmetrical about the M-line, and
                                      each half-filament contains 49 layers of myosin motors with axial periodicity d, with the first layer at
                                      a distance hbz (half-bare zone) from the filament mid-point. Only axially ordered myosin motors
                                      (blue) from medial layer nm to distal layer nd contribute to the diffraction pattern, and the motors in
                                      the other layers (grey) are considered to be disordered (see ’Materials and methods’ for details).
                                      This model gave a good fit (Figure 6B–G, orange) to the central region of the M3 profiles containing
                                      the LA, MA, and HA sub-peaks, yielding estimates for hbz, d, nm, and nd in each condition (Table 3).
                                      The model did not reproduce the star peak observed during early activation (Figure 6C, black) or
                                      the other small peaks on the LA side of the M3 reflection at rest (Figure 6B), suggesting that they
                                      are due to the presence of distinct diffracting structures with a slightly longer axial periodicity
                                      (Caremani et al., 2021).
                                         As expected from the similarity of the experimental M3 profiles, the best-fit model parameters
                                      were similar at rest and following mechanical relaxation after a twitch or tetanus (Figure 6B,E,G;
                                      Table 3). nm was 2 and nd close to 46, indicating that nearly all 49 layers of myosin motors were
                                      ordered, with the likely exception of three layers at the filament tips. At the tetanus plateau
                                      (Figure 6F), all layers were ordered; nm was 1 and nd was 49. nd was slightly smaller during early acti-
                                      vation and at the peak of the twitch (Figure 6C,D), and nm was larger at the peak of the twitch, indi-
                                      cating that only myosin motors in a central region of each half-filament were ordered (Figure 6A),
                                      though that region did not correspond to either the conventional ‘C-zone’ defined by the presence
                                      of MyBP-C (green) or the ‘C-type’ titin repeats (magenta) (Bennett et al., 2020; Caremani et al.,
                                      2021; Tonino et al., 2019).
                                         The hbz parameter gives a measure of the centre of mass of the myosin motors with respect to
                                      their head-rod junctions and therefore of the motor conformation (Reconditi et al., 2011). Motor
                                      conformation at the tetanus plateau was previously estimated from experiments on amphibian mus-
                                      cle in which it was perturbed by small lengths or load steps (Huxley et al., 2006; Irving et al., 2000;
                                      Piazzesi et al., 2007). Those studies showed that the average centre of mass of the motors at the
                                      tetanus plateau was about 3 nm farther from the M line than their head-rod junctions, and it was

Table 3. Interpretation of the axial profile of the M3 reflection: best-fit model parameters.
The rows denote the different phases of the tetanus and twitch defined in Figure 6. Half-bare zone, hbz; medial and distal layers mark-
ing the ends of the region of ordered myosin motors, nm and nd, respectively; axial periodicity between adjacent layers of myosin
motors, d; intensity scaling factor, y; interference distance, ID. Mean ± SD from N muscles.
                           N             hbz (nm)                nm               nd                d (nm)                     y                    ID (nm)
Rest                       9             79.51 ± 0.14            2±1              46 ± 3            14.348 ± 0.010             4.5 ± 0.6            814 ± 39
Early activation           9             79.40 ± 0.22            3±1              42 ± 3            14.362 ± 0.008             4.9 ± 1.0            776 ± 53
Twitch PF                  4             85.65 ± 0.37            9±2              43 ± 2            14.416 ± 0.013             5.1 ± 1.8            881 ± 25
Twitch relax               4             79.52 ± 0.12            2±1              45 ± 3            14.348 ± 0.009             4.7 ± 0.8            790 ± 35
Tetanus PF                 5             90.58 ± 0.10            1±0              49 ± 1            14.552 ± 0.003             2.0 ± 0.7            874 ± 8
Tetanus relax              5             79.61 ± 0.07            2±1              46 ± 0            14.340 ± 0.003             5.5 ± 1.3            822 ± 12

Hill et al. eLife 2021;10:e68211. DOI: https://doi.org/10.7554/eLife.68211                                                                          14 of 26
Research article Physics of Living Systems Structural Biology and Molecular Biophysics
about 8 nm closer to the M line at rest (Reconditi et al., 2011). The average movement of the centre
of mass of the myosin motors away from the M line on activation was 11 nm, the same as in the pres-
ent experiments (Table 3). However, the best-fit hbz values in Table 3 also show that there was no
significant axial motion of the myosin heads during early activation, reflecting the similarity of the
intensity of the LA peak at this time point (Figure 5A,E, green; Figure 6C) to that at rest
(Figure 5A,E, cyan; Figure 6B) and in marked contrast to the large reduction of the helical order of
the myosin heads during early activation signalled by IML1 (Figure 3D, green). The folded state is
completely recovered after mechanical relaxation in a tetanus, again, in contrast to the incomplete
recovery of the helical order signalled by IML1. At the peak of the twitch, hbz had moved by about 6
nm, about half-way to its tetanus plateau value, suggesting that a significant fraction of motors
remain in the folded state in the twitch.
Discussion
The results presented above allow structural changes in the thick filaments and myosin head or
motor domains to be followed with 5 ms time resolution during activation and relaxation of intact
mouse EDL muscle. The functional significance of these structural changes is clearer for tetanus than
for twitch, in which activation and relaxation are clearly separated by a period of steady-state sarco-
mere-isometric contraction in which the thin filaments are maximally activated by calcium. Changes
in thick filament structure during the tetanus can be correlated with force changes in five sequential
phases, which we refer to as activation, tetanus plateau, isometric relaxation, chaotic relaxation, and
mechanically relaxed, where the latter is distinct from the resting state achieved several minutes
after a previous contraction. Where analogous protocols have been employed, the changes in the
thick-filament-based X-ray reflections in these five phases are qualitatively similar to those described
previously in fast-twitch amphibian muscles, as described below. The structural mechanisms of thick
filament regulation in skeletal muscle have been well conserved across evolution in these species,
and this allows the present results to be integrated into the large body of physiological, structural,
and mechanical studies on isolated single fibres of amphibian muscle, exploiting the greater homo-
geneity and lower end-compliance of that preparation. However, most of the published X-ray studies
on amphibian muscle fibres were conducted before the significance of thick-filament-based regula-
tion was appreciated; so the synthesis leads to new insights into the underlying mechanisms. No pre-
vious muscle X-ray study, to our knowledge, has considered the five phases of the tetanus together
or related those phases to the unitary physiological response of skeletal muscle to a single nerve
impulse, the twitch.
Activation
The fastest changes in thick filament structure during activation are the loss of the helical order of
the myosin motors, signalled by the ML1 reflection, and the elongation of the filament backbone,
signalled by SM6. The fraction of molecules in a given conformation is proportional to the amplitude
(A) of an X-ray reflection, the square root of its intensity. Therefore, the half-time for the loss of the
helical order of the myosin motors during the tetanus rise was estimated from the change in AML1,
which has a half-time of about 8 ms, the same as that of SM6 (Table 2). A second group of signals,
including the equatorial intensity ratio (I1,1/I1,0), the fractional intensity of the LA peak of the M3
reflection (LM3), and the axial spacing of the myosin motors (SM3), have half-times that are slightly
slower, about 11 ms. Moreover, in the early activation time-frame, centred at 6.5 ms after the stimu-
lus, IML1 had reduced by 50% (Figure 3D, green), but there was no axial movement of the centre of
mass of the myosin motors (hbz, Table 3), strongly suggesting that the helical order of the myosin
motors is lost before their release from the folded conformation on the filament backbone. At the
time resolution of these experiments, the change in the spacing of the filament backbone (SM6) is
synchronous with the loss of helical order of the motors, whereas the axial periodicity of the motors
(SM3) and their radial motion (I1,1/I1,0) are synchronous with the loss of the folded population.
The amplitude of the first actin layer line (AAL1), signalling myosin motor binding to the thin fila-
ments, has a half-time of 15 ms, similar to that of force. The only X-ray signal that is slower than force
is AM3 (half-time, 21 ms), and this is likely related to its biphasic response (Figure 5C), with a fast
decreasing phase followed by a slower rising phase.
Hill et al. eLife 2021;10:e68211. DOI: https://doi.org/10.7554/eLife.68211 15 of 26Research article Physics of Living Systems Structural Biology and Molecular Biophysics
This sequence of structural changes during activation is similar to that reported for single fast-
twitch fibres from frog skeletal muscle at 4˚C (Brunello et al., 2006; Piazzesi et al., 1999;
Reconditi et al., 2011), although all the changes are about three times faster in the conditions of
the present experiments. Sarcomeres shortened by about 12% during the tetanus rise in these
experiments, much larger than the typical 2% in previous studies on single fibres from frog muscle.
Sarcomere shortening delays force development and the X-ray signals associated with the loss of
the helical order of the myosin motors to the same extent, and the relationship between force and
those X-ray signals is unaffected by imposing an additional ~5% shortening at the start of force
development (Linari et al., 2015). The half-time measured for thick filament activation in the present
experiments, about 8 ms, may therefore underestimate the speed of this process under sarcomere-
isometric conditions by a few milliseconds, but the above conclusions about the relative time courses
of the various structural changes and force development would not be affected by the greater sarco-
mere shortening in mouse EDL muscle.
The fastest structural changes in the thick filaments, those reported by AML1 and SM6, are slower
than calcium activation of the thin filaments. The peak of the intracellular [Ca2+] transient is only 2.0
ms after the stimulus in mouse EDL muscle at 28˚C, and Ca2+ binding to troponin lags this by less
than 1 ms (Baylor and Hollingworth, 2003). Fluorescent probes on troponin in demembranated
fibres from rabbit psoas muscle showed that the rate of calcium-binding in response to a [Ca2+]
jump is greater than 1000 s 1 at 12˚C (Fusi et al., 2014b). The half-time of the subsequent azimuthal
rotation of tropomyosin around the thin filaments can be estimated by X-ray diffraction from
changes in the amplitude of the second actin layer line reflection (AAL2), which lies outside the detec-
tor in the present experiments. In frog sartorius muscle at 22˚C, the half-time of the increase in AAL2
was less than 4 ms, about twice as fast as the change in AML1 in those conditions (Kress et al.,
1986).
Activation of the thick filaments in fast-twitch skeletal muscle, therefore, has two structural com-
ponents with time courses intermediate between those of thin filament activation and attachment of
myosin motors to actin. The delay between thick filament activation and actin attachment is thought
to be the result of a structural or biochemical transition in the myosin head in which its catalytic
domain becomes strongly bound to actin in a state capable of generating force or filament sliding
(Brenner and Eisenberg, 1987; Goldman, 1987). The delays between thin filament activation and
the two components of thick filament activation are less well understood, as is the underlying mech-
anism of inter-filament signalling (Irving, 2017). The transient appearance of the star peak, corre-
sponding to an axial periodicity of 14.85 nm, suggests that this mechanism may be linked to the two
closely spaced axial periodicities in the thick filament, the canonical 43 nm periodicity generated by
the axial packing of the myosin tails and a longer, ~45.5-nm, periodicity associated with the region
of the half-filament associated with a distinct titin-super-repeat in the region of the thick filament
containing MyBP-C (Caremani et al., 2021). The simple single-periodicity structural model of the
thick filament that we used to fit the main part of the M3 reflection (Figure 6) only considered the
third order of the 43 nm periodicity. The simple model does not reproduce the star peak and does
not use the structural information contained in other parts of the X-ray diffraction pattern, including
the M6 reflection, the M1 and M2 meridional reflections that would not be produced by a perfect 43
nm helix, and the myosin layer lines. No structural model has yet been developed that can quantita-
tively reproduce all these features, in any state of a muscle. Such a model would have many more
adjustable parameters than the parsimonious model used here, and X-ray data with a higher spatial
resolution and signal:noise ratio would probably be required to separate and accurately characterise
the interference peaks associated with structural components with different periodicities in distinct
zones of the thick filament, in an attempt to constrain those parameters. New synchrotron beam
lines and X-ray detectors may allow suitable data to be collected in future studies.
The tetanus plateau
The thin filaments are fully activated at the tetanus plateau, and about 30% of the myosin motors
are likely to be strongly attached to actin (Caremani et al., 2019; Linari et al., 2007). Modelling the
axial profile of the M3 reflection (Figure 6; Table 3) showed that the average movement of the cen-
tre of mass of the myosin motors between the resting state and the tetanus plateau was 11 nm, the
same as that reported previously for single fibres from amphibian muscle (Reconditi et al., 2011), in
which the conformation of the motors at the tetanus plateau had been determined by perturbation
Hill et al. eLife 2021;10:e68211. DOI: https://doi.org/10.7554/eLife.68211 16 of 26Research article Physics of Living Systems Structural Biology and Molecular Biophysics
experiments using length or load steps (Irving et al., 2000; Piazzesi et al., 2007; Piazzesi et al.,
2002). Given the similarity of sarcomere structure and filament protein isoforms in the two muscle
types, it seems very likely that the conformation of both the actin-bound myosin motors at the teta-
nus plateau and their helical folded conformation in resting muscle is the same in amphibians and
mammals.
It is not clear whether there is a residual population of helical or folded motors at the tetanus pla-
teau. The intensity of the ML1 reflection, the X-ray signature of the helical packing of the motors in
resting muscle, is about 10% of its resting value (Figure 3D; Table 1; Caremani et al., 2019;
Ma et al., 2018). Although it is difficult to exclude the possibility that this is due to a population of
fibres in the EDL muscle that were not activated by the stimulus, the presence of a similar residual
IML1 at the tetanus plateau in single fibres from frog muscle (Reconditi et al., 2011) suggests that it
may be a general property of fully activated fibres. If the residual IML1 were due to a population of
myosin motors remaining in the resting conformation at the tetanus plateau, about one-third of
motors would remain in that conformation (AML1 is 0.35 ± 0.03; Table 1). A slightly higher estimate
was obtained from the residual intensity of the fourth myosin layer line in mouse EDL muscle
(Ma et al., 2018). Since about 30% of motors are actin-attached, and their partners in the same
myosin molecule would account for another 30% (Caremani et al., 2019; Piazzesi et al., 2002),
these estimates would account for all the motors, leaving no disordered motors at the tetanus pla-
teau. However, an alternative explanation would be that the region of the myosin motors close to
the head-rod junction retains its helical order during activation, although the catalytic domains have
lost that order as a result of actin-binding and changes in head conformation. It is also possible that
the residual IML1 at the tetanus plateau is associated with another thick filament component that
takes up the myosin helical periodicity. Further assessment of those explanations would require fur-
ther structural modelling constrained by additional in situ structural data.
Isometric relaxation
Isometric relaxation was first characterised in single fibres from amphibian muscle as a relatively
slow, almost linear phase of force decline to about half the tetanus plateau value at a constant sarco-
mere length after the end of stimulation (Brunello et al., 2009; Edman and Flitney, 1982). Subse-
quent studies on isolated myofibrils showed that the rate of isometric relaxation is not limited by the
rate of removal of calcium from the intracellular solution but by the isometric rate of detachment of
myosin motors from actin (Poggesi et al., 2005). In intact muscle fibres, the initial rate of dissocia-
tion of calcium from troponin following electrical stimulation is fast (Caputo et al., 1994;
Konishi, 1998) and has been estimated as about 200 s 1 in mouse EDL at 28˚C (Baylor and Holling-
worth, 2003). Thin filament inactivation may be slower than this if the remaining actin-bound myosin
motors prevent tropomyosin from returning to its off position. In amphibian muscle, the amplitude
of the second actin layer line recovers slightly faster than force during early relaxation (Kress et al.,
1986) but, as discussed by those authors, the difference may be explained by faster inactivation in
the segment of the thin filament that does not overlap with thick filaments. Therefore, the available
data seem consistent with the hypothesis that the rate of isometric relaxation is limited by that of
motor detachment from actin.
Mouse EDL muscles do not show a clear linear phase or ‘shoulder’ in the time course of mechani-
cal relaxation (Figure 1C), and a sarcomere-isometric phase of relaxation has not been reported pre-
viously to our knowledge, probably because it is difficult to measure the sarcomere length in these
muscles by diffraction of visible light. However, ultra-low-angle X-ray diffraction (Figure 1) shows
that sarcomeres in mouse EDL muscle do remain precisely isometric for the first ~20 ms after the last
stimulus (Figure 1C), while force decays to about 80% of its plateau value at a progressively increas-
ing rate. I1,1/I1,0 and IAL1 decrease during isometric relaxation, signalling detachment of myosin
motors from thin filaments.
In contrast with the X-ray signals related to detachment of myosin motors from actin, those
related to the regulatory state of the thick filament, including IML1, I1,0, and SM3, and the fractional
intensities of the sub-peaks of the M3 reflection do not recover during isometric relaxation; there is
no detectable recovery of the helical or folded motor conformations characteristic of resting muscle.
The periodicity of the filament backbone (SM6) does recover partially, tracking the force as expected
from its proposed role as a stress sensor (Linari et al., 2015). The delay between the loss of actin-
Hill et al. eLife 2021;10:e68211. DOI: https://doi.org/10.7554/eLife.68211 17 of 26Research article Physics of Living Systems Structural Biology and Molecular Biophysics
attached myosin motors and the recovery of their ordered resting conformation means that there
must be a transient population of disordered motors during isometric relaxation.
Chaotic relaxation
Sarcomere lengths became inhomogeneous in the period from 20 to 50 ms after the last stimulus of
the tetanus (Figure 1D). By 50 ms, however, sarcomere uniformity had been regained, sarcomere
length had recovered to its resting value, and the force had declined to less than 5% of its tetanic
plateau value (Figure 1C). Thus, this period from 20 to 50 ms after the last stimulus corresponds to
chaotic relaxation as described in amphibian muscle. The X-ray signals associated with actin-attached
myosin motors, I1,1/I1,0, IAL1, and IM3, recovered to close to their resting values during chaotic relaxa-
tion, although I1,1/I1,0 remained slightly higher than its resting value at the end of chaotic relaxation,
and IM3 slightly lower. The helical order of the motors signalled by IML1 showed a larger recovery def-
icit, as did the axial periodicity of the filament backbone, SM6. The possible origins of these recovery
deficits are discussed in the following section.
The overall half-time of the detachment of myosin motors from actin during isometric and chaotic
relaxation estimated from AAL1, about 23 ms (Table 2), or from I1,1/I1,0 (30ms), is similar to that of
mechanical relaxation itself (27 ms). There was no clear evidence that the rate of detachment esti-
mated from these two X-ray parameters increased on the transition to chaotic relaxation, as might
be expected from filament sliding in the latter phase. Recovery of the helical order of the motors
during chaotic relaxation, as assessed by AML1, is slower, with a half-time of about 42 ms (Table 2),
indicating a significant delay between motor detachment and reformation of the helically ordered
resting state. This delay is much smaller than that reported for relaxation of mouse soleus muscle at
22˚C, in which the half-time of force relaxation was 210 ms, but that for IML1 recovery was 430 ms
(Ma et al., 2020). Isometric and chaotic relaxation was not resolved after a tetanus in mouse soleus
muscle.
Delayed recovery of the thick filament structure characteristic of
resting muscle
The incomplete recovery of IML1 during mechanical relaxation shows that the helical order of the
motors characteristic of resting muscle had not recovered when force was close to baseline (Fig-
ure 3). Only about 80% of motors had regained that conformation as estimated by AML1. Moreover,
neither IML1 (Figure 3D) nor SM6 (Figure 4D) recovered further in the remainder of the X-ray sam-
pling period, which ended approximately 130 ms after the last stimulus. In contrast, the axial profile
of the M3 reflection and the inferred average centre of mass of the myosin motors had completely
recovered at mechanical relaxation (Figure 6G; Table 3), showing that the myosin motors had
folded back against the filament backbone but had not fully reformed the resting helix. Mean sarco-
mere length had recovered almost to its resting value at the end of chaotic relaxation, but the inten-
sity of the sarcomere reflections remained low (Figure 1E), indicating maintained sarcomere
heterogeneity. The spacing of the inter-filament lattice (d1,0) (Figure 2E) had also not recovered to
its resting value. The incomplete recovery of the helical packing of myosin motors is unlikely due to
sarcomere inhomogeneity or the expanded filament lattice (Caremani et al., 2021; Reconditi et al.,
2014).
The incomplete recovery of helical packing of myosin motors after mechanical relaxation is likely
to be the structural correlate of the enhanced twitch force observed after a tetanus, post-tetanic
potentiation (Close et al., 1968). Myosin motors that have not returned to the helical array would
be expected to be recruited more readily by a subsequent stimulus, leading to an enhanced twitch
response. Post-tetanic potentiation has been attributed to enhanced phosphorylation of the myosin
regulatory light chain (RLC) and, by inference, to release of some myosin motors from the helical
array (Kamm and Stull, 2011), raising the possibility that the incomplete recovery of the helical array
is related to RLC phosphorylation during the tetanus. However, the likely extent of phosphorylation
in the present experiments makes this explanation seem implausible. During a 2 s tetanus of mouse
EDL muscle at 30˚C, RLC phosphorylation increases from about 0.1 to 0.5 mol/mol (Zhi et al., 2005).
If the extent of phosphorylation is proportional to tetanus duration, as expected for a slow calcium-
activated kinase, it would have increased by about 0.02 mol/mol in the present experiments, which
seems too small to be responsible for the 20% of myosin motors not returning to the helical array.
Hill et al. eLife 2021;10:e68211. DOI: https://doi.org/10.7554/eLife.68211 18 of 26You can also read