Hygroscopicity of urban aerosols and its link to size-resolved chemical composition during spring and summer in Seoul, Korea - ACP
←
→
Page content transcription
If your browser does not render page correctly, please read the page content below
Atmos. Chem. Phys., 20, 11245–11262, 2020
https://doi.org/10.5194/acp-20-11245-2020
© Author(s) 2020. This work is distributed under
the Creative Commons Attribution 4.0 License.

Hygroscopicity of urban aerosols and its link to size-resolved
chemical composition during spring and summer in Seoul, Korea
Najin Kim1,a , Seong Soo Yum1 , Minsu Park1 , Jong Sung Park2 , Hye Jung Shin2 , and Joon Young Ahn2
1 Department    of Atmosphere Sciences, Yonsei University, Seoul, 03722, Korea
2 Air Quality Research Division, National Institute of Environment Research, Incheon, 22689, Korea
a currently at: Multiphase Chemistry Department, Max Planck Institute for Chemistry, Mainz, 55128, Germany

Correspondence: Seong Soo Yum (ssyum@yonsei.ac.kr)

Received: 8 May 2020 – Discussion started: 4 June 2020
Revised: 12 August 2020 – Accepted: 17 August 2020 – Published: 2 October 2020

Abstract. Chemical effects on the size-resolved hygroscop-         groscopic (LH) mode number fractions for externally mixed
icity of urban aerosols were examined based on the Korea–          aerosols.
US Air Quality Study (KORUS-AQ, 2020) field campaign
data. The information on size-resolved hygroscopicity and
the chemical composition of aerosols were obtained by a hy-
groscopic tandem differential mobility analyzer (HTDMA)            1   Introduction
and a high-resolution time-of-flight aerosol mass spectrome-
ter (HR-ToF-AMS), respectively. Good correspondence was            Aerosol hygroscopicity, an ability of aerosols to absorb water
shown between measured and estimated κ values calculated           vapor, describes an interaction between water vapor and par-
from the combination of bulk chemical composition data             ticles under subsaturated and supersaturated conditions and
and oxidation parameters of organic aerosols (f44 and O/C).        determines the critical supersaturation for cloud droplet ac-
These results imply that chemical composition is closely as-       tivation (McFiggans et al., 2006; Swietlicki et al., 2008). In
sociated with aerosol hygroscopicity. However, the correla-        general, aerosols can be characterized as hygroscopic, neu-
tion between measured and estimated κ values degraded as           tral, or hydrophobic depending on their affinity for water
particle size decreased, implying that size-resolved chem-         (Rogers and Yau; 1989). Hygroscopicity of aerosols is con-
ical composition data are required for more detailed hy-           sidered a crucial parameter in aerosol studies as it affects the
groscopicity analysis. In addition to size-resolved chemical       number concentration of cloud condensation nuclei (CCN)
data, the m/z tracer method was applied for size-resolved          and the lifetime of clouds and thereby indirectly influences
organic factors. Specifically, m/z 57 and 44 were used as          regional and global climate change (Zhang et al., 2008; Su
AMS spectral markers for hydrocarbon-like organic aerosol          et al., 2010; IPCC, 2013; Rosenfeld et al., 2014). Moreover,
(HOA) and oxygenated organic aerosol (OOA), respectively.          hygroscopicity is responsible for the degradation of visibil-
These size-resolved chemical composition data were found           ity and multiphase chemical reactions which are closely re-
to be critical in explaining size-dependent hygroscopicity,        lated to air quality as cross-sectional areas of aerosol parti-
as well as the diurnal variation in κ for small particles, i.e.,   cles increase after particles take up water vapor with humid-
low κ in the morning and high κ in the afternoon. Addition-        ity (Tang, 1996; Cheng et al., 2008; Liu et al., 2013; Zheng
ally, aerosol mixing state information was associated with the     et al., 2015).
size-resolved chemical composition data. That is to say that          Hygroscopicity measurements were mainly performed
the relationship between the number fraction of each hygro-        with a hygroscopic tandem differential mobility analyzer
scopicity mode and the volume fraction of different chemical       (HTDMA) introduced by Liu et al. (1978) and/or with a
composition was investigated. For example, the HOA volume          combined system of a CCN counter (CCNC), a differen-
fraction comprised about 60 % of the variation in less hy-         tial mobility analyzer (DMA), and a condensation particle
                                                                   counter (CPC) (Moore et al., 2010; Kim et al., 2011). Par-

Published by Copernicus Publications on behalf of the European Geosciences Union.
11246                   N. Kim et al.: Hygroscopicity of urban aerosols and its link to size-resolved chemical composition

ticularly, HTDMA provides information of the hygroscopic             spite these efforts, knowledge on aerosol hygroscopicity is
growth factor (GF) distribution at a given dry particle diam-        still limited and subject to significant uncertainties due to
eter for a fixed relative humidity (RH). Furthermore, we can         difficulties in the identification and quantification of numer-
infer the extent of the mixing state of aerosols, i.e., external     ous organic compounds in ambient aerosols and their hy-
vs. internal mixing, through HTDMA measurements (Swi-                groscopic properties. Notably, various emission sources and
etlicki et al., 2008). If internally mixed, all particles are con-   complex chemical mechanisms of aerosol production and the
sidered to have an identical composition and hygroscopic-            aging processes in urban areas make it difficult to fully un-
ity, whereas external mixing indicates that particles of dif-        derstand the hygroscopic properties of aerosols and their link
ferent composition and hygroscopicity coexist in a sample            to aerosol chemical composition.
volume. So, even if the sizes of particles are the same, the            The Seoul metropolitan area (SMA) is one of the largest
critical supersaturation for activation could vary depending         metropolitan areas in the world where the commercial, res-
on the mixing state of atmospheric particles. From HTDMA             idential, and industrial facilities of Korea are concentrated
measurements, we may obtain a monomodal GF distribu-                 on a massive scale. The air masses in SMA are influenced
tion for perfect internal mixtures or bimodal or trimodal GF         not only by local anthropogenic emission sources but also by
distribution (sometimes more than trimodal) for the exter-           biogenic sources to the east (Kim et al., 2010) and industrial
nal mixture of atmospheric aerosols. Various field experi-           emissions to the west of SMA (H. Kim et al., 2018). Further-
ments around the world have conducted hygroscopicity mea-            more, long-range transport of air pollutants from the Asian
surements for ambient aerosols. In marine environments, in-          continent significantly impacts SMA air quality. In addition
cluding Pacific, Atlantic, Indian, and Arctic oceans, atmo-          to local and regional sources, atmospheric processes and me-
spheric particles had a higher GF than in other environments         teorological conditions affect aerosol properties. Neverthe-
and mostly showed a monomodal pattern of GF distribu-                less, knowledge of aerosol properties and their impact on
tion (Berg et al., 1998; Maßling et al., 2003; Massling et al.,      air quality in SMA is still limited. Therefore, understanding
2007; Swietlicki et al., 2000; Tomlinson et al., 2007; Zhou          the various sources and complex mechanisms of atmospheric
et al., 2001). In rural sites, both aged and freshly formed          aerosols in SMA is critical in establishing appropriate and
particles were observed, and mixing state patterns tended to         effective environmental policies to mitigate air quality prob-
be different depending on location. Aerosols in the pristine         lems. Moreover, an enhanced understanding of these char-
Amazon forest showed moderate GF values due to organic               acteristics of urban aerosols based on reliable measurement
compounds (Rissler et al., 2004; Thalman et al., 2017; Zhou          data can eventually be utilized to improve the estimation of
et al., 2002). Hygroscopic properties of aerosols in urban           global climate change.
regions where considerable anthropogenic emissions exist                The Korea–US Air Quality Study (KORUS-AQ) is an in-
have been measured actively in recent years (Baltensperger           ternational cooperative air quality field study that was con-
et al., 2002; Cocker et al., 2001; Massling et al., 2005; Wang       ducted over Korea during spring and summer 2016. A com-
et al., 2017; Wu et al., 2016). The external mixture of hy-          prehensive set of measurements from aircraft, ships, satel-
groscopic aerosols from the background and freshly emitted           lite, and ground sites along with air quality model calcula-
hydrophobic aerosols was dominantly observed in these re-            tions was made to assemble integrated observational data and
gions.                                                               examine the factors controlling the air quality in East Asia,
   In addition to direct measurements, various estimation            where air pollution has increased so much in the past decades
methods to derive aerosol hygroscopicity have been sug-              due to fast industrialization and urbanization (Swietlicki et
gested based on the relationship between chemical compo-             al., 2008; Larkin et al., 2016). As part of the KORUS-AQ
sition and hygroscopicity (Chang et al., 2010; Gunthe et             campaign, ground measurements of aerosol properties, gas-
al., 2009; Gysel et al., 2007; Wu et al., 2013). In gen-             phase concentration, and meteorological parameters in SMA
eral, the Zdanovskii–Stokes–Robinson (ZSR) mixing rule               were conducted at Olympic Park, a supersite of the cam-
(Zdanovskii, 1948; Stokes and Robinson, 1966) was applied            paign.
for the estimates. Inorganic aerosols are well known to be              In this study, we focus on the measurement of size-
hygroscopic from many field and laboratory studies. How-             resolved hygroscopicity and size-resolved chemical compo-
ever, the hygroscopicity of organic materials that occupied          sition by a hygroscopic tandem differential mobility ana-
a significant portion of atmospheric aerosols (Zhang et al.,         lyzer (HTDMA) and a high-resolution time-of-flight aerosol
2007) is relatively unknown and shows various water uptake           mass spectrometer (HR-ToF-AMS), respectively. Our study
abilities. Recent studies have focused on examining the hy-          aims to identify the relationship between chemical compo-
groscopic properties of organics based on the measurements           sition and the hygroscopicity of aerosols in SMA. For this
of the organic fraction in various environments (Chang et            effort, aerosol hygroscopicity is analyzed in association not
al., 2010; Wu et al., 2013; Mei et al., 2013; Hong et al.,           only with the size-resolved chemical composition data but
2015, 2018). According to several previous studies, the ox-          also with the size-resolved organic factor data. In addition,
idation level of organics is the main factor that affects the        aerosol hygroscopicity and CCN capability are examined in
water uptake ability of the organic fraction in aerosols. De-        relation to the mixing state of aerosols.

Atmos. Chem. Phys., 20, 11245–11262, 2020                                            https://doi.org/10.5194/acp-20-11245-2020
N. Kim et al.: Hygroscopicity of urban aerosols and its link to size-resolved chemical composition                        11247

2     Experimental description                                    distribution and GF values themselves. Kim et al. (2017) sug-
                                                                  gested an aerosol type classification based on mixing state
2.1    Measurement site                                           and GF values as will be briefly introduced later.
The KORUS-AQ field campaign was conducted at multiple             2.3   Aerosol chemical composition
ground sites, as well as in the air above the Korean Peninsula,
by aircraft (DC-8 and King Air) from May to June 2016. This       Real-time measurement of size-resolved chemical compo-
study focuses only on the ground measurements at Olympic          sition is done with a high-resolution time-of-flight aerosol
Park, the main supersite of KORUS-AQ, in SMA (37.6◦ N,            mass spectrometer (HR-ToF-AMS; Aerodyne Research Inc,
127.04◦ E). The measurement period was 9 May–15 June.             USA). It is based on the highly successful design of the first
Although the measurement shelter was surrounded by the            generation quadrupole-based system, the Q-AMS. However,
trees and grass fields of the park, this site was mainly in-      the ToF-AMS differs from the Q-AMS as the quadrupole
fluenced by anthropogenic sources from nearby residential         mass filter is replaced by a time-of-flight mass spectrometer.
areas and heavy road traffic. A detailed description of the       In this study, the non-refractory (NR) PM1 (NR-PM1 ), par-
site and the meteorological conditions during the campaign        ticulate matter with an aerodynamic diameter smaller than
can be found in N. Kim et al. (2018). Briefly, Olympic Park,      1 µm that evaporates rapidly at 600 ◦ C under vacuum condi-
in general, was affected by dominant westerly winds. How-         tions, was collected using a PM1 cyclone (URG-2000-30EN,
ever, in some periods during the campaign, this pattern disap-    URG, USA). A Nafion drier (Perma-Pure, Toms River, NJ,
peared. Specifically, a persistent high pressure with stagnant    USA) was used to dry the sampled ambient air. For cali-
conditions prevailed on 17–21 May (Period A in Fig. 1), and       bration purposes, ammonium nitrate and polystyrene latex
pollution transport from southwestern China occurred on 25–       sphere (PSL) particles were produced by using a constant
28 May (Period B in Fig. 1). As for meteorological condi-         output atomizer (TSI 3936, TSI Inc., USA) from ammonium
tions, campaign-averaged values for relative humidity (RH)        nitrate and PSL solution, respectively. Ammonium nitrate
and temperature (T ) were 61.0 % and 20.8 ◦ C, respectively.      particles with 300 nm and PSL particles ranging from 50 to
Both RH and T in May are generally lower than those in            450 nm were used to calibrate the ionization efficiency (IE)
June. The instruments installed in the measurement shelter        and particle size distribution using a DMA. Mass spectrum
are described in the following section.                           data were saved at 5 min resolution. A collection efficiency
                                                                  of 0.5 was applied to all species. The software SQUIRREL
2.2    HTDMA measurement
                                                                  v. 1.51H and PIKA v. 1.10H were used to analyze the col-
The measurement of size-resolved hygroscopicity by HT-            lected data.
DMA in Seoul is detailed in N. Kim et al. (2017, 2018) and           For the specification of organics, a positive matrix fac-
therefore briefly described here. First, ambient aerosols were    torization (PMF) analysis was performed using the organic
dried to below 20 % RH by silica gel. Next, dry aerosols were     compounds of submicron particles. The PMF analysis of
neutralized by Kr-85 aerosol neutralizer and then were clas-      organic matter that accounts for more than 30 % of ultra-
sified to produce monodisperse particles by the first DMA.        fine particles was used to identify aerosol characteristics de-
These classified particles grew under the humid conditions        pending on the oxidation state. PMF results could provide
of 85 % RH. The number size distribution of grown particles       information about the aging characteristic of organic mat-
was measured by the second DMA with a TSI CPC 3010.               ter such as the effect of direct emission or long-distance
Two RH sensors were placed at the exit of the Nafion humid-       transport. The PMF Evaluation Tool (PET V 2.06) was
ifier and sheath air of the second DMA. After the campaign,       used to analyze the mass spectrum for mass-to-charge ratios
we conducted the deliquescence relative humidity (DRH)            (m/z) from 12 to 100. The modeling conditions are as fol-
measurement for NaCl and (NH4 )2 SO4 to validate the HT-          lows: (1) MDL (method detection limit) equals 0.15 µg m−3 ;
DMA measurement. In this study, four different dry diame-         (2) down weighting of low signal-to-noise ratio (SNR; 0.2–2)
ters of 30, 50, 100, and 150 nm were chosen as classifiers in     data; (3) not using bad SNR (under 0.2) data; and (4) down
the first DMA for hygroscopicity analysis. The hygroscopic        weighting of repeated information (m/z 44 and related m/z
GF and the ratio of humidified (dw ) and dry (dd ) particle       values). Factor analysis was performed according to the PMF
mode diameters at a given RH can be derived from HTDMA            analysis procedure described by Zhang et al. (2005), and the
output (Eq. 1):                                                   preprocessing of input data for each step of PMF followed
                                                                  the method suggested by Ulbrich et al. (2009). Down weight-
        dw
GF =       .                                               (1)    ing is a process of lowering the weight of m/z, which may
        dd                                                        have higher noise than signal, and thereby lowering the error
In this study, we obtained the GF distribution for each dry       and Q value (Paatero and Hopke 2003). In this study, three
diameter with 3 min time resolution. The experiment was re-       organic aerosol (OA) factors are used: (1) hydrocarbon-like
peated five times for each size. Simultaneously, the informa-     organic aerosol (HOA), (2) semi-volatile oxygenated organic
tion of the mixing state was estimated from the shape of GF       aerosol (SV-OOA), and (3) low-volatility oxygenated organic

https://doi.org/10.5194/acp-20-11245-2020                                       Atmos. Chem. Phys., 20, 11245–11262, 2020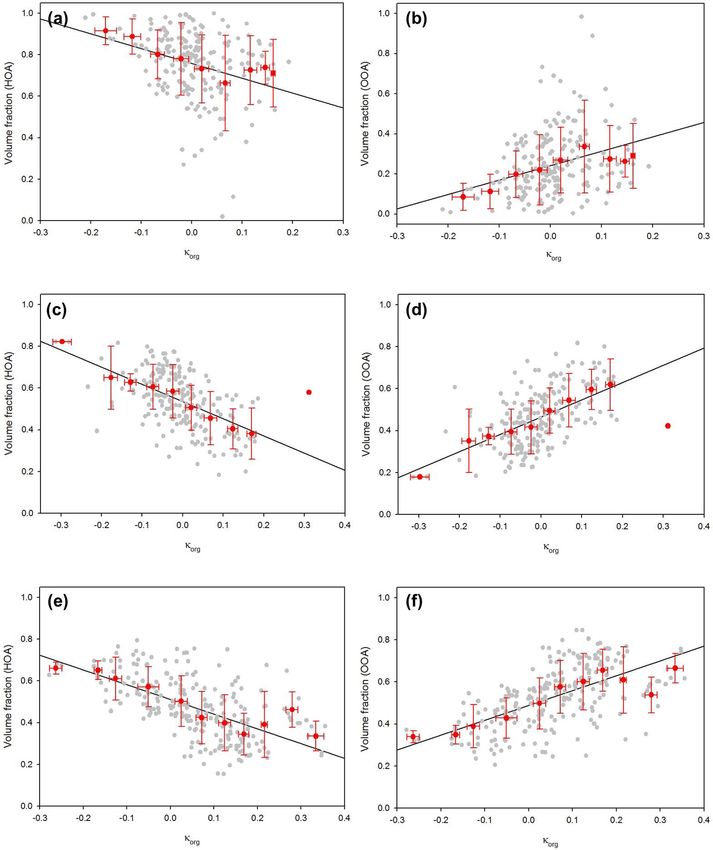
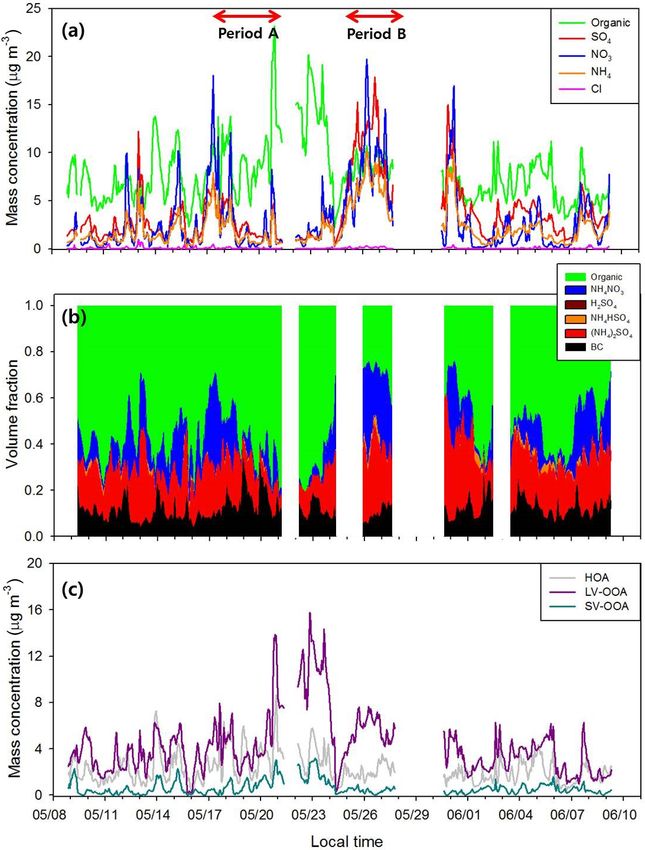
11248                    N. Kim et al.: Hygroscopicity of urban aerosols and its link to size-resolved chemical composition

Figure 1. Time series of (a) mass concentration and (b) volume fraction of aerosol chemical composition, and (c) mass concentration of
three organic aerosol (OA) factors (additional blanks in the time series of the volume fraction of chemical composition in panel b is due to
BC data).

aerosol (LV-OOA). Figure S1 in the Supplement shows the                 example, sea salt aerosol occupied less than 3 % of PM2.5
high-resolution mass spectra and time series of the three OA            aerosols from a 24 h air sample collection period in Seoul
factors.                                                                (Heo et al., 2009). The very good κ-closure results in Fig. 3,
   Mass concentration of black carbon (BC) was measured                 which did not consider mineral dust and sea salt, perhaps in-
by the multi-angle absorption photometer (MAAP) with a                  fer that mineral dust and sea salt aerosols had little effect on
PM2.5 inlet system as HR-ToF-AMS only provides informa-                 the κ-closure analysis.
tion on the chemical composition of non-refractory aerosols.
In this study, other refractory and semi-refractory aerosols
like mineral dust and sea salt aerosols that have their own hy-
groscopic properties were not considered as they were likely
to account for a small portion of submicron aerosols. For

Atmos. Chem. Phys., 20, 11245–11262, 2020                                                 https://doi.org/10.5194/acp-20-11245-2020
N. Kim et al.: Hygroscopicity of urban aerosols and its link to size-resolved chemical composition                           11249

3     Overview of hygroscopic and chemical properties of          that excludes periods A and B, although particle sizes are
      aerosols                                                    larger than those in the normal period.

3.1    Temporal variation in aerosol chemical
       composition                                                3.2   Size-resolved hygroscopicity of urban aerosols

Figure 1 shows the temporal variations in aerosol chemical        As mentioned above, size-resolved hygroscopicity for four
compositions, including sulfate, nitrate, ammonium, and or-       dry diameters (30, 50, 100, and 150 nm) was measured dur-
ganics, at Olympic Park during the campaign period. The           ing the campaign. The average value of κ, a representative
bulk mass concentration of PM1 (= NR-PM1 + BC) ranged             single hygroscopicity parameter (Petters and Kreidenweis,
from 4.4 to 57.1 µg m−3 with a mean value of 19.1 µg m−3 ,        2007), ranged from 0.11 to 0.24 with distinct diurnal vari-
and there was substantial variation in chemical composition       ation (N. Kim et al., 2018). Figure 2 shows the size-resolved
(Fig. 1a). Among non-refractory aerosols, organics occupied       κ values measured in SMA from the two campaigns (MAPS-
about 42.5 % of the total mass concentration of PM1 aerosols      Seoul and KORUS-AQ), as well as the results from some
during the whole period, followed by sulfate (28.4 %), ni-        other urban measurements including Shanghai (Ye et al.,
trate (16.3 %), ammonium (12.2 %), and chloride (0.6 %).          2013), Beijing (Wang et al., 2018), the Pearl River Delta
The campaign-averaged BC mass concentration was about             (PRD) region (Jiang et al., 2016), and Paris (Jurányi et al.,
2.5 µg m−3 . In this study, 1300 and 1700 kg m−3 were as-         2013). The κ values in the figure were derived from HTDMA
sumed for densities of organics (Cross et al., 2007; Florou       GF measurements except for Paris whose κ values were de-
et al., 2017) and BC (Wu et al., 2013), respectively, to calcu-   rived from CCN measurements. The κ values of SMA were
late the volume for each species. For BC, PM2.5 mass con-         lower than those in Shanghai and similar to Beijing, but the
centration is used for calculation, assuming that BC mass is      lowest κ values were observed in Paris for most diameters.
mainly determined by submicron particles (e.g., Clarke et al.,    According to Fig. 2, most κ values increase with particle
2004; Wu et al., 2013). It can be said from the good agree-       size. It is closely related to the fact that the mass fraction
ment between predicted and measured NH+       4 that observed     of inorganic species increases with increasing particle size
            2−
anions (SO4 , NO3 , and Cl ) are fully neutralized by NH+
                    −        −
                                                             4    (Fig. S3). Inorganic components measured by AMS are con-
(Fig. S2) and that ion species mainly existed in the form of      sidered the major water-soluble chemical components influ-
(NH4 )2 SO4 and NH4 NO3 (Reilly and Wood, 1969; Gysel             encing the hygroscopic behavior of atmospheric aerosols.
et al., 2007). Predominant volume fractions of (NH4 )2 SO4        Wu et al. (2016) showed an increase in the particle num-
and NH4 NO3 among inorganic compounds can also be found           ber fraction of the hydrophilic mode with increasing particle
in Fig. 1b. For organics, HOA, SV-OOA, and LV-OOA ac-             size, and this trend was more conspicuous for smaller parti-
counted for 32.0 %, 8.8 %, and 59.2 %, respectively, of the       cles (< 150 nm). The size-dependency of κ is also shown in
total OA mass concentration during the campaign.                  other environments such as the coastline in the UK (Gysel
   The chemical composition of PM1 aerosol showed sub-            et al., 2007), forested sites in Colorado (Levin et al., 2012,
stantial variation, especially for periods A and B. Organ-        2014) and Wakayama, Japan (Deng et al., 2019), and the bo-
ics were dominant in Period A when stagnant conditions            real environment in Finland (Paramonov et al., 2013). Al-
prevailed due to persistent high atmospheric pressure and         though the Kelvin effect may cause some decrease in κ with
weak synoptic flow (N. Kim et al., 2018). The average ra-         decreasing particle size, this effect is small, less than 5 %, for
tio of organics to inorganics plus BC was 1.60 ± 0.82, rang-      particles in the diameter range of 50 to 200 nm (Swietlicki et
ing from 0.48 to 3.60. The average mass concentrations of         al., 2008; Wang et al., 2018). The average κ values of urban
each chemical species during Period A were 7.9 µg m−3 (or-        aerosols shown in Fig. 2 are smaller than 0.3 for diameters
ganic), 3.7 µg m−3 (sulfate), 2.9 µg m−3 (nitrate), 2.2 µg m−3    smaller than 300 nm, implying that the suggested typical con-
(ammonium), and 2.4 µg m−3 (BC). At the beginning of Pe-          tinental κ value of 0.3 by Andreae and Rosenfeld (2008) is an
riod A, mass concentrations of both HOA and LV-OOA in-            overestimation for these urban aerosols. Consequently, it can
creased sharply, and that of LV-OOA remained high until           cause the overprediction of the CCN number concentration
23 May (Fig. 1c). For Period B, total mass concentration          (NCCN ) in urban areas.
increased as polluted air masses were transported directly
from southwestern China, and inorganics were dominantly
                                                                  3.3   The κ closure
observed with a mean value of 0.32 for the ratio of organ-
ics / inorganics plus BC. The volume fraction of inorganics
reached up to 80 % during Period B. These contrasting chem-       The closure on hygroscopicity has been studied to understand
ical compositions of the two periods result in very differ-       the relationship between chemical composition and aerosol
ent hygroscopic properties of aerosols (N. Kim et al., 2018).     hygroscopicity (Chang et al., 2010; Gunthe et al., 2009; Gy-
For example, hygroscopicity values of Period A, an organic-       sel et al., 2007; Kim et al., 2017; Wu et al., 2013). The ZSR
dominant period, were much lower than the normal period           mixing rule (Eq. 2) with a volume fraction of aerosol com-

https://doi.org/10.5194/acp-20-11245-2020                                        Atmos. Chem. Phys., 20, 11245–11262, 2020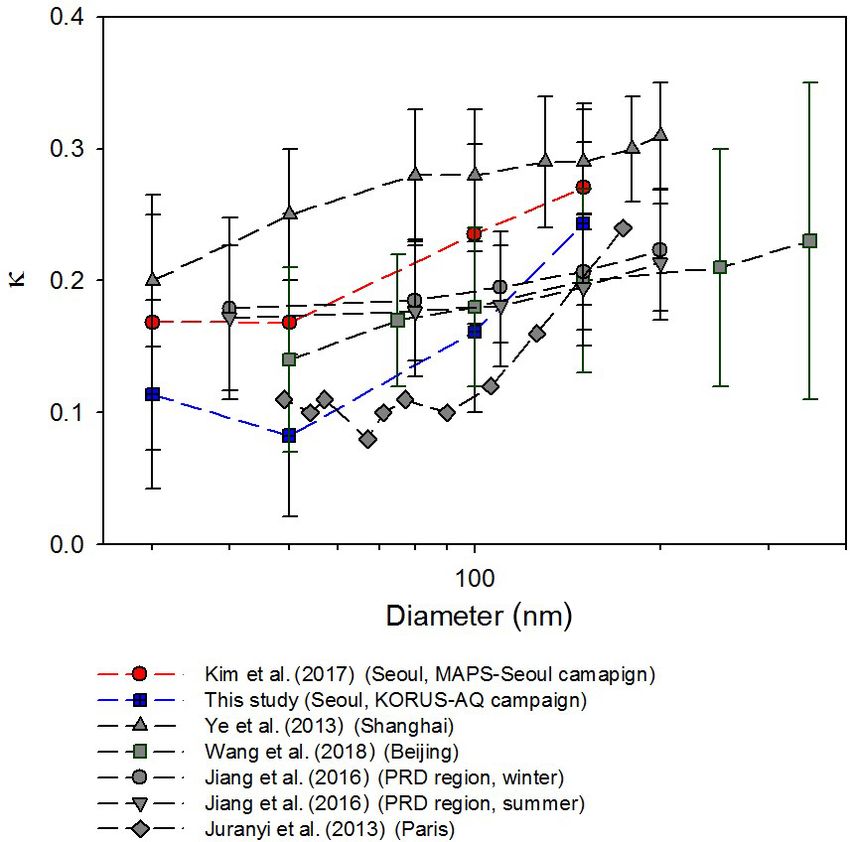
11250                  N. Kim et al.: Hygroscopicity of urban aerosols and its link to size-resolved chemical composition

                                                                  Figure 3. Scatterplot between κHTDMA and κchem using two dif-
                                                                  ferent organic κ estimation methods. The dashed line and solid line
                                                                  indicate the 1 : 1 line and linear regression line, respectively.

Figure 2. Size-resolved hygroscopicity of aerosols in Seoul and   compared to organics occupied a major portion of the total
other urban areas.                                                mass. In this study, we adopted the method using f44 for
                                                                  further analysis because it produced better results than the
                                                                  method using O/C in terms of the linear regression analysis
position is generally applied for the hygroscopicity closure:
                                                                  (i.e., slope and the coefficient of determination) and the aver-
                                                                  age ratio between κHTDMA and κchem values (Table S1). Ac-
         X
κchem =      ε i κi ,                                      (2)
          i                                                       cording to Fig. 4, however, good agreement between κHTDMA
                                                                  and κchem is shown only for 150 nm. As particle size becomes
where κchem is the κ value of the mixed particle, κi is the       smaller, widely dispersed scatterplots between κHTDMA and
hygroscopicity value of the chemical component (i) in pure        κchem are shown. Furthermore, the overestimation of κchem is
form and εi is the volume fraction of this chemical compo-        clearly shown for small particles. It is because large particles
nent. Unlike inorganic species, the hygroscopicity of organic     mainly determine the volume fraction in bulk chemical com-
aerosol (OA) is relatively unknown, and many estimation           position data. This result implies that size-resolved chemical
methods have been suggested for κ closure. In general, oxi-       composition data should be included when we analyze the
dation parameters like O/C and f44 are used for the organic       relationship between hygroscopicity and chemical composi-
hygroscopicity. Among them, we compared the two methods           tion, especially for small particles.
suggested by Kim et al. (2017), which uses O/C (Eq. 3), and
by Mei et al. (2013) (Eq. 4), which uses f44 :
                                                                  4     Size-resolved chemical composition and its link to
κorg = 0.1 × (O/C),                                        (3)          hygroscopicity and mixing state
κorg = 2.10(±0.07) × f44 − 0.11(±0.01).                    (4)
                                                                  4.1    Size-resolved chemical composition
For the inorganics (NH4 )2 SO4 and NH4 NO3 , κ values of
0.47 and 0.58 are applied, respectively (Gysel et al., 2007;      The importance of size-resolved chemical composition data
Topping et al., 2005). BC is assumed to be hydrophobic.           has been manifested in the analyses of the size-resolved hy-
   Figure 3 presents the scatterplot of κHTDMA vs. κchem ,        groscopicity of aerosols (Bhattu et al., 2016; Levin et al.,
which incorporates the κorg values derived from the two es-       2014; Meng et al., 2014). However, the particle time-of-flight
timation methods above. Only 150 nm results are used for          (P-ToF) mode for the size-resolved species cannot provide
κHTDMA . The agreement between κHTDMA and κchem looks             sufficient information of mass size distribution directly be-
good regardless of the κorg estimation method, and there-         cause of the relatively low signal-to-noise ratio compared to
fore it can be said that such oxidation parameters are suitable   the bulk mass concentration from the mass spectrum (MS)
to use for estimating the hygroscopicity of organic aerosols.     mode. Instead, reconstructed size-resolved mass concentra-
Perhaps the similar results of the two methods were in part       tion is applied which combines with a bulk mass concentra-
due to the fact that inorganic species having high κ values       tion from the MS mode and a size-resolved mass distribution

Atmos. Chem. Phys., 20, 11245–11262, 2020                                          https://doi.org/10.5194/acp-20-11245-2020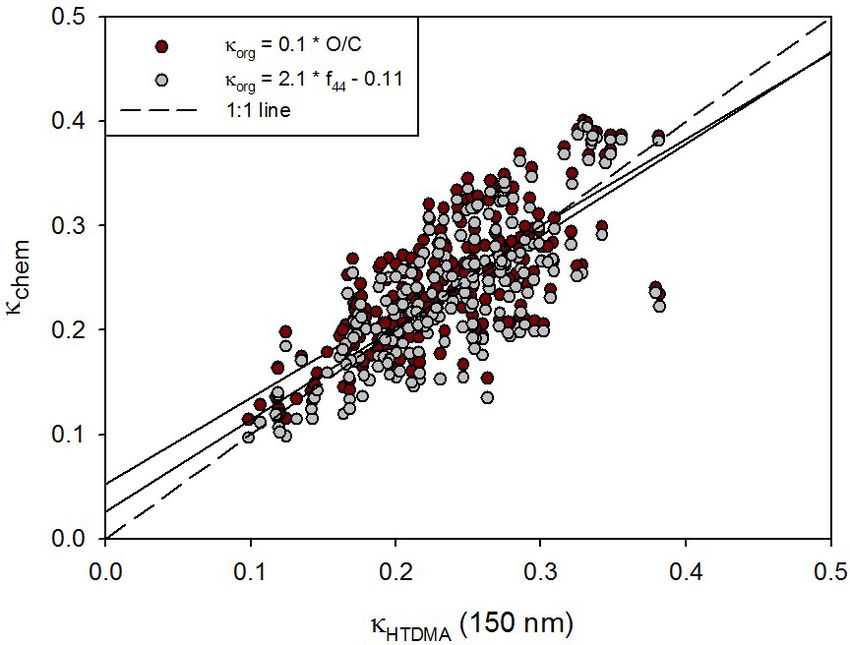
N. Kim et al.: Hygroscopicity of urban aerosols and its link to size-resolved chemical composition                                11251

                                                                        et al., 2005), whereas m/z 57, most likely C4 H+     9 , is known
                                                                        to be a major species in mass spectra of hydrocarbon, which
                                                                        is associated with combustion exhaust and often increases at
                                                                        rush hour (Allan et al., 2004, 2003; Alfarra et al., 2004; Cana-
                                                                        garatna et al., 2004). Good correspondences between m/z 57
                                                                        and HOA and between m/z 44 and OOA for bulk chemi-
                                                                        cal data (not shown) support these assumptions. Although
                                                                        m/z 43 is also known to show a prominent peak for combus-
                                                                        tion exhaust like m/z 57, it is also influenced by oxygenated
                                                                        organic aerosols (C2 H3 O+ ), and perhaps that is the reason
                                                                        why the correlation with HOA is not as good as that between
                                                                        HOA and m/z 57 (Fig. S4). Size-resolved organic factors are
                                                                        reconstructed by multiplying a number for each size bin. This
                                                                        number for each reconstructed HOA and OOA is the slope
                                                                        of the linear regression between each organic factor (HOA
                                                                        and OOA) and m/z (57 and 44) from bulk mass concen-
Figure 4. Scatterplot between κHTDMA and κchem for four different       tration. The slopes of the linear regressions are 35.29 and
diameters. The dashed line and solid line indicate the 1 : 1 line and   7.89 for HOA and OOA, respectively. Each reconstructed or-
linear regression line, respectively.                                   ganic factor is well correlated with the measured one, and the
                                                                        reconstructed organic mass concentration (= HOA + OOA)
                                                                        shows a good correspondence with measured bulk organic
from the P-ToF mode for individual species as described in              mass concentration (Fig. S5). In other words, organic mass
Eq. (5) (Thalman et al., 2017):                                         concentration in this study can be explained substantially by
                                                                       the two organic factors. Also, m/z 57 and 44 can be con-
                           mi Dp                                       sidered first-order tracers of the two major organic compo-
mi Dp = Mi,b × R D                      ,            (5)
                      p,max     0       0                               nents. The correlation coefficient between measured and re-
                   Dp,min mi Dp d log Dp
                                                                        constructed HOA is slightly lower than that of OOA (Fig. S5)
where Mi,b is the bulk mass concentration from MS mode                  because the contribution of m/z 57 to HOA varies depending
measurements for chemical species i and mi (Dp ) is the aver-           on time and/or sources, whereas m/z 44 contains a broader
age mass size distribution for chemical species i with respect          range of OOAs. Figure 5 shows the campaign-averaged size
to log Dp . Dp,max and Dp,min indicate the maximum and min-             distribution of reconstructed HOA and OOA (from now on,
imum diameters of the average mass size distribution, respec-           “reconstructed” HOA and OOA are just called as HOA and
tively. The average mass size distribution for the whole cam-           OOA in short.). The mode diameter of OOA is somewhat
paign period is shown in Fig. S3; from now on, the recon-               larger than that of HOA. The mass fraction of HOA is larger
structed mass size distribution is denoted as “size-resolved”           than that of OOA for small particles (< 120 nm), but the op-
for simplicity. It is noted that size-resolved composition data         posite is true for larger particles (> 120 nm).
for particles smaller than 70 nm are excluded due to high un-
                                                                        4.3    Size-resolved chemical effect on hygroscopicity
certainties. According to Fig. S3, the mass fraction of organ-
ics increases as the particle diameter decreases as expected.           Figure 6 presents the campaign-averaged size-resolved vol-
Notably, organics occupied more than 70 % of aerodynamic                ume fraction of chemical species with size-resolved κ values.
diameters smaller than 150 nm. In other words, specified or-            For direct comparison between aerosol hygroscopicity and
ganic factor information should be included, especially for             chemical composition, the conversion of diameter is essen-
small particles, to analyze the size-resolved aerosol hygro-            tial due to different particle sizing techniques (i.e., mobility
scopicity.                                                              diameter, dm , for HTDMA and vacuum aerodynamic diame-
                                                                        ter, dva , for AMS). Under the assumption of a spherical par-
4.2   Size-resolved organic factors
                                                                        ticle, dva can be converted into dm with density information
Zhang et al. (2005) proposed a technique that uses m/z 57               as described in Eq. (6) (DeCarlo et al., 2004):
and 44 as AMS mass spectral markers to quantify the mass                       ρ0
concentrations of HOA and OOA (= SV-OOA + LV-OOA)                       dm =      dva ,                                              (6)
                                                                               ρp
using highly time-resolved organic mass spectra obtained
with HR-ToF-AMS. The tracer m/z 44, most likely CO+       2,            where ρp is the particle density and ρ0 is the standard den-
is known to be a major oxygenated organic species in AMS                sity (1000 kg m−3 ). In this study, 1300 kg m−3 is used as
mass spectra and often increases in the afternoon when the              the particle density since organics are the most dominant
photochemical reaction is active (Alfarra et a., 2004; Zhang            chemical composition in the particle size range of hygro-

https://doi.org/10.5194/acp-20-11245-2020                                                 Atmos. Chem. Phys., 20, 11245–11262, 2020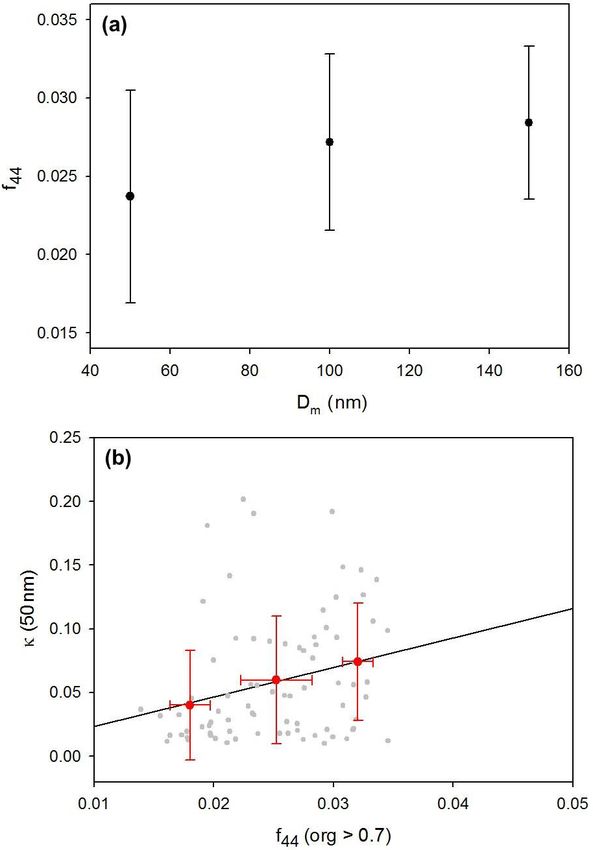
11252 N. Kim et al.: Hygroscopicity of urban aerosols and its link to size-resolved chemical composition
Figure 5. Campaign-averaged size distributions of reconstructed Figure 6. Campaign-averaged size-resolved volume fraction of
HOA (gray) and OOA (pink). chemical species with κ values (κHTDMA ) for 50, 100, and 150 nm
(mobility diameter, Dm , for κ values is converted to aerodynamic
diameter, Dva , for comparison).
scopicity measurements. As mentioned above, the κ value of
30 nm particle is excluded due to high uncertainties. Densi- for small particles is mostly affected by the volume fraction
ties of chemical species are assumed for the calculation of the of organics rather than that of inorganics.
volume fraction: 930 kg m−3 (HOA), 1500 kg m−3 (OOA), As mentioned above, oxidation parameters such as f44 and
and 1769 kg m−3 (inorganics). For small particles, the vol- O/C ratio are appropriate to use for indicating organic hygro-
ume fraction is dominated by organics (= HOA + OOA), and scopicity, and thereby several estimation methods using them
HOA, widely known to be hydrophobic, comprises more than have been proposed (e.g., Chang et al., 2010; Cerully et al.,
50 %. However, the volume fraction of inorganics, which is 2015; Kim et al., 2017; Mei et al., 2013; Hong et al., 2018).
hygroscopic, increases as particle size increases. Among or- Notably, the estimation method using f44 (bulk data) pro-
ganics, a sharp decrease in HOA volume fraction and an duces a good correlation between measured and estimated κ
increase in OOA with size are clearly shown. These re- as shown in Fig. 3. The increase in f44 value is known to be
sults support the size-dependent hygroscopicity. Moreover, the result of photochemical oxidation. The size-dependent κ
the dominant organic volume fraction for small particles is also reflected in the degree of oxidation, as can be seen
(dva < 100 nm) manifests the importance of size-resolved or- from the increase in size-resolved f44 with increasing par-
ganic factors to explain the variation in hygroscopicity. Fig- ticle diameter (Fig. 8a). The positive relationship between
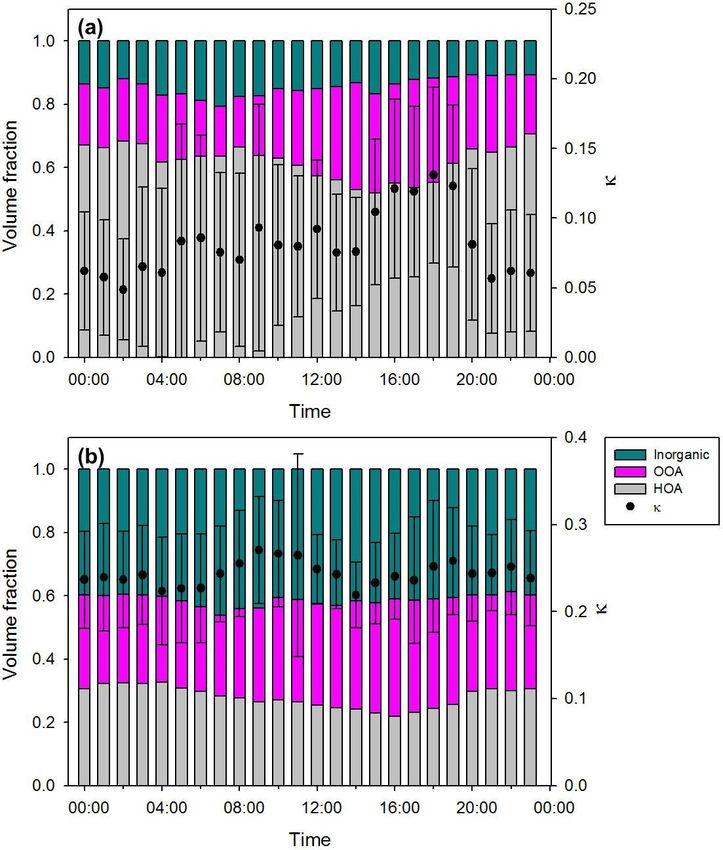
ure 7 illustrates the diurnal variation in κ with the chemical size-resolved f44 and κ values for 50 nm particles (Fig. 8b)
composition for 50 and 150 nm particles. For 50 nm (Fig. 7a), also shows that the oxidation of organics affects the hygro-
HOA comprised more than 50 % of the chemical composi- scopic properties of particles. It is noted that data for which
tion, and the two organic factors showed considerable tem- the volume fraction of organics is larger than 0.7 were only
poral variation compared to inorganics. The volume fraction used to exclude the effect of inorganics. Figure 9 presents
of HOA increased slightly at rush hour (07:00–09:00 LT) and scatterplots between κorg (30, 50, and 150 nm) and volume
decreased gradually after midday until 18:00 LT. Conversely, fraction of HOA and OOA among organics. The κorg value
the volume fraction of OOA decreased in the morning and in- is calculated by subtracting the inorganic part from κHTDMA .
creased in the afternoon when the photochemical reaction is As expected, the volume fraction of HOA was negatively cor-
active. It is consistent with the diurnal variation in κ, showing related with κ values, whereas that of OOA was positively
the relatively low values in the night hours and high values correlated with κ values for all sizes of particles. These re-
in the late afternoon. On the other hand, for 150 nm (Fig. 7b) sults demonstrate that the specification of the size-resolved
the chemical compositions showed little variation. Therefore, organic factor is an indispensable part in describing the rela-
it can be said that the effect of chemical composition on the tionship between size-resolved hygroscopicity and the chem-
diurnal variation in κ is more sensitive for small particles ical composition of aerosols. It is noted that κorg in Fig. 9 is
than for large particles. Such results demonstrate that, with- an estimated value with a simple assumption (see figure cap-
out proper specification of organic factors, it is difficult to ex- tion) to show the relationship between size-resolved organic
plain the diurnal variation in κ. Also noted is that κ variation factors and hygroscopicity. Negative κorg appears when κinorg
Atmos. Chem. Phys., 20, 11245–11262, 2020 https://doi.org/10.5194/acp-20-11245-2020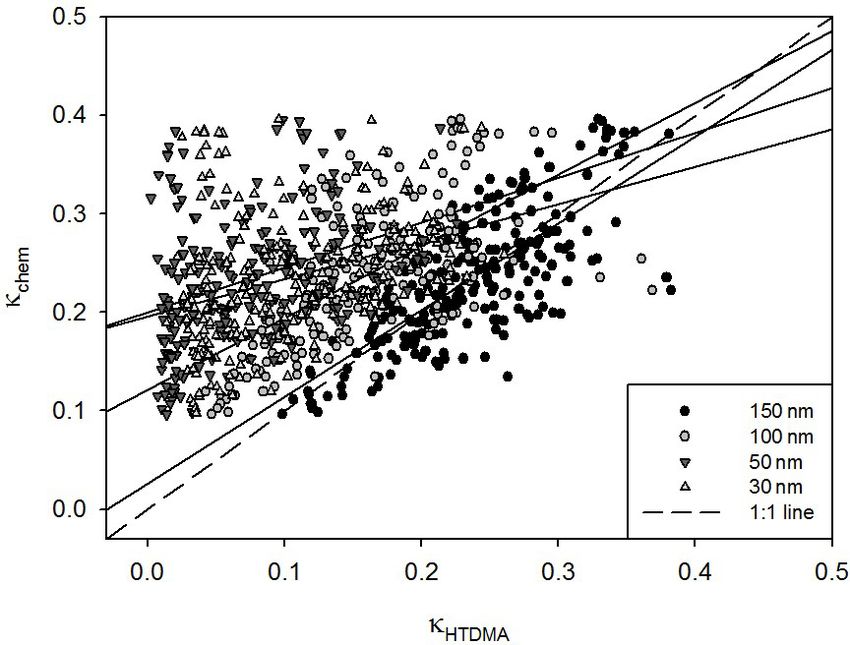
N. Kim et al.: Hygroscopicity of urban aerosols and its link to size-resolved chemical composition                            11253

Figure 7. Diurnal variation in κ values (κHTDMA ) and chemical
composition of (a) 50 nm and (b) 150 nm particles.

is high even if the volume fraction of inorganics is low (i.e.,
low εinorg ).
                                                                  Figure 8. (a) Size-resolved f44 and (b) relationship between f44
4.4   Relevance to mixing state                                   and κ values (κHTDMA ) for 50 nm particles (the f44 values are only
                                                                  used when the organic volume fraction is higher than 0.7). Red dots
HTDMA measurement data can provide information on the             and bars indicate average and standard deviations for each of the
                                                                  0.01 interval bins.
mixing state of atmospheric particles, i.e., external or in-
ternal mixing. We can also infer the extent of the chem-
ical mixing of particles from this information (Swietlicki
et al., 2008). External mixing was prevalently observed in           For externally mixed particles (Type 1), the GF distribu-
Seoul during the MAPS-Seoul (2015) and the KORUS-AQ               tions were mostly bimodal, and trimodal or higher modal
(2016) campaigns (N. Kim et al., 2017, 2018) like in other        distributions were only occasionally observed (less than 3 %
urban regions (Enroth et al., 2018; Wang et al., 2010; Hong       of total measurement cases). So, it is safe to assume that
et al., 2018). Kim et al. (2017) suggested an aerosol type        externally mixed particles are bimodal. Then the first peak
classification based on the GF values and the mixing state        (denoted as Peak 1) in the GF distribution is defined as
information taken from the HTDMA GF distribution data             the less hygroscopic (LH) mode that usually has GF values
(dN/d log(GF)): Type 1 is externally mixed aerosols, and          lower than 1.1, and the second peak (denoted as Peak 2)
fewer and more hygroscopic particles are externally mixed;        is defined as the more hygroscopic (MH) mode that has
Type 2 is internally mixed aerosols with GF greater than 1.1,     GF values larger than 1.1. During the measurement pe-
and all particles are more hygroscopic; and Type 3 is inter-      riod, Type 1 (externally mixed) aerosols were predominantly
nally mixed aerosols with GF less than 1.1, and all particles     observed (higher than 70 %) in large particles (100 and
are less hygroscopic. Figure 10 presents the schematic plot       150 nm), whereas Type 3 (internally mixed with the LH
of three aerosol types. To determine the mixing state, the po-    mode) aerosols occupied more than 50 % of all aerosols in
sition, height, and width of each peak for HTDMA data are         small particles (30 and 50 nm) (Table S2). We also found
computed with the peakfit function for MATLAB® , which            that mixing state had a distinct diurnal pattern, as depicted in
performs a least-square curve fit of a Gaussian function to       Fig. S6. Briefly, for small particles, Type 3 aerosols prevailed
the top part of the peak (O’Haver, 2016).                         all day except in the afternoon (12:00–18:00 LT) when a sig-

https://doi.org/10.5194/acp-20-11245-2020                                        Atmos. Chem. Phys., 20, 11245–11262, 2020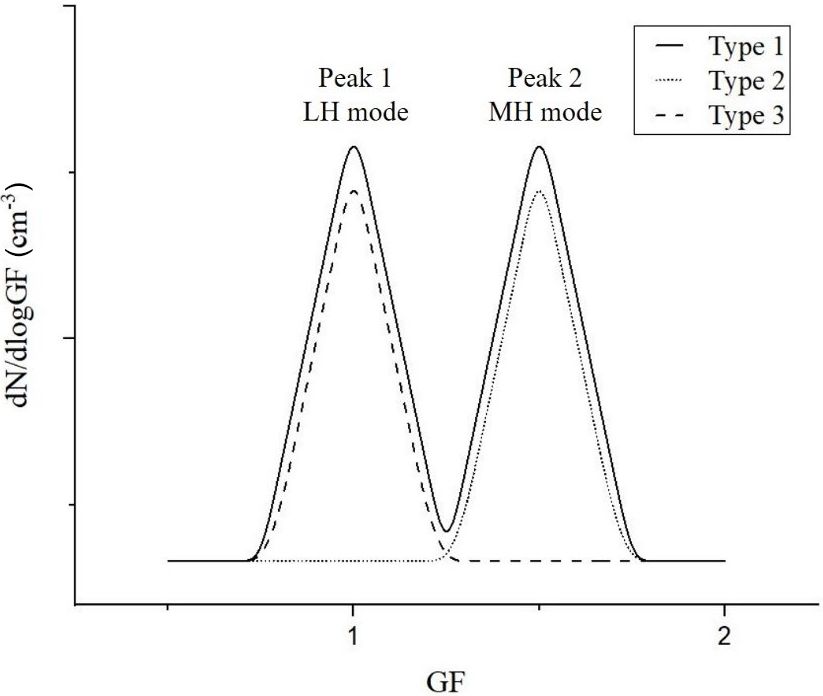
11254                    N. Kim et al.: Hygroscopicity of urban aerosols and its link to size-resolved chemical composition

Figure 9. Scatterplot of κorg vs. volume fraction of HOA (a, c, e) and OOA (b, d, f) among organics for 50 nm (a, b), 100 nm (c, d), and
150 nm (e, f) dry diameters. κorg is calculated as follows: κorg = (κHTMDA − εinorg κinorg )/εorg , where ε indicates the volume fraction of
each component.

Atmos. Chem. Phys., 20, 11245–11262, 2020                                                 https://doi.org/10.5194/acp-20-11245-2020
N. Kim et al.: Hygroscopicity of urban aerosols and its link to size-resolved chemical composition                             11255

                                                                       ternoon, whereas that of Type 3 aerosols was the lowest at
                                                                       that time for all diameters (N. Kim et al., 2018). Moreover,
                                                                       a bimodal GF distribution, implying Type 1, in the morning
                                                                       mostly changed to unimodal in the afternoon (Fig. S6). It
                                                                       can be inferred that less hygroscopic particles gained hygro-
                                                                       scopicity due to the quick coating by secondary hygroscopic
                                                                       species and that the LH mode disappeared as the day went on.
                                                                       H. Kim et al. (2018) suggested from the strong correlation
                                                                       between OOA and Ox that the photochemical reaction oc-
                                                                       curred actively in the afternoon during the campaign period.
                                                                       Although the GF value of hydrophobic particles increased
                                                                       by coating and GF distribution changed from bimodal to uni-
                                                                       modal, the GF values of coated particles (Type 2) were still
                                                                       slightly lower than those of the existing hygroscopic parti-
                                                                       cles, the MH mode of Type 1 aerosols.
                                                                          For NCCN prediction, several studies have considered the
                                                                       mixing state of aerosols with chemical species data (e.g.,
Figure 10. Schematic plot of three aerosol types: Type 1 (externally   Bhattu and Tripathi, 2015; Ervens et al., 2010; Ren et al.,
mixed aerosol; solid line), Type 2 (internally mixed aerosols with     2018; Wang et al., 2010). For externally mixed aerosols,
GF > 1.1; dotted line), and Type 3 (internally mixed with GF < 1.1;    chemical species can be divided into two modes, LH and MH
dashed line).                                                          mode, based on their hygroscopic properties. In general, BC
                                                                       and organics (or only HOA) are classified in the LH mode,
                                                                       whereas inorganics and OOA are classified in the MH mode
nificant portion of the aerosols turned into Type 2. For large         in externally mixed aerosols. In this study, we identify and
particles, externally mixed aerosols (Type 1) dominated, es-           quantify chemical species of each mode for externally mixed
pecially during rush hour (07:00–09:00 LT) when hydropho-              aerosols with GF distribution data and size-resolved chem-
bic particles emitted from traffic mix with preexisting large          ical data to understand the relationship between the mixing
and aged particles. In the afternoon, a mixing state change            state and chemical composition of atmospheric aerosols. Fig-
occurred in both small and large particles due to the photo-           ure 11 shows the scatterplot of the Peak 1 (LH mode) area
chemical processes. At night, however, no such change oc-              ratio vs. the volume fraction of each chemical species for dif-
curred as there was no photochemical process.                          ferent diameters. As mentioned above, the area ratio of each
   Table 1 presents the area ratio, GF, and κ value of LH and          mode in the GF distribution (dN/d log(GF)) corresponds to
MH modes for the four different dry diameters. The area ra-            the number fraction of particles in each mode and thereby
tio of each mode is directly related to the number fraction            can be compared directly with the volume fraction of each
of each mode as the area is calculated by integrating the GF           chemical species for a diameter. Note that only the observed
distribution, dN/d log(GF), for each mode. The results in Ta-          externally mixed aerosols (Type 1) are used for comparison.
ble 1 contain all three types of aerosols. The LH mode in-             The volume fraction of HOA is positively correlated with the
cludes Peak 1 of Type 1 (externally mixed) aerosols and all            Peak 1 area ratio (Fig. 10a) when all sizes are combined but
Type 3 (internally mixed and non-growth) aerosols. The MH              not for each diameter. The slope between them and the co-
mode includes Peak 2 of Type 1 aerosols and all Type 2 (in-            efficient of determination (R 2 ) were 0.73 and 0.58, respec-
ternally mixed and growth) aerosols. The area ratio of the             tively. In other words, the HOA volume fraction can explain
LH mode is substantially high for small particles compared             about 58 % of the variation in the number fraction for the LH
to MH mode, and the area ratio of MH mode becomes larger               mode in externally mixed aerosols. We can infer that the un-
as particle size increases. It is directly connected to the size-      explained part can be complemented by BC, which is known
dependency of κ. The GF value of the MH mode increases as              to be hydrophobic. Unfortunately, size-resolved BC is not
particle size increases. Table 2 shows only the Type 1 (exter-         available in this study. The results in Fig. 10b (LH mode vs.
nally mixed) aerosols for comparison. An increasing trend of           volume fraction of organics) and Fig. 10c (LH mode vs. vol-
MH mode area ratio and GF value with increasing diameter               ume fraction of OOA) also support this speculation. The vol-
is similar to the results in Table 1. However, GF values of MH         ume fraction of all organics, including both HOA and OOA
mode particles are slightly higher than those in Table 1, espe-        (Fig. 10b), is much higher than the number fraction of the
cially for smaller diameters (30, 50 nm). It can be explained          LH mode. Furthermore, a negative and even weak correla-
by the fact that Type 2 (internally mixed and growth) aerosols         tion was shown between the volume fraction of the OOA and
usually had lower GF values than the MH mode aerosol of                the Peak 1 area ratio (Fig. 10c).
Type 1 (externally mixed) aerosols. During the campaign, the              For Peak 2 (MH mode), OOA (Fig. 12a) and inorganics
number fraction of Type 2 aerosols was the highest in the af-          (Fig. 12b) did show a positive correlation with the Peak 2

https://doi.org/10.5194/acp-20-11245-2020                                            Atmos. Chem. Phys., 20, 11245–11262, 2020
11256 N. Kim et al.: Hygroscopicity of urban aerosols and its link to size-resolved chemical composition
Table 1. The area ratio, GF value, and κ value for the less hygroscopic (LH) mode and more hygroscopic (MH) mode for four dry diameters
for all three types of aerosols.
LH mode MH mode GF κ GF κ
area ratio area ratio (LH mode) (LH mode) (MH mode) (MH mode)
30 nm 0.61 0.39 1.07 0.05 1.26 0.25
50 nm 0.69 0.31 1.04 0.02 1.28 0.22
100 nm 0.35 0.65 1.01 0.01 1.34 0.25
150 nm 0.22 0.78 1.02 0.01 1.43 0.31
Table 2. The area ratio, GF value, and κ value for the less hygroscopic (LH) mode and more hygroscopic (MH) mode for four dry diameters
for only Type 1 (externally mixed) aerosol.
LH mode MH mode GF κ GF κ
area ratio area ratio (LH mode) (LH mode) (MH mode) (MH mode)
30 nm 0.60 0.40 1.04 0.03 1.34 0.37
50 nm 0.57 0.43 1.01 0.01 1.32 0.25
100 nm 0.42 0.58 1.01 0.01 1.36 0.26
150 nm 0.28 0.72 1.02 0.01 1.45 0.32
area ratio, but it was not strong enough to explain a signifi- DMA. During the campaign period, the averaged mass con-
cant portion of the MH mode. The sum of OOA and inorganic centration of PM1 aerosols was 19.1 µg m−3 , and observed
volume fraction (Fig. 12c) can explain a significant portion anions were fully neutralized by NH+ 4 . On average, organ-
of MH mode variation in externally mixed aerosols, whereas ics occupied more than 40 % of the mass concentration for
a negative correlation is clearly shown between the volume non-refractory aerosols. Among three organic factors (HOA,
fraction of HOA and the Peak 2 area ratio (Fig. 12d). For SV-OOA, and LV-OOA) analyzed by PMF analysis, OOA ac-
individual diameters, correlations tended to be stronger for counted for 66.4 %. Substantial differences in aerosol chem-
larger (100 and 150 nm) rather than smaller (50 nm) diame- ical composition were shown in the two specific periods,
ters. It is related to the fact that there are high uncertainties in the organic-dominant period (Period A), and the inorganic-
size-resolved chemical composition data for small diameters. dominant period (Period B), and these differences affected
Nevertheless, by implication these results demonstrate that the aerosol hygroscopicity of each period. The averaged κ
the HTDMA and HR-ToF-AMS dataset could successfully values ranged from 0.11 to 0.24, and, as in other urban re-
explain connections between aerosol composition and hygro- gions, κ clearly showed size-dependency. Estimated κ val-
scopic mode (i.e., mixing state) and their relative contribu- ues calculated with bulk chemical composition data and ox-
tions. Specifically, the volume fraction of HOA (and BC) can idation parameters, f44 and O/C (κchem ), showed good cor-
explain a major portion of the number fraction of LH mode respondence with measured κ values (κHTDMA ) for 150 nm
particles. For the MH mode, the volume fraction of the sum particles. It implies that chemical composition is closely as-
of OOA and inorganics can explain the number fraction of sociated with aerosol hygroscopicity, and such oxidation pa-
MH mode particles. During the campaign, externally mixed rameters are suitable for representing the hygroscopicity of
aerosols (Type 1) were observed during about 50 % of the to- organic aerosols. However, for small particles, such a good
tal period, meaning that LH mode particles (i.e., HOA) and relationship was not shown between κHTDMA and κchem due
MH mode particles (i.e., inorganics and OOA) were exter- to the fact that bulk chemistry might have been determined
nally mixed in the atmosphere half of the time during the mainly by larger particles that might not have the same chem-
campaign. ical composition of small particles.
These results emphasize the importance of size-resolved
chemical composition data for examining the relationship be-
5 Summary and Conclusions tween chemical composition and aerosol hygroscopicity, es-
pecially for small particles. Furthermore, the size-resolved
This study investigated the chemical effects on size-resolved organic factor information is essential as organic particles are
hygroscopicity of urban aerosols based on the KORUS-AQ mostly small. The m/z tracer method is applied in this study
field campaign data. Mainly, information on size-resolved to obtain size-resolved organic factors. The tracers m/z 57
hygroscopicity and the mixing state of aerosols for four dry and m/z 44 are used as AMS spectral markers for HOA
diameters (30, 50, 100, and 150 nm) was obtained by HT- and OOA, respectively. According to the campaign-averaged
Atmos. Chem. Phys., 20, 11245–11262, 2020 https://doi.org/10.5194/acp-20-11245-2020N. Kim et al.: Hygroscopicity of urban aerosols and its link to size-resolved chemical composition 11257 Figure 11. Scatterplots between Peak 1 (LH mode) area ratio and volume fraction of (a) HOA, (b) organics (HOA + OOA), and (c) OOA for 50 nm (turquoise), 100 nm (gray), and 150 nm (red) particles. The dashed line and solid line represent the 1 : 1 line and linear regression line, respectively. The coefficient of determination (R 2 ) of each scatterplot is indicated. size-resolved volume fraction, the volume fraction of inor- increased. The relationship between the number fraction of ganics, which are known to be hygroscopic, increases as par- each hygroscopicity mode and volume fraction of different ticle size increases. For organics, a decrease in HOA and an chemical composition is analyzed. For example, the HOA increase in OOA are shown as particle size increases, which volume fraction comprised about 60 % of the variation in the supports the size dependency of aerosol hygroscopicity. Par- LH mode number fraction for externally mixed aerosols. It ticularly, the size-resolved organic factor can give a detailed can be inferred that the volume fraction of BC can explain explanation of the diurnal variation in κ for small particles. the rest. On the other hand, the chemical composition of the Low κ in the morning is associated with the large volume MH mode can be explained by the sum of inorganics and fraction of HOA, whereas high κ in the afternoon is related OOA rather than the volume fractions of OOA and inorgan- to the large volume fraction of OOA. Scatterplots of the vol- ics. Unlike previous studies that used the hygroscopicity of ume fraction of organic factors vs. κ values clearly illustrate ensemble particles without mixing state information, such a that chemical composition is closely associated with the hy- relationship between the chemical composition, mixing state, groscopic properties of aerosols not only for large particles and hygroscopicity of atmospheric particles can be of crucial but also for small particles. use in accurate NCCN prediction. Lastly, the characteristics of the mixing state of aerosols It can be concluded that size-resolved chemical composi- were investigated in association with size-resolved chemical tion data did provide more detailed and essential informa- composition data. Externally mixed aerosols were observed tion than bulk data, which are greatly needed when examin- about 50 % of the time during the campaign period, espe- ing the relationship between chemical composition and hy- cially for large particles. Importantly, the number fraction groscopic properties of aerosols, as well as the mixing state. and GF value of the MH mode increased as particle size Specified organic factors were found to be critically impor- https://doi.org/10.5194/acp-20-11245-2020 Atmos. Chem. Phys., 20, 11245–11262, 2020
11258                    N. Kim et al.: Hygroscopicity of urban aerosols and its link to size-resolved chemical composition

Figure 12. Scatterplots between Peak 2 (MH mode) area ratio and volume fraction of (a) OOA, (b) inorganics, (c) OOA plus inorganics, and
(d) HOA for 50 nm (turquoise), 100 nm (gray), and 150 nm (red) particles. The dashed line and solid line represent the 1 : 1 line and linear
regression line, respectively. The coefficient of determination (R 2 ) of each scatterplot is indicated.

tant mainly in estimating the hygroscopicity of small parti-            informative to make the observations during other seasons
cles as organics occupied a significant portion of these par-           to find seasonal variability, especially during the winter sea-
ticles. Although the two OA factors, HOA and OOA, can                   son when aerosol properties and meteorological conditions
represent the total organic mass concentration and can also             would be so much different from spring and summer. Our
explain the variability of κ reasonably well, a more detailed           future work includes such an endeavor.
analysis can be made when more spectral tracers are added
to derive subdivided organic factors. Of note is that organic
aerosols do not always behave ideally and show an appar-                Data availability. KORUS-AQ         data  are  available  via
ent discrepancy in hygroscopic growth between subsaturated              https://espo.nasa.gov/korus-aq/content/KORUS-AQ     (last ac-
and supersaturated conditions (Petters et al., 2009; Wex et             cess: August 2019), KORUS-AQ project team members, 2020;
al., 2009). If hygroscopic growth were measured under su-               https://doi.org/10.5067/Suborbital/KORUSAQ/DATA01 (Aknan
                                                                        and Chen, 2019).
persaturated conditions, the estimated hygroscopicity param-
eter would be significantly higher than those estimated in
this study under subsaturated conditions due to the contri-
                                                                        Supplement. The supplement related to this article is available on-
bution of the enhanced hygroscopic growth of organic com-               line at: https://doi.org/10.5194/acp-20-11245-2020-supplement.
ponents of aerosols. This would surely affect the CCN pre-
diction results, but it is uncertain how much that would be
at this point. Perhaps, however, the overestimating tendency            Author contributions. NK carried out the observation, analyzed the
of κchem shown in Fig. 4 may be reduced as the measured                 data, and wrote the paper. SSY acquired funding for the study, con-
κ would become higher. The results presented here were ob-              tributed to the analysis of the data, and edited the paper. MP con-
tained during the spring and summer season. It would be very            tributed in carrying out the observations and analyzing the data. JSP,

Atmos. Chem. Phys., 20, 11245–11262, 2020                                                 https://doi.org/10.5194/acp-20-11245-2020
N. Kim et al.: Hygroscopicity of urban aerosols and its link to size-resolved chemical composition 11259
HJS, and JYA provided HR-ToF-AMS data. All authors discussed tion Experiment (ACE 1), J. Geophys. Res., 103, 16535–16545,
the results and read and commented on the paper. https://doi.org/10.1029/97JD02851, 1998.
Bhattu, D. and Tripathi, S. N.: CCNclosure study: Effects of aerosol
chem-ical composition and mixing state, J. Geophys. Res.-
Competing interests. The authors declare that they have no conflict Atmos., 120, 766–783, https://doi.org/10.1002/2014JD021978,
of interest. 2015.
Bhattu, D., Tripathi, S. N., and Chakraborty, A.: Deriving aerosol
hygroscopic mixing state from size-resolved CCN activity and
Acknowledgements. The authors would like to thank all the HR-ToF-AMS measurements, Atmos Environ., 142, 57-70,
KORUS-AQ science team members and also to thank the editor and https://doi.org/10.1016/j.atmosenv.2016.07.032, 2016.
the two reviewers for their constructive comments. Canagaratna, M. R., Jayne, J. T., Ghertner, D. A., Herndon, S.,
Shi, Q., Jimenez, J. L., Silva, P. J., Williams, P., Lanni, T.,
Drewnick, F., Demerjian, K. L., Kolb, C. E., and Worsnop,
D. R.: Chase studies of particulate emissions from in-use
Financial support. This research has been supported by a National
New York city vehicles, Aerosol Sci. Tech., 38, 555–573,
Research Foundation of Korea (NRF) grant funded by the Korean
https://doi.org/10.1080/02786820490465504, 2004.
government (MSIT) (grant no. NRF-2018R1A2B2006965).
Cerully, K. M., Bougiatioti, A., Hite Jr., J. R., Guo, H., Xu, L.,
Ng, N. L., Weber, R., and Nenes, A.: On the link between
hygroscopicity, volatility, and oxidation state of ambient and
Review statement. This paper was edited by Daniel Knopf and re- water-soluble aerosols in the southeastern United States, At-
viewed by James Hudson and one anonymous referee. mos. Chem. Phys., 15, 8679–8694, https://doi.org/10.5194/acp-
15-8679-2015, 2015.
Chang, R. Y.-W., Slowik, J. G., Shantz, N. C., Vlasenko, A., Liggio,
J., Sjostedt, S. J., Leaitch, W. R., and Abbatt, J. P. D.: The hy-
References groscopicity parameter (κ) of ambient organic aerosol at a field
site subject to biogenic and anthropogenic influences: relation-
Aknan, A. and Chen, G.: KORUS-AQ ship to degree of aerosol oxidation, Atmos. Chem. Phys., 10,
DC-8 Aircraft Dataset, KORUS-AQ, 5047–5064, https://doi.org/10.5194/acp-10-5047-2010, 2010.
https://doi.org/10.5067/Suborbital/KORUSAQ/DATA01, 2019. Cheng, Y. F., Wiedensohler, A., Eichler, H., Heintzenberg, J.,
Alfarra, M. R., Coe, H., Allan, J. D., Bower, K. N., Boudries, Tesche, M., Ansmann, A., Wendisch, M., Su, H., Althausen, D.,
H., Canagaratna, M. R., Jimenez, J. L., Jayne, J. T., Garforth, and Herrmann, H.: Relative humidity dependence of aerosol op-
A., Li, S.-M., and Worsnop, D. R.: Characterization of urban tical properties and direct radiative forcing in the surface bound-
and regional organic aerosols in the lower Fraser Valley using ary layer at Xinken in Pearl River Delta of China: An obser-
two Aerodyne AerosolMassSpectrometers, Atmos. Environ., 38, vation based numerical study, Atmos. Environ., 42, 6373–6397,
5745–5758, 2004. https://doi.org/10.1016/j.atmosenv.2008.04.009, 2008
Allan, J. D., Jimenez, J. L., Williams, P. I., Alfarra, M. R., Bower, Cocker, D. R., Whitlock, N. E., Flagan, R. C., and Se-
K. N., Jayne, J. T., Coe, H., and Worsnop, D. R.: Quantitative infeld, J. H.: Hygroscopic properties of pasadena,
sampling using an Aerodyne aerosol mass spectrometer, 1, Tech- california aerosol, Aerosol Sci. Tech., 35, 637–647,
niques of data interpretation and error analysis, J. Geophys. Res., https://doi.org/10.1080/02786820120653, 2001.
108, 4090, https://doi.org/10.1029/2002JD002358, 2003. Cross, E. S., Slowik, J. G., Davidovits, P., Allan, J. D., Worsnop, D.
Allan, J. D., Bower, K. N., Coe, H., Boudries, H., Jayne, J. T., R., Jayne, J. T., Lewis, D. K., Canagaratna, M., and Onasch, T.
Canagaratna, M. R., Millet, D. B., Goldstein, A. H., Quinn, P. B.: Laboratory and ambient particle density determinations using
K., Weber, R. J., and Worsnop, D. R.: Submicron aerosol com- light scattering in conjunction with aerosol mass spectrometry,
position at Trinidad Head, California, during ITCT 2K2: Its re- Aerosol Sci. Tech., 41, 343–359, 2007.
lationship with gas phase volatile organic carbon and assess- DeCarlo, P. F., Slowik, J. G., Worsnop, D. R., Davidovits, P., and
ment of instrument performance, J. Geophys. Res., 109, D23S24, Jimenez, J. L.: Particle Morphology and Density Characteriza-
https://doi.org/10.1029/2003JD004208, 2004. tion by Combined Mobility and Aerodynamic Diameter Mea-
Andreae, M. O. and Rosenfeld, D.: Aerosol-cloud- surements. Part 1: Theory, Aerosol Sci. Tech., 38, 1185–1205,
precipitation interactions. Part 1. The nature and sources https://doi.org/10.1080/027868290903907, 2004.
of cloud-active aerosol, Earth-Sci. Rev., 89, 13e41, Deng, Y., Yai, H., Fujinari, H., Kawana, K., Nakayama, T.,
https://doi.org/10.1016/j.earscirev.2008.03.001, 2008. and Mochida, M.: Diurnal variation and size dependence
Baltensperger, U., Streit, N., Weingartner, E., Nyeki, S., Prévôt, A. of the hygroscopicity of organic aerosol at a forest site in
S. H., Van Dingenen, R., Virkkula, A., Putaud, J. P., Even, A., Ten Wakayama, Japan: their relationship to CCN concentrations, At-
Brink, H., Blatter, A., Neftel, A., and Gäggeler, H. W.: Urban and mos. Chem. Phys., 19, 5889–5903, https://doi.org/10.5194/acp-
rural aerosol characterization of summer smog events during the 19-5889-2019, 2019.
PIPAPO field campaign in Milan, Italy, J. Geophys. Res.-Atmos., Enroth, J., Mikkilä, J., Németh, Z., Kulmala, M., and Salma,
107, D22, https://doi.org/10.1029/2001JD001292, 2002. I.: Wintertime hygroscopicity and volatility of ambient ur-
Berg, O. H., Swietlicki, E., and Krejci, R.: Hygroscopic growth ban aerosol particles, Atmos. Chem. Phys., 18, 4533–4548,
of aerosol particles in the marine boundary layer over the Pa- https://doi.org/10.5194/acp-18-4533-2018, 2018.
cific and Southern Oceans during the First Aerosol Characteriza-
https://doi.org/10.5194/acp-20-11245-2020 Atmos. Chem. Phys., 20, 11245–11262, 2020You can also read