Timescales of chemical equilibrium between the convecting solid mantle and over- and underlying magma oceans - Solid Earth
←
→
Page content transcription
If your browser does not render page correctly, please read the page content below
Solid Earth, 12, 421–437, 2021
https://doi.org/10.5194/se-12-421-2021
© Author(s) 2021. This work is distributed under
the Creative Commons Attribution 4.0 License.

Timescales of chemical equilibrium between the convecting solid
mantle and over- and underlying magma oceans
Daniela Paz Bolrão1 , Maxim D. Ballmer2,1 , Adrien Morison3 , Antoine B. Rozel1 , Patrick Sanan1 , Stéphane Labrosse4 ,
and Paul J. Tackley1
1 Institute
          of Geophysics, ETH Zurich, 8092 Zurich, Switzerland
2 Department  of Earth Sciences, University College London, London WC1E 6BT, UK
3 University of Exeter, Physics and Astronomy, EX4 4QL Exeter, UK
4 Université de Lyon, ENSL, UCBL, Laboratoire LGLTPE, 15 parvis René Descartes, BP7000,

69342 Lyon, CEDEX 07, France

Correspondence: Daniela Paz Bolrão (daniela.bolrao@erdw.ethz.ch)

Received: 10 April 2020 – Discussion started: 17 April 2020
Revised: 16 December 2020 – Accepted: 24 December 2020 – Published: 22 February 2021

Abstract. After accretion and formation, terrestrial planets         Earth, this timescale is comparable to that of magma ocean
go through at least one magma ocean episode. As the magma            crystallisation suggested in previous studies (Lebrun et al.,
ocean crystallises, it creates the first layer of solid rocky man-   2013), which may explain why the Earth’s mantle is rather
tle. Two different scenarios of magma ocean crystallisation          homogeneous in composition, as supported by geophysical
involve that the solid mantle either (1) first appears at the        constraints.
core–mantle boundary and grows upwards or (2) appears at
mid-mantle depth and grows in both directions. Regardless of
the magma ocean freezing scenario, the composition of the
solid mantle and liquid reservoirs continuously change due           1   Introduction
to fractional crystallisation. This chemical fractionation has
important implications for the long-term thermo-chemical             The early Earth experienced at least one episode of extensive
evolution of the mantle as well as its present-day dynam-            silicate melting, also known as magma ocean (e.g. Abe and
ics and composition. In this work, we use numerical mod-             Matsui, 1988; Abe, 1993, 1997; Solomatov and Stevenson,
els to study convection in a solid mantle bounded at one or          1993a; Solomatov, 2000; Drake, 2000; Elkins-Tanton, 2012).
both boundaries by magma ocean(s) and, in particular, the            A magma ocean was likely formed due to the energy released
related consequences for large-scale chemical fractionation.         during the Moon-forming giant impact (Tonks and Melosh,
We use a parameterisation of fractional crystallisation of the       1993; Ćuk and Stewart, 2012; Canup, 2012), core formation
magma ocean(s) and (re)melting of solid material at the inter-       (Flasar and Birch, 1973), radiogenic heating (Urey, 1956),
face between these reservoirs. When these crystallisation and        electromagnetic induction heating (Sonett et al., 1968), and
remelting processes are taken into account, convection in the        tidal heating (Sears, 1992). Due to the presence of an early
solid mantle occurs readily and is dominated by large wave-          atmosphere (Abe and Matsui, 1986; Hamano et al., 2013), it
lengths. Related material transfer across the mantle–magma           was sustained for thousands (Solomatov, 2000) to millions of
ocean boundaries promotes chemical equilibrium and pre-              years (Abe, 1997; Lebrun et al., 2013; Salvador et al., 2017;
vents extreme enrichment of the last-stage magma ocean (as           Nikolaou et al., 2019).
would otherwise occur due to pure fractional crystallisation).          As the magma ocean cools and its temperature drops be-
The timescale of equilibration depends on the convective             low the liquidus, crystals start to appear and consolidate a
vigour of mantle convection and on the efficiency of material        first layer of solid cumulates, i.e. the solid part of the man-
transfer between the solid mantle and magma ocean(s). For            tle. Because the shape of the liquidus (and solidus) rela-
                                                                     tive to the isentropic temperature profile is not well con-

Published by Copernicus Publications on behalf of the European Geosciences Union.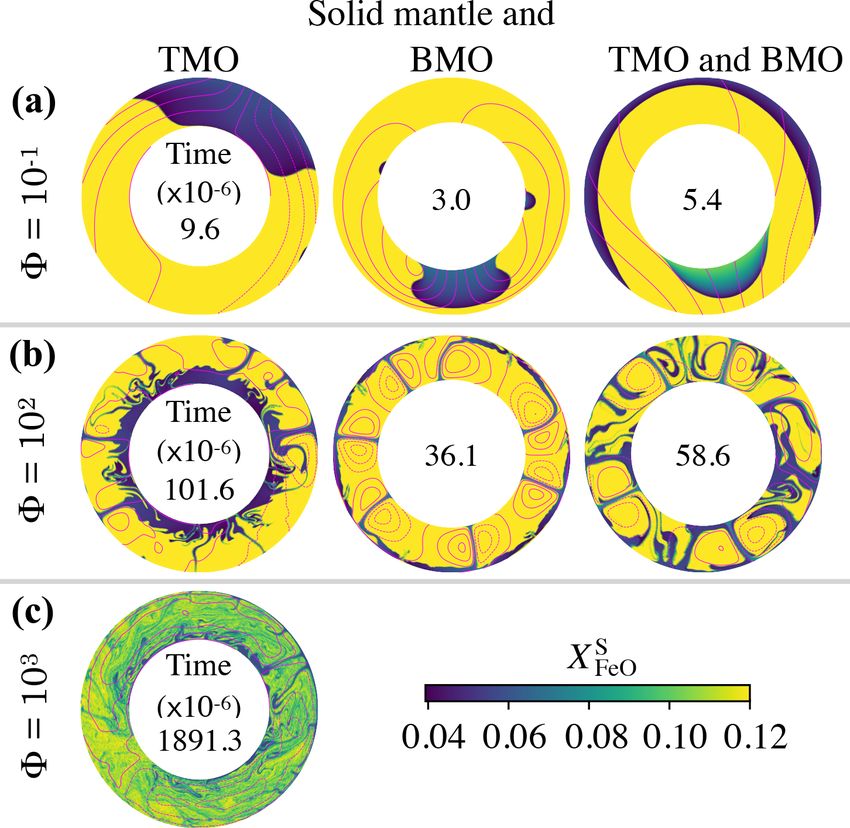
422                             D. P. Bolrão et al.: Timescales of chemical equilibrium between the solid mantle and MOs

strained, the depth at which initial crystallisation occurs re-    mantle and magma oceans are not necessarily in chemical
mains unknown: this depth may be anywhere between the              equilibrium.
core–mantle boundary (CMB) (e.g. Abe, 1997; Solomatov,
2015) and mid-mantle depths (Labrosse et al., 2007; Stixrude       1.2   Crystallisation of a magma ocean from the middle
et al., 2009; Nomura et al., 2011; Labrosse et al., 2015;
Boukaré et al., 2015; Caracas et al., 2019). Depending on          If crystallisation of the magma ocean instead starts some-
this depth, several distinct scenarios of magma ocean evolu-       where at mid-mantle depths and the crystals formed are
tion are expected to occur.                                        near-neutrally buoyant (Labrosse et al., 2007; Boukaré et al.,
                                                                   2015), the first layer of solid mantle forms and separates the
                                                                   magma ocean into a TMO and BMO (Fig. 1b). The two crys-
1.1   Crystallisation of a magma ocean from the bottom
                                                                   tallisation fronts then move in opposite directions: the TMO
                                                                   front progresses upwards until it reaches the surface of the
If crystallisation of the magma ocean starts at the CMB, the       planet, and the BMO front progresses downwards until it
first layer of solid cumulates forms at the bottom of this         reaches the CMB. In this process, both the TMO and BMO,
magma ocean (Fig. 1a). As the temperature of the ocean de-         as well as the related cumulates, become progressively en-
creases, the crystallisation front steadily progresses upwards,    riched in FeO (Fig. 1b). In contrast to the TMO cumulates
creating more and more solid cumulates. When the crystalli-        (see Sect. 1.1), BMO cumulates are likely formed over much
sation front reaches the surface of the planet, the solid mantle   longer timescales (Labrosse et al., 2007) and are expected
of the Earth is fully formed.                                      to form a stable density profile. By the time the BMO is
   Assuming that the temperature of solid cumulates stays          fully crystallised, a dense stable solid layer may persist at
close to that of the solidus, these solid cumulates are ther-      the base of the mantle. This dense layer may explain seismic
mally unstable as the solidus is steeper than the isentrope.       observations that point to the existence of thermo-chemical
Also assuming that some degree of fractional crystallisa-          piles near the CMB (Masters et al., 2000; Ni and Helm-
tion occurs (Solomatov and Stevenson, 1993b; Brown et al.,         berger, 2001; Garnero and McNamara, 2008; Deschamps
2014; Elkins-Tanton et al., 2003), the magma ocean becomes         et al., 2012; Labrosse et al., 2015; Ballmer et al., 2016).
progressively enriched in iron silicates (FeO), as iron be-
haves like a mildly incompatible element (Murakami and             1.3   Motivation
Bass, 2011; Nomura et al., 2011; Andrault et al., 2012;
Tateno et al., 2014). Accordingly, the solid cumulates (ini-       Along these lines, the chemical evolution of the solid mantle
tially enriched in MgO) that form in chemical equilibrium          depends on the history of early planetary melting and crys-
with the overlying magma ocean incorporate progressively           tallisation. This is a history with either one or two magma
more FeO with time and, as a result, become denser with            oceans and with convection in the solid mantle driven by un-
time (Fig. 1a). Therefore, on top of being thermally un-           stable thermal and/or chemical stratification, probably while
stable, the solid cumulates are also gravitationally unsta-        magma ocean(s) at the top and/or bottom are still present.
ble due to their composition. This leads to a large-scale          While any such convection would imply remelting of solid
overturn after magma ocean crystallisation (Elkins-Tanton          cumulates, the related consequences for mantle evolution are
et al., 2003, 2005) or multiple small-scale overturns during       poorly understood. Only a few numerical modelling studies
crystallisation (Maurice et al., 2017; Ballmer et al., 2017b;      have explicitly incorporated coupled remelting and crystalli-
Boukaré et al., 2018; Morison et al., 2019; Miyazaki and Ko-       sation at the magma ocean–mantle boundary or boundaries
renaga, 2019b). Such overturn(s) may lead to remelting of          (Labrosse et al., 2018; Morison et al., 2019; Agrusta et al.,
FeO-enriched material at depth, as the isentrope of such ma-       2019), and none of these studies have explored the conse-
terial is steeper than its melting curve through most of the       quences for chemical evolution.
mantle.                                                               In this paper, we use a numerical model to investigate
   This dense remelted material may form a basal magma             the thermo-chemical evolution of the solid mantle in contact
ocean (BMO) (Labrosse et al., 2015), join an existing one          with a TMO and/or a BMO. We consider that convection in
(Labrosse et al., 2007) (see Sect. 1.2), or react with the un-     the solid mantle starts before the end of magma ocean crys-
derlying solid mantle (Ballmer et al., 2017b). Hence, the          tallisation; therefore, dynamic topographies that may form
solid mantle may evolve from being bounded above by only           at one or both solid mantle–magma ocean boundaries can
one magma ocean, the top magma ocean (TMO), to being               melt or crystallise. We do not explicitly account for the pro-
bounded by two magma oceans, the TMO and BMO, de-                  gression of the crystallisation front(s). However, we test sev-
pending on the fate of overturned cumulates. Ultimately, the       eral evolution scenarios and different magma oceans thick-
TMO is expected to completely crystallise, potentially leav-       nesses. We determine the timescales of chemical equilibrium
ing a long-lived BMO after the final overturn of the most          between the magma ocean(s) and the solid mantle, and we
FeO-enriched cumulates. Because the overturning events are         compare them with those of progression of the crystallisa-
potentially swift and of large-scale nature, the resulting solid   tion front (e.g. Lebrun et al., 2013). For simplicity, in the

Solid Earth, 12, 421–437, 2021                                                         https://doi.org/10.5194/se-12-421-2021
D. P. Bolrão et al.: Timescales of chemical equilibrium between the solid mantle and MOs                                             423

Figure 1. Sketches of magma ocean (MO) crystallisation scenarios. As cooling of the MO proceeds, adiabats (cyan dashed lines) cross the
liquidus (yellow curve), and the solid mantle (S) appears, either (a) near the core–mantle boundary (CMB) or (b) somewhere at mid-mantle
depths. In panel (b) the MO is divided into a top magma ocean (TMO) and a basal magma ocean (BMO) as soon as the solid appears. In both
scenarios, liquid and solid cumulates become enriched in FeO with time, which may lead to an overturn of solid material (not depicted, see
text for details). Mush is not considered.

following we use the term solid–liquid phase changes inter-            ficient (α), and the compositional expansion coefficient (β).
changeably with fractional crystallisation and melting pro-            The values of these parameters can be found in Table 1.
cesses at the interface between the solid mantle and TMO                  We make equations dimensionless to reduce the number of
and/or BMO.                                                            parameters that describe the physical problem. Dimensions
                                                                       of distance, time, and temperature can be recovered using
                                                                       the thickness
                                                                                   of the solid mantle(hS ), the thermal diffusive
2     Numerical model                                                               h2S
                                                                       timescale    κ     , and the temperature difference between bot-
2.1    Problem definition                                              tom and top solid mantle boundaries (1T = T − − T + ) re-
                                                                       spectively. The dimensionless temperature (T ) is defined as
We use the finite volume or finite difference method with              follows:
the StagYY (Tackley, 2008) convection code to model the
thermo-chemical evolution of the solid mantle during magma                   T0 −T+
                                                                       T =          .                                                 (1)
ocean crystallisation. We test three different evolution sce-                  1T
narios, as the solid mantle may be bounded above by a                     We assume incompressibility in the Boussinesq approx-
TMO and/or below by a BMO (Fig. 2). We assume steady                   imation (e.g. Chandrasekhar, 1961). Therefore, mass, en-
crystallisation front(s) and test different magma ocean thick-         ergy, composition, and momentum conservation equations
nesses: when only one ocean is present, it can be 100, 500, or         are written as follows:
1000 km thick; when both oceans are present, the thickness
of each ocean is 100 and/or 500 km.                                    ∇·u = 0                                                        (2)
   We assume that the solid mantle is an infinite Prandtl num-         ∂T
ber fluid. We assume mechanical stability between the solid                + u · ∇T = ∇ 2 T                                           (3)
                                                                       ∂t
mantle and magma oceans, i.e. ρTMO < ρS < ρBMO , where                    S
ρTMO , ρS , and ρBMO are the densities of the TMO, solid               ∂XFeO          S
                                                                              + u · ∇XFeO   =0                                        (4)
mantle, and BMO respectively. We set constant values for                 ∂t
gravitational acceleration (g), viscosity (η), thermal diffu-          −∇p + ∇ 2 u + Ra T − hT i − B(XFeO
                                                                                                      S − hX S i) r̂ = 0,
                                                                                                            FeO                       (5)
sivity (κ), heat capacity (Cp ), the thermal expansion coef-

https://doi.org/10.5194/se-12-421-2021                                                                Solid Earth, 12, 421–437, 2021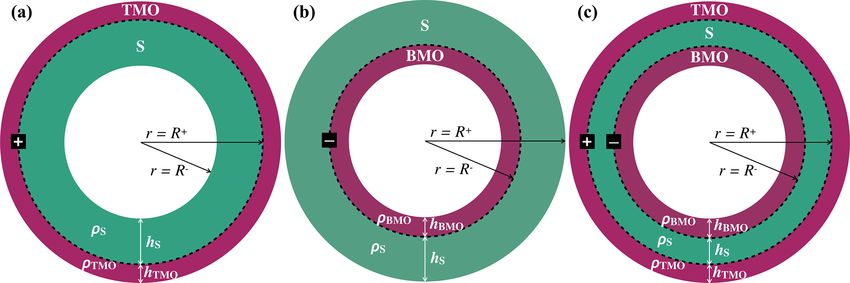
424                               D. P. Bolrão et al.: Timescales of chemical equilibrium between the solid mantle and MOs

Figure 2. Sketches of three possible evolution scenarios: solid mantle (S) bounded by a (a) top magma ocean (TMO), (b) basal magma ocean
(BMO), and (c) TMO and BMO. Solid mantle is taken as a spherical shell with density ρS , thickness hS , inner radius R − , and outer radius
R + . TMO and BMO are taken with respective densities of ρTMO and ρBMO and respective thicknesses of hTMO and hBMO . Superscripts
“+ ” and “− ” at the boundaries refer to the boundary between the TMO and the solid mantle and the boundary between the solid mantle and
the BMO respectively.

Table 1. Parameters used in the simulations.

                     Parameter (dimension)                            Symbol   Value
                     Radius of the core–mantle boundary (km)          RCMB     3480
                     Total radius of the planet (km)                  RP       6370
                     Thickness of the solid mantle today (km)         hM       2890
                     Gravitational acceleration (m s−2 )              g        9.81
                     Viscosity (Pa s)                                 η        –
                     Thermal diffusivity (m2 s−1 )                    κ        5 × 10⁻⁷
                     Heat capacity (J kg−1 K−1 )                      Cp       1200
                     Thermal conductivity (W m−1 K−1 )                k        3.0
                     Thermal expansion coefficient (1 / K)            α        10−5
                     Reference density (kg m−1 )                      ρ        5000
                     Buoyancy number (–)                              B        1.0
                     Solid–liquid partition coefficient of FeO (–)    K        0.3
                     Phase change number (–)                          8        10−1 − 105
                     Thickness of top magma ocean (km)                hTMO     0 if only BMO present, 100, 500, 1000
                     Thickness of basal magma ocean (km)              hBMO     0 if only TMO present, 100, 500, 1000
                     Supercriticality (–)                             SC       102 − 105
                     FeO concentration of the bulk (–)                  Bulk
                                                                      XFeO     0.12

where u is the velocity field, hT i is the lateral average of the        details). We set temperature to 1.0 and 0.0 at the bottom
                                       S is the FeO molar con-
temperature field T , t is the time, XFeO                                and top solid domain boundaries respectively. Regarding the
                             S                               S ,
tent in the solid mantle, hXFeO i is the lateral average of XFeO         buoyancy number, Earth-like models point to a value of
p is the dynamic pressure, Ra is the Rayleigh number, and B              B ≈ 3 for the present-day mantle (i.e. based on the density
the buoyancy number. The last two respective parameters are              difference between Mg- and Fe-rich silicate endmembers as
defined as follows:                                                      well as CMB temperature estimates). However, there are sig-
                                                                         nificant uncertainties associated with the value of α (which
    ρgα1T h3S                                                            is temperature and pressure dependent, e.g. Tosi et al., 2013)
Ra =          ,                                                 (6)
       ηκ                                                                and that of 1T in the solid part of the primitive mantle. For
    β                                                                    example, 1T increases with the thickness of the solid layer.
B=     .                                                        (7)      Within these uncertainties, at least a range of 1 ≤ B ≤ 3 is
   α1T
                                                                         acceptable. In this paper, we choose B = 1.0 in order to limit
  In this study, we consider that magma oceans and solid
mantle are only made of (Fe, Mg)O (see Sect. 2.3 for more

Solid Earth, 12, 421–437, 2021                                                                https://doi.org/10.5194/se-12-421-2021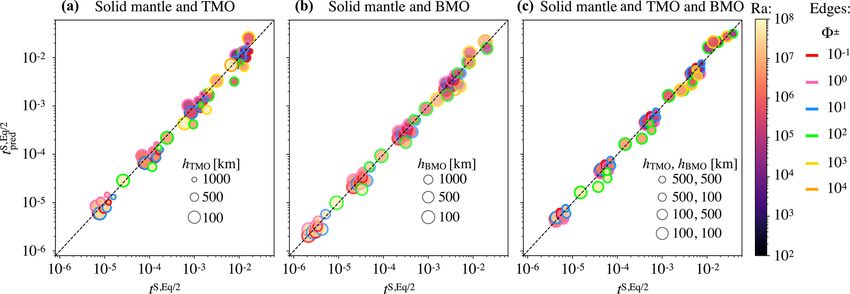
D. P. Bolrão et al.: Timescales of chemical equilibrium between the solid mantle and MOs                                      425

the impact of the initial condition on the onset of convection     mantle boundaries is
(see Sect. 4).
                                                                       ∂ur
   The solid domain is represented using the spherical an-         2       − p ± 8± ur = 0,                                   (9)
nulus geometry (Hernlund and Tackley, 2008), composed of               ∂r
a grid of 512 × 128 cells, in which Eqs. (2)–(5) are solved.       where ur is the vertical velocity of the flow in the solid
Composition is advected by tracers. We assume that each            mantle. On the one hand, this boundary condition can act
magma ocean is well-mixed and that its dynamics are fast           like a non–penetrating free–slip boundary condition when
compared with that of the solid mantle. In our set-up, magma       8 → ∞, as vertical velocities of the solid flow tend to zero
oceans are treated as simple 0-D compositional reservoirs at       at the boundaries. Under this boundary condition, transfer of
solid mantle boundaries. In the following we use the super-        material across a solid mantle–magma ocean boundary can-
scripts “+ ” and “− ” to refer to top and bottom solid mantle      not occur. On the other hand, this boundary condition can act
boundaries respectively. In equations, the sign “±” reads as       as being “open” to phase changes when 8 → 0, as these ver-
“+” if a TMO is considered and as “−” if a BMO is consid-          tical velocities will be non-zero at the solid mantle–magma
ered. The subscript “MO ” refers to magma ocean. Thus, when        ocean boundary, and a significant flux of solid and liquid ma-
we introduce a quantity, e.g. ξ , related to a magma ocean, we     terial can cross it to melt and crystallise. Hence, transfer of
                 ±           +
introduce it as ξMO  , with ξMO   = ξTMO relating to the TMO       material across the phase change boundary is efficient. In the
      −
and ξMO = ξBMO relating to the BMO.                                extreme case of 8 = 0, this boundary condition corresponds
                                                                   to free in- and outflow.
2.2   Dynamic topography and the phase change                         The specific value of 8 is difficult to constrain (because
      boundary condition                                           τφ is non-trivial to determine) and is also expected to vary
                                                                   with time (i.e. because τη depends on the thickness of the
As convection in the solid mantle likely starts before the
                                                                   solid mantle) (Deguen, 2013; Deguen et al., 2013). How-
end of magma ocean crystallisation (Maurice et al., 2017;
                                                                   ever, for a purely thermal case, Morison et al. (2019) and
Ballmer et al., 2017b; Boukaré et al., 2018; Morison et al.,
                                                                   Morison (2019) estimate 8+ ∼ 10−5 and 8− ∼ 10−3 for the
2019; Miyazaki and Korenaga, 2019b), dynamic topogra-
                                                                   Earth respectively. Therefore, significant transfer of mate-
phies are supported at one or both solid mantle boundaries.
                                                                   rial across the solid mantle–magma ocean boundaries is ex-
The timescale for producing dynamic topography is noted τη .
                                                                   pected. However, also consider that real multi-phase rocks
This topography can be eroded by solid–liquid phase changes
                                                                   typically melt over large pressure ranges, except for truly
on a timescale related to the transfer of energy and FeO
                                                                   eutectic bulk compositions. The depleted residue of mantle
through the magma ocean, from material that is crystallising
                                                                   melting may restrict the efficiency of material transfer across
to material that is melting. We denoted this timescale using
                                                                   the solid mantle–magma ocean boundaries, depending on the
τφ .
                                                                   efficiency of melt–solid segregation near the boundaries. In
   The relative values of the two timescales, τη and τφ , con-
                                                                   addition to the expected temporal evolution of 8± , this po-
trol the dynamical behaviour of the boundary. If τη  τφ ,
                                                                   tential restriction motivates our exploration of a broad range
dynamic topography can build before being erased by the
                                                                   of 8± . In this study we use seven values of 8± that range
phase change. In this case, dynamic topography is only lim-
                                                                   from 10−1 to 105 . We use 8 = 10−1 as the lowest possible
ited by the balance between viscous stress in the solid and
                                                                   value of 8± because the resolution of the thermal boundary
the buoyancy associated with the topography. In the limit of
                                                                   layer is computationally demanding once 8± decreases be-
small topographies, this leads to the classical non-penetrating
                                                                   low 10−1 .
free-slip boundary condition in which the radial velocity of
                                                                      Deguen et al. (2013) and Labrosse et al. (2018) found that
the solid effectively goes to zero at the boundary (Ricard
                                                                   the critical Rayleigh number, Rac , for the solid mantle is
et al., 2014). On the other hand, if τη  τφ , the topography is
                                                                   strongly sensitive to 8 and the set-up considered, i.e. hav-
erased faster by phase changes than it can be built by viscous
                                                                   ing a TMO and/or a BMO, as well as to the thickness of the
stress in the solid. Consequently, this removes the stress im-
                                                                   solid layer. For instance, if the solid mantle is bounded by a
posed by the topography and the associated limit to the radial
                                                                   TMO of 100 km and 8 → ∞, Rac is of the order of 103 , but
velocity. These processes are incorporated into our boundary
                                                                   for small 8, it is of the order of 102 . Rac can even decrease
condition, described by the phase change number,
                                                                   to arbitrarily small values of the order of ∼ 8 if a TMO and
      τφ                                                           BMO are both considered. Therefore, we also systematically
8=       ,                                                  (8)
      τη                                                           vary the Rayleigh number, Ra, which controls the convec-
                                                                   tive vigour of the mantle. We choose Ra as multiples of Rac ,
considering that when 8 → ∞, dynamic topography is built           according to the supercriticality factor, SC:
(or relaxes) by viscous forces, and when 8 → 0, it is eroded
by melting or fractional crystallisation processes (Deguen,        Ra = Rac × SC.                                            (10)
2013; Deguen et al., 2013). The related phase change bound-
ary condition in dimensionless form, at one or both solid          We use four values of SC ranging from 102 to 105 .

https://doi.org/10.5194/se-12-421-2021                                                          Solid Earth, 12, 421–437, 2021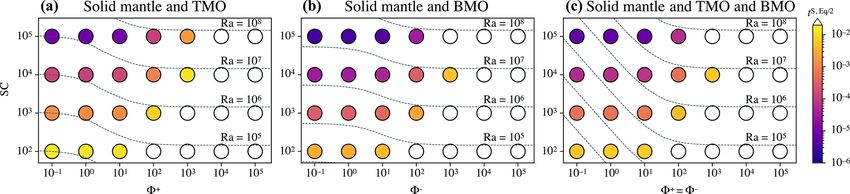
426                              D. P. Bolrão et al.: Timescales of chemical equilibrium between the solid mantle and MOs

2.3   Compositional treatment                                       From Eqs. (11) and (12), one can find the FeO content in
                                                                    the solid mantle when it is in chemical equilibrium with the
In this study, we consider a simplified compositional model         magma ocean(s):
with only two components, FeO and MgO, which are thought                            √
to be the Fe-rich and Mg-rich endmembers of mantle sili-              S, Eq   −b + b2 − 4ac
cates. We denote the FeO and MgO molar content in the solid         XFeO =                     ,                            (13)
                                                                                     2a
and magma ocean parts by XFeO   S          MO and using X S
                                    and XFeO                 MgO
       MO respectively. We consider mass balance between            where
and XMgO
FeO and MgO in the solid mantle and magma oceans; there-            a = VS (1 − K),
        S + XS
fore, XFeO                        MO       MO
                 MgO = 1, and XFeO + XMgO = 1.                                                Bulk
   Our model simulates melting and crystallisation of mate-         b = VTMO + VBMO + VS K − XFeO  (VTMO + VBMO + VS )
rial depending on the influx and outflux of material at the             (1 − K),
solid mantle boundary. Melting of solid material is simulated             Bulk
                                                                    c = −XFeO  K(VTMO + VBMO + VS ).
when dynamic topography develops outside the solid do-
main, i.e. when there is an outflux of material from the solid         However, because chemical equilibrium would take too
domain. It is assumed that no fractionation operates when the       long to reach in a reasonable runtime, we look for the
solid melts, i.e. all (Fe,Mg)O present in this topography goes      timescale to reach chemical half-equilibrium. Starting with
into the magma ocean. Therefore, tracers that leave the solid                                                    S, Ini
                                                                    an FeO content in the solid mantle equal to XFeO    , the half-
domain pass their information (about mass and composition)          equilibrium is reached when the solid mantle reaches the
to the magma ocean and are deleted.                                           S, Eq/2
                                                                    content XFeO , which is defined as
   We simulate crystallisation of the magma ocean when neg-
ative dynamic topography develops in the solid domain, i.e.                            S, Ini    S,Eq
                                                                        S, Eq/2       XFeO    + XFeO
when there is an influx of mass in the solid domain. When           XFeO          =                  .                           (14)
this happens, the influx of material pushes tracers, and cells                                2
near the boundary are left with no tracers. To ensure mass          We denote by t S, Eq/2 the time at which the solid mantle
conservation, new n tracers are introduced in those cells, and      reaches chemical half-equilibrium.
this process simulates solid mantle being created. To deter-           Previous studies suggest that the Fe content of the present-
mine n, i.e. the amount of tracer that needs to be introduced       day bulk silicate Earth is 0.113 (Taylor and McLennan, 1985)
in the solid part, we calculate the influx of mass correspond-      or 0.107 (McDonough and Sun, 1995). We suppose that some
ing to this dynamic topography and divide it by the tracer          of the Fe could migrate to the core with time (e.g. Nguyen
ideal mass. We then equally distribute the influx of mass by        et al., 2018); therefore, in this study, we use XFeOBulk = 0.120.
n tracers. The composition of the solid created is related to       We start the simulations with a homogeneous FeO content in
that of the liquid by fractional crystallisation; therefore, only   the solid mantle and magma ocean(s), XFeO   S, Ini      TMO, Ini
                                                                                                                       = XFeO        =
a fraction of FeO goes into the solid. This fraction is given         BMO, Ini
                                                                    XFeO       = 0.120. Although this initial composition is not
by the distribution coefficient, K:
                                                                    consistent with the fractional crystallisation assumed in this
       S X MO
      XFeO                                                          problem, it effectively serves our goal of measuring the
           MgO
K=     MO X S
                  .                                         (11)    timescale to reach chemical equilibrium between solid and
      XFeO MgO                                                      liquid reservoirs.
We assume that K = 0.3 (e.g. Corgne and Wood, 2005; Lieb-
ske et al., 2005). The difference between the influx and out-       3     Results
flux of material through the boundary is of the order of 10−15 ,
meaning that conservation of mass in the solid mantle is en-        3.1     Chemical evolution of the mantle bounded on top
sured.                                                                      by a TMO
   In this paper, we attempt to estimate the characteristic
timescale to establish chemical equilibrium between the solid       In this subsection, we investigate how the chemical evolution
mantle and the magma ocean(s). Assuming a full equilib-             of the solid mantle is affected by the efficiency of mass trans-
rium between the solid mantle and magma oceans (super-              fer across the phase change boundary, as controlled by 8. As
                                               Bulk , can be ex-
script “Eq ”), the FeO content in the bulk, XFeO                    mentioned in the previous section, low values of 8 corre-
pressed as function of the volumes (VS , VTMO , and VBMO )          spond to efficient material transfer across the phase change
                          S,Eq  TMO,Eq          BMO,Eq              boundaries, and high values of 8 correspond to inefficient
and the FeO content (XFeO , XFeO , and XFeO              ) in the
solid mantle and magma oceans:                                      material transfer, similar to classical convection. We first
                                                                    analyse the case of a solid mantle bounded above by a TMO,
           TMO,Eq             BMO,Eq             S,Eq
 Bulk     XFeO        VTMO + XFeO  VBMO + XFeO VS                   as the most straightforward scenario for early planetary evo-
XFeO  =                                           . (12)            lution. At the end of this subsection, we briefly compare this
                        VTMO + VBMO + VS

Solid Earth, 12, 421–437, 2021                                                                 https://doi.org/10.5194/se-12-421-2021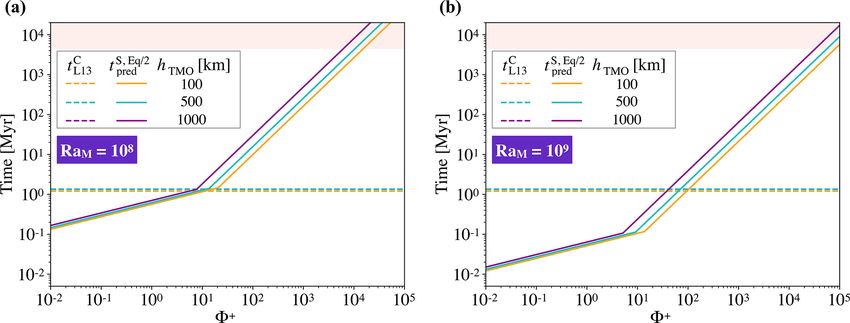
D. P. Bolrão et al.: Timescales of chemical equilibrium between the solid mantle and MOs                                      427

scenario with those where the solid mantle is in contact with     cal equilibrium but not chemical homogeneity. In Fig. 5, we
just a BMO and with both magma oceans.                            present snapshots of the FeO content in the solid mantle for
   Because the parameter space explored in this paper is vast,    different evolution scenarios at about the time of chemical
as an example, we illustrate the chemical evolution of a solid    half-equilibrium. When the solid mantle is in contact with
mantle bounded by a TMO of 500 km, under three different          just a BMO, material from the magma ocean crystallises at
values of phase change number, 8+ = 10−1 , 102 , and 103 ,        the boundary and forms upwellings (in blue). This material
at the same supercriticality value of SC = 105 . As the criti-    is FeO depleted and, similarly to the TMO case, introduces
cal Rayleigh number, Rac , decreases as 8+ decreases, these       a strong heterogeneity in the solid mantle around the half-
three cases have different values of Rayleigh number, Ra.         equilibrium time. When the solid mantle is in contact with
Hence, for 8+ = 10−1 , 102 , and 103 , Ra = 100×105 , 635×        both oceans, convection occurs with degree-1, i.e. material
105 , and 687 × 105 respectively. According to Eqs. (12) and      of the TMO and of the BMO crystallises at the correspond-
(13), the expected FeO content in each reservoir in chemi-        ing boundary and forms a downwelling (in blue) and an up-
                                               S,Eq               welling (in blue and green) respectively. Note that in this
cal equilibrium would be approximately XFeO = 0.082 and
= XFeO
      TMO,Eq
              = 0.229. As we initialise each reservoir with an    scenario, as the volume of the BMO is smaller than that of
                   S, Ini     TMO, Ini                            the TMO, the BMO composition changes rapidly. Therefore,
FeO content of XFeO       = XFeO       = 0.120, the system does
                                                                  the composition of the upwelling changes rapidly as well
not start in chemical equilibrium. We determine the time
                                                                  (colours from blue to green). The degree-1 pattern of con-
needed to reach chemical half-equilibrium.
                                                                  vection persists stably for the whole simulation time.
   Figure 3 shows the chemical evolution in dimensionless
time units of these three cases. Our models predict that re-      3.2   Timescales of chemical half-equilibrium between
gardless of the value of 8+ , the FeO content in the solid              the solid mantle and magma ocean(s)
                               S,Eq
mantle decreases towards XFeO , and the FeO content in the
                             TMO,Eq                               Figure 6 shows the timescales of chemical half-equilibrium
TMO increases towards XFeO , thereby bringing the solid
mantle and the TMO close to chemical equilibrium (but not         for the scenarios explored in the previous subsection. For
chemical homogeneity as seen later). However, the lower           a wide range of SC and 8± , these timescales are shown
the value of 8+ , the faster half-equilibrium is reached, as      for a solid mantle bounded by a TMO of 500 km thickness
it effectively increases the exchange of material between         (Fig. 6a), by a BMO of 500 km thickness (Fig. 6b), and by
reservoirs. We calculate the time needed to reach chemical        a TMO and a BMO of 500 and 100 km thickness respec-
half-equilibrium, and half-equilibrium is reached ∼ 10 times      tively (Fig. 6c). For all evolution scenarios, models predict
faster for 8 = 10−1 than for 8 = 102 and ∼ 200 times faster       that timescales of chemical half-equilibrium decrease for de-
for 8 = 10−1 than for 8 = 103 .                                   creasing 8± . In other words, chemical half-equilibration is
   In Fig. 4, we present snapshots of the FeO content in the      more efficient for efficient material transfer across the solid
solid mantle for these three cases. Our models show that dy-      mantle–magma ocean boundaries. Our results also show that
namics in the solid mantle is very different between cases.       the timescales of chemical half-equilibration are similar (i.e.
With 8+ = 10−1 (Fig. 4a), mantle flow is dominated by             of the same order of magnitude) for a given SC and 8± rang-
degree-1 convection, which persists stably for the whole sim-     ing between 10−1 and 101 , independent of the evolution sce-
ulation time. With this pattern of convection, there is an up-    nario. This shows that below 8± = 101 a regime with effi-
welling of primordial material (in yellow) that melts on one      cient material transfer across the solid mantle-magma ocean
hemisphere, while material from the TMO crystallises at the       boundaries is established. The transition to the regime of in-
boundary and forms a downwelling on the other hemisphere          efficient material transfer (i.e. in which mantle flow is limited
(in blue). This downwelling is FeO depleted, which intro-         by viscous building of dynamic topography) occurs some-
duces a strong heterogeneity in the solid mantle. Degree-1        where between 8± = 101 and 102 . In this regime, timescales
convection involves very little deformation, which explains       of half-equilibration systematically increase with 8± . Our
the existence of a considerable amount of primordial mate-        models predict that this transition between regimes occurs
rial in the solid mantle, even around the time at which chem-     over a similar interval of 8± for other thicknesses of TMO
ical half-equilibrium occurs (snapshot inside the red box).       and/or BMO.
As 8+ increases (Fig. 4b, c), higher-degree modes of con-            To obtain an empirical scaling law, we fit the predicted
                                                                                S, Eq/2
vection with several convection cells appear. Although the        timescales, tpred , for all simulations that reached chemi-
composition of the TMO and the average composition of the                                                                S, Eq/2
                                                                  cal half-equilibrium. The fitting equation provides tpred        in
solid mantle tend to mutual chemical equilibrium in all three     dimensionless form as a function of Ra, 8± and VS :
cases, chemical homogeneity across the solid mantle is not
necessarily reached.
   Our models show that for other evolution scenarios, i.e.
solid mantle in contact with just a BMO and with a TMO
and BMO, the system also evolves to a state close to chemi-

https://doi.org/10.5194/se-12-421-2021                                                          Solid Earth, 12, 421–437, 2021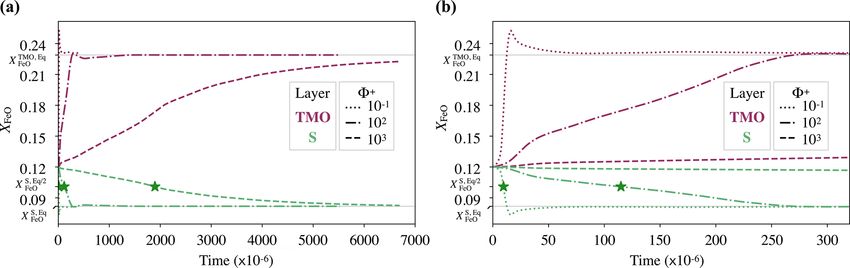
428                                D. P. Bolrão et al.: Timescales of chemical equilibrium between the solid mantle and MOs

Figure 3. (a) Evolution of the FeO content, XFeO , in the solid mantle (S, green) and top magma ocean of 500 km (TMO, pink), with
dimensionless time units. We test three different values of phase change number: 8+ = 10−1 , 102 , and 103 (different lines). Green stars
                                                                                                 S, Eq/2
correspond to the point where the FeO content in chemical half-equilibrium in the solid mantle, XFeO , is reached. In these simulations,
supercriticality is SC = 105 . (b) A zoomed in view of panel (a) at the beginning of evolution.

                                                               S , as a function of dimensionless time (factor of 10−6 inside each annulus)
Figure 4. Snapshots of the FeO content in the solid mantle, XFeO
for the cases presented in Fig. 3: (a) 8+ = 10−1 , (b) 8+ = 102 , and (c) 8+ = 103 . In these simulations, the top magma ocean thickness is
500 km and there is no basal magma ocean. Supercriticality is SC = 105 in all three cases shown. Snapshots within a red box indicate that
the model time is close to the chemical half-equilibrium time, t S, Eq/2 . For 8+ = 10−1 , 102 , and 103 , t S, Eq/2 = 9.6 × 10⁻⁶ , 114.9 × 10⁻⁶ ,
and 1895.5 × 10−6 respectively. Magenta contours correspond to the streamlines of the flow.

                                                                           chemical half-equilibrium, obtained with our model predic-
                       ± a2                                             tions and our empirical scaling law (Fig. A1).
                                VS a3

 S, Eq/2               8                                                      Equation (15) presents two branches, each correspond-
tpred  = max a0 Ra a1                 ,
                        10      VM                                         ing to a different regime: the left branch corresponds to the
            ± a6
                     VS a7
                                                                         regime of efficient material transfer across the solid mantle–
         a5 8
   a4 Ra                    ,                                    (15)      magma ocean boundaries, and the right branch corresponds
            10       VM
                                                                           to the regime of inefficient material transfer. Our models
                                                                           predict that in the regime of efficient material transfer (i.e.
where VM is the volume of the present-day Earth’s mantle.
                                                                           for low values of 8), timescales to reach chemical half-
Coefficients of this equation can be found in Table 2. In the
                                                                           equilibrium are only loosely affected by the volume of the
Appendix A of this paper, we explain the regression method
                                                                           solid mantle (or in other words, by the volume of the magma
and show a good agreement between the timescales to reach

Solid Earth, 12, 421–437, 2021                                                                     https://doi.org/10.5194/se-12-421-2021
D. P. Bolrão et al.: Timescales of chemical equilibrium between the solid mantle and MOs 429
oceans are present, the critical Rayleigh number can even
be arbitrarily low as 8± decreases towards zero (Labrosse
et al., 2018). Moreover, Agrusta et al. (2019) showed that
the heat flow and root mean square (RMS) velocity in the
solid mantle vary linearly with Ra when both magma oceans
are present, whereas heat flow and RMS velocity in the solid
mantle vary as Ra 1/3 and Ra 2/3 respectively when only one
magma ocean present. This further increases the difference
between the two scenarios at a given value of the Rayleigh
number. Therefore, one should expect that the timescales
to reach chemical half-equilibrium may be arbitrarily low,
depending on the efficiency of material transfer across the
BMO–mantle and TMO–mantle boundaries.
3.3 Chemical half-equilibrium and crystallisation
timescales
In this subsection, we compare the timescales to reach chem-
S ,
ical half-equilibrium between a solid mantle and a TMO of
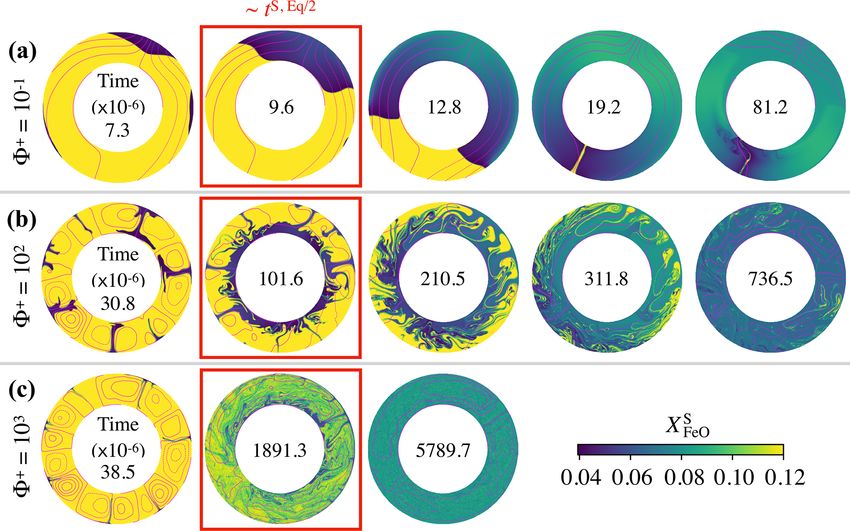
Figure 5. Snapshots of the FeO content in the solid mantle, XFeO a given thickness with timescales of crystallisation of such
close to the time at which the system reaches chemical half-
a TMO, as calculated for the Earth case. The timescales of
equilibrium (time is dimensionless with a factor of 10−6 inside
TMO crystallisation (i.e. before reaching the mush stage) are
each annulus), for (a) 8 = 10−1 , (b) 8 = 102 , and (c) 8 = 103 . C .
The solid mantle is in contact with (left) a top magma ocean (TMO) given by Lebrun et al. (2013), hereinafter denoted by tL13
of 500 km, (middle) a basal magma ocean (BMO) of 500 km, and We take the solid mantle bounded on top by a TMO of 100,
(right) a TMO of 500 km and a BMO of 100 km. Supercriticality 500, and 1000 km thickness and use Eq. (15) to determine
is SC = 105 in all cases shown. Magenta contours correspond to the timescales of half-equilibration as a function of phase
the streamlines of the flow. Cases with 8 = 103 for a solid mantle change number, 8+ . In an attempt to apply our fitting equa-
in contact with only BMO and with TMO and BMO did not reach tion to Earth, we assume that the global Rayleigh number of
chemical half-equilibrium. Note that the difference between the as- the early Earth mantle just after solidification of the TMO is
pect ratio of each evolution scenario is too small to be noticed in between RaM = 108 and RaM = 109 . RaM is calculated on
these annuli. the basis of the total thickness of the solid mantle, hM . The
Rayleigh number, Ra, used in Eq. (15) is then rescaled to the
ocean(s)). The volume of the solid only systematically affects actual thickness of the solid mantle (i.e. before solidification
the timescales once the regime shifts to the one of inefficient of the TMO) as follows:
material transfer. This conclusion is independent of the evo-
hS 3
lution scenario. One possible explanation for the weak influ- Ra = RaM . (16)
hM
ence of the solid mantle’s volume is that convection occurs
with a low degree at low values of 8, so the geometry of the This rescaling neglects the change in various physical param-
problem is less important. eters (from Eq. 6), but it is sufficient for our discussion.
We find that timescales to reach chemical half-equilibrium The comparison between timescales is presented in Fig. 7.
are about a factor of 3 larger for a solid mantle in contact The timescale to crystallise the TMO is loosely dependent
with just a TMO (Fig. 6a) than for a solid mantle with just on its thickness, and this time is around 1 Myr. Our mod-
a BMO (Fig. 6b). This can be explained by the fact that the els predict that there are significant chemical exchanges be-
geometry of the problem is different in both cases. Although tween the TMO and the solid mantle for 8+ < 10 and < 100
the TMO and the BMO have the same thickness, the volume for RaM = 108 and RaM = 109 respectively. Therefore, for
of the TMO is larger than that of the BMO by roughly a factor 8+ smaller than these values, the TMO is expected to have
of 3, which explains the increased duration to reach the half- reached (at least) chemical half-equilibrium with much of the
equilibrium FeO content in the magma ocean. mantle before reaching the mush stage. Thus, a very strong
When it comes to a solid mantle bounded by both oceans enrichment of the final-stage TMO as predicted by fractional
(Fig. 6c), models predict that timescales are roughly 2 orders crystallisation models (Elkins-Tanton et al., 2003) is not ex-
of magnitude smaller than those of a solid mantle in contact pected to occur for small to moderate 8+ .
with just a TMO (Fig. 6a), for a given Rayleigh number. This Increasing the thickness of the TMO and, hence, decreas-
result is explained by two effects. The critical Rayleigh num- ing the thickness of the solid mantle, decreases the Rayleigh
ber is much lower when two magma oceans are present than number and the ratio VS /VM , which make the dimensionless
when only one is present. In principle, when both magma time increase (see fitting). Moreover, decreasing the thick-
https://doi.org/10.5194/se-12-421-2021 Solid Earth, 12, 421–437, 2021430 D. P. Bolrão et al.: Timescales of chemical equilibrium between the solid mantle and MOs
Figure 6. Timescales to reach chemical half-equilibrium (in different colours), t S, Eq/2 , between the solid mantle and (a) a top magma ocean
(TMO) of 500 km, (b) a basal magma ocean (BMO) of 500 km, and (c) a TMO of 500 km and BMO of 100 km, for different values of
supercriticality, SC = 102 − 105 (Ra is indicated by dashed lines), and phase change number, 8 = 10−1 − 105 . White circles are cases that
did not reach chemical half-equilibrium within a reasonable runtime.
S, Eq/2
Table 2. Results of the regressions of the timescales of chemical half-equilibration using the following form: tpred =
± a2 a3 a a7 i
a5 8± 6 VS
h
VS
max a0 Ra a1 810 V , a 4 Ra 10 V . The regression method is detailed in Appendix A.
M M
Regime Coefficient Solid mantle in contact with
TMO BMO TMO and BMO
Solid–liquid phase changes (8 → 0) a0 464 850 103 146 100 473
a1 −1.042 −1.008 −1.000
a2 0.313 0.176 0.948
a3 −0.994 −1.326 −0.646
Viscous building (8 → ∞) a4 12 075 20 743 48 481
a5 −0.884 −0.972 −0.999
a6 1.214 1.208 1.195
a7 −2.584 −7.278 −2.583
Error (%) 28.3 21.2 22.4
ness of the solid mantle decreases the scale for time (h2S /κ), et al., 2015; Ballmer et al., 2017b). Regardless of these is-
which partially compensates for the increase mentioned pre- sues, our study can be applied to various scenarios, includ-
viously when recovering the dimensional time. As a result, ing those with a solid mantle bounded just by a TMO, and
the thickness of solid in the phase change regime only loosely bounded by a TMO and BMO.
affects the dimensional half-equilibration time (Fig. 7). The Classical fractional crystallisation models predict strongly
effect of the thickness of solid is a bit stronger in the high-8 inverse chemical stratification of the initial solid mantle and,
regime (as mentioned before). consequently, a global-scale overturn by the end of a TMO
crystallisation (e.g. Elkins-Tanton et al., 2003, 2005). The
propensity of such a massive density-driven overturn de-
4 Discussion pends on whether or not chemical equilibration between the
solid mantle and magma ocean(s) can occur before magma
Our models address the compositional evolution of the ocean solidification. Any style of magma ocean crystallisa-
solid mantle bounded by magma oceans above and/or be- tion leaves a strongly superadiabatic thermal profile, which
low, and they constrain the time needed to chemically should drive convection in the cumulate layers before full so-
(half-)equilibrate these reservoirs. While the concept of a lidification (Solomatov and Stevenson, 1993a; Ballmer et al.,
TMO that potentially interacts with the underlying solid 2017b; Maurice et al., 2017; Boukaré et al., 2018), and re-
mantle is now well accepted, the idea of a long-lived BMO lated vertical flow should promote (partial) melting near the
remains controversial. Whether or not a BMO can be sta- TMO–mantle (and BMO–mantle) boundary or boundaries.
bilised depends on the slope of the adiabat versus that of the In this study, we focus on a phase change boundary condition
melting curve (Labrosse et al., 2007) and/or on the fate of that allows material to flow through the boundary or bound-
FeO-rich TMO cumulates that sink to the CMB (Labrosse aries and continuously change the composition of solid and
Solid Earth, 12, 421–437, 2021 https://doi.org/10.5194/se-12-421-2021D. P. Bolrão et al.: Timescales of chemical equilibrium between the solid mantle and MOs 431
Figure 7. Timescales to reach chemical half-equilibrium between the solid mantle and a TMO of 100, 500, and 1000 km (orange, blue, and
S, Eq/2
purple solid lines respectively; this study, tpred ) versus different values of phase change number, 8+ , and timescales of crystallisation
C )
of that TMO until it is completely mushy (thicknesses are shown using the same colours and dashed lines, from Lebrun et al., 2013, tL13
versus different values of phase change number, 8+ . Panel (a) corresponds to a Rayleigh number of the solid part of RaM = 108 , and
C values are
panel (b) corresponds to RaM = 109 . The rose shading corresponds to a time higher than the age of the Earth. We note that tL13
consistent with the timescales constrained by Nikolaou et al. (2019) and Salvador et al. (2017).
liquid reservoirs. While flow through the boundary or bound- efficiency of equilibration during the late-stage magma ocean
aries remains penalised by the phase change number, 8, this depends on the timescale of freezing of this final stage, as
approach implies final degrees of melting of at least ∼ 40 %, well as on the efficiency of mass transfer (8+ ) for a thin and
i.e. beyond the rheological transition, at which crystals be- partially mushy TMO.
come suspended (Abe, 1997; Costa et al., 2009). Future work Once the TMO is fully crystallised, 8+ tends to infinity,
using a more realistic melting model is needed to test whether while 8− assumes a finite value as long as the BMO is still
these high degrees of melting can indeed be reached or to present. Dynamics in the solid mantle would change accord-
quantify the effects of partial melting on equilibration be- ingly: convection in the solid mantle may be either domi-
tween the mantle and TMO and/or BMO. nated by degree-1 (low 8− ) or by higher degrees of convec-
Our models show that the composition of the solid man- tion (high 8− ) (Fig. 5). Although our models do not account
tle and magma oceans strongly depends on the phase change for core cooling explicitly, the heat transfer across the man-
number, 8. In this study, we take 8 as being constant through tle is expected to be much more efficient for lower values
time, but because this number depends on the dynamics and of 8− than for high values. This implies that the BMO is
thicknesses of the magma oceans, 8 may change continu- likely to crystallise much faster than suggested by Labrosse
ously in a more realistic model with moving boundaries. Al- et al. (2007, 2015) for low 8− , at least as long as no dense
though we show that chemical equilibration can occur before FeO-enriched materials accumulate at the bottom of the solid
full crystallisation of the magma oceans, variations in 8 and mantle to prevent efficient mass transfer across the BMO–
a moving-boundary scheme should be considered in further mantle boundary. The BMO may even be thermally coupled
studies. to the relatively fast-cooling TMO for low 8+ and low 8− .
Considering that 8± values are low when TMO and BMO On the other hand, it is conceivable that thermally coupled
(or just TMO) crystallisation starts (Morison et al., 2019; TMO and BMO crystallise more slowly than expected for
Morison, 2019), mantle convection would first assume a a thermally isolated TMO (Agrusta et al., 2019). The pres-
degree-1 pattern (Fig. 5), possibly with implications for the ence of a BMO makes heat transfer across the mantle and
origin of crustal dichotomy on the Moon (e.g. Ishihara et al., out of the thermally coupled BMO and core more efficient
2009) and Mars (e.g. Roberts and Zhong, 2006; Citron et al., than for cases without a BMO and with a boundary layer
2018). However, it remains to be shown that such a degree- at the CMB instead. Such a situation implies that there is a
1 pattern of convection would be able to survive through all larger heat reservoir available to buffer the temperature of
stages of magma ocean crystallisation. the TMO for a given heat flux through the atmosphere and
The crystallisation fronts move at different speeds, as the to space. Note that the mass and heat capacity of the core
TMO can crystallise in a few million years (Lebrun et al., are similar to that of a 1000 km thick magma ocean; hence,
2013; Salvador et al., 2017; Nikolaou et al., 2019), whereas the timescale for full crystallisation could be roughly twice
the BMO may persist for much longer (e.g. Labrosse et al., the value usually computed (cf. Lebrun et al., 2013). How-
2007, 2015). Therefore, 8± would change accordingly. The ever, the timescales of TMO, BMO and core cooling would
https://doi.org/10.5194/se-12-421-2021 Solid Earth, 12, 421–437, 2021432 D. P. Bolrão et al.: Timescales of chemical equilibrium between the solid mantle and MOs
be largely unaffected if the BMO were thermo-chemically TMO is fully solidified or becomes a mush (Fig. 7). Equi-
stratified (Laneuville et al., 2018). Whether or not material libration over such a short timescale makes the solid mantle
transfer across the whole mantle, as predicted here for cases mostly homogeneous (with some heterogeneities as seen be-
with low 8± , can efficiently cool the core has important im- fore), which could explain the pyrolitic nature of the man-
plications for the long-term thermal evolution of terrestrial tle (Wang et al., 2015; Zhang et al., 2016; Kurnosov et al.,
planets as well as the propensity of an (early) dynamo. 2017). Therefore, the final-stage TMO and subsequent mush
Even though timescales of BMO crystallisation are not may be efficiently equilibrated with most of the solid man-
well constrained, chemical exchange between the two tle. In this case, we expect solid compositions that are by far
magma oceans (through the solid mantle) is still likely to not as enriched in FeO as predicted by fractional crystallisa-
occur. Note that the same process (i.e. mantle convection) tion models (e.g. Elkins-Tanton, 2012), in which strong en-
that removes heat from the BMO and core is responsible richment only occurs because the final-stage TMO is fully
for this chemical exchange. As an example for the Earth, separated from the solid mantle, with strong disequilibrium
if we take a TMO and a BMO with 100 km thickness each, between the two reservoirs.
8± ≤ 10 and a Rayleigh number of 108 , we would expect Similarly, we expect moderate enrichment (in FeO and in-
a half-equilibrium between solid mantle, TMO, and BMO compatible trace elements) and roughly basaltic to komati-
in less than ∼ 460 kyr, i.e. before TMO crystallisation (and itic (i.e. the melting product of a hot pyrolitic mantle) major-
even more so, before BMO crystallisation). This chemical element compositions of the primary crust. As our models do
exchange, however, does not necessarily imply homogene- not explicitly address the final and mush stages of the TMO
ity between the TMO and BMO, because the relevant phase and consider only a strongly simplified compositional model
diagrams that control fractional crystallisation at the TMO– with just two components, (Fe, Mg)O, more detailed studies
solid mantle (low pressures) and BMO–solid mantle (high with a more complex compositional treatment are needed in
pressures) boundaries are very distinct (e.g. Thomas et al., order to predict the composition of the early crust.
2012; Boukaré et al., 2015). For example, while the FeO dis- In our models, we consider a simplified initial condition
tribution coefficient, K, defined in Eq. (11), is taken as a con- with bulk planetary TMO and BMO compositions (XFeO Bulk =
stant in this study, its value is likely to be pressure dependent TMO, BMO
0.12 and XFeO = 0.12). While this condition may be
(Nomura et al., 2011; Miyazaki and Korenaga, 2019a), po- realistic for the formation of the solid mantle due to equi-
tentially causing partitioning of FeO into the BMO. Regard- librium crystallisation, the TMO and BMO would be signif-
less, any such exchange between the TMO, solid mantle, and icantly more FeO enriched initially if they were formed by
BMO could be a way to sequester trace elements (including fractional crystallisation (Solomatov and Stevenson, 1993a;
heat-producing elements) into the BMO, particularly if the Xie et al., 2020). In our models, the initial cumulate down-
TMO freezes faster than the BMO. wellings formed at the TMO–solid mantle boundary are de-
Once both oceans crystallise and 8± → ∞, convection in pleted in FeO and, hence, buoyant, resisting solid mantle
the solid mantle likely changes to higher degrees of con- convection and delaying compositional equilibration, but this
vection (as already seen with 8 = 102 and 103 in Fig. 4b effect would be strongly diminished (or even opposite) for a
and c), similar to present-day Earth mantle dynamics. Our more realistic initial condition. Conversely, the initially de-
models predict a largely homogeneous solid mantle, with pleted cumulate upwellings from the BMO–mantle bound-
some regions preserving significant primordial heterogene- ary in our models advance convection and equilibration. As
ity for long timescales. The preservation of heterogeneity these effects that depend on our choice of the initial condition
is likely to be enhanced once composition-dependent rhe- scale with buoyancy number, B, we choose a conservative
ology (i.e. a difference in intrinsic strength of mantle ma- value of B = 1.0 (see Sect. 2.1). Using higher values of B
terials) is considered (Manga, 1996; Ballmer et al., 2017a; (B ≈ 3) is expected to advance TMO–mantle equilibration
Gülcher et al., 2020). Indeed, primordial cumulates formed for fractional crystallisation of the solid mantle shell. Our
in the lower mantle may be strongly enriched in MgSiO3 models predict that such an equilibration can occur swiftly
bridgmanite (Boukaré et al., 2015) and, hence, intrinsically to avoid extreme enrichments of the TMO during progres-
strong (Yamazaki and Karato, 2001). In the present day, large sive crystallisation and, thus, to prevent a subsequent global-
low-shear-velocity provinces (LLSVPs) are perhaps the most scale overturn with deep-mantle stratification. In our set-
prominent and seismically evident large-scale mantle hetero- up, the impact of the value of B is fairly limited due to
geneities. That they are only rather mildly Fe-enriched (De- weak compositional contrasts. Indeed, Fig. 4 exhibits com-
schamps et al., 2012) points to rather efficient equilibration positional contrasts of at most 1XFeO S = 0.08. With B ≈ 3,
between the magma ocean(s) and much of the solid man- the buoyancy would still be dominated by the thermal term
tle during crystallisation, such as predicted by a subset of of order 1T = 1, rather than by compositional buoyancy
our models. For the Earth, the subset of our models with 8+ B1XFeO S ≈ 0.3. The value of B will only have a significant
smaller than ∼ 100 suggests that chemical (half-)equilibrium impact in the late stages of the crystallisation of the magma
between a solid mantle and a (100 to 1000 km thick) TMO
can be accomplished in less than ∼ 1 Myr, i.e. before the
Solid Earth, 12, 421–437, 2021 https://doi.org/10.5194/se-12-421-2021D. P. Bolrão et al.: Timescales of chemical equilibrium between the solid mantle and MOs 433 ocean, when fractional crystallisation leads to strong compo- However, more studies are needed to better constrain sitional contrasts. chemical equilibration timescales. This could be achieved, Smaller planets than Earth are less likely to be chemically for instance, as more realistic compositional models and equilibrated for a given bulk composition. First, they tend to phase diagrams are accounted for, and/or a moving bound- cool faster, as they contain a smaller total reservoir of heat ary approach is applied to explicitly model the evolution of and volatiles (i.e. stabilising a less massive atmosphere to one or both crystallisation fronts. shield cooling). Moreover, the Ra number is lower for small planets, such that equilibration is expected to take longer ac- cording to our results. Thus, the Martian mantle might be less equilibrated (more stratified) than that of Earth (Elkins- Tanton et al., 2003; Maurice et al., 2017). On the other hand, super-Earths are expected to be well equilibrated, particu- larly as BMOs are likely to be stabilised in their interiors due to high CMB pressures (Stixrude, 2014; Caracas et al., 2019) – this has a strong effect on equilibration timescales. Whether or not chemical equilibration during the magma ocean stage is efficient has important implications for the composition of the primary crust, the propensity of overturn, and related stabilisation of a deep dense layer, as well as the long-term evolution of terrestrial planets. 5 Conclusions In this work we use a numerical model to investigate the thermo-chemical evolution of the convecting solid mantle bounded at the top and/or bottom by magma oceans. We parameterise fractional crystallisation and melting processes of dynamic topography at one or both solid mantle bound- aries, and determine the timescales to reach chemical half- equilibrium between solid mantle and magma ocean(s). We show that these fractional crystallisation and dynamic melting processes at one or both boundaries play an impor- tant role in the chemical evolution of the solid mantle. Effi- cient transfer of FeO across the TMO–mantle and/or BMO– mantle boundary can prevent strong enrichment of the last- stage magma ocean and, therefore, any strong chemical strat- ification of the early fully solid mantle. Moreover, this ef- ficient transfer of FeO renders the timescales of chemical (half-)equilibration between the solid mantle and magma ocean(s) shorter than (or of the order of) 1 Myr. As magma ocean crystallisation occurs in few million years (Abe, 1997; Lebrun et al., 2013; Salvador et al., 2017; Nikolaou et al., 2019), our study suggests that chemical equilibrium between solid and liquid reservoirs can be reached before the end of magma ocean crystallisation. Therefore, a strong chemical stratification of the solid mantle is unlikely to occur, and the first crust is not expected to be extremely enriched in FeO. This prediction fundamentally contrasts with that of classi- cal models of fractional crystallisation of the magma ocean (e.g. Elkins-Tanton, 2012). https://doi.org/10.5194/se-12-421-2021 Solid Earth, 12, 421–437, 2021
You can also read