Congruent geographic variation in saccular otolith shape across multiple species of African cichlids - KOPS
←
→
Page content transcription
If your browser does not render page correctly, please read the page content below
www.nature.com/scientificreports
OPEN Congruent geographic variation
in saccular otolith shape
across multiple species of African
cichlids
Aneesh P. H. Bose1,2,3,4*, Holger Zimmermann1, Georg Winkler1, Alexandra Kaufmann1,
Thomas Strohmeier1, Stephan Koblmüller1 & Kristina M. Sefc1
The otoliths of teleost fishes exhibit a great deal of inter- and intra-species shape variation. The
ecomorphology of the saccular otolith is often studied by comparing its shape across species and
populations inhabiting a range of environments. However, formal tests are often lacking to examine
how closely variation in otolith shape follows the genetic drift of a neutral trait. Here, we examine
patterns of saccular otolith shape variation in four species of African cichlid fishes, each sampled
from three field sites. All four species showed the greatest level of otolith shape variation along
two principal component axes, one pertaining to otolith height and another to the prominence of
an anterior notch. Fish collected from the same site possessed similarities in saccular otolith shape
relative to fish from other sites, and these ‘site-difference’ signatures were consistent across species
and observable in both sexes. Sex-differences in saccular otolith shape differed in magnitude from
site to site. Population differences in saccular otolith shape did not covary with neutral genetic
differentiation between those populations. Otolith height, in particular, displayed large site
similarities across species, weak correlation with neutral genetic variation, and strong sex differences,
collectively suggesting that otolith shape represents a selectively non-neutral trait.
The otoliths of the inner ears of teleost fishes represent a powerful lens for studying many aspects of fish biol-
ogy including their ecology, neurobiology, bioacoustics, systematics, and fisheries stock a ssessments1–3. The
morphology of teleost otoliths, i.e. their size and shape, is of particular interest, especially with respect to the
saccular otolith. This is because the saccular otolith often displays high levels of morphological differentiation
between species, and also notable differentiation within species, making it an important tool for fish b iologists4.
Saccular otolith shape alone can aid in discriminating between fish species (e.g. Serranus spp.5; rockfish spp.6),
and also between stocks/populations, sexes, age-classes, and reproductive morphs (e.g. Atlantic cod, Gadus
morhua7; plainfin midshipman fish, Porichthys notatus8; flatfish spp.9; round goby, Neogobius melanostomus10).
Yet, the processes that give rise to such specific otolith shapes remain largely unknown, and represent a major
outstanding evolutionary question about the structure and function of teleost otoliths3.
Intraspecific shape variation in saccular otoliths can be affected by a multitude of factors, including develop-
mental, genetic, and environmental factors. While the saccular otoliths of young fish are often relatively simple
in form, they frequently take on more complex, species-specific shapes as the fish g row4,11. Otolith shape is also,
in part, genetically determined, as exemplified by Vignon and Morat12, who showed that coral reef snapper,
Lutjanus kasmira, that live and grow under the same environmental conditions can have differently shaped
saccular otoliths based on their genetic lineage (i.e. which population their ancestors historically belonged to).
Within-species otolith shape can also be affected by diet (reef fish spp., Amphiprion akindynos and Pomacentrus
amboinensis13) and rearing temperature (e.g. red drum, Sciaenops ocellatus14), illustrating the potential for local
biotic and abiotic conditions to affect otolith shape as well.
1
Institute of Biology, University of Graz, Universitätsplatz 2, 8010 Graz, Austria. 2Department of Collective
Behaviour, Max Planck Institute of Animal Behavior, Konstanz, Germany. 3Centre for the Advanced Study of
Collective Behaviour, University of Konstanz, Konstanz, Germany. 4Department of Biology, University of Konstanz,
Konstanz, Germany. *email: abose@ab.mpg.de Konstanzer Online-Publikations-System (KOPS)
URL: http://nbn-resolving.de/urn:nbn:de:bsz:352-2-eiqz4h2thtpg0
Scientific Reports | (2020) 10:12820 | https://doi.org/10.1038/s41598-020-69701-9 1
Vol.:(0123456789)
www.nature.com/scientificreports/
The complexity of saccular otoliths and their interspecific morphological differences insinuate a biological
meaning for otolith shape1,3,15. Otolith shape, in combination with other variables (including otolith mass, sulcus
acusticus dimensions, and endolymph v iscosity3), is expected to influence how otoliths oscillate within the end
organs of the inner ear, thereby potentially impacting hearing capabilities16–18. Otolith shape, particularly of the
saccular otolith, may therefore be one of many traits within the fish auditory system that collectively tune the
hearing capabilities of fish to better suit their acoustic environment through local a daptation1,3. When viewing the
immense variation, and intra-species consistency, in saccular otolith shape, it has often been assumed that otolith
shape is adaptive, moulded by selection and/or by environmentally-induced plasticity, to match the demands of
a particular habitat1,3. It may therefore be expected that different species that overlap in the same habitat, and use
similar bandwidths in the acoustic environment, will show similarities in their saccular otolith shapes due to the
common soundscape. By analogous reasoning, populations within a species that experience different environ-
ments (soundscapes) would be predicted to diverge in otolith shape. These expectations hold for phenotypically
plastic variation in otolith shape and also for genetically determined, and hence heritable and selectable, variation.
Alternatively, variation in otolith shape may sometimes not reflect any adaptive significance; that is, shape could
be selectively neutral with respect to the environment and the functioning of the e ar3. If selectively neutral, but
still genetically determined, differences in otolith shape between species and populations would be expected to
covary with divergence times, rates of gene flow, and population sizes; in other words, be driven by random drift.
Alternatively, if otolith shape were selectively neutral, and not genetically determined, then variation in otolith
shape would be expected to be random with respect to both soundscape and population structure.
Here, we examine patterns of saccular otolith shape variation in relation to field site differences and population
structure using several species of African cichlid fishes from Lake Tanganyika, East Africa. Lake Tanganyika cich-
lids offer a unique opportunity to study otolith morphology for two main reasons. Many species are comprised
of multiple distinct populations that live in close geographic proximity to one another, but are reproductively
isolated due to natural barriers. Such natural barriers can include stretches of open sand or deep-water basins,
which pose obstacles for small-bodied demersal species that are naturally found in rocky littoral habitats where
they establish territories and find shelter among crevasses. Degrees of isolation vary among species as some are
more stenotopic and more affected by habitat discontinuities than others19–22. Furthermore, lake water level
fluctuations over geological and evolutionary time scales have periodically altered the structure of the shoreline
and displaced coastal populations leading to historical alternations between geographic isolation and secondary
contact23. As a consequence, populations of littoral cichlids in Lake Tanganyika vary in their times since diver-
gence from one another according on how they were affected by lake level fluctuations24. Intra- and interspecific
variation in rates of gene flow and population divergence times among the cichlids of Lake Tanganyika therefore
present researchers with an excellent opportunity to compare natural replicate populations that vary along a
genetic differentiation gradient.
In this study, we investigated saccular otolith shape variation in four species of cichlids, Neolamprologus cau-
dopunctatus, Neolamprologus pulcher, Neolamprologus savoryi, and Variabilichromis moorii, from three distinct
field sites in the southern tip of Lake Tanganyika. In particular, we tested the ecomorphology hypothesis for sac-
cular otolith shape. That is, we examined whether otolith shape exhibits patterns consistent with it being attuned
to environmental variation. We first asked whether our study species showed saccular otolith shape similarities
based on which field site they were sampled from. That is, we asked “is there a group-level signature in otolith
shape that differs across field sites?” Next, we asked whether the differences that we observe in saccular otolith
shape between pairs of populations can be explained by the degree of neutral genetic differentiation between
those populations. If otolith shape varies in response to environmental conditions, i.e. is selectively non-neutral,
we expected to find that species share similar shape differences across sites, and that differences in otolith shape
between populations would be unrelated to neutral genetic differentiation. To this end, we analyze a large sample
of saccular otoliths, and control carefully for ontogenetic changes, and sex-differences, in shape.
Methods
Selection of field sites and study species. We selected three field sites along the southern tip of Lake
Tanganyika, Zambia (Fig. 1): Mutondwe Island (8° 42′ 29.4″ S 31° 07′ 18.0″ E), Kalambo Falls Lodge (8° 37′ 21.0″
S 31° 11′ 59.0″ E), and Katukula (8° 42′ 10.0″ S 30° 55′ 22.8″ E). All three sites are shallow-water, littoral, rocky
habitats interspersed with sandy substrata. The sites do, however, differ with respect to the angle of the sloping
shoreward incline (incline is shallow at Mutondwe Island, moderately steep at Katukula, and descends in steps
at Kalambo), and the assortment of rocks (small rocks predominate at Mutondwe Island and Katukula, but rock
size is larger and more variable at Kalambo). The Mutondwe Island site also represents a slightly more sheltered
location relative to the more exposed shorelines of Katukula and Kalambo. The diversity and community of cich-
lid fishes sustained at each of these sites also varies subtly between the sites25,26. Our three field sites are separated
from one another by heterogeneously structured habitat (e.g. the wide, sandy Mbete and Chituta Bays as well
as the open water between the island and the shore sites). These natural barriers reduce gene flow and impose
(some) reproductive isolation between the populations of demersal, rock-dwelling fish living there. In particu-
lar, previous population genetic and phylogeographic studies revealed that Mbete Bay persisted as a migration
barrier for various demersal cichlid species throughout late-glacial lake level fluctuations27 and induced distinct
genetic differentiation (in our study species19,20,28 and in other species21,29,30). In contrast, the bathymetric pro-
file of the Chituta Bay area suggests that this bay merged into a continuous steeply inclining shore when the
lake level dropped, which would make it permeable to connectivity among rock-dwelling cichlid populations.
Indeed, genetic divergence across Chituta Bay is generally less p ronounced24,31. Therefore, we expected the sam-
pled populations to represent two levels of genetic differentiation within each species (stronger across Mbete Bay
Scientific Reports | (2020) 10:12820 | https://doi.org/10.1038/s41598-020-69701-9 2
Vol:.(1234567890)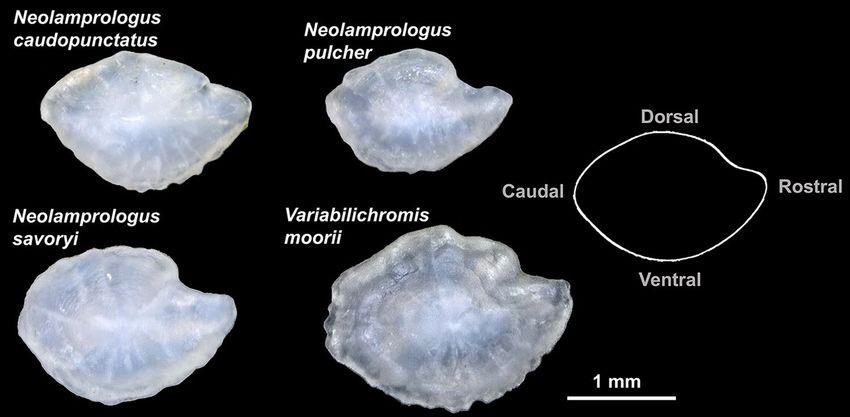
www.nature.com/scientificreports/
Figure 1. Field sites and study species. Top left: Map of the southern tip of Lake Tanganyika indicating the
locations of the three field sites (orange dots). Top right: A schematic of the relationships and divergence times
among the four study species (black lines) against a representation of the phylogenetic clades in the cichlid tribe
Lamprogini (red). Triangle sizes represent the number of species within each phylogenetic clade. The divergence
time estimates depicted in the diagram are from Irissari et al.78. Bottom: Photographs of the four study species
(photo credit: Wolfgang Gessl, https://www.pisces.at).
than across Chituta Bay). Additionally, levels of intraspecific population differentiation were expected to vary
among species contingent on species-specific sensitivity to barriers and degrees of philopatry.
We selected four species to compare across the field sites: N. caudopunctatus, N. pulcher, N. savoryi, and
V. moorii. These species were selected because they were particularly abundant at all locations and represent
a sample of species that shares many similarities in ecology and niche-space. For example, all four species are
small-bodied cichlids (typical standard lengths for breeding individuals are: 6.0 cm for N. pulcher32; 5.6 cm for
N. savoryi33; 6.4 cm for V. moorii34; and 4.5–6 cm N. caudopunctatus35). Their distributions are all geographi-
cally limited to rocky littoral zones, and their depth ranges overlap (N. pulcher: 4–20 m, N. savoryi: 4–20 m,
N. caudopunctatus: shallow—25 m36; V. moorii: 2–13 m34,37). Their diets are also similar, consisting of pelagic
zooplankton, though V. moorii also commonly grazes on a lgae36,37. None of the species are piscivorous ambush
or pursuit predators. All species are substrate breeders and prefer to live in groups that guard rocky territories
covering relatively small areas (territories typically span < 4 m232,36,38). Group sizes do, however, vary between the
species as V. moorii is socially monogamous (group size is two), while average group size for N. pulcher ranges
between seven32 and nine39. In N. savoryi, average group size is 1 433. N. caudopunctatus also breed in pairs, but is
considered colonial because they live at high d ensities35. N. pulcher has been documented to produce broadband
high-frequency sounds (average ~ 12 kHz40), but sound production has not been investigated in any of our other
species. None of our species have any documented swim-bladder specializations (e.g. the otophysan Weberian
ossicles) linking air-filled compartments to the inner ear.
Collection of specimens. Using SCUBA and snorkeling, we sampled the same four species from each of
our three field sites over two field seasons, between April 10–27 and September 19–October 6, 2018. In total,
we collected 603 fish (see Table 1 for sample size broken down by field site and species). The fish were caught by
hand using gill nets and were non-randomly selected by divers to cover a wide range of body sizes from both
sexes. The fish were brought back to Mpulungu, Zambia and either dissected immediately or housed in outdoor
holding tanks (~ 350 L) to be dissected within 10 days of initial capture. The fish were euthanized with an over-
dose of MS-222 (1 g/1 L lake water) and their sexes verified during dissections. Caudal fin clips were taken from
each individual and stored in 99.9% ethanol. The two saccular otoliths from each fish were extracted, wiped
clean, and stored dry (Fig. 2). Any otoliths that were vateritic (i.e. had distinctly crenulated margins) or were
chipped during the handling process were not used in this study.
Scientific Reports | (2020) 10:12820 | https://doi.org/10.1038/s41598-020-69701-9 3
Vol.:(0123456789)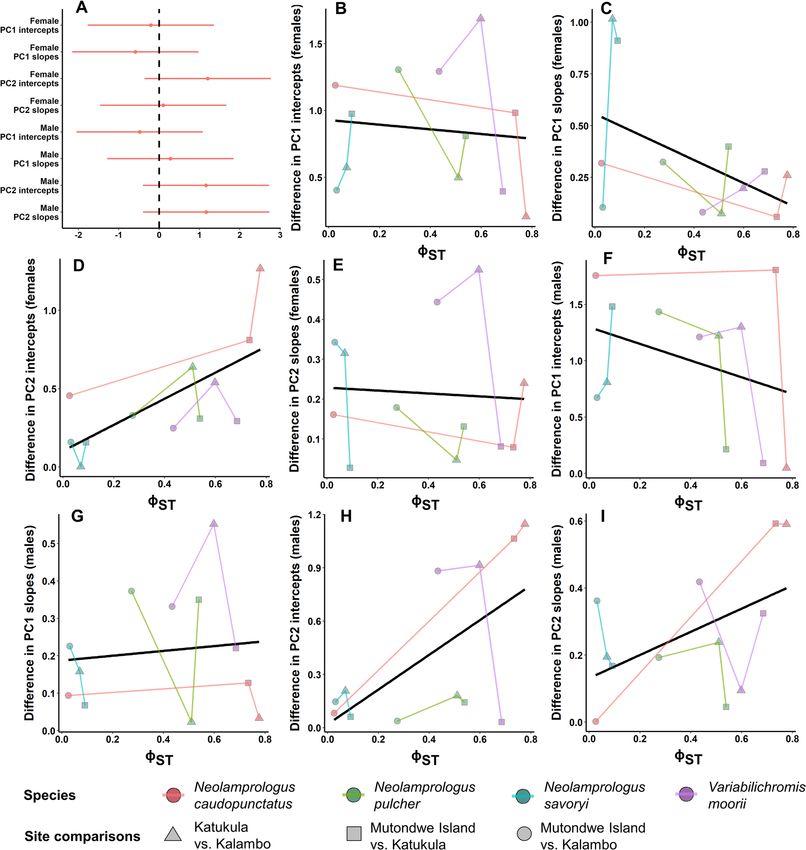
www.nature.com/scientificreports/
Species
Neolamprologus Neolamprologus Neolamprologus Variabilichromis
caudopunctatus pulcher savoryi moorii Total
Field site
NF = 41 (24) NF = 49 (26) NF = 40 (24) NF = 33 (19) NF = 163 (93)
Mutondwe Island
NM = 47 (25) NM = 41 (21) NM = 47 (29) NM = 91 (47) NM = 226 (122)
NF = 40 (20) NF = 52 (28) NF = 43 (22) NF = 43 (26) NF = 178 (96)
Kalambo
NM = 53 (29) NM = 54 (28) NM = 39 (22) NM = 46 (24) NM = 192 (103)
NF = 40 (23) NF = 39 (20) NF = 38 (19) NF = 27 (18) NF = 144 (80)
Katukula
NM = 45 (23) NM = 43 (25) NM = 64 (38) NM = 41 (23) NM = 193 (109)
NF = 121 (67) NF = 140 (74) NF = 121 (65) NF = 103 (63)
Total N = 1,096 (603)
NM = 145 (77) NM = 138 (74) NM = 150 (89) NM = 178 (94)
Table 1. Number of saccular otoliths used in this study split up by species, field site, and sex (female = F,
male = M). The number of individuals contributing those otoliths is given in parentheses.
Figure 2. Examples of saccular otoliths from the four cichlid species investigated. The otolith surface in contact
with the auditory sensory epithelium, i.e. the sulcus acusticus, is facing down. Outline on the right represents an
average otolith contour and depicts the orientation of the otoliths within the fish. Note that the otoliths shown
here are meant to represent variation across species not across field sites.
Ethical note. All four species are highly abundant at our field sites and are not considered endangered
(IUCN Red List, least concern for N. pulcher41, N. caudopunctatus42, N. savoryi43, and V. moorii [listed as N.
moorii]44). This work was carried out in accordance with relevant guidelines and regulations under a study
permit issued by the government of Zambia with permission from the Fisheries Department of Zambia and
with approval from the ethics committee of the University of Graz (permit number 39/50/63 ex 2018/19). Fish
euthanized in this study were also used in numerous additional research projects (e.g. Bose et al.34) including
studies of parental care, mating behaviours, and parasite load.
Saccular otolith shape quantification. Saccular otoliths from N. caudopunctatus, N. pulcher, N. savoryi,
and V. moorii were all digitally photographed using a Keyence VHX-5000 digital microscope at 30× magnifica-
tion (Fig. 2). Each otolith was placed with its sulcus acusticus facing downwards. As pairs of otoliths are approxi-
mate mirror images of one another, the photographs of each right saccular otolith were flipped horizontally,
such that all images were of otoliths in the ‘left’ configuration. Otolith surface area was measured using the VHX
Menu software associated with the Keyence VHX digital microscope.
For each species separately, we ran a Fourier power spectrum analysis to determine how many harmon-
ics would be necessary to explain at least 99.999% of the variation in each species’ average otolith shape. N.
caudopunctatus required 12 harmonics, N. pulcher and N. savoryi both required 11 harmonics, and V. moorii
required 10 harmonics. We then ran a separate elliptic Fourier shape analysis for each species using the shape
analysis software package SHAPE 1.345. These analyses were followed with a principal component analysis (PCA)
based on a variance–covariance matrix to reduce the shape variation within each species into a small number
of principal components (PCs) that would each describe a different aspect of otolith shape (for more details on
methodology and the use of elliptic Fourier shape analyses, see45,46). We then used a broken stick model and
Scientific Reports | (2020) 10:12820 | https://doi.org/10.1038/s41598-020-69701-9 4
Vol:.(1234567890)www.nature.com/scientificreports/
Figure 3. Scree plot illustrating how many principal components (filled squares) describe more variation
in Variabilichromis moorii saccular otolith shape than by chance alone (i.e., the broken stick model, unfilled
squares). The vertical dashed line represents the crossover between the data and the broken stick model. Otolith
contour reconstructions visually illustrate the shape variation captured by each PC. Contours under the Mean
column represent the average otolith shape for V. moorii. Contours on either side of the mean column illustrate
the effect that increasing or decreasing each PC by two standard deviations has on otolith shape. Contours
under the Overlay column allow for easier visualization of the shape variation captured by each PC.
scree plots47 to determine how many PCs per species explained more variation in otolith shape than would be
expected by chance alone.
For V. moorii, the first two PCs explained more variation than expected by chance (Fig. 3). For N. caudopunc-
tatus, N. savoryi, and N. pulcher the first three PCs explained significantly more variation in shape than expected
by chance. However, we focused on analyzing only the first two PCs for each species. Doing so allowed us to
include all species in our analyses, without having to sometimes omit V. moorii. In addition, the first two PCs
accounted for a large amount of shape variation (N. caudopunctatus, PC1: 43.5%, PC2: 14.4%; N. pulcher, PC1:
43.0%, PC2: 19.7%; N. savoryi, PC1: 41.4%, PC2: 17.9%; V. moorii, PC1: 51.5%, PC2: 17.2%), and these could
easily be visually distinguished from one another. In all species investigated, PC1 and PC2 described similar
axes of shape variation; PC1 described variation in otolith height (along the dorsal–ventral axis, see Fig. 3 and
Supplementary Figs. S1–S3), while PC2 described variation in how pronounced the anterior notch was (see
Fig. 3 and Supplementary Figs. S1–S3).
Testing for sex differences across field sites. Otolith shape is known to differ between the sexes in
certain species (e.g. silver hake Merluccius bilinearis48; plainfin midshipman, Porichthys notatus8), and so we first
tested for sex differences in otolith shape (PC1 and PC2 scores) and did this for each field site and each species
separately. We fit several linear mixed effects models, including PC as the response variable. Otolith surface area
(µm2, scaled) and sex were included as fixed predictor variables and their interaction was tested for, though we
dropped it from the models if non-significant. Because most fish contributed more than one otolith to our data-
set, we included fish ID in the models as a random intercept. This process resulted in 24 separate tests for sex dif-
ferences (two PCs, four species, three field sites), and so we implemented a conservative Bonferroni correction
to maintain a family-wise error rate of 0.05. Therefore, we set our α threshold to 0.002 here.
Supplementary Figs. S4–S7 illustrate sex differences broken down by field site and species. N. caudopunc-
tatus females had higher PC1 scores than males at Mutondwe Island (intercept: Est. ± SE = 0.036 ± 0.006,
t45.8 = 6.0, P < 0.0001). N. savoryi females had higher PC1 scores than males at Mutondwe Island (intercept:
Est. ± SE = 0.028 ± 0.005, t48.6 = 5.2, P < 0.0001). N. pulcher females had higher PC1 scores than males at Katukula
(intercept: Est. ± SE = 0.036 ± 0.006, t42.0 = 6.2, P < 0.0001). No other contrasts were significant at the α = 0.002
significance threshold. Because of the strong sex differences that we found for certain species at certain field
sites, we opted to analyze each sex separately in the coming analyses.
Do fish species show consistent site differences in saccular otolith shape? We tested whether,
across species, saccular otolith shape showed consistent differences between field sites. That is, we asked whether
otoliths sampled from certain sites had higher or lower PC scores compared to otoliths sampled from other sites,
and whether these differences were consistently expressed across species. To do this, we fit a linear mixed effects
model, for each sex separately, and included PC (either PC1 or PC2) as the response variable. Otolith surface
area (µm2, scaled within each species), species, and field site were included as fixed predictor variables and fish
Scientific Reports | (2020) 10:12820 | https://doi.org/10.1038/s41598-020-69701-9 5
Vol.:(0123456789)www.nature.com/scientificreports/
ID was again included as a random intercept. We included the interaction term between species and field site
in the model and then tested for pairwise marginal mean differences between each field site within each species
(using the ‘emmeans’ R package49).
Does saccular otolith shape variation covary with neutral genetic differentiation between
populations? Whole genomic DNA was extracted from the caudal fin clips taken in the field following
a rapid Chelex p rotocol50, and the most variable part of the mitochondrial control region was amplified and
sequenced according to the protocols described in24 and19. Sample sizes per population ranged from 24 to 33
(mean N = 29.6, Supplementary Table S1) and alignments comprised 357 bp (N. caudopunctatus), 392 bp (N.
savoryi), 407 bp (V. moorii) and 409 bp (N. pulcher). Our use of the mitochondrial control region as a marker
to estimate neutral population differentiation was guided by the following observations. First, mitochondrial
sequence diversity in vertebrates is generally in accordance with expectations for neutral evolution51,52. More
specifically, previous studies of Lake Tanganyika cichlids from the same geographic regions as investigated here,
which used the same part of the mitochondrial control region, found a good agreement between estimates of
neutral pairwise population differentiation and expectations based on paleohydrogeological data, habitat struc-
ture and degrees of stenotopy observed in the different s pecies20,21,24. Since habitat barriers and lake level fluctua-
tions are unlikely to have a sex-specific effect on gene flow between the sites investigated in this study, we expect
the maternally inherited mitochondrial markers to reflect overall population structure. This is supported by
agreement between mitochondrial and nuclear marker-based reconstructions of population structure in cichlid
species within the same geographic area, including in V. moorii, one of our focal species in this study19,24,29.
We used Arlequin 3.5.1.253 to calculate estimates of pairwise population differentiation based on uncorrected
genetic distances between haplotypes (ΦST54). Statistical significance was evaluated based on 1,023 permutations.
We used PopART55 to draw haplotype networks based on statistical parsimony56 (Supplementary Figs. S8–S11).
We chose ΦST over alternative estimators, because it integrates sequence divergence into an analysis of molecular
variance and is not biased by genetic d iversity57. In one population of N. savoryi (Kalambo), three haplotypes
(four samples) were very divergent from the remaining network (see Supplementary Fig. S10) and most likely
represent introgression from another Lamprologini species58. These putatively introgressed haplotypes were not
included in the ΦST calculations, as they would inflate the estimate of within-population sequence divergence.
Sequences are deposited in GenBank under accession numbers MT551233—MT551591.
We then tested whether the shape difference in saccular otoliths between pairs of populations varied accord-
ing to the neutral genetic differentiation between the same population pairs. In particular, we expected that if
otolith shape were genetically determined but selectively neutral, then there would be stronger shape differences
between populations as the neutral genetic differentiation between those populations increased. Because otolith
shape changes across ontogeny (i.e. changes as otoliths grow), we regressed otolith shape against otolith size and
then extracted two ‘difference measures’: (1) intercept differences and (2) slope differences between each pair of
populations (i.e. Mutondwe Island vs. Kalambo, Mutondwe Island vs. Katukula, and Kalambo vs. Katukula, see
below for details).
To obtain intercept and slope differences between each population pair, we fit a series of linear mixed effects
models. We ran separate models for each sex, species, and PC (two sexes, four species, two PCs = 16 models).
We included PC (scaled) as the response variable, and otolith surface area (µm2, scaled) and field site as fixed
predictor variables. Fish ID was included as a random intercept. We ran all of these models twice, once allowing
for the interaction between otolith surface area and field site (to extract estimates of slope differences), and again
omitting the interaction (this time to extract estimates of intercept differences).
We therefore obtained four ‘difference measures’ for each sex (eight in total) that described how divergent
otolith shape was between each pair of populations: (1) difference in PC1 intercepts, (2) difference in PC2 inter-
cepts, (3) differences in PC1 slopes, and (4) difference in PC2 slopes. To test whether these difference measures
varied with the neutral genetic differentiation between populations, we fit a multivariate Bayesian linear mixed
effects model (using the ‘blme’ R p ackage59). All eight difference measures were fit as response variables (scaled),
with neutral genetic differentiation, ΦST, as a continuous predictor variable. We included two nested random
effects: (1) allowing intercepts to vary within species and among difference measures within species, and (2)
allowing intercepts to vary within population pairs and among difference measures within population pairs.
Significance was estimated by calculating 95% confidence intervals for the effect size of genetic differentiation
for each difference measure and then assessing whether any of them excluded zero. These confidence intervals
were visualized using a coefficient plot that was built using the ‘dotwhisker’ R package60.
Results
Fish species show consistent site differences in saccular otolith shape. Saccular otolith height
(as captured by PC1) and the prominence of the anterior notch (as captured by PC2) increased with increas-
ing otolith size in both males and females across species (Table 2; Supplementary Table S2). Saccular otolith
height (PC1) differed between sites highly consistently: often in the same direction, for all species, and in both
sexes. However, this pattern was far less consistent for the otolith anterior notch (PC2) (Fig. 4; Supplementary
Table S2). See Supplementary Figs. S12 (for PC1) and S13 (for PC2) for partial residuals plots of these data split
by species.
Saccular otolith shape variation does not covary with neutral genetic differentiation between
populations. Population pairwise ΦST values ranged from 0.026 to 0.776 for N. caudopunctatus, 0.274–0.539
for N. pulcher, 0.031–0.091 for N. savoryi, and 0.434–0.685 for V. moorii and were significantly different from
zero except for the comparison between Kalambo and Mutondwe in N. caudopunctatus (Fig. 5, see Supple-
Scientific Reports | (2020) 10:12820 | https://doi.org/10.1038/s41598-020-69701-9 6
Vol:.(1234567890)www.nature.com/scientificreports/
Parameter Estimate Standard error t-value, df P
Model: Males, PC1 (otolith height)
Otolith surface area (scaled within species) 0.010 0.0014 7.32, 340.6 < 0.0001
Species: Neolamprologus caudopunctatus
Mutondwe vs. Kalambo − 0.050 0.0060 − 8.31, 320 < 0.0001
Mutondwe vs. Katukula − 0.050 0.0064 − 7.90, 318 < 0.0001
Kalambo vs. Katukula − 0.00055 0.0061 − 0.091, 319 0.99
Species: Neolamprologus pulcher
Mutondwe vs. Kalambo − 0.046 0.0062 − 7.31, 315 < 0.0001
Mutondwe vs. Katukula − 0.0073 0.0064 − 1.13, 320 0.49
Kalambo vs. Katukula 0.038 0.0060 6.38, 321 < 0.0001
Species: Neolamprologus savory
Mutondwe vs. Kalambo − 0.021 0.0062 − 3.41, 327 0.0021
Mutondwe vs. Katukula − 0.044 0.0055 − 7.96, 330 < 0.0001
Kalambo vs. Katukula − 0.023 0.0060 − 3.80, 326 0.0005
Species: Variabilichromis moorii
Mutondwe vs. Kalambo − 0.035 0.0056 − 6.23, 317 < 0.0001
Mutondwe vs. Katukula 0.0033 0.0055 0.60, 320 0.82
Kalambo vs. Katukula 0.038 0.0064 5.95, 320 < 0.0001
Random effects: Group Variance Standard deviation
Fish ID 0.0004227 0.02056
Residual 0.00008038 0.008966
Model: Females, PC1 (otolith height)
Otolith surface area (scaled within species) 0.010 0.0016 6.18, 266.6 < 0.0001
Species: Neolamprologus caudopunctatus
Mutondwe vs. Kalambo − 0.034 0.0069 − 4.86, 254 < 0.0001
Mutondwe vs. Katukula − 0.026 0.0067 − 3.85, 259 0.0004
Kalambo vs. Katukula 0.0078 0.0071 1.10, 254 0.51
Species: Neolamprologus pulcher
Mutondwe vs. Kalambo − 0.044 0.0062 − 7.16, 252 < 0.0001
Mutondwe vs. Katukula − 0.027 0.0068 − 4.04, 250 0.0002
Kalambo vs. Katukula 0.017 0.0067 2.56, 251 0.0297
Species: Neolamprologus savoryi
Mutondwe vs. Kalambo − 0.010 0.0068 − 1.50, 255 0.29
Mutondwe vs. Katukula − 0.027 0.0071 − 3.74, 254 0.0007
Kalambo vs. Katukula − 0.017 0.0073 − 2.25, 249 0.065
Species: Variabilichromis moorii
Mutondwe vs. Kalambo − 0.044 0.0069 − 6.30, 260 < 0.0001
Mutondwe vs. Katukula 0.013 0.0076 1.74, 264 0.19
Kalambo vs. Katukula 0.057 0.0071 8.02, 266 < 0.0001
Random effects: Group Variance Standard deviation
Fish ID 0.0004623 0.02150
Residual 0.00009917 0.009958
Table 2. Site comparisons. Results of marginal means contrasts from linear mixed effects models comparing
saccular otolith shape (as captured by PC1) between populations (Kalambo, Mutondwe, and Katukula) for
each species, while controlling for otolith size (measured by surface area). Male and female models were run
separately due to strong sex differences (see “Methods”). Significant results at α = 0.05 are shown in bold.
Multiple comparisons are accounted for using the Tukey method.
mentary Table S1 for pairwise population ΦST values). Population differences in saccular otolith shape did not
correlate significantly with neutral genetic differentiation, as quantified with ΦST; none of the 95% confidence
intervals for the effect size of ΦST calculated for any of the eight otolith shape ‘difference measures’ excluded zero
(Fig. 5A). While none of the difference measures showed statistically significant slopes across the range of popu-
lation ΦST values (Fig. 5B–I), one difference measure tended negatively (Fig. 5C) and three measures tended
positively (Fig. 5D,H,I), corroborated by a visual inspection of the coefficient plot (Fig. 5A).
Scientific Reports | (2020) 10:12820 | https://doi.org/10.1038/s41598-020-69701-9 7
Vol.:(0123456789)www.nature.com/scientificreports/
Figure 4. Site differences in saccular otolith shape as described by principal components (PC) 1 and 2. (A,C)
Show male shape data, while (B,D) show female shape data. Plots show partial residuals from linear mixed-
effects models (generated using ‘visreg’ package in R79). Note that otolith size was scaled (mean = 0, std. dev. = 1)
within each species for these analyses.
Discussion
Saccular otolith shape variation is often assumed to be adapted to the local environment. This has often been
studied via an ecomorphology approach, in which otolith morphology is compared across field sites and studied
in relation to different environmental factors. However, these studies often use either a single focal species sam-
pled from multiple sites, or multiple species each typically found in and sampled from separate, non-overlapping
sites or habitat types; in both cases, an axis of replication is lacking. A more powerful approach, as we have done
here, is to sample multiple sympatric species from multiple sites, and test for consistent between-site variation in
otolith shape. Furthermore, many studies lack a direct measure of neutral genetic differentiation between their
populations, precluding any formal test for whether saccular otolith shape variation is consistent with random
genetic drift. Our chosen set of species and populations are therefore suitable for studying whether otolith shape
responds to environmental variation or represents neutral morphological variation.
We detected clear site-differences in saccular otolith shape and many of these differences were qualitatively
consistent across species. For example, otoliths from our Kalambo field site were consistently and significantly
taller than otoliths from Mutondwe Island for all species and both sexes (with the exception of N. savoryi
females). Our four study species were sampled from populations that live in rocky littoral habitats. Deviations
in any number of a wide array of environmental variables could, in principle, underlie our site differences in
otolith shape; within-sites, our species should all have experienced similar depths, temperatures, food availability,
and water chemistry profiles (all variables that have been previously shown to be associated with otolith shape
variation, e.g.13,15,61–66), but these variables may have differed subtly between sites. Our results support an eco-
morphological perspective, suggesting that the local ecological conditions give rise to particular otolith s hapes3.
We cannot, however, disentangle whether our site-differences in saccular otolith shape are driven by genetic
evolution or phenotypic plasticity; a common-garden experiment in which offspring from different populations
are raised together under a standard environment would be needed to make this distinction. Overall, our results
indicate that multi-species communities of fish can possess unifying similarities in their saccular otolith shapes
due to geographic overlap. If the local soundscape imposes selection on the form and function of the fish auditory
system, then it could be expected that sympatric species, that occupy similar niche space and make similar use
of their surrounding soundscape, will express phenotypic similarities in auditory structures, including otoliths.
Site differences were primarily detected in saccular otolith height (i.e. PC1), and not in the anterior notch
(PC2), suggesting that otolith height may be, in-part, locally attuned to the soundscapes at our field sites, while
the anterior notch is not, or is to a lesser degree. There is increasing evidence from mathematical models18 and
experimental work67,68 that the shape of otoliths influences their patterns of movement relative to the sensory
Scientific Reports | (2020) 10:12820 | https://doi.org/10.1038/s41598-020-69701-9 8
Vol:.(1234567890)www.nature.com/scientificreports/
Figure 5. Comparisons of saccular otolith shape versus neutral genetic variation. (A) 95% confidence intervals
calculated for the effect size of the neutral genetic differentiation between populations (ΦST) on each saccular
otolith shape ‘difference measure’ (see “Methods” for details). (B–I) Linear mixed effects model regression
fits for each otolith shape difference measure, to help visualize the relationship between population genetic
differentiation and otolith shape.
epithelium within the inner ear end organs, with likely consequences for the auditory and vestibular systems.
How exactly otolith height and notching respectively affect otolith motion (along with other common axes of
otolith shape variation) would be a fruitful avenue for future research.
Differences between our populations in saccular otolith shape did not correlate significantly with their level
of neutral genetic differentiation. We had predicted that if saccular otolith shape variation were heritable and
selectively neutral, then we would detect a positive correlation between our shape ‘difference measures’ and
ΦST. While it can be difficult to argue for any inference based solely on the absence of a statistically significant
relationship, our shape versus ΦST comparisons are consistent with our other results, which show strong site-
differences in shape across species suggestive of locally-adapted saccular otolith forms. In fact, we found the
weakest evidence for consistent site differences in the anterior notch (i.e. PC2), which also displayed notable
positive trends between three of its four shape difference measures and ΦST (Fig. 5D,H,I). Taken together, this
suggests that saccular otolith height requires more fine-tuning to environmental conditions than does the anterior
notch. A biological significance for saccular otolith shape has previously been alluded to by studies showing that
shape differences between populations can increase in magnitude with increasing geographic s eparation69–73,
though it is rare for the relationship between otolith shape and neutral genetic variation to be directly considered.
In our study, the lack of any statistically clear correlations between our otolith shape ‘difference measures’ and
Scientific Reports | (2020) 10:12820 | https://doi.org/10.1038/s41598-020-69701-9 9
Vol.:(0123456789)www.nature.com/scientificreports/
neutral genetic differentiation (i.e. mitochondrial control region), implies that factors, such as adaptation to local
acoustic environments, play a larger role than random drift in determining otolith shape.
Patterns of genetic differentiation estimated from a mitochondrial sequence marker may fail to reflect the
evolutionary history of populations, if mitochondrial genomes evolve under the influence of selection or sex-
biased gene flow, or experience very idiosyncratic d rift74. For meaningful comparisons between otolith shape
differences and genetic differentiation estimates in our study, it is important that the variation in ΦST values
between pairs of populations reflects the variable degrees of differentiation between those population pairs (i.e.,
ΦST values should be relatively lower between populations that diverged recently or are connected by higher rates
of gene flow, and ΦST values should be relatively higher between populations that have been strictly isolated for
longer). The fact that the differentiation estimates in our analysis showed the expected patterns (based on habitat
structure and paleohydrological conditions; see “Methods”, Selection of field sites and study species) suggests that
this was achieved by our sequence dataset. As predicted, pairwise ΦST values in all four species were highest in
comparisons across Mbete Bay, which is a stronger and more persistent barrier to gene flow for rock-dwelling
cichlids than Chituta B ay24,25. Furthermore, species differences in the estimated differentiation levels are con-
sistent with species-specific traits related to the evolution of neutral population structure (as summarized in
Konings36). For instance, in the strongly stenotopic rock-dwelling V. moorii, the ΦST value between Mutondwe
and Kalambo was almost as high as the ΦST values across Mbete Bay, whereas we detected no significant differ-
entiation between Mutondwe and Kalambo in the ecologically more versatile N. caudopunctatus. In N. pulcher,
differences in the gill-cover markings between populations imply restricted gene flow, as confirmed by the high
ΦST values. Finally, N. savoryi expand into greater depths than the other species, which may facilitate connectivity
among populations irrespective of shoreline heterogeneity and explain their low differentiation and high genetic
diversity (Supplementary Fig. S10).
We found strong sex differences in saccular otolith shape for certain species at particular sites. Although
the sex differences were not necessarily limited to one species or one population, they were mostly detected for
otolith height (PC1). Interestingly, when sex differences were detected, females possessed taller saccular oto-
liths than males (Supplementary Figs. S4–S7). Saccular otolith height was also the aspect of shape that differed
most strongly between sites, supporting the idea that otolith height, more so than the anterior notch, imparts a
functional consequence for the fish auditory (and perhaps vestibular) system. It is currently unclear why such
pronounced site-specific sex differences might exist. When sex differences in otolith shape have been uncovered
in the past (e.g. Atlantic cod, G. morhua7,75; flatfish spp.9; plainfin midshipman, P. notatus8; Neobythites gilli76),
a common explanation is that the sexes likely differ with respect to their somatic growth rates and metabolic
rates. Growth rates, energy storage, and metabolism have rarely been explicitly compared between the sexes in
our study species, but when they have, males and females have scored similarly (e.g. N. pulcher77). An interest-
ing avenue for future research will be to investigate whether vocal communication occurs in our species (sound
production by N. pulcher has been d ocumented40), whether the vocal and/or auditory capabilities differ between
the sexes, and how any such sex effects are associated with further (neuro)anatomical differences. Our observa-
tions show that sex differences in saccular otolith shape can be found on a seemingly case-by-case basis. We
therefore emphasize the importance of accounting for sex whenever possible, and we highlight the dangers of
sampling from a single population and then generalizing conclusions to other populations or to the whole species.
In summary, we found that multiple fish species can display similarities in saccular otolith shape dependent
on the field site that they were collected from. Furthermore, the substantial shape differences that we found
did not correlate significantly with our measures of neutral genetic differentiation between the populations. In
particular, we point to the apparent importance of otolith height, as this was the aspect of saccular otolith shape
that differed most dramatically between sites, showed the weakest correlation to neutral genetic differentia-
tion, and also showed prominent sex differences. Our data are therefore consistent with the ecomorphology
hypothesis for saccular otolith shape, implying that otolith shape constitutes non-neutral variation in response
to local environments.
Data availability
All analyses in this paper can be reproduced using the data uploaded to Dryad (https://doi.org/10.5061/dryad
.mgqnk98wz).
Received: 31 March 2020; Accepted: 10 July 2020
References
1. Popper, A. N., Ramcharitar, J. & Campana, S. E. Why otoliths? Insights from inner ear physiology and fisheries biology. Mar.
Freshw. Res. 56, 497–504. https://doi.org/10.1071/MF04267 (2005).
2. Starrs, D., Ebner, B. C. & Fulton, C. J. All in the ears: Unlocking the early life history biology and spatial ecology of fishes. Biol.
Rev. 91, 86–105. https://doi.org/10.1111/brv.12162 (2016).
3. Schulz-Mirbach, T., Ladich, F., Plath, M. & Heß, M. Enigmatic ear stones: what we know about the functional role and evolution
of fish otoliths. Biol. Rev. https://doi.org/10.1111/brv.12463 (2018).
4. Campana, S. E. Photographic Atlas of Fish Otoliths of the Northwest Atlantic Ocean. Canadian Special Publication of Fisheries and
Aquatic Sciences Vol. 133 (NRC Research Press, Ottawa, 2004).
5. Tuset, V. M., Lombarte, A., González, J. A., Pertusa, J. F. & Lorente, M. J. Comparative morphology of the sagittal otolith in Serranus
spp. J. Fish Biol. 63, 1491–1504. https://doi.org/10.1111/j.1095-8649.2003.00262.x (2003).
6. Tuset, V. M. et al. Otolith patterns of rockfishes from the northeastern pacific. J. Morphol. 276, 458–469. https://doi.org/10.1002/
jmor.20353(2015).
7. Campana, S. E. & Casselman, J. M. Stock discrimination using otolith shape analysis. Can. J. Fish. Aquat. Sci. 50, 1062–1083. https
://doi.org/10.1139/f93-123 (1993).
Scientific Reports | (2020) 10:12820 | https://doi.org/10.1038/s41598-020-69701-9 10
Vol:.(1234567890)www.nature.com/scientificreports/
8. Bose, A. P. H., Adragna, J. B. & Balshine, S. Otolith morphology varies between populations, sexes and male alternative reproduc-
tive tactics in a vocal toadfish Porichthys notatus. J. Fish Biol. https://doi.org/10.1111/jfb.13187 (2016).
9. Mille, T., Mahe, K., Villanueva, M. C., De Pontual, H. & Ernande, B. Sagittal otolith morphogenesis asymmetry in marine fishes.
J. Fish Biol. 87, 646–663. https://doi.org/10.1111/jfb.12746 (2015).
10. Bose, A. P. H., Mccallum, E. S., Raymond, K., Marentette, J. R. & Balshine, S. Growth and otolith morphology vary with alternative
reproductive tactics and contaminant exposure in the round goby Neogobius melanostomus. J. Fish Biol. 93, 674–684. https://doi.
org/10.1111/jfb.13756(2018).
11. Lombarte, A. & Castellón, A. Interspecific and intraspecific otolith variability in the genus Merluccius as determined by image
analysis. Can. J. Zool. 69, 2442–2449. https://doi.org/10.1139/z91-343 (1991).
12. Vignon, M. & Morat, F. Environmental and genetic determinant of otolith shape revealed by a non-indigenous tropical fish. Mar.
Ecol. Prog. Ser. 411, 231–241. https://doi.org/10.3354/meps08651 (2010).
13. Gagliano, M. & McCormick, M. I. Feeding history influences otolith shape in tropical fish. Mar. Ecol. Prog. Ser. 278, 291–296. https
://doi.org/10.3354/meps278291 (2004).
14. Hoff, G. R. & Fuiman, L. A. Morphometry and composition of red drum otoliths: Changes associated with temperature, somatic
growth rate, and age. Comp. Biochem. Physiol. 106, 209–219. https://doi.org/10.1016/0300-9629(93)90502-U (1993).
15. Tuset, V. M. et al. Otolith shape lends support to the sensory drive hypothesis in rockfishes. J. Evol. Biol. 29, 2083–2097. https://
doi.org/10.1111/jeb.12932(2016).
16. Gauldie, R. W. Function, form and time-keeping properties of fish otoliths. Comp. Biochem. Physiol. 91, 395–402 (1988).
17. Popper, A. N., Fay, R. R., Platt, C. & Sand, O. Sound detection mechanisms and capabilities of teleost fishes. In Sensory Processing
in Aquatic Environments (eds Collin, S. P. & Marshall, N. J.) 3–38 (Springer-Verlag, New York, 2003).
18. Krysl, P., Hawkins, A. D., Schilt, C. & Cranford, T. W. Angular oscillation of solid scatterers in response to progressive planar
acoustic waves: Do fish otoliths rock?. PLoS ONE https://doi.org/10.1371/journal.pone.0042591 (2012).
19. Duftner, N. et al. Distinct population structure in a phenotypically homogeneous rock-dwelling cichlid fish from Lake Tanganyika.
Mol. Ecol. 15, 2381–2395. https://doi.org/10.1111/j.1365-294X.2006.02949.x (2006).
20. Koblmüller, S., Sefc, K. M., Duftner, N., Warum, M. & Sturmbauer, C. Genetic population structure as indirect measure of dispersal
ability in a Lake Tanganyika cichlid. Genetica 130, 121–131. https://doi.org/10.1007/s10709-006-0027-0 (2007).
21. Sefc, K. M., Baric, S., Salzburger, W. & Sturmbauer, C. Species-specific population structure in rock-specialized sympatric cichlid
species in Lake Tanganyika. East Afr. J. Mol. Evol. 64, 33–49. https://doi.org/10.1007/s00239-006-0011-4 (2007).
22. Wagner, C. E. & McCune, A. R. Contrasting patterns of spatial genetic structure in sympatric rock-dwelling cichlid fishes. Evolution
63, 1312–1326. https://doi.org/10.1111/j.1558-5646.2009.00612.x (2009).
23. Sefc, K. M. et al. Shifting barriers and phenotypic diversification by hybridisation. Ecol. Lett. 20, 651–662. https://doi.org/10.1111/
ele.12766(2017).
24. Koblmüller, S. et al. Separated by sand, fused by dropping water: Habitat barriers and fluctuating water levels steer the evolution of
rock-dwelling cichlid populations in Lake Tanganyika. Mol. Ecol. 20, 2272–2290. https://doi.org/10.1111/j.1365-294X.2011.05088
.x (2011).
25. Kohda, M. et al. Geographical colour variation in cichlid fishes at the southern end of Lake Tanganyika. Environ. Biol. Fishes 45,
237–248. https://doi.org/10.1007/BF00003091 (1996).
26. Widmer, L. et al. Point-Combination Transect (PCT): Incorporation of small underwater cameras to study fish communities.
Methods Ecol. Evol. 10, 891–901. https://doi.org/10.1111/2041-210X.13163 (2019).
27. McGlue, M. M. et al. Seismic records of late Pleistocene aridity in Lake Tanganyika, tropical East Africa. J. Paleolimnol. 40, 635–653.
https://doi.org/10.1007/s10933-007-9187-x (2008).
28. Duftner, N. et al. Parallel evolution of facial stripe patterns in the Neolamprologus brichardi/pulcher species complex endemic to
Lake Tanganyika. Mol. Phylogenet. Evol. 45, 706–715. https://doi.org/10.1016/j.ympev.2007.08.001 (2007).
29. Sefc, K. M., Mattersdorfer, K., Hermann, C. M. & Koblmüller, S. Past lake shore dynamics explain present pattern of unidirectional
introgression across a habitat barrier. Hydrobiologia 791, 69–82. https://doi.org/10.1007/s10750-016-2791-x (2017).
30. Winkelmann, K., Rüber, L. & Genner, M. J. Lake level fluctuations and divergence of cichlid fish ecomorphs in Lake Tanganyika.
Hydrobiologia 791, 21–34. https://doi.org/10.1007/s10750-016-2839-y (2017).
31. Koblmüller, S. et al. Phylogeny and phylogeography of Altolamprologus: Ancient introgression and recent divergence in a rock-
dwelling Lake Tanganyika cichlid genus. Hydrobiologia 791, 35–50. https://doi.org/10.1007/s10750-016-2896-2 (2017).
32. Balshine, S. et al. Correlates of group size in a cooperatively breeding cichlid fish (Neolamprologus pulcher). Behav. Ecol. Sociobiol.
50, 134–140. https://doi.org/10.1007/s002650100343 (2001).
33. Heg, D., Bachar, Z. & Taborsky, M. Cooperative breeding and group structure in the Lake Tanganyika cichlid Neolamprologus
savoryi. Ethology 111, 1017–1043. https://doi.org/10.1111/j.1439-0310.2005.01135.x (2005).
34. Bose, A. P. H., Zimmermann, H., Henshaw, J. M., Fritzsche, K. & Sefc, K. M. Brood—tending males in a biparental fish suffer high
paternity losses but rarely cuckold. Mol. Ecol. 27, 4309–4321. https://doi.org/10.1111/mec.14857 (2018).
35. Schaedelin, F. C., Van Dongen, W. F. D. & Wagner, R. H. Mate choice and genetic monogamy in a biparental, colonial fish. Behav.
Ecol. 26, 782–788. https://doi.org/10.1093/beheco/arv011 (2015).
36. Konings, A. Tanganyika Cichlids in Their Natural Habitat 4th edn. (Hollywood Import & Export Inc., Gainesville, 2019).
37. Ota, K., Hori, M. & Kohda, M. Testes investment along a vertical depth gradient in an herbivorous fish. Ethology 118, 683–693.
https://doi.org/10.1111/j.1439-0310.2012.02056.x (2012).
38. Sturmbauer, C. et al. Abundance, distribution, and territory areas of rock-dwelling Lake Tanganyika cichlid fish species. Hydro-
biologia 615, 57–68. https://doi.org/10.1007/978-1-4020-9582-5_5 (2008).
39. Heg, D., Brouwer, L., Bachar, Z. & Taborsky, M. Large group size yields group stability in the cooperatively breeding cichlid
Neolamprologus pulcher. Behaviour 1, 1–27. https://doi.org/10.1163/156853905774831891 (2005).
40. Spinks, R. K., Muschick, M., Salzburger, W. & Gante, H. F. Singing above the chorus: Cooperative Princess cichlid fish (Neolam-
prologus pulcher) has high pitch. Hydrobiologia 791, 115–125. https://doi.org/10.1007/s10750-016-2921-5 (2016).
41. Bigirimana, C. Neolamprologus pulcher. The IUCN Red List of Threatened Species 2006: e.T60604A12382292. https://doi.
org/10.2305/IUCN.UK.2006.RLTS.T60604A12382292.en (2006). Accessed 8 March 2020.
42. Bigirimana, C. Neolamprologus caudopunctatus. The IUCN Red List of Threatened Species 2006: e.T60591A12373751. https://doi.
org/10.2305/IUCN.UK.2006.RLTS.T60591A12373751.en (2006). Accessed 8 March 2020.
43. Bigirimana, C. Neolamprologus savoryi. The IUCN Red List of Threatened Species 2006: e.T60605A12382585. https://doi.
org/10.2305/IUCN.UK.2006.RLTS.T60605A12382585.en (2006). Accessed 8 March 2020.
44. Bigirimana, C. Neolamprologus moorii. The IUCN Red List of Threatened Species 2006: e.T60613A12384127. https://doi.
org/10.2305/IUCN.UK.2006.RLTS.T60613A12384127.en (2006). Accessed 8 March 2020.
45. Iwata, H. & Ukai, Y. SHAPE: A computer program package for quantitative evaluation of biological shapes based on elliptic Fourier
descriptors. J. Hered. 93, 384–385. https://doi.org/10.1093/jhered/93.5.384 (2002).
46. Crampton, J. S. Elliptic Fourier shape analysis of fossil bivalves: Some practical considerations. Lethaia 28, 179–186. https://doi.
org/10.1111/j.1502-3931.1995.tb01611.x (1995).
47. Jackson, D. A. Stopping rules in principal component analysis: A comparison of heuristical and statistical approaches. Ecology 74,
2204–2214. https://doi.org/10.2307/1939574 (1993).
Scientific Reports | (2020) 10:12820 | https://doi.org/10.1038/s41598-020-69701-9 11
Vol.:(0123456789)www.nature.com/scientificreports/
48. Bolles, K. L. & Begg, G. A. Distinction between silver hake (Merluccius bilinearis) stocks in US waters of the northwest Atlantic
based on whole otolith morphometrics. Fish. Bull. 98, 451–462 (2000).
49. Lenth, R. emmeans: Estimated marginal means, aka least-squares means. R package version 1.4.4. https://CRAN.R-project.org/
package=emmeans (2020).
50. Richlen, M. L. & Barber, P. H. A technique for the rapid extraction of microalgal DNA from single live and preserved cells. Mol.
Ecol. Notes 5, 688–691. https://doi.org/10.1111/j.1471-8286.2005.01032.x (2005).
51. McCusker, M. R. & Bentzen, P. Positive relationships between genetic diversity and abundance in fishes. Mol. Ecol. 19, 4852–4862.
https://doi.org/10.1111/j.1365-294X.2010.04822.x (2010).
52. Karl, S. A., Toonen, R. J., Grant, W. S. & Bowen, B. W. Common misconceptions in molecular ecology: Echoes of the modern
synthesis. Mol. Ecol. 21, 4171–4189. https://doi.org/10.1111/j.1365-294X.2012.05576.x (2012).
53. Excoffier, L., Laval, G. & Schneider, S. Arlequin (version 3.0): An integrated software package for population genetics data analysis.
Evol. Bioinform. Online 1, 47–50. https://doi.org/10.1177/117693430500100003 (2005).
54. Excoffier, L., Smouse, P. E. & Quattro, J. M. Analysis of molecular variance inferred from metric distances among DNA haplotypes:
Application to human mitochondrial DNA restriction data. Genetics 131, 497–591 (1992).
55. Leigh, J. W. & Bryant, D. POPART: Full-feature software for haplotype network construction. Methods Ecol. Evol. 6, 1110–1116.
https://doi.org/10.1111/2041-210X.12410 (2015).
56. Templeton, A. R., Crandall, K. A. & Sing, C. F. A cladistic analysis of phenotypic associations with haplotypes inferred from restric-
tion endonuclease mapping and DNA sequence data. III. Cladogram estimation. Genetics 132, 619–633 (1992).
57. Sefc, K. M., Payne, R. B. & Sorenson, M. D. Genetic differentiation after founder events: An evaluation of FST estimators with
empirical and simulated data. Evol. Ecol. Res. 9, 21–39 (2007).
58. Sturmbauer, C., Salzburger, W., Duftner, N., Schelly, R. & Koblmüller, S. Evolutionary history of the Lake Tanganyika cichlid tribe
Lamprologini (Teleostei: Perciformes) derived from mitochondrial and nuclear DNA data. Mol. Phylogenet. Evol. 57, 266–284
(2010).
59. Chung, Y., Rabe-Hesketh, S., Dorie, V., Gelman, A. & Liu, J. A nondegenerate penalized likelihood estimator for variance parameters
in multilevel models. Psychometrika 78, 685–709. https://doi.org/10.1007/s11336-013-9328-2 (2013).
60. Solt, F. & Hu, Y. dotwhisker: Dot-and-whisker plots of regression results. R package version 0.5.0. https://CRAN.R-project.org/
package=dotwhisker (2018).
61. Wilson, R. R. Jr. Depth-related changes in sagitta morphology in six Macrourid fishes of the Pacific and Atlantic Oceans. Copeia
4, 1011–1017. https://doi.org/10.2307/1445256 (1985).
62. Lombarte, A. & Lleonart, J. Otolith size changes related with body growth, habitat depth and temperature. Environ. Biol. Fishes
37, 297–306. https://doi.org/10.1007/BF00004637 (1993).
63. Mérigot, B., Letourneur, Y. & Lecomte-Finiger, R. Characterization of local populations of the common sole Solea solea (Pisces,
Soleidae) in the NW Mediterranean through otolith morphometrics and shape analysis. Mar. Biol. 151, 997–1008. https://doi.
org/10.1007/s00227-006-0549-0 (2007).
64. Hüssy, K. Otolith shape in juvenile cod (Gadus morhua): Ontogenetic and environmental effects. J. Exp. Mar. Bio. Ecol. 364, 35–41.
https://doi.org/10.1016/j.jembe.2008.06.026 (2008).
65. Volpedo, A. V. & Fuchs, D. V. Ecomorphological patterns of the lapilli of Paranoplatense Siluriforms (South America). Fish. Res.
102, 160–165. https://doi.org/10.1016/j.fishres.2009.11.007 (2010).
66. Vignon, M. Disentangling and quantifying sources of otolith shape variation across multiple scales using a new hierarchical
partitioning approach. Mar. Ecol. Prog. Ser. 534, 163–177. https://doi.org/10.3354/meps11376 (2015).
67. Sand, O. & Michelsen, A. Vibration measurements of the perch saccular otolith. J. Comp. Physiol. A 123, 85–89. https://doi.
org/10.1007/BF00657346 (1978).
68. Schulz-Mirbach, T. et al. In-situ visualization of sound-induced otolith motion using hard X-ray phase contrast imaging. Sci. Rep.
8, 1–12. https://doi.org/10.1038/s41598-018-21367-0 (2018).
69. Castonguay, M., Simard, P. & Gagnon, P. Usefulness of Fourier analysis of otolith shape for Atlantic mackerel (Scomber scombrus)
stock discrimination. Can. J. Biochem. Physiol. 48, 296–302. https://doi.org/10.1139/f91-041 (1991).
70. Friedland, K. D. & Reddin, D. G. Use of otolith morphology in stock discriminations of Atlantic salmon (Salmo salar). Can. J. Fish.
Aquat. Sci. 51, 91–98. https://doi.org/10.1139/f94-011 (1994).
71. Turan, C. Otolith shape and meristic analysis of herring (Clupea harengus) in the North-East Atlantic. Arch. Fish. Mar. Res. 48,
283–295 (2000).
72. Reichenbacher, B., Feulner, G. R. & Schulz-Mirbach, T. Geographic variation in otolith morphology among freshwater populations
of Aphanius dispar (Teleostei, Cyprinodontiformes) from the southeastern Arabian Peninsula. J. Morphol. 484, 469–484. https://
doi.org/10.1002/jmor.10702(2009).
73. Libungan, L. A., Slotte, A., Huseb, Å & Godiksen, J. A. Latitudinal gradient in otolith shape among local populations of Atlantic
herring (Clupea harengus L.) in Norway. PLoS ONE 10, e0130847. https://doi.org/10.1371/journal.pone.0130847 (2015).
74. Hedrick, P. W. Sex: Differences in mutation, recombination, selection, gene flow, and genetic drift. Evolution 61, 2750–2771. https
://doi.org/10.1111/j.1558-5646.2007.00250.x (2007).
75. Cardinale, M., Doering-Arjes, P., Kastowsky, M. & Mosegaard, H. Effects of sex, stock, and environment on the shape of known-
age Atlantic cod (Gadus morhua) otoliths. Can. J. Fish. Aquat. Sci. 61, 158–167. https://doi.org/10.1139/f03-151 (2004).
76. Parmentier, E., Boistel, R., Bahri, M. A., Plenevaux, A. & Schwarzhans, W. Sexual dimorphism in the sonic system and otolith
morphology of Neobythites gilli (Ophidiiformes). J. Morphol. 4, 1–7. https://doi.org/10.1111/jzo.12561 (2018).
77. Sopinka, N. M. et al. Liver size reveals social status in the African cichlid Neolamprologus pulcher. J. Fish Biol. 75, 1–16. https://
doi.org/10.1111/j.1095-8649.2009.02234.x (2009).
78. Irisarri, I. et al. Phylogenomics uncovers early hybridization and adaptive loci shaping the radiation of Lake Tanganyika cichlid
fishes. Nat. Commun. 9, 1–12. https://doi.org/10.1038/s41467-018-05479-9 (2018).
79. Breheny, P. & Burchett, W. Visualization of regression models using visreg. R. J. 9, 56–71 (2017).
Acknowledgements
We thank the Department of Fisheries in Mpulungu for kindly facilitating our research at Lake Tanganyika. We
are also very grateful to B. Mbao, our boat driver, and to the staff at Nkupi Lodge, Mpulungu, for supporting our
field research, and we thank Jacqueline Grimm for assistance with the DNA lab work. This work was supported
by the Austrian Science Fund (FWF, Grant number P 27605-B25 to KMS) and by the University of Graz.
Author contributions
A.B. and K.S. conceived of and designed the experiment with input from H.Z. and S.K. A.B., H.Z., and S.K.
conducted the field work. H.Z., G.W., A.K., T.S. conducted the genetic lab work. S.K. and K.S. conducted the
genetic differentiation analyses. A.B. conducted the shape and statistical analyses. A.B. wrote the manuscript
with input from all co-authors.
Scientific Reports | (2020) 10:12820 | https://doi.org/10.1038/s41598-020-69701-9 12
Vol:.(1234567890)You can also read