Repeated surveying over 6 years reveals that fine scale habitat variables are key to tropical mountain ant assemblage composition and functional ...
←
→
Page content transcription
If your browser does not render page correctly, please read the page content below
www.nature.com/scientificreports
OPEN Repeated surveying over 6 years
reveals that fine‑scale habitat
variables are key to tropical
mountain ant assemblage
composition and functional
diversity
Mulalo M. Muluvhahothe1, Grant S. Joseph1,2*, Colleen L. Seymour2,3,
Thinandavha C. Munyai4 & Stefan H. Foord1
High-altitude-adapted ectotherms can escape competition from dominant species by tolerating low
temperatures at cooler elevations, but climate change is eroding such advantages. Studies evaluating
broad-scale impacts of global change for high-altitude organisms often overlook the mitigating role
of biotic factors. Yet, at fine spatial-scales, vegetation-associated microclimates provide refuges
from climatic extremes. Using one of the largest standardised data sets collected to date, we tested
how ant species composition and functional diversity (i.e., the range and value of species traits found
within assemblages) respond to large-scale abiotic factors (altitude, aspect), and fine-scale factors
(vegetation, soil structure) along an elevational gradient in tropical Africa. Altitude emerged as the
principal factor explaining species composition. Analysis of nestedness and turnover components
of beta diversity indicated that ant assemblages are specific to each elevation, so species are not
filtered out but replaced with new species as elevation increases. Similarity of assemblages over time
(assessed using beta decay) did not change significantly at low and mid elevations but declined at
the highest elevations. Assemblages also differed between northern and southern mountain aspects,
although at highest elevations, composition was restricted to a set of species found on both aspects.
Functional diversity was not explained by large scale variables like elevation, but by factors associated
with elevation that operate at fine scales (i.e., temperature and habitat structure). Our findings
highlight the significance of fine-scale variables in predicting organisms’ responses to changing
temperature, offering management possibilities that might dilute climate change impacts, and
caution when predicting assemblage responses using climate models, alone.
The signature of climate change is now apparent in changes in species’ distributions, as species move in response
to warming. For example, the median altitudinal range change is 11 m upwards per decade1. Mountain-dwelling
assemblages often include many endemics adapted to narrow niches, isolated in a landscape matrix that limits
dispersal2–4. These assemblages are particularly susceptible to climate change, as high-altitude zones should
arming5. Upslope migration of organisms into smaller a reas6, when habitat allows,
experience faster rates of w
increases interspecific competition and reduces population sizes7. Aspect is also influential, as equator-facing
slopes experience greater radiation and higher temperatures than slopes facing away from the e quator8. These
1
SARChI‑Chair On Biodiversity Value and Change, Department of Zoology and Centre for Invasion Biology,
School of Mathematical and Natural Science, University of Venda, Private Bag X5050, Thohoyandou 0950, South
Africa. 2DST/NRF Centre of Excellence, Percy FitzPatrick Institute of African Ornithology, Department of Biological
Sciences, University of Cape Town, Rondebosch 7701, South Africa. 3South African National Biodiversity Institute,
Kirstenbosch Research Centre, Private Bag X7, Claremont 7735, South Africa. 4School of Life Science, College
of Agriculture, Engineering and Science, University of KwaZulu-Natal, Private Bag X01, Scottsville 3209, South
Africa. *email: karoogrant@gmail.com
Scientific Reports | (2021) 11:56 | https://doi.org/10.1038/s41598-020-80077-8 1
Vol.:(0123456789)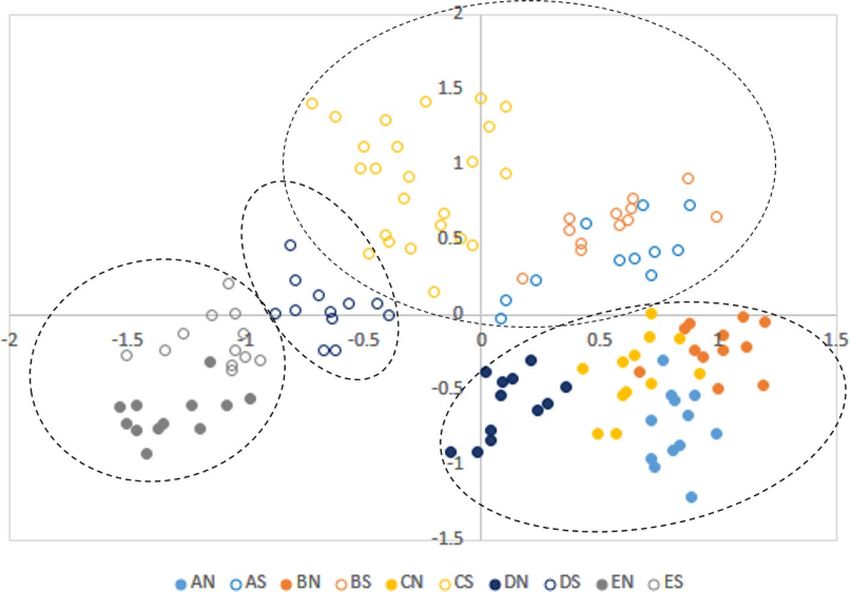
www.nature.com/scientificreports/
differences in abiotic conditions are reflected in the structure and composition of vegetation on the different
mountain aspects, and in species’ distributions and behaviour on mountain s lopes9. For example, the red ant
Myrmica sabuleti is primarily limited to south-facing slopes in the United Kingdom, where temperatures are
sufficiently warm10. Shifts in temperature regimes associated with climate change should affect ectotherms, in
particular, as they have fewer physiological adaptations for coping with temperature changes than e ndotherms11.
Ants (Hymenoptera: Formicidae) are abundant and found on most c ontinents12. Their community composi-
tion and role in ecosystem functioning can effect considerable changes in ecosystem structure and f unction13–16.
They are considered thermophilic (i.e., heat-loving)17, and ant species richness can decrease with altitude (along
with decreasing temperature), or exhibit mid-elevational peaks18,20. Cool temperatures should limit ant species’
distributional ranges3, with some species occupying areas only because they can tolerate lower temperatures than
more dominant s pecies19,20. Displacement with climate change of cold-adapted species by those that can tolerate
warmer temperatures has now been found in two Aphaenogaster ant species in the Appalachian M ountains21.
Different temperature tolerances imply that ant species assemblages should change with increasing elevation
to either a subset of species that can tolerate low temperatures, or to a distinct assemblage found only at higher
elevation sites, and ant assemblages on the pole-facing aspect of mountains could be similar to those found at
higher elevations on the equator-facing side. Alternatively, if ants are more influenced by habitat structure, which
may differ between the two aspects, ant assemblages should differ significantly between the two mountain aspects.
Microclimates, for example, those created by topography22, vegetation15,23 or soils24, can modify temperature
extremes, buffering against climate change. Microclimates may allow species with different thermal tolerances
to coexist, increasing diversity25. Thus, any consideration of effects of altitude on species assemblages should
include not only the larger-scale measures of altitude and aspect, but also finer scale measures of vegetation and
soils, which can also influence ant assemblages26. Furthermore, factors like vegetation cover are amenable to
management interventions, allowing for some adaptation to climate c hange27,28.
In the Soutpansberg, in tropical north-eastern South Africa, the impact of aspect is considerable: cli-
mate differs markedly between the north and southern aspects, owing to the mountain’s East–North–East to
West–South–West orientation, resulting in arid slopes on the northern aspect characterised by open dry savanna,
and thicket or forest on the mesic southern aspect, with herbaceous habitats at the highest elevations18,29. The
region is vulnerable to global change, currently experiencing reduced summer rainfall, elevated surface tem-
peratures, and widespread, more frequent d roughts23,30. Recent models reveal contraction of species’ ranges at
higher elevation from montane regions in two southern African countries4. In our study site, ants show a decrease
in species diversity with increasing altitude18, and at higher altitude sites, diversity over time seems to be more
variable31. Here, we assess whether ant species composition across elevational gradients changes owing to species
turnover or species loss, by assessing the relative contribution of these two components to beta diversity over
6 years. We expect total beta diversity for mountain slopes to increase with increasing elevation, and perhaps
also with time. Ants have been found to display patterns of species turnover with change in e levation32,33, so we
expect the species turnover component to represent most beta diversity, with little contribution from species
nestedness. We also evaluate whether ant assemblages at different elevations and aspects of the Soutpansberg
mountain vary with altitude and/or aspect as well as fine-scale vegetation measures.
Given that species assemblage composition influences the traits of species present and thus the functions
they perform, we also investigate patterns in functional diversity with different elevations, vegetation, soil struc-
ture and aspect. Functional diversity (FD) is the range and value of species traits present within a community,
which influences how those species contribute to ecological f unction34. Thus FD reflects ecosystem pattern and
process35. With global change, there is growing interest in how FD varies across environmental gradients33,36,37.
Given that heating could be associated with changes to species composition and the number of species, particu-
larly at a ltitude31, patterns of FD with altitude and aspect may give insights into whether and how the role of ants
in ecosystem functioning might change, or whether species are merely replaced by functional analogues along
abiotic or biotic gradients. At environmental extremes, resources are increasingly limited, which can amplify
environmental filtering38,39. Such filtering can select for functionally-unique traits which enable species to cope
with extreme conditions, with only species possessing the necessary traits persisting. A pattern of increasingly-
nested subsets of available functional strategies with rising altitude has recently been found for ants e lsewhere33,
so we might expect lower FD at higher altitudes.
Most studies are carried out over relatively short time periods, delivering only snapshots of pattern and
process. Here, we collected data biannually for six consecutive years, producing one of the largest standardised,
spatio-temporal invertebrate assemblage datasets assembled to date. We asked (i) whether ant assemblages at
high altitude are subsets of those found at lower altitudes, or whether they are a different set of species, and
whether there is evidence of change in beta diversity over the relatively short period of 6 years; (ii) whether ant
assemblages respond primarily to abiotic factors like temperature and solar radiation, or primarily to habitat
structure, or whether both abiotic and biotic factors influence species composition; and (iii) whether FD displays
patterns with elevation, aspect and/or habitat structure.
Materials and methods
Study site. Ants were sampled in the Soutpansberg Mountains, Vhembe Biosphere Reserve, a recognised
southern African centre of endemism40. We sampled 11 sites spaced between 160 to 290 m apart (Electronic
Supplementary Material Fig. 1) across an elevational transect (beginning at 23° 02′ 16.91ʺ S, 29° 26′ 34.22ʺ E)
running north to south, starting at 800 m above sea level (a.s.l.) on the southern aspect, ascending to 1700 m
a.s.l., before descending to 800 m a.s.l. on the northern aspect. Erosion-resistant quartzite, conglomerate, sand-
stone, shale rocks, and basalt characterise the transect41, which has wet summers, dry winters and mean annual
precipitation of about 450 mm42.
Scientific Reports | (2021) 11:56 | https://doi.org/10.1038/s41598-020-80077-8 2
Vol:.(1234567890)www.nature.com/scientificreports/
Morphological trait Continuous measures of traits (mm) Hypothesized functional significance
Mandible length From the mandibular apex to the anterior clypeal margin Indicative of diet; longer mandibles allow predation of larger prey76
Clypeus length Maximum length of the clypeus Well-developed clypeus relates to liquid feeding behaviour77
Head width Maximum width of the head across the eyes Size of spaces through which ant can pass78; mandibular musculature79
Eye length Maximum diameter of the compound eye Indicates feeding behaviour, predatory ants have proportionately larger eyes80
Scape length Maximum straight-line length of the scape Related to perception; scape size correlates to simplified e nvironments80
Diagonal length of the mesosoma in profile from the point at which the
Indicative of body size54, correlates to habitat complexity and metabolic
Weber’s length pronotum meets the cervical shield to the posterior basal angle of the
function44. Larger ants tend to be predatory81
metapleuron
Related to increased foraging speed in simple habitats, smaller leg length
Hind femur length Maximum length of the hind femur
allows exploitation of complex habitats82
Table 1. Ant morphological traits that were measured and used to assess functional diversity of ant
assemblages, and their functional significance.
Ant sampling. Epigaeic ants were sampled each January (wet season) and September (dry season) from
2009 to 2015, at the 11 sites. Each site housed four replicates, spaced 300 horizontal metres apart to avoid
pseudo-replication43. Each replicate contained ten pitfall traps (ø 62 mm), 10 m apart, in a grid of two parallel
lines (2 × 5). Traps containing a 50% solution of propylene glycol were left open for 5 days in each survey. Ants
from traps were then collected and identified to species level where possible, otherwise to genus and then mor-
phospecies. Specimens are lodged in the University of Venda Natural History Collection housed in the Chair on
Biodiversity Value and Change.
Vegetation structure sampling. Horizontal habitat (vegetation) structure was quantified using a 1 m2
grid placed over each pitfall trap, and percentage area of bare ground, vegetation, rock and leaf litter was calcu-
lated. To quantify vertical habitat structure, we used four rods (1.5 m high) counting the number of vegetation
contacts recorded along 25 cm intervals of the rod (0–25 cm, 25–50 cm, 50–75 cm, 75–100 cm, 100–125 cm,
125–150 cm, 150 + cm). These four rods were placed 1.5 m away from the pitfall trap, in a straight line originating
at the pitfall trap and passing through each corner of the 1 m2 grid. To summarize vertical and horizontal habitat
structure, we performed a Principal Component Analysis (PCA) on the vegetation measures we had gathered
for vegetation structure, to produce two main axes for horizontal (i.e., pch1 and pch2) and vertical (pcv1 and
pcv2) vegetation structure.
Soil sampling. In January 2010, ten soil samples were taken from each replicate using a soil auger, 7.5 cm
in diameter and 10–15 cm deep. The ten samples were mixed, dried, and analysed by BemLab (Pty) Ltd labora-
tories, South Africa for composition (clay, sand, rock and silt), pH, conductivity, C, K, Na, Ca, Mg, P, and N
O3.
We then summarised soil characteristics using a PCA, for which the two main axes were pcsoil1 and pcsoil2.
Temperature measurement. Within two replicates at each site, one Thermocron iButton (Semiconduc-
tor Corporation, Dallas/Maxin TX and USA), buried 1 cm below the soil recorded temperature at hourly inter-
vals for the entire period of sampling. These readings were used to generate maximum ( Tmax), mean (Tmean) and
minimum (Tmin) temperature readings for each site and sampling period.
Functional traits. We measured seven morphological traits (Table 1) relating to resource use by a nts44,45
using a ZEISS Discovery V12 Modular Stereo Microscope with Motorized 12 × Zoom Module and Zeiss Appli-
cation Suite V3.024, calibrated using a stage micrometer (Jena, Germany). A minimum of five individuals were
measured for each species. Only minor workers were measured. There may be microclimatic variation in species’
sizes, so we aimed to measure specimens from each elevation. For most species, this was not possible, however,
as they did not occur across the altitudinal range, or there were too few specimens to assess intraspecific size
variation.
Data analysis. Sampling sufficiency. We compiled sample-based rarefaction curves for ants for each alti-
tude at each aspect using the nonparametric Incidence Coverage Estimator (ICE) and Michaelis–Menten rich-
ness estimate to determine adequacy of sampling, in the programme EstimateS46. Sampling was deemed ad-
equate when values converged at the highest values (Electronic Supplementary Material Table 1).
Ant assemblage beta diversity. We assessed whether ant assemblages at high altitudes were subsets of those
found at lower altitudes, or whether they comprised completely different species, and whether there was a signal
of change in ant species composition over the 6 years of the study, using nestedness and turnover components
of beta diversity47. βsor gives the total variation in composition between assemblages, and is the sum of variation
owing to nestedness (βsne) and species turnover (βsim). We first assessed the components of beta diversity on data
from traps combined from all years, per site, and then also on sites only on the north and south aspects, using
the package “betapart”48 on presence-absence data. Then, using presence-absence data for the different dates of
sampling, we plotted a dendrogram to allow visualisation of the different plots at different times, clustering using
group averaging. This dataset allowed us to assess decay in similarity between assemblages, by fitting a negative
Scientific Reports | (2021) 11:56 | https://doi.org/10.1038/s41598-020-80077-8 3
Vol.:(0123456789)www.nature.com/scientificreports/
exponential function to increasing assemblage dissimilarity over spatial (i.e., altitude within aspect) and tem-
poral (i.e., total days from the first day of sampling) distances. To assess temporal changes in beta diversity, we
allocated sites to one of three categories (low: < 1000 m a.s.l., medium: 1000 – 1400 m a.s.l, and high: > 1400 m).
Ant assemblage composition. We pooled assemblage data for traps within an elevational band and aspect,
but kept these separate for sampling season and year. These multivariate abundance data formed the response
variable for generalised linear models (GLM), testing for differences in assemblage composition with altitude,
aspect, season and interactions between them, as well as measures of habitat (i.e., horizontal and vertical veg-
etation and soil structure, minimum, maximum and mean temperatures). We assessed these using the R pack-
age “mvabund”49 with the functions “manyglm” and “anova.manyglm”, using a negative binomial distribution
with log-link. This approach accounts for confounding mean–variance relationships, which are common in
abundance data containing many z eros50. Likelihood ratio statistics are summed for each species, yielding a
community-level measure for each altitude and aspect category, and the PIT-residual bootstrap method51 derives
p-values by resampling 999 rows of the dataset. Models were checked for departure from model assumptions
by visually examining plots of Dunn-Smyth residuals against fitted values to identify any non-random patterns.
We also performed an unconstrained ordination, using the package “boral” in R52, modelling species abundance
data using a negative binomial distribution and plotting the relationships between sites in two dimensions. To
help visualise these assemblages, we allocated sites to one of five altitudinal bands, each spanning 180 m. These
were: A = 810–990 m; B = 991–1170 m; C = 1171–1350 m; D = 1351–1530 m; E = 1531 m–1710 m; and north (N)
and south (S) aspect categories. Thus AS indicates traps within the elevational band of 810 – 990 m a.s.l. on the
southern slope, and CN indicates traps between 1171 and 1350 m on the northern aspect.
Functional diversity across an altitudinal gradient. We used FD as measured by Petchey and Gaston53. Trait
data were standardized to ensure biological variation within each trait was treated equally (each trait thus had a
mean of zero and a standard deviation of one). We gave Weber’s length a double weighting as it reflects not only
habitat complexity and metabolic function, but is indicative of body size (key in thermoregulation44,54). We used
Gower distance to convert the species by trait matrix to a distance matrix, and clustered the matrix using the
“average” method55, which produced the highest cophenetic correlation (0.87) between estimated and original
distances arising from the dendrogram. Thus, each species was given a measure of similarity with every other
species, based on the functional traits used. Adding a species to an assemblage increases the likelihood of adding
new traits, so FD tends to increase with species richness56. To account for this, simulation models were adopted,
comparing observed FDs against a null distribution of FD values. This allows calculation of standardised effect
size (sesFD), which corrects for increases in FD with added species, providing a reliable measure of degree of
functional differentiation within assemblages (sesFD). We calculated sesFD using the analogous ses.pd function
in the R package “picante”57. For a site with n species, the simulation models randomly select n species from the
total pool without replacement, and formulate an expected FD for that group of species. We used the independ-
ent swap method, in which species number was maintained within each sample, but the number of sites in which
each species occurred was kept constant, so that species were only included in simulations proportional to their
occurrence in the dataset. We ran models 999 times, creating a distribution of 1000 values for each observed
value. The mean of this distribution was then subtracted from the observed FD value and divided by the stand-
ard deviation of the null distribution, to provide sesFD. Thus sesFD reflects the number of standard deviations
in which the observed community is above or below the mean (0) of the simulated communities from the null
model58.
To assess how sesFD changed with environmental variables, we used a general linear mixed model, with
sesFD as the dependent variable, and altitude, aspect, vegetation (represented by pch1, pch2, pcv1 and pcv2),
soils (pcsoil1 and pcsoil2), temperature (TMax, Tmean and T
Min), and interactions between altitude and aspect, as
explanatory variables, with site as a random intercept variable, using the package n lme59 in R statistical pro-
gramme version 3.0. We included an interaction between altitude and aspect because a lower altitude on the
south side could have the same sesFD as a higher altitude on the north side, owing to the effects of aspect on
temperature. We used the “dredge” function in M uMIn60 to find the best models by specifying that only explana-
tory variables correlated with Pearson correlation < 0.5 could be included in any single model, and identified
the best models as those within two units of that with the lowest AICc, and thus have substantial support of
being the best m odels61. We then used model averaging on these models. We calculated variance explained by
fixed (marginal R 2), and fixed and random effects (conditional R 2, 62) for the best and worst models included in
the model averaging, and report on both of these. We checked for constant error variance by plotting residuals
against fixed values, and quantile–quantile plots to assess normality of errors for these models.
Results
A total of 102,496 ants representing 35 genera and 122 species were caught in pitfall traps over 6 years of sam-
pling. Of these, 102 species had five or more individuals, and provided reliable, standardised trait data for use in
FD analysis. Few species were present in sufficient abundance across sites along the elevational gradient to allow
specification of a size per altitude. Furthermore, interspecific variation was greater than intraspecific variation,
so we used mean measures for ants across all sites as traits.
Vegetation structure. For horizontal habitat structure, the first axis (pch1) captured 41%, the second
(pch2) 30% of the variation, whilst for vertical habitat structure, these two axes captured 37% (pcv1) and 24%
(pcv2) of variation. The first principal component axis for horizontal habitat structure (pch1) correlated posi-
tively with bare ground and negatively with vegetation cover. The second (pch2) correlated positively with leaf
Scientific Reports | (2021) 11:56 | https://doi.org/10.1038/s41598-020-80077-8 4
Vol:.(1234567890)www.nature.com/scientificreports/
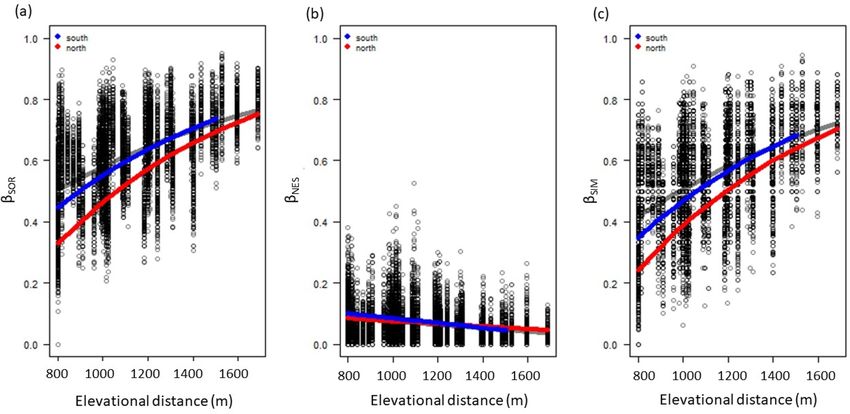
Figure 1. The relationship between ant species (a) total beta diversity, βsor; comprised of its (b) nestedness-
resultant component, βnes, and (c) turnover component, βsim for the Soutpansberg, South Africa. The red and
blue lines represent the mixed model predictions for north and south aspects, based on data for all years, with
each data point representing a comparison between the lowest elevation sites (810 m) and subsequent higher
elevations.
litter cover and negatively with rock cover (Electronic Supplementary Material Fig. 2a). For vertical habitat
structure, pcv1 increased with vertical structure, particularly at levels between 50 and 125 cm. The second axis,
pcv2, correlated positively with canopy cover above 100 cm in height, but negatively with cover below 75 cm
(Electronic Supplementary Material Fig. 2b).
Soil characteristics. The PCA for soils explained 61% of the variation, the first axis explaining 46%, the
second, 15%. The first principal component axis (pcsoil1) was positively correlated with acidic soil and nega-
tively with basic soils. The second principal component axis (pcsoil2) was positively correlated with sites that had
sandy soil and negatively with clay (Electronic Supplementary Material Fig. 3).
Beta diversity of ant assemblage composition: nestedness or turnover. Beta diversity was pri-
marily driven by species turnover. For north and south sites together, total beta diversity was 0.682, the com-
ponent explained by nestedness was only 6.1% (0.042), with turnover explaining the remaining 93.9% (0.641).
When only sites on the northern aspect were compared, total beta diversity was 0.510, the nestedness component
was 0.069 (13.5%), the remaining 86.5% (0.441) was species turnover. On the southern aspect, total beta diver-
sity was similar to that of the northern aspect, at 0.500; the nestedness component was lower as a proportion
than for the northern aspect, however, at 0.043 (8.7%) and turnover was 91.3% (0.453).
Beta-decay models show increasing total beta diversity, βsor with elevation, although the rate of increase
slowed with increasing elevation (Fig. 1a). The trend of increasing βsor over space was statistically significant
(βslope = 0.00084, n = 8645, pseudo r2 = 0.26, p = 0.01). The component of beta diversity owing to nestedness
declined (Fig. 1b), whilst that associated with turnover increased (Fig. 1c), with altitude.
A comparison of beta decay over time found no significant patterns for low (p = 0.78) or medium (p = 0.61)
altitude ant communities over the 6 years of our study, but there was a significant signal of change in beta diversity
over time for high altitude sites, although the explanatory power was low (βslope = 5.4 × 10⁻⁵, n = 1127, pseudo
r2 = 0.01, p = 0.01, Electronic supplementary Fig. 4).
Ant assemblages relative to aspect and known altitudinal thresholds. Ant assemblages tended
to be distinct between the two aspects, and altitude and the first component of horizontal vegetation structure
was also significant (global test statistic = 57.8, resid. df = 123; p < 0.001; Table 2, Fig. 2). Cluster analysis of βsor
(Electronic Supplementary Material Fig. 5) shows that communities stayed within their altitudinal ranges over
time. At lower elevations (i.e., < 1530 m), ant assemblages were distinct between aspects, with assemblages found
on the northern aspect quite different to those found on the south. Within those aspect groups, species composi-
tion also varied with elevation, but more markedly on the southern aspect, particularly for species above 1170 m
(Fig. 2). At the highest elevations, however, aspect no longer delineated a difference between ant assemblages,
with high altitude assemblages being significantly different from those at lower altitudes on either aspect (Fig. 2).
Functional diversity (sesFD) across an altitudinal gradient. The best models explaining functional
differentiation amongst ant species across the altitudinal gradient over the 6 years of our study did not include
altitude, but included aspect and other factors associated with fine-scale habitat measures, such as horizontal
Scientific Reports | (2021) 11:56 | https://doi.org/10.1038/s41598-020-80077-8 5
Vol.:(0123456789)www.nature.com/scientificreports/
Residual degrees of freedom Df.diff Deviance p
Intercept 107
Altitude 106 1 1198.8 0.001
Aspect 105 1 606.8 0.002
Pch1 104 1 374.7 0.001
Table 2. Results of mvabund generalised linear model for pitfall traps grouped by altitude, aspect and
sampling date.
Figure 2. Ordination representing ant species assemblages relative to altitude (Categories: A = 810–990 m;
B = 991–1170 m; C = 1171–1350 m; D = 1351–1530 m; E = 1531 m–1710 m) and aspect (N northern, S southern).
Dashed groupings represent assemblages similar at 30% or more.
Intercept Aspect Mean T Min T pch1 pcv2 Season pcsoil2 df logLik AICc Δ AICc weight
Model 1 − 1.90 + 0.08 − 22.8 − 20.4 7 − 94.0 201.5 0.00 0.29
Model 2 − 1.62 + 0.06 − 25.9 − 16.4 + 8 − 94.2 202.0 0.52 0.23
Model 3 − 0.88 + 0.06 − 24.7 6 − 98.6 202.1 0.59 0.22
Model 4 − 0.74 + 0.05 − 23.7 − 8.6 7 − 94.9 202.8 1.29 0.15
Model 5 − 0.87 + 0.06 − 25.4 0.45 7 − 97.9 203.5 1.98 0.11
Table 3. Best general linear mixed models used in model averaging, explaining variation in functional
differentiation of ant species across an altitude gradient, over the 6 years of this study within 2 AICc of the best
model. Weight is a measure of the relative probability that that particular model is the best of the candidate
models reported.
and vertical vegetation structure, mean or minimum temperature. One model included season, and another
included a measure of soil (Table 3). The best model obtained from model averaging found that sesFD was sig-
nificantly lower on the southern aspect relative to the north, and was higher with increasing mean and minimum
temperatures; however, the microclimate provided by vegetation in this setting also appears to be key: functional
differentiation decreased with pch1 and pcv2, in other words, functional diversity increased with higher vegeta-
tion cover in the lower stratum and decreased when vegetation structure at higher strata became more complex.
sesFD also increased with soil sandiness. The best-averaged model was:
sesFD = −1.32 −0.37 South + 0.07 Mean temp − 24.4 pch1 − 16.3 pcv2 + 0.18 summer + 0.06 MinT + 0.45 pcsoil2
Scientific Reports | (2021) 11:56 | https://doi.org/10.1038/s41598-020-80077-8 6
Vol:.(1234567890)www.nature.com/scientificreports/
Figure 3. The relationship between sesFD and (a) altitude (not significant) and (b) aspect (significantly lower
on the southern aspect, p < 0.05).
For the best model, fixed effects explained 39.8% of the variation, random effects (i.e., site) explained almost
no extra variation. The worst model of those within 2 AICc of the best explained 38.6% of the variation, again,
random effect explained almost no additional variation. A plot of aspect and altitude shows the variation in sesFD
with altitude (not significant) and aspect (significantly lower on the southern aspect; Fig. 3).
Discussion
Species composition change with altitude was driven primarily by species turnover, with a low contribution
from nestedness. Thus each elevation has its own unique set of species, with the higher elevations, in particular,
having unique sets of species. In addition to ant assemblages varying with both altitude and aspect, horizontal
vegetation cover also influenced species composition (Table 2). We observed that the primary driver of species
assemblages is altitude, which may be unsurprising, given that ectothermic species are more vulnerable to tem-
perature fluctuations than endotherms, and species found at higher elevations occur in naturally isolated altitu-
dinal niches4,63. Elsewhere, ant species occurring at higher altitudes have been found to occur at those elevations
because they can tolerate cold temperatures better than more dominant species found at lower elevations either
through physiology or b ehaviour3,21. Further assessment of the ability of ant species in this study to withstand
temperature extremes would help to confirm or refute these findings, particularly if lower-altitude species are
particularly cryophobic. Climate warming might pose a threat to these high elevation species, which could be
outcompeted by species from lower elevations.
The highest sites on both sides of the mountain clustered together in the ordination, distinct from those at
lower elevations on either side of the mountain. In the ordination, ant assemblages at middle and lower eleva-
tion sites also showed some separation according to altitude, but within their aspects (Fig. 2; Table 2). Habitat
structure differed considerably between the two aspects at all altitudes except at the highest sites, where the
vegetation structure was similar between north- and south-facing slopes. That the highest sites clustered together
could also be partly explained by proximity: sites at the top of the mountain were closer to each other than those
lower down, resulting in less dispersal limitation.
Partitioning of beta diversity suggests that the species found at these higher elevations are distinct from those
lower down, and not a subset of lower elevation assemblages. This is of particular concern within the context
of global climate change as this subset of species could go extinct. This is further emphasized by the decrease in
nestedness with elevational distance, highlighting the uniqueness of these higher elevation sites. Over the 6 year
period, assemblages do not seem to have changed, except perhaps those at higher elevations. Six years is a rela-
tively short period over which to observe changes in species assemblages, and this explains the low explanatory
power of time (r2 = 0.01). Nevertheless, this trend was significant and raises flags for the importance of monitoring
high (and low) altitude assemblages over the long term.
Patterns of functional diversity across an altitudinal gradient. Interestingly, although species com-
position was well explained by altitude, the functional diversity of those species was not. This suggests that as
species composition changes with altitude, the functional traits represented amongst these species responds to
other environmental factors, in this case, primarily habitat structure, along with temperature and soils.
Overall trends in FD across ecological gradients are beginning to emerge in the literature, although patterns
vary33,36,39,64. For ant assemblages at altitude, our models found that FD (measured as sesFD; Fig. 3, Table 3)
Scientific Reports | (2021) 11:56 | https://doi.org/10.1038/s41598-020-80077-8 7
Vol.:(0123456789)www.nature.com/scientificreports/
was lower on the southern aspect, but did not show a clear pattern with altitude. FD did vary with mean and
minimum temperature, which vary with altitude, but also with habitat structure. Habitat structure, measured as
horizontal and vertical structure emerged as significantly related to sesFD. As horizontal habitat structure linked
to vegetation cover, increased, so too did sesFD (because pch1 was negatively correlated with horizontal habitat
structure). Yet sesFD was negatively correlated with pcv1, which was a measure of vertical habitat structure,
particularly that at > 50 cm height. Thus, it seems as if horizontal structure at low levels creates habitat complex-
ity for ground-dwelling ants, so increasing functional differentiation (sesFD), but plant cover over 50 cm does
not contribute to habitat structure, but may serve only to reduce ground temperature, which would be expected
to be negative for ectothermic species. Plant cover above 50 cm in height is associated with increased shading
and woody thickening, and is associated with relatively little ground cover. The implications of our findings are
that studies focused on large scale measures like altitude may risk missing fine-scale changes associated with
heterogeneous habitats. Habitat structure buffers changes in temperature and models based on temperature alone
could overestimate the impact of climate c hange65,66. Fine-scale data collection is often laborious and costly, yet
these data may make valuable contributions to large-scale models that would otherwise overlook microclimatic
effects23. Adaptive Dynamic Global Vegetation Models can be used to simulate state variables causally linked
to these fine scale variables67. These models also suggest that there could be a considerable lag in how vegeta-
tion responds to climate change, further confounding models based on temperature alone68. The importance of
microclimate in dictating fine-scale biodiversity is increasingly r ecognised9,69–72. Here, we find that FD is well
explained by finer-scale measures of habitat.
That FD, and to some extent species composition, are influenced by fine-scale factors implies that predicting
species’ responses to climate change is complicated by habitat structure and may not be well predicted by only
broad-scale predictors such as temperature and elevation66. This has implications for management: if vegetation
structure can be maintained and managed, ectothermic species may be less impacted than expected, and it may
be possible to ameliorate some of the inexorable effects of climate change, with careful conservation strategies.
At the same time, drought intensity and frequency are predicted to increase73,74, with a risk that precipitation-
dependent vegetation may die off.
At the regional scale, our findings shed light on the relative importance of high-altitude sites in Afromon-
tane systems, which harbour distinct species assemblages. Vhembe Biosphere has recently received calls for all
areas of high altitude to be declared core conservation zones, and our findings support this directive. Given that
altitude is a major predictor of assemblage composition, as macro-climate warms, species should move upslope,
as organisms attempt to remain within ambient temperatures to which they are adapted6. However, given that
the climatically coolest areas are at the apex of mountains, such zones are by definition small in area. Therefore,
with gradual movement up a gradient in response to warming, available habitat for a given species will likely
shrink incrementally over time, ultimately jeopardising p ersistence6. Species at the lowest elevations may not be
replaced, but lowest elevation communities may simply suffer species attrition75. Here, we found that ant spe-
cies assemblages at each elevation are distinct, that nestedness makes very little contribution to beta diversity.
In the context of global change, microclimates may be key to modulating the potentially deleterious impacts to
high-altitude processes at a range of scales.
Data availability
Intended archive: ResearchGate.
Received: 20 April 2020; Accepted: 14 December 2020
References
1. Chen, I.-C., Hill, J. K., Ohlemüller, R., Roy, D. B. & Thomas, C. D. Rapid range shifts of species associated with high levels of climate
warming. Science (80-). 333, 1024–1026 (2011).
2. Beniston, M. Climatic change in mountain regions: A review of possible impacts. Clim. Chang. 5, 5–31 (2003).
3. Bishop, T. R., Robertson, M. P., van Rensburg, B. J. & Parr, C. L. Coping with the cold: Minimum temperatures and thermal toler-
ances dominate the ecology of mountain ants. Ecol. Entomol. 42, 105–114 (2017).
4. Bentley, L. K., Robertson, M. P. & Barker, N. P. Range contraction to a higher elevation: The likely future of the montane vegetation
in South Africa and Lesotho. Biodivers. Conserv. 28, 131–153 (2019).
5. Pepin, N. et al. Elevation-dependent warming in mountain regions of the world. Nat. Clim. Chang. 5, 424–430 (2015).
6. Peters, R. L. & Darling, J. D. S. The greenhouse effect and nature reserves. Bioscience 35, 707–717 (1985).
7. MacArthur, R. & Wilson, E. The Theory of Island Biogeography (Princeton University Press, Princeton, 1967).
8. Soliveres, S., DeSoto, L., Maestre, F. T. & Olano, J. M. Spatio-temporal heterogeneity in abiotic factors modulate multiple ontogenetic
shifts between competition and facilitation. Perspect. Plant Ecol. Evol. Syst. 12, 227–234 (2010).
9. Suggitt, A. J. et al. Habitat microclimates drive fine-scale variation in extreme temperatures. Oikos 120, 1–8 (2011).
10. Thomas, J. A., Rose, R. J., Clarke, R. T., Thomas, C. D. & Webb, N. R. Intraspecific variation in habitat availability among ectothermic
animals near their climatic limits and their centres of range. Funct. Ecol. 13, 55–64 (1999).
11. Porter, W. P. & Gates, D. M. Thermodynamic equilibria of animals with environment. Ecol. Monogr. 39, 227–244 (1969).
12. Del Toro, I., Ribbons, R. R. & Pelini, S. L. The little things that run the world revisited: A review of ant-mediated ecosystem services
and disservices (Hymenoptera: Formicidae). Myrmecol. News 17, 133–146 (2012).
13. Wilson, E. The little things that run the world (the importance and conservation of invertebrates). Conserv. Biol. 1, 344–346 (1987).
14. Folgarait, P. J. Ant biodiversity and its relationship to ecosystem functioning: A review. Biodivers. Conserv. 7, 1221–1244 (1998).
15. Seymour, C. & Joseph, G. Ecology of Smaller Animals Associated with Savanna Woody Plants. in Savanna Woody Plants And Large
Herbivores (eds. Scogings, P. & Sankaran, M.) 183–212 (2019).
16. Palmer, T. M. et al. Breakdown of an ant-plant mutualism follows the loss of large herbivores from an African savanna. Science
(80-). 319, 192–195 (2008).
17. Hölldobler, B. & Wilson, E. The Ants (Harvard University Press, Cambridge, 1990).
Scientific Reports | (2021) 11:56 | https://doi.org/10.1038/s41598-020-80077-8 8
Vol:.(1234567890)www.nature.com/scientificreports/
18. Munyai, T. C. & Foord, S. H. Temporal patterns of ant diversity across a mountain with climatically contrasting aspects in the
tropics of Africa. PLoS ONE 10, 1–16 (2015).
19. Dunn, R. R., Parker, C. R. & Sanders, N. J. Temporal patterns of diversity: Assessing the biotic and abiotic controls on ant assem-
blages. Biol. J. Linn. Soc. 91, 191–201 (2007).
20. Urban, M. C., Tewksbury, J. J. & Sheldon, K. S. On a collision course: Competition and dispersal differences create no-analogue
communities and cause extinctions during climate change. Proc. R. Soc. B Biol. Sci. 279, 2072–2080 (2012).
21. Warren, R. J. & Chick, L. Upward ant distribution shift corresponds with minimum, not maximum, temperature tolerance. Glob.
Chang. Biol. 19, 2082–2088 (2013).
22. Suggitt, A. J. et al. Extinction risk from climate change is reduced by microclimatic buffering. Nat. Clim. Change 8, 2 (2018).
23. Joseph, G. S. et al. Microclimates mitigate against hot temperatures in dryland ecosystems: termite mounds as an example. Ecosphere
Article e01509 (2016).
24. Baudier, K. M., Mudd, A. E., Erickson, S. C. & O’Donnell, S. Microhabitat and body size effects on heat tolerance: Implications for
responses to climate change (army ants: Formicidae, Ecitoninae). J. Anim. Ecol. 84, 1322–1330 (2015).
25. Zellweger, F., Roth, T., Bugmann, H. & Bollmann, K. Beta diversity of plants, birds and butterflies is closely associated with climate
and habitat structure. Glob. Ecol. Biogeogr. 26, 898–906 (2017).
26. Mauda, E. V., Joseph, G. S., Seymour, C. L., Munyai, T. C. & Foord, S. H. Changes in landuse alter ant diversity, assemblage com-
position and dominant functional groups in African savannas. Biodivers. Conserv. 27, 947–965 (2018).
27. Andrew, N. R., Miller, C., Hall, G., Hemmings, Z. & Oliver, I. Aridity and land use negatively influence a dominant species’ upper
critical thermal limits. PeerJ 2019, 1–20 (2019).
28. Oliver, I., Dorrough, J., Doherty, H. & Andrew, N. R. Additive and synergistic effects of land cover, land use and climate on insect
biodiversity. Landsc. Ecol. 31, 2415–2431 (2016).
29. Hahn, N. Floristic diversity of the Soutpansberg, Limpopo Province, South Africa (University of Pretoria, Pretoria, 2006).
30. Davis, C. & Vincent, K. Climate Risk and Vulnerability: A Handbook for Southern Africa. (2017).
31. Joseph, G. S. et al. Stability of Afromontane ant diversity decreases across an elevation gradient. Glob. Ecol. Conserv. 17, e00596
(2019).
32. Longino, J. T. & Colwell, R. K. Density compensation, species composition, and richness of ants on a neotropical elevational gradi-
ent. Ecosphere 2, 1–20 (2011).
33. Bishop, T. R., Robertson, M. P., van Rensburg, B. J. & Parr, C. L. Contrasting species and functional beta diversity in montane ant
assemblages. J. Biogeogr. 42, 1776–1786 (2015).
34. Tilman, D. Functional Diversity. In Encyclopedia of Biodiversity Vol. 3 (ed. Levin, S. A.) 109–121 (Academic Press, New York, 2001).
35. Díaz, S. & Cabido, M. Vive la différence: Plant functional diversity matters to ecosystem processes. Trends Ecol. Evol. 16, 646–655
(2001).
36. Seymour, C. L., Simmons, R. E., Joseph, G. S. & Slingsby, J. A. On bird functional diversity: Species richness and functional dif-
ferentiation show contrasting responses to rainfall and vegetation structure in an arid landscape. Ecosystems 18, 971–984 (2015).
37. Joseph, G. S. et al. Termite mounds mitigate against 50 years of herbivore-induced reduction of functional diversity of savanna
woody plants. Landsc. Ecol. 30, 2161–2174 (2015).
38. Díaz, S., Cabido, M. & Casanoves, F. Plant functional traits and environmental filters at a regional scale. J. Veg. Sci. 9, 113–122
(1998).
39. Modiba, R. V., Joseph, G. S., Seymour, C. L., Fouché, P. & Foord, S. H. Restoration of riparian systems through clearing of invasive
plant species improves functional diversity of Odonate assemblages. Biol. Conserv. 214, 46–54 (2017).
40. Van Wyk, A. & Smith, G. Regions of Floristic Endemism in Southern Africa: A Review with Emphasis on Succulents (Umdaus press,
Umdaus, 2001).
41. Mostert, T., Bredenkamp, G., Klopper, H. & Al, E. Major vegetation types of the Soutpansberg conservancy and the Blouberg
nature reserve, South Africa. Koedoe 50, 32–48 (2008).
42. Mucina, L. & Rutherford, M. C. The vegetation of South Africa, Lesotho and Swaziland. (2011).
43. McKillup, S. Statistics Explained: An Introductory Guide for Life Scientists (Cambridge University Press, Cambridge, 2011).
44. Yates, M., Andrew, N., Binns, M. & Gibb, H. Morphological traits: predictable responses to macrohabitats across a 300 km scale.
PeerJ 2, e271 (2014).
45. Schofield, S. F., Bishop, T. R. & Parr, C. L. Morphological characteristics of ant assemblages (Hymenoptera: Formicidae) differ
among contrasting biomes. Myrmecol. News 23, 129–137 (2016).
46. Colwell, R. K. EstimateS: Statistical estimation of species richness and shared species from samples. (2006).
47. Baselga, A. Partitioning the turnover and nestedness components of beta diversity. Glob. Ecol. Biogeogr. 19, 134–143 (2010).
48. Baselga, A. & Orme, C. D. L. Betapart: An R package for the study of beta diversity. Methods Ecol. Evol. 3, 808–812 (2012).
49. Wang, Y., Naumann, U., Eddelbuettel, D. & Warton, D. mvabund: statistical methods for analysing multivariate abundance data.
R package version 3.13.1. (2018).
50. Warton, D. I., Foster, S. D., Death, G., Stoklosa, J. & Dunstan, P. K. Model-based thinking for community ecology. Plant Ecol. 216,
669–682 (2015).
51. Warton, D. I., Thibaut, L. & Wang, Y. A. The PIT-trap—A “model-free” bootstrap procedure for inference about regression models
with discrete, multivariate responses. PLoS ONE 12, 1–19 (2017).
52. Hui, F. boral: Bayesian Ordination and Regression AnaLysis. R package version 1.6.1. (2018).
53. Petchey, O. L. & Gaston, K. J. Functional diversity: Back to basics and looking forward. Ecol. Lett. 9, 741–758 (2006).
54. Weber, N. The biology of the fungus-growing ants. Part IV. Additional new forms. Rev. Entomol. 9, 154–206 (1938).
55. Laliberté, E. & Shipley, B. FD: measuring functional diversity from multiple traits, and other tools for functional ecology. R package
1.0–11. (2011).
56. Petchey, O. L. & Gaston, K. J. Extinction and the loss of functional diversity. Proc. Biol. Sci. 269, 1721–1727 (2002).
57. Kembel, S. et al. Picante: R tools for integrating phylogenies and ecology. Bioinformatics 26, 1463–1464 (2010).
58. Gotelli, N. J. & Rohde, K. Co-occurrence of ectoparasites of marine fishes: a null model analysis. Ecol. Lett. 5, 86–94 (2002).
59. Pinheiro, J., Bates, D., DebRoy, S., Sarkar, D. & R Core Team, . nlme: Linear and Nonlinear Mixed Effects Models. (2016).
60. Kamil Barton. MuMIn: Multi-Model Inference. R package version 1.43.17. (2020).
61. Burnham, K. P. & Anderson, D. R. Model Selection and Multimodel Inference: A Practical Information-Theoretic Approach (2nd ed).
Ecological Modelling vol. 172 (2002).
62. Nakagawa, S. & Schielzeth, H. A general and simple method for obtaining R2 from generalized linear mixed-effects models.
Methods Ecol. Evol. 4, 133–142 (2013).
63. Didham, R., Kapos, V. & Ewers, R. Rethinking the conceptual foundations of habitat fragmentation research. Oikos 121, 161–170
(2012).
64. Niu, K. et al. Fertilization decreases species diversity but increases functional diversity: A three-year experiment in a Tibetan alpine
meadow. Agric. Ecosyst. Environ. 182, 106–112 (2014).
65. Joseph, G. S. et al. Elephants, termites and mound thermoregulation in a progressively warmer world. Landsc. Ecol. 33, 731–742
(2018).
66. Bishop, T. R. et al. Thermoregulatory traits combine with range shifts to alter the future of montane ant assemblages. Glob. Chang.
Biol. 25, 2162–2173 (2019).
Scientific Reports | (2021) 11:56 | https://doi.org/10.1038/s41598-020-80077-8 9
Vol.:(0123456789)www.nature.com/scientificreports/
67. Prentice, I. C. et al. Dynamic global vegetation modeling: Quantifying terrestrial ecosystem responses to large-scale environmental
change. Terrest. Ecosyst. Chang. World https://doi.org/10.1007/978-3-540-32730-1_15 (2007).
68. Pfeiffer, M., Kumar, D., Martens, C. & Scheiter, S. Climate change will cause non-analogue vegetation states in Africa and commit
vegetation to long-term change. Biogeosci. Discuss. https://doi.org/10.5194/bg-2020-179 (2020).
69. Potter, K. A., Woods, H. A. & Pincebourde, S. Microclimatic challenges in global change biology. Glob. Chang. Biol. 19, 2932–2939
(2013).
70. Scheffers, B. R., Edwards, D. P., Diesmos, A., Williams, S. E. & Evans, T. A. Microhabitats reduce animal’s exposure to climate
extremes. Glob. Chang. Biol. 20, 495–503 (2014).
71. Bonachela, J. A. et al. Termite mounds can increase the robustness of dryland ecosystems to climatic change. Science (80-). 347,
651–655 (2015).
72. Joseph, G. S. et al. Landuse change in savannas disproportionately reduces functional diversity of invertebrate predators at the
highest trophic levels: Spiders as an example. Ecosystems 21, 930–942 (2018).
73. Hoerling, M. & Kumar, A. The perfect ocean for drought. Science (80-). 299, 691–694 (2003).
74. Diffenbaugh, N. S. & Field, B. S. Changes in ecologically critical terrestrial climate conditions. Science (80-). 341, 486–493 (2013).
75. Colwell, R. K., Brehm, G., Cardelús, C. L., Gilman, A. C. & Longino, J. T. Global warming, elevational range shifts, and lowland
biotic attrition in the wet tropics. Science (80-). 322, 258–261 (2008).
76. Fowler, H., Forti, L., Brandão, C. & et al. Ecologia nutricional de formigas. in Ecologia Nutricional de Insetos E Suas Implicações
No Manejo de Pragas 131–223 (1991).
77. Davidson, D., Cook, S. & Snelling, R. Liquid-feeding performances of ants (Formicidae): Ecological and evolutionary implications.
Oecologia 139, 255–266 (2004).
78. Sarty, M., Abbott, K. & Lester, P. Habitat complexity facilitates coexistence in a tropical ant community. Oecologia 149, 465–473
(2006).
79. Kaspari, M. Body size and microclimate use in Neotropical granivorous ants. Oecologia 96, 500–507 (1993).
80. Weiser, M. & Kaspari, M. Ecological morphospace of New World ants. Ecol. Entomol. 31, 131–142 (2006).
81. Gibb, H. et al. Does morphology predict trophic position and habitat use of ant species and assemblages?. Oecologia 177, 519–531
(2015).
82. Gibb, H. & Cl, P. Does structural complexity determine the morphology of assemblages? An experimental test on three continents.
PLoS ONE 8, e64005 (2013).
Acknowledgements
We thank the DST-NRF Centre of Excellence for Invasion Biology, through the South African Research Chairs
Initiative Chair on Biodiversity Value and Change in the Vhembe Biosphere Reserve, hosted by the University
of Venda. We thank Norbert Hahn for creation of the maps used for Electronic Supplementary Material Fig. 1.
We thank four reviewers and the handling editor for their useful and constructive comments which improved
the manuscript.
Author contributions
M.M., G.J., S.F., and C.S. conceived ideas, design and G.J. led writing. T.M. and M.M. collected data. C.S., G.J.
and M.M. analysed data. All authors contributed to writing of the paper.
Competing interests
The authors declare no competing interests.
Additional information
Supplementary Information The online version contains supplementary material available at https://doi.
org/10.1038/s41598-020-80077-8.
Correspondence and requests for materials should be addressed to G.S.J.
Reprints and permissions information is available at www.nature.com/reprints.
Publisher’s note Springer Nature remains neutral with regard to jurisdictional claims in published maps and
institutional affiliations.
Open Access This article is licensed under a Creative Commons Attribution 4.0 International
License, which permits use, sharing, adaptation, distribution and reproduction in any medium or
format, as long as you give appropriate credit to the original author(s) and the source, provide a link to the
Creative Commons licence, and indicate if changes were made. The images or other third party material in this
article are included in the article’s Creative Commons licence, unless indicated otherwise in a credit line to the
material. If material is not included in the article’s Creative Commons licence and your intended use is not
permitted by statutory regulation or exceeds the permitted use, you will need to obtain permission directly from
the copyright holder. To view a copy of this licence, visit http://creativecommons.org/licenses/by/4.0/.
© The Author(s) 2021
Scientific Reports | (2021) 11:56 | https://doi.org/10.1038/s41598-020-80077-8 10
Vol:.(1234567890)You can also read