Keeping an ear out: size relationship of the tympanic bullae and pinnae in bandicoots and bilbies (Marsupialia: Peramelemorphia)
←
→
Page content transcription
If your browser does not render page correctly, please read the page content below
Current Zoology, 2021, 1–14
                                                                                                                     doi: 10.1093/cz/zoab055
                                                                                                                              Original Article

Original Article

Keeping an ear out: size relationship of the

                                                                                                                                                                          Downloaded from https://academic.oup.com/cz/advance-article/doi/10.1093/cz/zoab055/6318776 by guest on 13 September 2021
tympanic bullae and pinnae in bandicoots
and bilbies (Marsupialia: Peramelemorphia)
                                       a,b,
Melissa C. TAYLOR                           *, Kenny J. TRAVOUILLON b, Margaret E. ANDREW                                               a
                                                                                                                                          ,
                                         a
Patricia A. FLEMING                       , and Natalie M. WARBURTON a
a
 Terrestrial Ecosystem Science and Sustainability, Harry Butler Institute, Murdoch University, 90 South St,
Murdoch, WA 6150, Australia and bCollections and Research, Western Australian Museum, Welshpool, WA 6106,
Australia
*Address correspondence to Melissa Taylor. E-mail: 33510822@student.murdoch.edu.au

Handling editor: Zhi-Yun Jia (                 )
Received on 10 March 2021; accepted on 5 July 2021

Abstract
Bandicoots and bilbies (Order Peramelemorphia) occupy a broad range of habitats across Australia
and New Guinea, from open, arid deserts to dense forests. This once diverse group has been par-
ticularly vulnerable to habitat loss and introduced eutherian predators, and numerous species
extinctions and range retractions have occurred. Understanding reasons for this loss requires
greater understanding of their biology. Morphology of the pinnae and tympanic bullae varies mark-
edly among species. As hearing is important for both predator avoidance and prey location, the
variability in ear morphology could reflect specialization and adaptation to specific environments,
and therefore be of conservation relevance. We measured 798 museum specimens representing
29 species of Peramelemorphia. Controlling for phylogenetic relatedness and head length, pinna
surface area was weakly negatively correlated with average precipitation (rainfall being our surro-
gate measure of vegetation productivity/complexity), and there were no environmental correlates
with effective diameter (pinna width). Controlling for phylogenetic relatedness and skull length,
tympanic bulla volume was negatively correlated with precipitation. Species that inhabited drier
habitats, which would be open and allow sound to carry further with less obstruction, had relatively
larger pinnae and tympanic bullae. In contrast, species from higher rainfall habitats, where sounds
would be attenuated and diffused by dense vegetation, had the smallest pinnae and bullae, sug-
gesting that low-frequency hearing is not as important in these habitats. Associations with tem-
perature did not reach statistical significance. These findings highlight linkages between hearing
traits and habitat that can inform conservation and management strategies for threatened species.

Key words: external ear, hearing ecology, marsupial, middle ear, sound perception.

Hearing is used in several aspects of day-to-day life, including preda-                    varying relevance to survival. These sounds are captured by the exter-
tor detection, foraging, and communication, and is therefore critically                    nal ear (pinna) and directed into the external ear canal (Figure 1). In
important for survival and fitness in many species (Vaughan et al.                         the air-filled middle ear, they are augmented by the auditory ossicles
2015). Sounds are emitted from various sources in the environment,                         (malleus, incus, and stapes) to match the impedance of the fluid-filled
biotic and abiotic, resulting in a complex auditory environment of                         inner ear (Khanna and Tonndorf 1969; Tucker 2017). In many

C The Author(s) (2021). Published by Oxford University Press on behalf of Editorial Office, Current Zoology.
V                                                                                                                                                                    1
This is an Open Access article distributed under the terms of the Creative Commons Attribution Non-Commercial License (http://creativecommons.org/licenses/by-nc/4.0/),
which permits non-commercial re-use, distribution, and reproduction in any medium, provided the original work is properly cited. For commercial re-use, please contact
journals.permissions@oup.com
2                                                                                                                   Current Zoology, 2021, Vol. 00, No. 00

                                                                                                                                                               Downloaded from https://academic.oup.com/cz/advance-article/doi/10.1093/cz/zoab055/6318776 by guest on 13 September 2021
Figure 1. Diagram of the ear structure of the bilby, separated by section with summary of function for relevant structures. Image source: M. Taylor.

mammals, the bony cavity that encloses the middle ear (tympanic                     1972; Hunt 1974; Basso et al. 2020). Conversely, wetter environ-
bulla) has become enlarged into a visible protrusion at the base of the             ments, often typified by dense vegetation, pose a different kind of
skull.                                                                              auditory environment: acoustic signals degrade rapidly as a result
    Ear morphology is adapted to detect certain frequencies at a                    of obstacles blocking, refracting, and possibly altering the frequency
range of distances relevant to each species’ environment. Pinnae can                of the signals (Blumenrath and Dabelsteen 2004; Boncoraglio and
serve multiple purposes, from sound localization using different                    Saino 2007). Dense vegetation will consequently result in a complex
cues, to altering the hearing range of a species. Pinnae can facilitate             acoustic environment with a large variety of sound sources. Habitats
sound localization by creating different level (interaural level differ-            with varying levels of aridity and vegetation complexity consequent-
ence [ILD] cues) and time (interaural timing difference [ITD] cues)                 ly have different soundscapes and will result in selection for differen-
cues between each ear (Kuhn 1987). ILD cues can be caused by an                     ces in the hearing range requirements of species.
“acoustic shadow” created by the head and pinnae size, where                            Some selective pressures may act on both pinnae and bullae, but
sound is less intense for the pinnae further away from the sound                    there is also evidence suggesting that these 2 structures can be
source (King et al. 2001). These cues are most useful at higher fre-                selected for independently. Pinnae and bullae sizes are negatively
quencies (Heffner et al. 1996; King et al. 2001). ITD cues are created              correlated in some desert-specialized rodents (Pavlinov and Rogovin
in timing differences between each pinnae detecting the sound and                   2000). In contrast, both pinnae and tympanic bullae increase in size
are most pronounced in lower frequencies (Wightman and Kistler                      with increasing temperature and aridity in the Indian gerbil Tatera
1992; King et al. 2001). Localization may be aided in some animals                  indica (Khajeh et al. 2019). Similarly, some leporid lagomorph spe-
with large mobile pinnae that can be turned toward the sound                        cies (Bunolagus spp.) have both enlarged pinnae and bullae (Kraatz
source (Webster 1966). In smaller mammals, it has been suggested                    et al. 2015). Notably, many of these studies do not account for re-
that relatively large pinnae may also facilitate the detection of lower             latedness between species. Studies on desert rodents that do account
frequency sounds (Heffner and Heffner 2008, Jones et al. 2011). In                  for phylogenetic relationships have similarly found a correlation be-
contrast, relatively small pinnae are more targeted to the detection                tween tympanic bullae and temperature (Alhajeri et al. 2015;
of high-frequency sounds and have limited capacity to detect direc-                 Alhajeri and Steppan 2018), whereas correction for phylogenetic re-
tionality of sound (Heffner et al. 1996). Pinnae size and shape can                 latedness eliminated any significant relationship between pinnae and
therefore impact the way a species perceives the auditory landscape                 either temperature or precipitation for gerbils (Gerbillinae) (Alhajeri
of its environment.                                                                 2016). Accounting for phylogeny helps to identify the strength of
    The volume of the middle ear cavity influences hearing frequency                factors selecting for both larger and smaller ear structures in differ-
range, with larger middle ears allowing greater sensitivity to lower                ent environments.
frequencies (Lay 1972; Ravicz and Rosowski 1997). The size of the                       Bandicoots and bilbies (Order Peramelemorphia) inhabit a range
tympanic bulla (the bone covering around the middle ear) can there-                 of habitats across Australia and New Guinea, including rainforests,
fore provide insight into the range of frequencies that animals can                 woodlands, heath, and arid areas (Driessen and Rose 2015; Hall et al.
detect. For example, the tympanic bulla is often particularly large in              2016; Warburton and Travouillon 2016). They are generally crepus-
small insectivorous mammals (Keen and Grobbelaar 1940), whose                       cular or nocturnal, and most species are omnivorous, taking a variety
small skull size would otherwise restrict their hearing range to                    of invertebrates, fungi, and plant material in their diet (Hall et al.
higher frequencies.                                                                 2016; Warburton and Travouillon 2016). Many species are known to
    The environment influences attenuation of sound, with different                 scratch-dig for subterranean food items, whereas the greater bilby
conditions impacting the distance sounds can travel. In arid condi-                 Macrotis lagotis also burrows for shelter (Van Dyck and Strahan
tions, higher frequency soundwaves attenuate more severely than in                  2008). Australian mammal species in the “critical weight range”
other open environments (Knudsen 1931; Lay 1972; Huang et al.                       (body mass of 35 g to 5.5 kg), especially those occupying low-rainfall
2002). This would make low-frequency sound detection more useful                    areas, have suffered disproportionate extinction losses since European
in arid conditions or where sound carries (i.e., for open conditions                settlement (McKenzie et al. 2007; Woinarski et al. 2014 , Johnson
rather than closed environments). As a result, arid-adapted species                 and Isaac 2009) with predation by introduced predators being one the
tend to have larger, better-developed bullae compared with species                  most important threats for mammal extinction on the continent
from more mesic environments (Keen and Grobbelaar 1940; Lay                         (Woinarski et al. 2015). All bandicoot and bilby species lie within this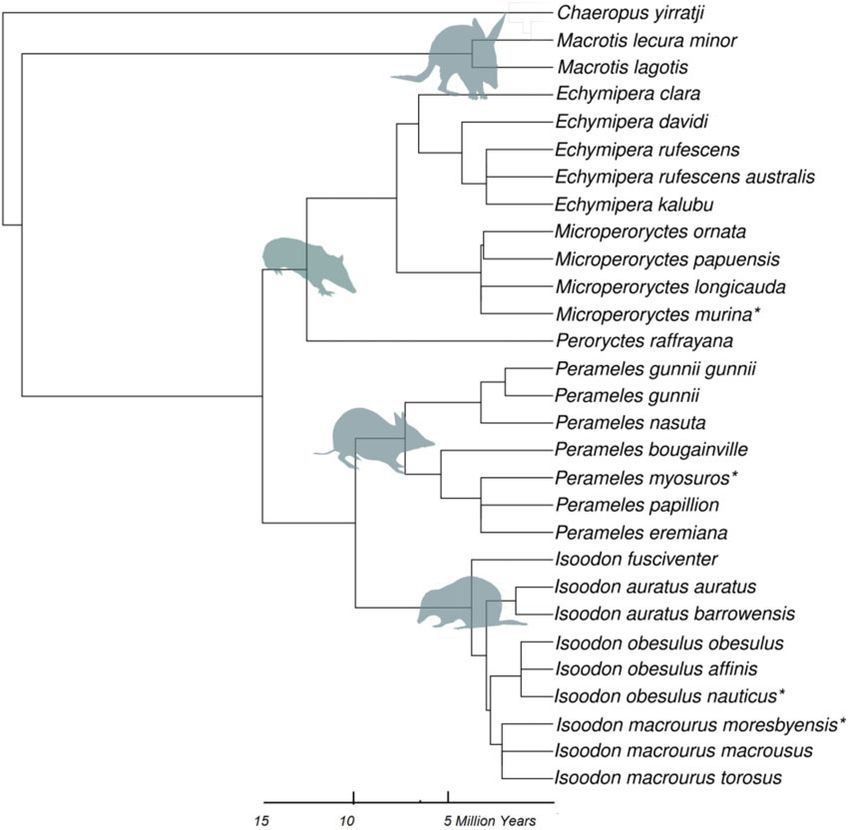
Taylor et al. Bandicoot tympanic bulla and pinna size 3
weight range (Woinarski et al. 2015). Eight out of the 18 recognized out, scanned (open source painting program Krita; Stitching Krita
modern Australian species within Peramelemorphia are now extinct Foundation, 2018), and then digitized (ImageJ; Rasband, 1997–
and a further 5 species are classified as Critically Endangered or 2018). Not all specimens were available for a mold to be taken
Threatened (Warburton and Travouillon 2016). Conservation of these (Supplementary Table S1). The 2 methods for calculating PSA were
animals requires greater understanding of their biology and ecology, compared using generalized linear mixed model (GLMM) with species
yet basic biological information for many species, particularly those as a random factor to account for non-independence of data due
from New Guinea, is still lacking. to species relatedness (Supplementary Figure S1) using the glmer
Hearing ability could make bandicoots and bilbies vulnerable to function in the “lme4” package (Bates et al., 2014) in R version 4.0
habitat loss and predation. For example, hearing characteristics (R Development Core Team 2010). They were highly correlated
could have implications for their ability to detect and therefore es- (n ¼ 380; R2 ¼ 0.893), and the slope of this relationship was tested
Downloaded from https://academic.oup.com/cz/advance-article/doi/10.1093/cz/zoab055/6318776 by guest on 13 September 2021
cape from terrestrial predators, or their ability to locate insect prey. using an analysis of variance (ANOVA) and was significantly different
Bandicoots and bilbies have marked species variation in pinna and from b ¼ 1 (F1,358 ¼ 178.52, P ¼ 0.005). We retained the dimension-
tympanic bulla sizes (Hall et al. 2016; Travouillon and Phillips derived values for further analyses as we had the least missing data for
2018), but it is not understood how this variation may be related to this measure and also used dimension-derived values for tympanic
their ecology. In this study, we tested the relationships between rela- bulla volume (TBV) (see below).
tive bulla and pinna sizes in 29 peramelemorphian species and sub- An additional pinna metric, effective diameter (ED), which is
species and examined to what extent these correlated with believed to better capture the acoustic impact of pinna size, was cal-
environmental characteristics. This knowledge may be useful for culated as per Jones et al. (2011) (Supplementary Table S2).
conservation of species, for example, in identifying suitable habitats
ED ¼ 冑PW PH (2)
for endangered species, particularly in relation to translocation and
reintroduction efforts.
Skulls
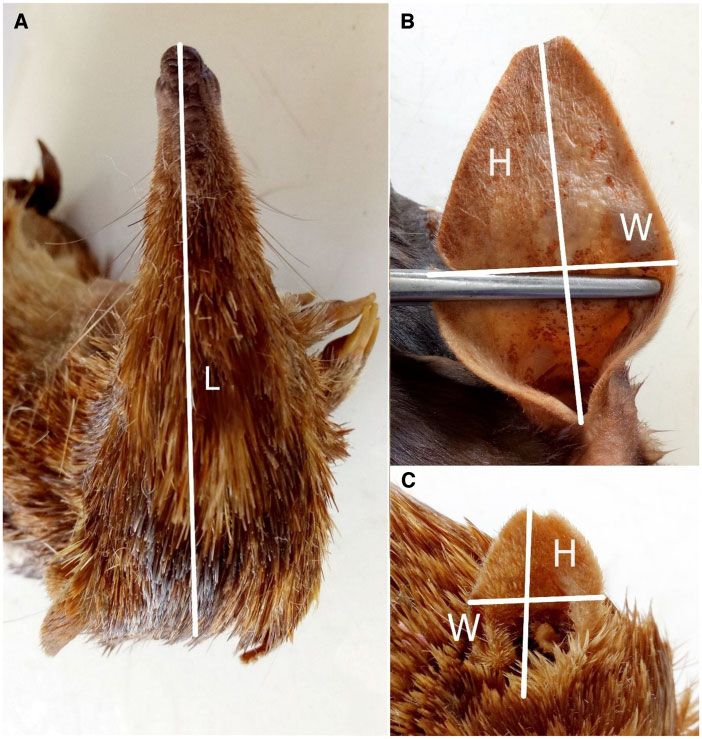
Measurements were made of maximum skull length (Onar 1999;
Materials and Methods Cooper 2000) (mm) using digital calipers (Figure 3B). Maximum
Specimens length, width, and height of the right tympanic bulla (Figure 3A,
Skins preserved in alcohol and dry skulls of representative species C–E; Basso et al. 2017) were measured if it was intact or had suf-
were sourced from museums (Table 1). Only adult specimens were fered only superficial damage that would not affect these measure-
used: wet skins were considered adult by their body size and if the ments. In cases where the right tympanic bulla was deemed too
pouch or testes appeared fully developed, skulls were considered damaged to be used, the left was measured. The TBV was esti-
adult if all permanent teeth had erupted fully. A total of 798 speci- mated based on half the volume of an ellipsoid:
mens were measured from 29 species and subspecies, with roughly
TBV ¼ 1 =2 4 =3 pð1 =2 TBL 1 =2 TBW TBHÞ (3)
equal numbers of skins (n ¼ 389) and skulls (n ¼ 409; Table 1). Wet
skins were only used if at least 1 ear was in good condition and able
where TBL ¼ maximum tympanic bulla length, TBW ¼ maximum
to be flattened out in order to take reliable measures. Only skulls
tympanic bulla width, and TBH ¼ tympanic bulla height from the
that were in a reasonable condition (intact) to obtain their dimen-
glenoid fossa, where the mandible connects with the zygomatic arch
sions were included. One dry skin was used as the only accessible
(Figure 3D and E).
wet skin was for a juvenile (Perameles myosuros, n ¼ 1), although
We tested a second method for measuring TBV using a paper
due to the shrinkage of dry tissues the results for this specimen
funnel to fill the bulla with fine sand which was then weighed to cal-
should be considered an underestimate of actual size.
culate volume (from a known density of the sand). Not all specimens
were available for sand measurements (Supplementary Table S1)
Skins and unreliable volume measures were obtained for the New
The right pinna was used when intact. For those that were damaged Guinean species (except I. m. moresbyensis) due to the open nature
or too stiffly bent in such a way that may influence the measure- of their tympanic bulla. The dimension-derived and sand methods
ments, the left pinna was used instead. Head length was measured in were compared using GLMM with species as a random factor to ac-
millimeters (mm) for the wet skins (Figure 2A). The height and count for non-independence of data due to species relatedness
width of the pinnae (Figure 2B, C) were measured (mm) using digital (Supplementary Figure S2). The 2 methods provided highly corre-
calipers (Absolute Cooland Proof IP67, Mitutoyo). Most specimens lated results (n ¼ 388; R2 ¼ 0.966) but the relationship was signifi-
still contained their skulls (n ¼ 375), and for those that had the skull cantly different from slope of linearity (b ¼ 1) (slope comparison
removed, they were measured to the same approximate point be- ANOVA test: F1,226 ¼ 361.91, P 0.005). The challenges to obtain-
yond the ears as those that still contained skulls. Pinna dimensions ing a volume measure using the sand method for the New Guinean
were used to estimate pinnae surface area (PSA) of the inner surface genera, plus incomplete data for this method led us to elect to retain
using the area of an ellipse: the TBV estimated from bulla dimensions for further analyses
(Supplementary Figure S2).
PSA ¼ pð1 =2 PW1 =2 PHÞ (1)
where PW ¼ pinna width at widest point, and PH ¼ pinna height Choice of moderator variables (fixed effects)
from the base to tip. Species’ distribution maps (Supplementary Figure S3) were drawn in
We also directly measured PSA using a silicon-based mold QGIS (QGIS Development Team 2019) using data obtained from
R
(PinkysilV putty, Barnes, Sydney, Australia) from which a secondary the IUCN (2017) terrestrial mammal database, Warburton and
malleable mold was created (using RubberLatex liquid latex, Travouillon (2016), modified from Travouillon and Phillips (2018),
Jacksons Drawing Supplies, Perth, Australia) that could be flattened and the Mammals of New Guinea (Flannery 1995). These maps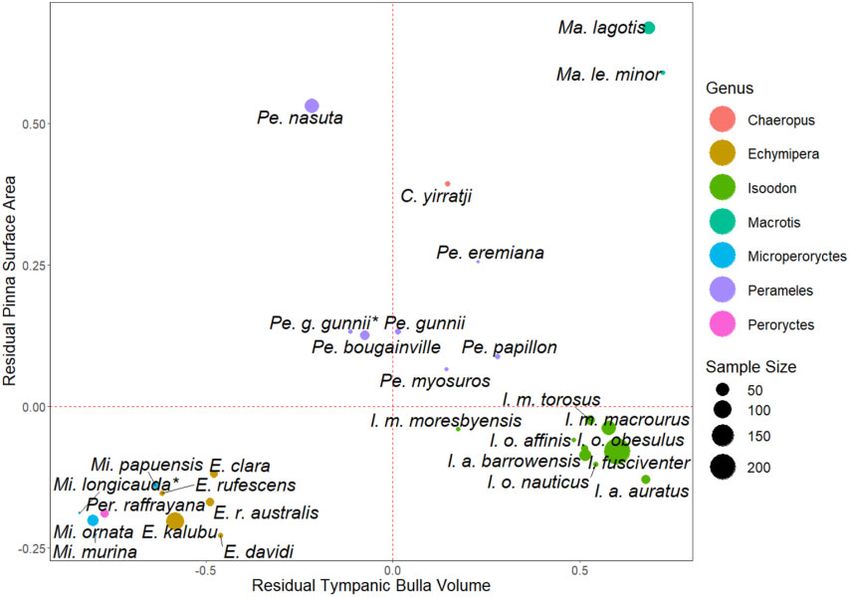
4                                                                                                                   Current Zoology, 2021, Vol. 00, No. 00

Table 1. Summary of data used for these analyses, showing the number of specimens from which measures were collected and the envir-
onmental predictor traits used in analysis for each species

                                        IUCN      Number of specimens                                                 Temperature ( C)     Precipitation (mm)

Genus Species                           Status   Skulls    Skins     Total             Sources            Habitat      Tmax       Tavg       Pmax        Pavg

CHAEROPODIDAE
Chaeropus
  C. yirratji                             EX        3        4         7            SAM, NMV               Open        42.4       22.7        513        249
THYLACOMYIDAE
Macrotis

                                                                                                                                                                    Downloaded from https://academic.oup.com/cz/advance-article/doi/10.1093/cz/zoab055/6318776 by guest on 13 September 2021
  Ma. lagotis                             VU       38        19       57          AM, WAM                  Open        43.3       25.0        909        354
  Ma. leucura minor                       EX       5         1         6       NMV, AM, NHMUK              Open        42.4       22.6        513        249
PERAMELIDAE
Perameles
  Pe. bougainville                        EN       13        15       28             WAM                   Open        35.0       22.0        268        227
  Pe. eremiana                            EX       2         1         3         AM, MV/NMV                Open        43.3       21.8        626        268
  Pe. gunnii                              VU       3         8        11        AM, WAM, NMV,              Open        25.3       13.4       1,958       880
                                                                                    QVMAG
  Pe. gunnii gunnii                       VU       5         —         5          AM, WAM                  Open        22.9       10.6       2,258       971
  Pe. myosuros                            EX       3         1a        4          AM, WAM                  Open        33.2       17.2       1,158       404
  Pe. nasuta                              LC       33        27       60          AM, WAM                  Open        35.8       17.1       7,625      1,028
  Pe. papillon                            EX       5         3         8             WAM                   Open        32.8       17.8        391        224
Isoodon
  I. auratus auratus                      VU       8         14      22             WAM                    Open        38.7       26.4       1,525      1,123
  I. auratus barrowensis                  VU       9         30      39             WAM                    Open        35.8       25.7        309        303
  I. fusciventer                          LC       85       125      210          AM, WAM                  Mixed       31.5       16.0       1,405       712
  I. macrourus macrourus                  LC       13        46      59           AM, WAM                  Mixed       40.4       26.9       1,888      1,134
  I. macrourus moresbyensis (NG)          LC       5         1        6              AM                    Mixed       34.3       26.2       3,453      1,988
  I. macrourus torosus                    LC       11        16      27           AM, WAM                  Mixed       38.0       21.7       7,625       977
  I. obesulus affinis                     EN       3         3        6       AM, WAM, QVMAG               Closed      22.6       10.0       2,924      1,354
  I. obesulus nauticus                    EN       5         2        7       WAM, SAM, NHMUK              Closed      25.0       16.6        308        297
  I. obesulus obesulus                    EN       4         10      14           AM, WAM                  Closed      30.1       13.8       1,958       848
PERORYCTIDAE
Peroryctes
  Per. raffrayana (NG)                    LC       17        4        21             AM, WAM               Mixed       34.1       20.1       7,322      3,046
Echymipera
  E. clara (NG)                           LC       13        3        16               AM                  Closed      33.2       25.8       4,244      2,798
  E. davidi (NG)                          EN       4         3         7               AM                  Closed      31.3       26.5       3,751      3,518
  E. kalubu (NG)                          LC       69        27       96           AM, WAM                 Closed      34.3       24.0       7,322      3,044
  E. rufescens (NG)                       LC       14        6        20          AM, WAM, QM              Closed      34.2       24.0       7,322      3,024
  E. rufescens australis                  LC       6         1         7            AM, QM                 Closed      36.2       26.0       2,150      1,559
Microperoryctes
  Mi. longicauda (NG)                     LC        1        —        1                AM                  Mixed       30.8       19.1       3,357      3,117
  Mi. murina (NG)                         DD        1        1        2             AM, AMNH               Closed      26.2       10.8       3,442      3,395
  Mi. ornata (NG)                         LC        26       13      39             AM, WAM                Closed      33.5       19.2       7,322      3,128
  Mi. papuensis (NG)                      LC        5        5       10             AM, WAM                Closed      32.4       19.0       3,642      2,695
                         Total                     409      389      798

NG indicates species from New Guinea (all others are from Australia). Ten skulls were removed from the data set for the analysis due to some ambiguity in their
taxonomy (Isoodon sp. n ¼ 1 and I. obesulus n ¼ 1), their TBV being markedly smaller than the other individuals of that species (Mi. ornata, n ¼ 4), or due to
being outliers when comparing all species (I. fusciventer, n ¼ 3; Ma. lagotis, n ¼ 1); totals do not include specimens which were removed for analysis. a Denotes
the use of a dry skin—a mounted specimen; a piece of tissue paper was folded around the back of the ear and then the shape of the ear was traced onto it. From
this, the width and height of the pinna were able to be measured using digital calipers. LC, Least Concern, VU, Vulnerable, EN, Endangered, EX, Extinct;
AMNH, American Museum of Natural History; AM, Australian Museum; NHMUK, Natural History Museum UK; NMV, Museum Victoria; SAM, South
Australian Museum; QM, Queensland Museum; QVMAG, Queen Victoria Museum & Art Gallery; WAM, Western Australian Museum.

were used to obtain maximum and average values for temperature                     data across a spatial resolution of 1 km2 between 1970 and 2000.
(Tmax and Tavg; as a measure of the level of thermal challenge for                 The spatial average was calculated across all pixels in the species’
each species) and precipitation Pmax and Pavg (as a proxy for vegeta-              distribution range for 2 variables summarizing annual temperature:
tion productivity and therefore habitat complexity; Sala et al. 1988;              band 15 (Tmax of the warmest month) and band 19 (annual mean
Huxman et al. 2004) for each species’ distribution range using the                 temperature). Both spatial average and maximum values were calcu-
Worldclim dataset (Global Climate Data: http://worldclim.org/ver                   lated for precipitation from band 8 (annual precipitation). Habitat
sion2; Fick and Hijmans 2017), which aggregated monthly climate                    type (Open ¼ 0, Mixed ¼ 0.5, Closed ¼ 1; sensu Warburton and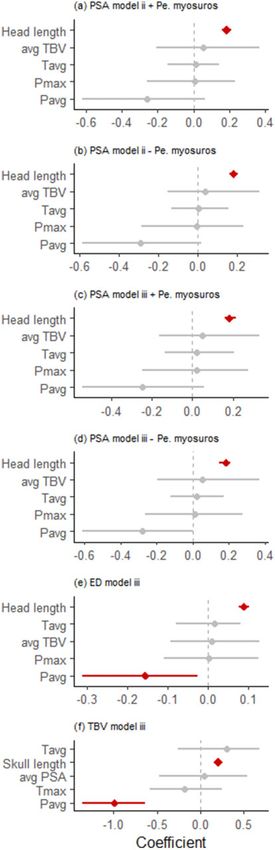
Taylor et al.  Bandicoot tympanic bulla and pinna size                                                                                                     5

                                                                                                                                                                 Downloaded from https://academic.oup.com/cz/advance-article/doi/10.1093/cz/zoab055/6318776 by guest on 13 September 2021
Figure 2. Skin measurements for all specimens. (A) Head length for skins. (B) Pinna height and (C) pinna width.

Travouillon 2016), as a proxy of the type of ground and overhead                   (Figure 5). Due to the lack of specimens from which PSA was meas-
cover, was also considered in modeling. We tested for collinearity                 ured, Mi. longicauda had a species residual calculated from the aver-
between predictor variables using vif. MCMCglmm in the package                     age of all the species residuals of Microperoryctes species and Pe. g.
“MCMCglmm” (Hadfield 2010) in R.                                                   gunnii was allocated the same standardized residual as Pe. gunnii (of
                                                                                   which it is a sub-species). These values were not used for further
                                                                                   analysis and are for visual inspection of the data only.
Choice of moderator variables (random effects)
                                                                                       We carried out GLMMs comparing log-transformed PSA, ED, or
To control for the potential non-independence of species’ data due
                                                                                   TBV as dependent variables in separate analyses. For fixed factors, we
to phylogenetic relatedness between species (Harvey and Pagel
                                                                                   included log10-head length or log10-skull length (PSA and ED, or TBV,
1991; Chamberlain et al. 2012; Nakagawa and Santos 2012), we
                                                                                   respectively) to account for larger individuals having larger pinnae or
implemented phylogenetic information as a variance–covariance
                                                                                   bullae. For the analysis of PSA and ED, we also included TBV, and we
matrix in analyses. A phylogenetic tree was constructed by combin-
                                                                                   included PSA for the analysis of TBV; because we rarely had PSA and
ing 2 trees constructed using genetic information (Westerman et al.
                                                                                   TBV for the same specimens, log10-transformed species-average PSA
2012; Travouillon and Phillips 2018) and creating a tree with
                                                                                   or TBV values were calculated and included. Finally, we included Tavg
branch segments representing approximate million year intervals
                                                                                   and Tmax and average (Pavg) and maximum precipitation (Pmax) values
that was built using Mesquite (Figure 4). Four species were not
                                                                                   as fixed factors. Continuous variables were mean-standardized.
found in either of the existing trees (P. myosuros, Isoodon m. mores-
                                                                                       The effect of precipitation and temperature on log-transformed
byensis, I. o. nauticus, and Microperoryctes murina) and were there-
                                                                                   PSA and TBV were isolated using the ggpredict function in
fore placed in polytomies with the expected closest relative (Cruz-
                                                                                   “ggeffects” package (Lüdecke 2019) in R on lmer models (keeping
Neto et al. 2001).
                                                                                   other predictor variables constant). These did not account for phyl-
                                                                                   ogeny but included species as a random factor.
Statistical analysis                                                                   Sensitivity analyses were carried out to evaluate the effect of statis-
For comparative purposes, we calculated species residuals for both                 tical assumption of phylogenetic covariance on conclusions
pinnae and bullae size against head and skull length, respectively.                (Koricheva and Gurevitch 2014; Noble et al. 2017) by comparing
These residual values were plotted against each other to represent                 statistical models with and without phylogenetic correction. We ran
the relative size of both the PSA and TBV for each of the species                  multilevel/hierarchical analyses comparing (i) linear mixed-effect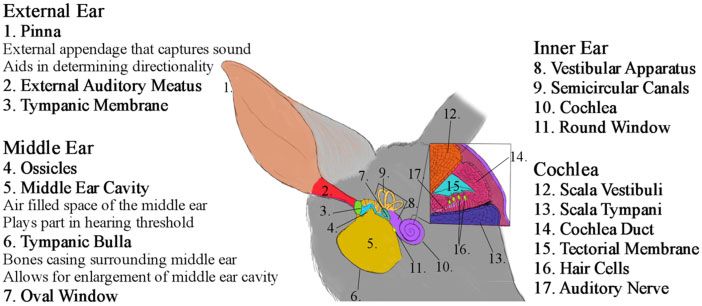
6                                                                                                           Current Zoology, 2021, Vol. 00, No. 00

                                                                                                                                                           Downloaded from https://academic.oup.com/cz/advance-article/doi/10.1093/cz/zoab055/6318776 by guest on 13 September 2021
Figure 3. Skull measurements for an Australian (Isoodon fusciventer; A, B, and D) and New Guinean (Echymipera kalubu; C and E) bandicoot species. (A, C)
Length and width of tympanic bulla; (B) Skull length for both species groups; (D and E) tympanic bulla height.

models with species as a random factor using lmer, (ii) models with           beta estimates across the top models that were within 2 DIC units of
species as a random factor using MCMCglmm (Markov chain Monte-                the best model using model.avg in the “MuMIn” package. For each
Carlo GLMMs) function in the “MCMCglmm” package (Hadfield                     predictor variable, we calculated their relative variable importance
2010) in R, and (iii) models with species and phylogeny (a phylogenet-        as the sum of model weights (wi) for all models containing the vari-
ic distance matrix) as random factors using MCMCglmm. For                     able. We present summary statistics (estimates and their credible
MCMCglmm analyses, we used a burn-in of 1,000 iterations, a                   intervals) for the global Model iii.
thinning rate of 500, and 50,000 iterations for each test with a non-
informative prior. There were strong associations between precipita-
tion and temperature with habitat type categories. Pavg and Pmax were         Results
positively correlated (Rs ¼ 0.818, P < 0.001), and Tavg and Tmax were         A total of 798 museum specimens were measured; 389 skins for
positively correlated (Rs ¼ 0.682, P < 0.001). Habitat category               pinna measurements (average 14.9 6 25.2 individuals per species,
(Open ¼ 0, Mixed ¼ 0.5, Closed ¼ 1) was negatively correlated with            range 1–125) and 409 skulls for tympanic bulla measurements (aver-
Tmax (Rs ¼ 0.434, P < 0.05), and positively correlated with Pavg             age 13.9 6 19.3 individuals per species, range 1–82; Table 1). Two
(Rs ¼ 0.688, P < 0.001) and Pmax (Rs ¼ 0.523, P < 0.01). To minimise          types of pinnae were noted: smaller, rounded pinnae (Isoodon spp.,
colineaity for these global models, habitat category and Pmax for TBV;        Echymipera spp., Microperoryctes spp., and Peroryctes raffrayana),
habitat category and Tmax for PSA; or PSA, habitat, and Tmax for ED           and larger, more elongated pinnae (Perameles spp., Chaeropus yir-
ensured that all variance inflation factors were
Taylor et al. Bandicoot tympanic bulla and pinna size 7
Downloaded from https://academic.oup.com/cz/advance-article/doi/10.1093/cz/zoab055/6318776 by guest on 13 September 2021
Figure 4. Phylogenetic tree showing relative relatedness of all 29 species and subspecies in the analysis. Asterisks denotes species not present on existing trees.
largest relative bulla size overall (after Ma. leucura minor). value), Model ii had marginally more support than Model iii
Chaeropus yirratji had average-sized tympanic bulla, but the fourth (DAIC ¼ 1.66), indicating that phylogenetic correction did not
largest relative pinna size. markedly improve model-fit (Table 2). For thoroughness, we have
Short-nosed bandicoots (Isoodon spp.) generally had tympanic included the results for both Model ii and Model iii for PSA. For ED
bullae that were larger than expected but pinnae that were smaller and TBV, Model iii was the best fit for the global model.
than expected (lower right quadrant of Figure 5). The exception was PSA was strongly correlated with head length, which was
the New Guinean I. macrourus moresbyensis, which had noticeably retained in all the top models (i.e. DAIC8 Current Zoology, 2021, Vol. 00, No. 00
Downloaded from https://academic.oup.com/cz/advance-article/doi/10.1093/cz/zoab055/6318776 by guest on 13 September 2021
Figure 5. Comparison of standardized residuals for each species and sub-species. Dotted red line represents the average expected value across all species for
both pinna surface area (PSA) and tympanic bulla volume (TBV) when accounting for skull and head length. Asterisks denotes species where only TBV values
were available: Microperoryctes longicauda had a species residual calculated from the average of all the species residuals of Microperoryctes species and
Perameles g. gunnii was allocated the same standardized residual as Perameles gunnii as it is a sub-species of it.
0.278 [confidence interval [CI] –0.611 to 0.001], P ¼ 0.061) where- TBV relative to log10-skull length; Figure 5). Although species-
as Tavg had minimal effect (estimate ¼ 0.020 [CI –0.123 to 0.172], average TBV was retained in the models for PSA, it was not a signifi-
P ¼ 0.714) (Figures 6d and 7a,b). cant predictor variable; similarly, species-average PSA was retained
The ED was strongly positively correlated with head length, in the models for TBV but it was not a significant predictor variable
which was retained in both top models. Species-average TBV was (Table 3). Instead, the distribution of data for both (PSA and TBV)
retained in 1 of the 2 top models but neither this value nor any of measures strongly reflected environmental patterns.
the environmental predictors significantly improved model fit
(Figure 6E).
TBV was strongly positively correlated with skull length, which Discussion
was retained in all 7 of the top phylogenetically-corrected models Hearing anatomy for bandicoots and bilbies (Peramelemorphia) is
(Model iii) (Table 3f). Species-average PSA was retained in 1 of the influenced by a species’ environment. TBV, which is typically associ-
7 top models (Table 3f). Pavg was retained in 2 of the 7 top models ated with auditory wavelength sensitivity or hearing range (Mason
(Table 3f) and had a significant effect on the global Model iii 2016), was strongly correlated with environmental factors. PSA
(estimate ¼ 0.99 [CI 1.359 to 0.634], P 0.01). Pmax and Tavg showed a weaker relationship with precipitation, which could reflect
were both retained in 2 models; Pmax was not included in the global other selective pressures in addition to sound localization acting on
Model iii due to colinearity, while Tavg had a nonsignificant effect pinnae, including thermoregulation and physical obstruction
on the global Model iii (estimate ¼ 0.308 [CI 0.256 to 0.682], (Webster 1966; Heffner et al. 1996). The relationship between TBV
P ¼ 0.184). Tmax was retained in 3 of the 7 top models; although it and PSA in bandicoots and bilbies was weak. For example, whereas
had the second highest sum of model weights (0.458 for model selec- PSA and TBV were generally positively correlated, short-nosed ban-
tion; Table 3f), it had a nonsignificant effect on the global Model iii dicoots (Isoodon spp.) had relatively small pinnae but large bullae.
(estimate ¼ 0.181 [CI 0.585 to 0.249], P ¼ 0.388). The model This finding suggests that there are independent selective pressures
excluding these 3 factors was not strongly ranked (DDIC ¼ 2.006). acting on PSA and TBV, with different relationships with precipita-
The strongest factor was a negative correlation with Pavg which tion and temperature observed.
resulted in a significant effect for the lmer global model (P < 0.01) Bulla volume had a negative relationship with precipitation and
(Figures 6F and 7C,D). (to a lesser degree) a positive relationship with temperature, both of
There was only a weak relationship between PSA (residual of which are factors reflecting environmental aridity. The largest bullae
log10-PSA relative to log10-head length) and TBV (residual of log10- were seen in the arid-dwelling bilbies (Macrotis spp.) and the moreTaylor et al. Bandicoot tympanic bulla and pinna size 9
Table 2. Results of multilevel/hierarchical analyses comparing (i) linear mixed-effect models with species as a random factor using lmer,
(ii) models with species as a random factor using MCMCglmm, and (iii) models with species and phylogeny as random factors using
MCMCglmm. Data for PSA are shown with and without the single specimen for Perameles myosuros.
Pinna surface area (PSA)
(a) with (b) without (c) Effective (d) Tympanic
Pe. myosuros Pe. myosuros Diameter (ED) bulla volume (TBV)
Random factors df BIC df BIC df BIC df BIC
Model i lmer species 8 273.36 8 274.30 8 753.05 8 753.05
Downloaded from https://academic.oup.com/cz/advance-article/doi/10.1093/cz/zoab055/6318776 by guest on 13 September 2021
Model ii glmm species 8 2399.09 8 397.42 8 918.11 8 918.11
Model iii glmm_pc Species þ phylogeny 8 397.43 8 2398.09 8 2918.43 8 2918.43
Bold indicates the model with the strongest weight of support; for PSA (a), Model ii had the strongest support but Model iii also had strong support
(DAIC ¼ 1.66); therefore we present the results for both models. For PSA, we also re-ran the analysis with and without the single Pe. myosuros specimen, as there
was shrinkage evident for this specimen.
Table 3. Summary of top models (DDIC < 2) for (a–d) PSA Models ii and iii, (e) ED Model iii and (f) TBV Model iii for 29 species of bandicoots
and bilbies (Peramelemorphia). Italics indicate the model-averaged beta coefficients for each predictor variable, and the relative importance
of variable (sw: the sum of model weights for those models that variable was included in).
(Intercept) Head length sp.-avg TBV Hab Pavg Pmax Tavg Tmax df logLik DIC delta wi
(a) Pinna Surface area (PSA) —Model ii þPe. myosuros
Model1 6.256 0.183 — — — — — — 4 223.67 439.24 0 0.273
Model2 6.406 0.182 0.266 — — — — — 5 224.00 437.83 1.40 0.135
Model3 6.242 0.185 — — — — 0.022 — 5 223.88 437.6 1.64 0.120
Average 6.301 0.183 0.266 — — — 0.022 — — — — — —
sw 1 0.201 — — — 0.279 — — — — — —
(b) Pinna surface area (PSA)—Model ii Pe. myosuros
Model1 6.265 0.185 — — — — — — 4 223.48 438.85 0 0.220
Model2 6.412 0.182 0.264 — — — — — 5 224.44 438.72 0.13 0.206
Average 6.338 0.183 0.264 — — — — — — — — — —
sw 1 0.408 — — — — — — — — — —
(c) Pinna surface area (PSA)—Model iii þPe. myosuros
Model1 6.249 0.182 — — — — — — 4 224.01 439.92 0 0.391
Average 6.249 0.182 — — — — — — — — — — —
sw 1 — — — — — — — — — — —
(d) Pinna surface area (PSA)—Model iii Pe. myosuros
Model1 6.417 0.182 0.271 — — — — — 5 223.49 436.83 0 0.191
Model2 6.246 0.184 — — — — — — 4 222.18 436.26 0.57 0.144
Model3 6.282 0.183 — — — — 0.027 — 5 222.64 435.12 1.70 0.082
Model4 6.261 0.184 — — — 0.245 — — 5 222.59 435.02 1.81 0.077
Average 6.301 0.183 0.271 — — 0.245 0.027 — — — — — —
sw 1 0.225 — — 0.18 0.105 — — — — — —
(e) Pinna effective diameter (ED)—Model iii
Model1 3.253 0.089 — — — — — — 4 483.12 958.14 0 0.299
Model2 3.328 0.089 0.138 — — — — — 5 483.37 956.59 1.55 0.138
Average 3.29 0.089 0.138 — — — — — — — — — —
sw — 1 0.304 — — — — — — — — — —
Skull length
(f) Tympanic bulla volume (TBV)—Model iii
Model1 5.068 0.208 — — 0.903 — — — 5 58.28 106.42 0 0.139
Model2 4.882 0.209 — — — 0.903 — — 5 57.97 105.8 0.62 0.102
Model3 5.037 0.206 — — — — 0.331 5 57.89 105.65 0.77 0.094
Model4 4.994 0.21 — — — — 0.237 — 5 57.79 105.44 0.97 0.085
Model5 4.885 0.214 — — — 0.772 — 0.219 6 58.41 104.61 1.81 0.056
Model6 5.046 0.206 0.623 — — — — 0.164 6 58.36 104.5 1.92 0.053
Model7 5.066 0.211 — — 0.909 — 0.145 — 6 58.34 104.46 1.95 0.052
Average 4.997 0.209 0.623 0.906 0.837 0.191 0.238 — — — — —
sw 1 0.035 0.274 0.246 0.222 0.458 — — — — —
Model ii included species as random factor; Model iii included species and phylogeny as random factors.10 Current Zoology, 2021, Vol. 00, No. 00
Downloaded from https://academic.oup.com/cz/advance-article/doi/10.1093/cz/zoab055/6318776 by guest on 13 September 2021
Figure 6. Beta estimates 695% credible intervals for predictor variables included in the global models describing (A–D) pinna surface area (PSA) (A. Model ii with
and B. without Perameles myosuros; C. Model iii with and d. without Pe. myosuros), (E) Pinna effective diameter (E, D), and (F) tympanic bulla volume (TBV) for
29 species of bandicoots and bilbies (Peramelemorphia). Variables with 95% CI that do not overlap with zero are considered influential; those with significant
P-values are indicated with bold lines. Note that this figure is derived from the global Model iii, and therefore excludes strongly correlated predictor variables.Taylor et al. Bandicoot tympanic bulla and pinna size 11
Downloaded from https://academic.oup.com/cz/advance-article/doi/10.1093/cz/zoab055/6318776 by guest on 13 September 2021
Figure 7. Predicted means (lines) and 95% CIs (shaded areas) for the effects of average precipitation (Pavg) and average temperature (Tavg) on pinna surface area
(PSA) and tympanic bulla volume (TBV), where all other factors in the global model are held constant at their mean values. Note that this figure is derived from
the lmer models, which are not corrected for phylogenetic relationships.
arid-adapted Perameles spp. (P. eremiana, P. myosuros, and P. papil- frequencies that would have limited value in dense vegetation, where
lon). Larger bullae have been similarly noted in a number of species sound can be reflected and distorted by obstructions and quickly
residing in low precipitation environments, such as rodents (Alhajeri attenuates (Michelsen and Larsen 1983; Blumenrath and Dabelsteen
et al. 2015; Alhajeri 2016; Khajeh et al. 2019), armadillos 2004). In fact, being able to hear lower frequency sounds in dense
(Cingulata; Basso et al. 2020), and some leporid lagomorphs vegetation may cause confusion and obscure high-frequency cues
(Kraatz et al. 2015). Habitat aridity and complexity impact the (Michelsen and Larsen 1983; Blumenrath and Dabelsteen 2004).
distance different sound frequencies travel and therefore which fre- Supporting this interpretation, I. m. moresbyensis, a completely differ-
quencies carry the most useful information for sound localization. ent genus of animals inhabiting the same environments in New
Arid conditions result in higher-frequency sounds attenuating at a Guinea, also had markedly smaller bullae than the Australian Isoodon
more rapid rate than in more humid conditions, and therefore species, representing a case of convergent evolution that strongly sug-
lower-frequency sounds carry more information over greater distan- gests selection against large bullae (low frequency hearing) in closed
ces than high frequencies (Knudsen 1931; Huang et al. 2002), habitats.
providing forewarning of potential predation threats. Selection for PSA showed a negative relationship with precipitation.
low-frequency hearing has contributed to relatively larger bullae in Bandicoot and bilby species residing in arid environments (e.g.,
small animals that would otherwise have limited capacity to detect C. yirratji and Macrotis spp.) had relatively large pinnae for their
low-frequency sounds that would be of use for accurate sound local- size. A negative relationship between pinna size and precipitation
ization (Lay 1972; Ravicz and Rosowski 1997). has also been noted in rodents (Rodentia) (Khajeh et al. 2019;
In contrast, bandicoot species that live in high rainfall environ- Alhajeri et al. 2020). Pinnae can alter the timing (ITD) and sound
ments (which we would expect would also have dense, closed habitat) level (ILD) of auditory cues to each middle ear (Kuhn 1987) inde-
had small tympanic bullae. This relationship was exemplified by the pendently of head size (Tollin and Koka 2009). Open, arid environ-
New Guinean species: Echymipera spp., Microperoryctes spp., and ments would select for larger pinnae that are more attuned to low
Peroryctes raffrayana. Small bullae reflect reduced reliance on low frequencies (Wightman and Kistler 1992, Jones et al. 2011) and12 Current Zoology, 2021, Vol. 00, No. 00
better sound localization through ILD cues (Jones et al. 2011) and expansion, as well as the impacts of introduced eutherian preda-
ITD cues (Wightman and Kistler 1992; King et al. 2001). For our tors, and are likely facing different environmental selective pres-
study, the ED of pinnae, a specific measure of ILD cues (Jones et al. sures. Greater range of environmental measures would add value
2011) was correlated with head length only, and showed no associ- to studies such as this one, but the basic biology of many of the
ation with the environmental factors tested. species included in these analyses is not well known. Improving
The weak positive relationship between pinna size and tempera- our understanding of these data-deficient species would be benefi-
ture could also reflect thermoregulatory function of pinnae such as cial. Finally, taxonomy of the Peramelemorphia is also a moving
seen in bilbies (Macrotis spp.) and northern pig-footed bandicoot feast (Westerman et al. 2012; Travouillon and Phillips 2018;
C. yirratji (Figure 5; Supplementary Figure S3). Whereas we have no Travouillon et al. 2019), which could add complexity to the pat-
data on the thermal biology of the extinct northern pig-footed terns observed. We applied current taxonomic divisions to this
Downloaded from https://academic.oup.com/cz/advance-article/doi/10.1093/cz/zoab055/6318776 by guest on 13 September 2021
bandicoot, bilbies are known to have low heat tolerance (Gibson Order but acknowledge that description and definition of new spe-
and Hume 2000) and escape the extreme heat of the day by residing cies within this Order are ongoing and could cast further light on
in subterranean burrows (Johnson and Johnson 1983; Abbott the ecology of this group in the future.
2001). Their large pinnae may therefore play a thermoregulatory In conclusion, there are implications of this study that could in-
role through shedding heat, as pinna size and vasculature have been fluence how we manage conservation of threatened species. A num-
linked with thermoregulation in many species (Webster 1966; ber of translocations of bilbies and bandicoot species have been
Maloiy et al. 1982), for instance, African elephants (Loxodonta undertaken (Moseby and O’Donnell 2003; Richards and Short
spp.; Young 1957; Phillips and Heath 1992) and jackrabbits (Lepus 2003; Moseby et al. 2011; Robinson et al. 2018). For these to be
spp.; Hill and Veghte 1976). Conversely, animals in cold successful, it is important to match species with appropriate release
environments tend to have smaller pinnae to reduce heat loss (Allen sites, which probably include the auditory landscape. A mismatch
1877). between predators and hearing has been observed to severely reduce
In contrast, bandicoot species from high rainfall environ- evasion success in kangaroo rats Dipodomys merriami after bulla
ments, such as the New Guinean bandicoots (Echymipera spp., size was reduced (Webster 1962). This suggests that translocating
Microperoryctes spp., and Peroryctes raffrayana) and short- species into more arid areas than their hearing is adapted to may in-
nosed bandicoots (Isoodon spp.), had relatively small pinnae for crease predation risk. For example, Pe. bougainville has been trans-
their size. In dense vegetation, high-frequency ILD cues would be located to arid, predator-proof fenced sanctuaries (e.g., Arid
of greatest value to sound localization (Heffner et al. 1996; King Recovery, South Australia; Moseby et al. 2011), but has relatively
et al. 2001). In contrast, ITD cues afforded by low-frequency smaller pinna and tympanic bulla and is therefore less adapted for
sounds would be distorted by reverberations, making it difficult hearing in arid environments than Pe. eremiana, the species that pre-
to locate the source of the sound (Giguère and Abel 1993); this viously occurred in the area (see Travouillon and Phillips 2018).
would select against large pinnae (Jones et al. 2011) (or select for Such differences may influence their survival and persistence outside
small pinnae) as lower frequency hearing would be of limited use the predator-proof sanctuary.
to species in these environments. Nonauditory factors can also
influence pinna size which may have obscured the direct relation-
ships with environmental factors. Hypothetically, large pinnae Acknowledgments
could also be a disadvantage in closed habitats where they may The authors would like to acknowledge the financial support of Murdoch
cause increased obstruction, or could be damaged during antag- University. We would also like to thank S. Ingleby and H. Parnaby of the
onistic behaviors that have been noted in these animals (Johnson Australian Museum for giving access to their collection, To K. Tullis for the
and Johnson 1983; Hall et al. 2016; Travouillon and Phillips suggestion of using a putty mold for the direct measurement of PSA. To M.
2018), but currently, there are no available data around these Westerman for sharing his phylogeny with us, and to M. Martin for sharing
possible mechanisms. the R code that was used to combine the phylogenetic trees used in the data
We recognize a number of limitations of this study. First, we had analysis. None of the authors have a conflict of interest to declare.
only a single specimen for Pe. myosoros and demonstrated that the
results of our statistical analyses were sensitive to inclusion of this
Funding
specimen. As there was some evidence of shrinkage for the speci-
men, this limits the interpretation of pinna size in this species. For This research was funded by Murdoch University.
extinct species, this limitation on data availability is inevitable.
Second, the peroryctids (Echymipera spp., Microperoryctes spp.,
Conflict of Interest
and Per. raffrayana) have an incomplete, “open” bulla compared
with the fully enclosed bony bulla present in the Australian taxa. The authors have no conflict of interest to declare.
We considered that our TBV values for these species may be under-
estimates due to this. Future work to investigate the structure of the
middle ear in these species is warranted, but requires fresh tissue,
Authors’ Contributions
not the osteological collections that we had available to us. P.F. and N.W. conceived the ideas; M.T., K.T., P.F., and N.W. designed the
Understanding the selective pressures acting on this part of the methodology; M.T., K.T., and M.A. collected the data; M.T. and P.F. ana-
skull may be informative regarding how these animals interact lyzed the data; M.T. led the writing of the manuscript. All authors contrib-
uted critically to the drafts and gave final approval for publication.
with their environment. Third, the predictor variables used in the
analyses were broad and derived from geographic distribution
maps that necessarily used a mix of historic and current ranges to
obtain environmental data. Many peramelemorphian species have Supplementary Material
recently experienced large range reductions due to human “Supplementary material can be found at https://academic.oup.com/cz”.Taylor et al. Bandicoot tympanic bulla and pinna size 13
References Huang GT, Rosowski JJ, Ravicz ME, Peake WT, 2002. Mammalian ear spe-
cializations in arid habitats: structural and functional evidence from sand
Abbott I, 2001. The Bilby Macrotis lagotis (Marsupialia: Peramelidae) in
cat Felis margarita. J Comp Physiol A Neuroethol Sens Neural Behav
south-western Australia: original range limits, subsequent decline, and pre-
Physiol 188:663–681.
sumed regional extinction. Rec West Aust Mus 20:271–305.
Hunt RM, 1974. The auditory bulla in carnivora: an anatomical basis for re-
Alhajeri BH, 2016. A phylogenetic test of the relationship between saltation
appraisal of carnivore evolution. J Morphol 143:21–75.
and habitat openness in gerbils (Gerbillinae, Rodentia). Mammal Res 61:
Huxman TE, Smith MD, Fay PA, Knapp AK, Shaw MR et al., 2004. Convergence
231–241.
across biomes to a common rain-use efficiency. Nature 429:651–654.
Alhajeri BH, Fourcade Y, Upham NS, Alhaddad H, 2020. A global test of
Johnson C, Johnson K, 1983. Behaviour of the bilby Macrotis lagotis (Reid),
Allen’s rule in rodents. Glob Ecol Biogeogr 29:2248–2260.
(Marsupialia: Thylacomyidae) in captivity. Wildlife Res 10:77–87.
Alhajeri BH, Hunt OJ, Steppan SJ, 2015. Molecular systematics of gerbils and
Johnson CN, Isaac JL, 2009. Body mass and extinction risk in Australian mar-
deomyines (Rodentia: Gerbillinae, Deomyinae) and a test of desert adapta-
Downloaded from https://academic.oup.com/cz/advance-article/doi/10.1093/cz/zoab055/6318776 by guest on 13 September 2021
supials: the ‘Critical Weight Range’ revisited. Austral Ecol 34:35–40.
tion in the tympanic bulla. J Zool Syst Evol Res 53:312–330.
Jones HG, Koka K, Thornton JL, Tollin DJ, 2011. Concurrent development of
Alhajeri BH, Steppan SJ, 2018. A phylogenetic test of adaptation to deserts
the head and pinnae and the acoustical cues to sound location in a preco-
and aridity in skull and dental morphology across rodents. J Mammal 99:
cious species, the chinchilla Chinchilla lanigera. JARO J Assoc Res
1197–1216.
Otolaryngol 12:127–140.
Allen JA, 1877. The influence of physical conditions in the genesis of species.
Keen JA, Grobbelaar CS, 1940. The comparative anatomy of the tympanic
Radic Rev 1:107–140.
bulla and auditory ossicles, with a note suggesting their function. Trans R
Barton K, Barton MK, 2020. Multimodel Inference; Package ‘MuMIn’.
Soc South Africa 28:307–329.
https://cran.r-project.org/web/packages/MuMIn/MuMIn.pdf
Khajeh A, Mohammadi Z, Ghorbani F, Meshkani J, 2019. Variation of the audi-
Bates D, Maechler M, Bolker B, Walker S, Christensen R.H.B, Singmann H,
tory system in the Indian gerbil Tatera indica Hardwicke, 1807 (Muridae,
Dai B, Grothendieck G, Eigen C, Rcpp L, 2014. Package ‘lme4’. R
Rodentia) from the east of Iran. J Asia Pac Biodivers 12:139–143.
Foundation for Statistical Computing, Vienna.
Khanna SM, Tonndorf J, 1969. Middle ear power transfer. Arch Klin Exp
Basso AP, Sidorkewicj NS, Casanave EB, 2017. Methods for estimating the
Ohren Nasen Kehlkopfheilkd 193:78–88.
volume of the tympanic bulla in the big hairy armadillo Chaetophractus
King AJ, Schnupp JWH, Doubell TP, 2001. The shape of ears to come: dynam-
villosus (Mammalia, Xenarthra, Dasypodidae). Int J Morphol 35:
ic coding of auditory space. Trends Cogn Sci 5:261–270.
128–132.
Knudsen VO, 1931. The effect of humidity upon the absorption of sound in a
Basso AP, Sidorkewicj NS, Casanave EB, Mason MJ, 2020. The middle ear of
room, and a determination of the coefficients of absorption of sound in air. J
the pink fairy armadillo Chlamyphorus truncatus (Xenarthra, Cingulata,
Acoust Soc Am 3:126–138.
Chlamyphoridae): comparison with armadillo relatives using computed
Koricheva J, Gurevitch J, 2014. Uses and misuses of meta-analysis in plant
tomography. J Anat 236:809–826.
ecology. J Ecol 102:828–844.
Blumenrath SH, Dabelsteen T, 2004. Degradation of great tit Parus major
Kraatz BP, Sherratt E, Bumacod N, Wedel MJ, 2015. Ecological correlates to
song before and after foliation: implications for vocal communication in a
cranial morphology in leporids (Mammalia, Lagomorpha). PeerJ 3:e844.
deciduous forest. Behaviour 141:935–958.
Kuhn GF, 1987. Physical acoustics and measurements pertaining to directional
Boncoraglio G, Saino N, 2007. Habitat structure and the evolution of bird
hearing. In: Yost WA, Gourevitch G, editors. Directional Hearing.
song: a meta-analysis of the evidence for the acoustic adaptation hypothesis.
Proceedings in Life Sciences. New York, USA: Springer. 3–25.
Funct Ecol 21:134–142.
Lay DM, 1972. The anatomy, physiology, functional significance and evolution
Chamberlain SA, Hovick SM, Dibble CJ, Rasmussen NL, Van Allen BG et al.,
of specialized hearing organs of gerbilline rodents. J Morphol 138:41–120.
2012. Does phylogeny matter? Assessing the impact of phylogenetic infor-
Lüdecke D, 2019. Package ggeffects: Tidy Data Frames of Marginal Effects from
mation in ecological meta-analysis. Ecol Lett 15:627–636.
Regression Models. Journal of Open Source Software 3:772.
Cooper ML, 2000. Temporal variation in skull size and shape in the southern
Maloiy GMO, Kamau JMZ, Shkolnik A, Meir M, Arieli R, 1982.
brown bandicoot Isoodon obesulus (Peramelidae: Marsupialia) in Western
Thermoregulation and metabolism in a small desert carnivore: the fennec
Australia. Aust J Zool 48:47–57.
fox Fennecus zerda (Mammalia). J Zool 198:279–291.
Cruz-Neto AP, Garland T, Abe AS, 2001. Diet, phylogeny, and basal metabol-
Mason MJ, 2016. Structure and function of the mammalian middle ear I: large
ic rate in phyllostomid bats. Zoology 104:49–58.
middle ears in small desert mammals. J Anat 228:284–299.
Driessen MM, Rose RK, 2015. Isoodon obesulus (Peramelemorphia:
McKenzie NL, Burbidge AA, Baynes A, Brereton RN, Dickman CR et al.,
Peramelidae). Mamm Species 47:112–123.
2007. Analysis of factors implicated in the recent decline of Australia’s
Fick SE, Hijmans RJ, 2017. Worldclim 2: new 1-km spatial resolution climate
mammal fauna. J Biogeogr 34:597–611.
surfaces for global land areas. Int J Climatol 37:4302–4315.
Michelsen A, Larsen ON, 1983. Strategies for acoustic communication in
Flannery T, 1995. Mammals of New Guinea. Chatswood, New South Wales,
complex environments. In: Huber F, Markl H, editors. Neuroethology and
Australia: Reed Books.
Behavioral Physiology. Berlin, Heidelberg: Springer-Verlag. 321–331.
Gibson LA, Hume ID, 2000. Seasonal field energetics and water influx rates of
the greater bilby Macrotis lagotis. Aust J Zool 48:225–239. Moseby KE, O’Donnell E, 2003. Reintroduction of the greater bilby Macrotis
Giguère C, Abel SM, 1993. Sound localization: effects of reverberation time, lagotis (Reid) (Marsupialia: Thylacomyidae), to northern South Australia:
speaker array, stimulus frequency, and stimulus rise/decay. J Acoust Soc Am survival, ecology and notes on reintroduction protocols. Wildlife Res 30:
94:769–776. 15–27.
Hadfield JD, 2010. MCMC methods for multi-response generalized linear Moseby KE, Read JL, Paton DC, Copley P, Hill BM et al., 2011. Predation
mixed models: the MCMCglmm R package. J Stat Softw 33:1–22. determines the outcome of 10 reintroduction attempts in arid South
Hall LS, Chamberlin R, Curtis LK, Parish S, Mason M, 2016. Field Guide to Australia. Biol Conserv 144:2863–2872.
Australian Mammals. New South Wales, Australia: Pascal Press. Nakagawa S, Santos ESA, 2012. Methodological issues and advances in bio-
Harvey PH, Pagel MD, 1991. The Comparative Method in Evolutionary logical meta-analysis. Evol Ecol 26:1253–1274.
Biology. Oxford: Oxford University Press. Noble DWA, Lagisz M, O’Dea RE, Nakagawa S, 2017. Nonindependence
Heffner H, Heffner R, 2008. High-Frequency Hearing. Handbook of the and sensitivity analyses in ecological and evolutionary meta-analyses. Mol
Senses: Audition. Vol. 3. New York, USA: Elsevier. 55–60. Ecol 26:2410–2425.
Heffner RS, Koay G, Heffner HE, 1996. Sound localization in chinchillas III: Onar V, 1999. A morphometric study on the skull of the German shepherd
effect of pinna removal. Hear Res 99:13–21. dog (Alsatian). Anat Histol Embryol 28:253–256.
Hill RW, Veghte JH, 1976. Jackrabbit ears: surface temperatures and vascular Pavlinov I, Rogovin KA, 2000. The correlation of the size of the pinna and the
responses. Science 194:436. auditory bulla in specialized desert rodents. Zh Obshch Biol 61:87–101.You can also read