Bookkeeping estimates of the net land-use change flux - a sensitivity study with the CMIP6 land-use dataset - MPG ...
←
→
Page content transcription
If your browser does not render page correctly, please read the page content below
Earth Syst. Dynam., 12, 763–782, 2021
https://doi.org/10.5194/esd-12-763-2021
© Author(s) 2021. This work is distributed under
the Creative Commons Attribution 4.0 License.

       Bookkeeping estimates of the net land-use change flux –
         a sensitivity study with the CMIP6 land-use dataset
           Kerstin Hartung1,a , Ana Bastos1,2 , Louise Chini3 , Raphael Ganzenmüller1 , Felix Havermann1 ,
       George C. Hurtt3 , Tammas Loughran1 , Julia E. M. S. Nabel4 , Tobias Nützel1 , Wolfgang A. Obermeier1 ,
                                                  and Julia Pongratz1
                1 Department of Geography, Ludwig-Maximilians-Universität München, Munich, Germany
                                2 Max Planck Institute for Biogeochemistry, Jena, Germany
                 3 Department of Geographical Sciences, University of Maryland, College Park, MD, USA
                                4 Max Planck Institute for Meteorology, Hamburg, Germany
                a now at: Deutsches Zentrum für Luft- und Raumfahrt, Institut für Physik der Atmosphäre,

                                               Oberpfaffenhofen, Germany
                               Correspondence: Kerstin Hartung (kerstin.hartung@dlr.de)

                               Received: 14 December 2020 – Discussion started: 11 January 2021
                            Revised: 6 April 2021 – Accepted: 13 May 2021 – Published: 30 June 2021

      Abstract. The carbon flux due to land-use and land-cover change (net LULCC flux) historically contributed to a
      large fraction of anthropogenic carbon emissions while at the same time being associated with large uncertainties.
      This study aims to compare the contribution of several sensitivities underlying the net LULCC flux by assessing
      their relative importance in a bookkeeping model (Bookkeeping of Land Use Emissions, BLUE) based on a
      LULCC dataset including uncertainty estimates (the Land-Use Harmonization 2 (LUH2) dataset). The sensitivity
      experiments build upon the approach of Hurtt et al. (2011) and compare the impacts of LULCC uncertainty (a
      high, baseline and low land-use estimate), the starting time of the bookkeeping model simulation (850, 1700
      and 1850), net area transitions versus gross area transitions (shifting cultivation) and neglecting wood harvest
      on estimates of the net LULCC flux. Additional factorial experiments isolate the impact of uncertainty from
      initial conditions and transitions on the net LULCC flux. Finally, historical simulations are extended with future
      land-use scenarios to assess the impact of past LULCC uncertainty in future projections.
         Over the period 1850–2014, baseline and low LULCC scenarios produce a comparable cumulative net LULCC
      flux, while the high LULCC estimate initially produces a larger net LULCC flux which decreases towards the end
      of the period and even becomes smaller than in the baseline estimate. LULCC uncertainty leads to slightly higher
      sensitivity in the cumulative net LULCC flux (up to 22 %; references are the baseline simulations) compared to
      the starting year of a model simulation (up to 15 %). The contribution from neglecting wood harvest activities
      (up to 28 % cumulative net LULCC flux) is larger than that from LULCC uncertainty, and the implementation
      of land-cover transitions (gross or net transitions) exhibits the smallest sensitivity (up to 13 %). At the end of
      the historical LULCC dataset in 2014, the LULCC uncertainty retains some impact on the net LULCC flux
      (±0.15 PgC yr−1 at an estimate of 1.7 PgC yr−1 ). Of the past uncertainties in LULCC, a small impact persists
      in 2099, mainly due to uncertainty of harvest remaining in 2014. However, compared to the uncertainty range of
      the LULCC flux estimated today, the estimates in 2099 appear to be indistinguishable.
         These results, albeit from a single model, are important for CMIP6 as they compare the relative importance of
      starting year, uncertainty of LULCC, applying gross transitions and wood harvest on the net LULCC flux. For
      the cumulative net LULCC flux over the industrial period, the uncertainty of LULCC is as relevant as applying
      wood harvest and gross transitions. However, LULCC uncertainty matters less (by about a factor of 3) than the
      other two factors for the net LULCC flux in 2014, and historical LULCC uncertainty is negligible for estimates
      of future scenarios.

Published by Copernicus Publications on behalf of the European Geosciences Union.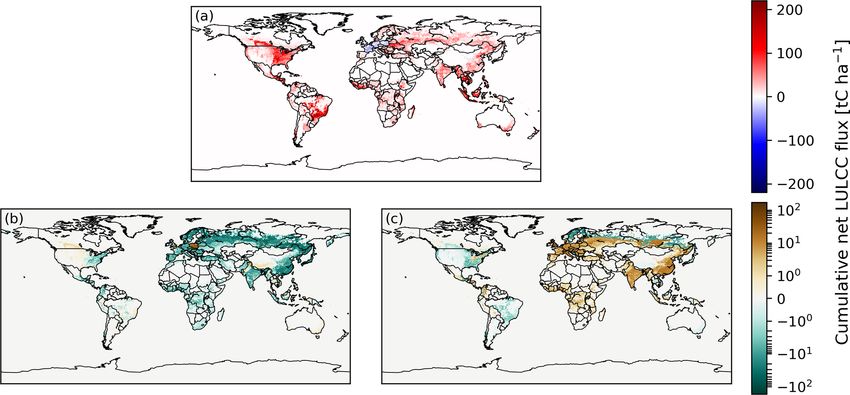
764                                                K. Hartung et al.: Bookkeeping estimates of the net land-use change flux

1   Introduction                                                  et al., 2016), and more recent Global Carbon Budget (GCB)
                                                                  estimates switched from 1860 to 1700 as a starting year for
                                                                  DGVM simulations (Le Quéré et al., 2018; Friedlingstein
Globally, the historical net carbon flux due to land-use and      et al., 2019, 2020).
land-cover change (net LULCC flux) has been positive (i.e. a         Example studies from bookkeeping(-like) models compar-
source: flux from land to the atmosphere). The net LULCC          ing the impact of properties across at least two of the above-
flux makes up a considerable part of overall anthropogenic        listed categories are Hurtt et al. (2011) and Gasser et al.
carbon emissions and is associated with large uncertainties.      (2020). In the Hurtt et al. (2011) sensitivity study based on
During the period 2009–2018, Friedlingstein et al. (2019) es-     the LUH1 dataset (Chini et al., 2014), the authors analysed
timate the net LULCC flux to be 1.5 ± 0.7 PgC yr−1 and to         over 1600 simulations with respect to model “factors” like
make up about 14 % of total anthropogenic carbon emissions.       the simulation start date, the choice of historical and future
Alternatively, Lawrence et al. (2016) discuss different esti-     agricultural land-use and wood harvest scenarios, and in-
mates of the contribution from the net LULCC flux to total        clusion of shifting cultivation. The simulation outputs were
anthropogenic emissions of up to 45 %, depending on the de-       compared across a variety of metrics and diagnostic tools in-
tails of the comparison (years and flux components consid-        cluding secondary area and mean age, global gross and net
ered).                                                            transitions, and cumulative gross and net loss of aboveground
   Since the net flux from LULCC cannot be directly mea-          biomass. Their analysis showed that the most relevant factors
sured, we can only rely on values calculated by models,           were the start date and the inclusion of both shifting cultiva-
for example dynamic global vegetation models (DGVMs)              tion and wood harvesting. The LUH2 dataset (Hurtt et al.,
and bookkeeping models. Bookkeeping models (Houghton,             2020) responded to these findings by developing a dataset
2003; Houghton and Nassikas, 2017; Hansis et al., 2015)           that started in 850, with improved representations of the spa-
combine observation-based carbon densities with LULCC             tial patterns of both shifting cultivation and wood harvest-
estimates to determine the net LULCC flux. DGVMs, on the          ing based on remote-sensing data. Gasser et al. (2020) use
other hand, model the evolution of carbon pools on a process-     a hybrid model (the OSCAR model) combining bookkeep-
based level and also react to climate impacts and trends.         ing properties (tracking the effect of LULCC activities) and
   Differences in model estimates of the net LULCC flux can       biogeophysical properties from a DGVM to estimate uncer-
have different origins, broadly falling into three categories:    tainties acting on annual and cumulative CO2 emissions. The
(i) the underlying LULCC reconstruction and its uncertain-        focus in Gasser et al. (2020) is on the relative importance
ties, (ii) the LULCC practises considered (e.g. wood harvest      of biogeophysical parameters, the LULCC dataset – either
and shifting cultivation) and (iii) model assumptions (e.g. pa-   the LUH2 or the FRA (Forest Resources Assessment, FAO,
rameterisations of processes like type and lifetime of wood       2015) dataset – and the inclusion of the LASC (loss of ad-
products). Considering point (i), several global multi-century    ditional sink capacity, e.g. Pongratz et al., 2014) to the net
LULCC reconstructions exist (i.e. Pongratz et al., 2008; Ka-      LULCC flux. The latter property constitutes one of the main
plan et al., 2011; Klein Goldewijk et al., 2017; Hurtt et al.,    differences of the resulting flux estimates between DGVMs
2020). Furthermore, several studies isolated and quantified       and bookkeeping models and is due to changes in carbon
the impact on the net LULCC flux of the individual compo-         densities caused by varying atmospheric CO2 concentrations.
nents of the three categories listed above: (i) the impact of     Gasser et al. (2020) find that the largest variation in flux esti-
the choice of LULCC dataset (Hurtt et al., 2006; Pongratz         mates is induced by biogeophysical parameters (mainly car-
et al., 2008; Stocker et al., 2011); (ii) the importance of ne-   bon densities), followed by the definition of the LULCC flux
glecting or modelling wood harvest (Stocker et al., 2014;         (i.e. including or excluding LASC). The LULCC dataset is
Arneth et al., 2017) and shifting cultivation (Hurtt et al.,      found to cause the least uncertainty cumulatively, though the
2011; Wilkenskjeld et al., 2014; Stocker et al., 2014; Ar-        trend of the annual LULCC flux based on the two datasets
neth et al., 2017); and (iii) the model assumptions, for exam-    has opposing signs in recent years.
ple, using either DGVMs or bookkeeping models (Houghton              The goal of our study is to build upon previous approaches
et al., 2012; Gasser et al., 2020). The starting year of a sim-   (e.g. Hurtt et al., 2011 and Gasser et al., 2020) to assess a va-
ulation can either be seen as part of the LULCC itself (cate-     riety of the above-mentioned sensitivities of the net LULCC
gory i) or a model assumption (category iii) and is a good ex-    flux with a single underlying LULCC dataset reporting un-
ample of a very common uncertainty across different model         certainty (LUH2, Hurtt et al., 2020) and the bookkeeping
types: despite the Land-Use Harmonization 2 (LUH2) land-          model BLUE (Bookkeeping of Land Use Emissions, Hansis
use change data being available from the year 850, Coupled        et al., 2015). The LUH2 dataset (Hurtt et al., 2020) provides
Model Intercomparison Project phase 6 (CMIP6) simulations         historical land-use estimates from 850 with uncertainty esti-
start by default in 1850 (Eyring et al., 2016), contributions     mates for agricultural land area (from the History Database
to the Land Use Model Intercomparison Project (LUMIP)             of the Global Environment, HYDE; Klein Goldewijk et al.,
assess different starting dates of 1700 and 1850 (Lawrence

Earth Syst. Dynam., 12, 763–782, 2021                                                https://doi.org/10.5194/esd-12-763-2021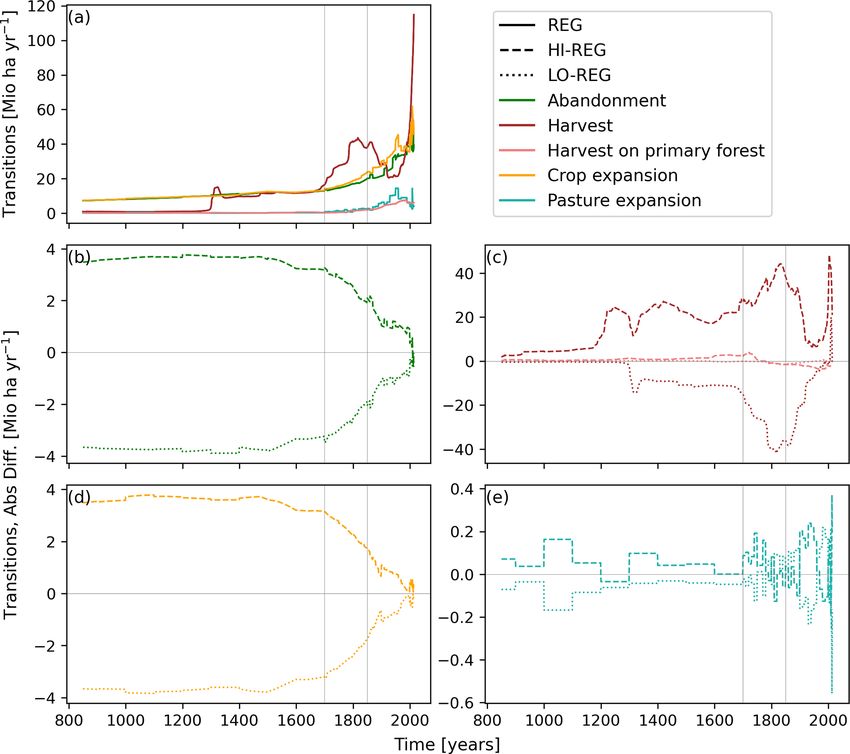
K. Hartung et al.: Bookkeeping estimates of the net land-use change flux                                                       765

2017) and wood harvest (Zon and Sparhawk, 1923; Kaplan            LULCC scenarios as well as various future scenarios are in-
et al., 2017). The dataset captures the challenge of recon-       troduced. Finally, an overview of the conducted BLUE ex-
structing the LULCC of the past. LUH2 is the land-use             periments is given. A brief description of how the LUH2
dataset that is – besides many other studies – also applied       dataset is prepared for use with the BLUE model and short
in CMIP6 (Eyring et al., 2016) for simulations with process-      discussion of the properties of the LULCC dataset are pro-
based DGVMs, like in LUMIP (Lawrence et al., 2016). Our           vided in the Appendix (Sects. A1 and A2).
findings and discussions regarding DGVM studies are there-
fore also informative for the interpretation of CMIP6 results.    2.1   The bookkeeping model BLUE
BLUE is a data-driven bookkeeping model (Hansis et al.,
2015) used in the GCB for LULCC flux estimates (Friedling-        BLUE (Hansis et al., 2015) is a data-driven, semi-empirical
stein et al., 2019). We choose a bookkeeping model in con-        bookkeeping model. Initial areas of the four land-cover types
trast to a DGVM because LULCC fluxes due to individual            (primary land, secondary land, cropland and pasture) de-
LULCC events can be traced and because of the potential to        termine the amount of carbon stored in soil and vegeta-
isolate the net LULCC flux independent of climate variabil-       tion biomass prior to tracked LULCC activities. These ini-
ity, among other factors (Pongratz et al., 2014).                 tial “equilibrium pools” are determined from observation-
   Due to the high computational efficiency of the bookkeep-      based carbon densities and are non-zero for the carbon as-
ing model, several sensitivity experiments can be produced        sociated with the soil component undergoing slow relax-
and an exhaustive comparison of common factors impacting          ation processes and the vegetation biomass. LULCC activ-
the total net LULCC flux is possible. Here, the impact of         ities, i.e. land-use transitions, take the model state away from
modelling wood harvest and shifting cultivation as land man-      equilibrium, increasing or decreasing so-called disequilib-
agement processes is compared to the impact of uncertain-         rium pools. BLUE considers four LULCC activities: aban-
ties of the LULCC dataset and the initialisation year of the      donment (cover change from crop or pasture to secondary
LULCC simulation. We design additional artificial sensitiv-       land), clearing for cropland or pasture (cover change from
ity experiments to disentangle the uncertainty from the initial   primary land, secondary land, crop or pasture to crop or pas-
land-cover distribution and the uncertainty from LULCC ac-        ture) and wood harvest (cover change from primary to sec-
tivities (transitions). By extending the historical simulations   ondary land, or land management on secondary land). As
under future LULCC scenarios, we can then estimate the im-        wood harvest is the only type of harvest modelled in BLUE,
pact of past uncertainty on future estimates of the net LULCC     it is abbreviated as “harvest” in the following. Disequilibrium
flux.                                                             pools exist for vegetation, soil undergoing fast and slow re-
   Our study thus provides an extension to previous studies       laxation processes, and products from harvest and clearing
comparing sensitivities across a different set of factors by      with lifecycles of 1, 10 and 100 years. Response curves char-
also disentangling the relevance of the initial land-cover dis-   acterise the temporal adjustment of the disequilibrium pools
tribution compared to the uncertainties in LULCC activities       after a transition to the new equilibrium, where the differ-
on the net LULCC flux. In addition, it updates the sensitiv-      ence in carbon stocks, namely the content of the disequilib-
ities of, e.g. wood harvest and shifting cultivation based on     rium pools, is steadily emitted to the atmosphere. The version
a more recent LULCC dataset, which is also the basis for          of BLUE used here and in the GCB is based on 11 natural
CMIP6, using one bookkeeping model.                               plant functional types (PFTs), of which 6 represent forested
   The analysis of the simulations is guided by two main          biomes, and 2 agricultural PFTs (crop and pasture). More in-
questions: (1) how do LULCC uncertainties influence the           formation on the BLUE model can be found in Hansis et al.
overall emitted carbon? (2) What uncertainties remain at the      (2015).
end of the historical period and how much do they influ-              For the analysis, it is useful to note a few additional
ence future projections? For both questions, the global net       model assumptions. If two simulations are based on the same
LULCC flux as well as separation by LULCC activity and            LULCC dataset but start in different years (y2 > y1 ), then ar-
by different regions are considered. This analysis can serve      eas of the four cover types will be identical in year y2 , but the
as a reference for subsequent sensitivity analyses with com-      disequilibrium carbon pools and the resulting flux to the at-
plex models (DGVMs, ESMs) and points to model and data            mosphere will not be identical. As the simulation that started
choices which matter most for modelling of land-use-related       in y2 is based on the initial land cover of that year, it will
changes in the carbon cycle.                                      only track LULCC activities occurring after y2 and not all
                                                                  the activities that have happened since y1 , as in the first case.
                                                                  Moreover, two simulations can have an identical cumulative
2   Model description, LULCC dataset and experiment               LULCC flux up to a given year, but because they might be as-
    setup                                                         sociated with different disequilibrium pools, the subsequent
                                                                  evolution of fluxes can differ (see, for example, Fig. 2). This
As a first step, we present the bookkeeping model BLUE            also applies to net LULCC flux caused by LULCC activi-
used in this study. Then the LUH2 dataset, its high and low       ties during the simulation but occurring after the end of the

https://doi.org/10.5194/esd-12-763-2021                                               Earth Syst. Dynam., 12, 763–782, 2021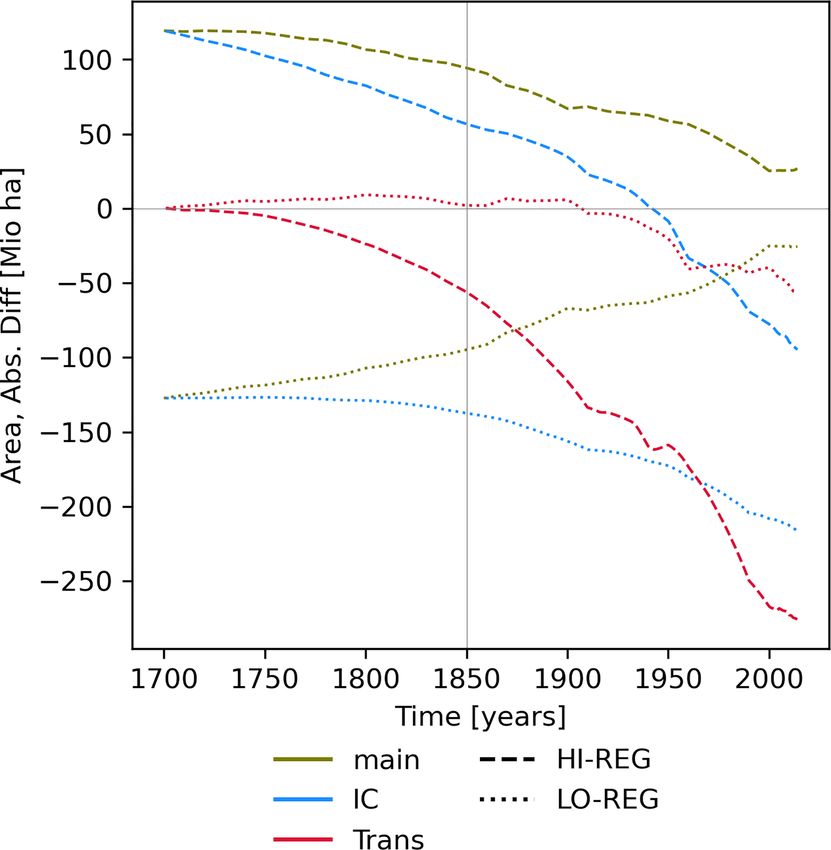
766                                                 K. Hartung et al.: Bookkeeping estimates of the net land-use change flux

simulation (e.g. decay of long-lived harvested wood prod-          nual wood harvest data from the Food and Agriculture Orga-
ucts), which are not tracked in the applied setup of the BLUE      nization (FAO) to provide annual states and transitions.
model. The first assumption, to only track LULCC activities           Results from four future scenarios are also included in this
subsequent to the start year, is specific to the model world.      analysis, namely two Shared Socioeconomic Pathway (SSP)
The second assumption, to only account for the net LULCC           scenarios, SSP4-3.4 and SSP4-6.0, by the Global Change As-
flux which already happened and not for the total net LULCC        sessment Model (GCAM) and two SSP5 scenarios, SSP5-8.5
flux that a LULCC activity causes, is more common also to          and SSP5-3.4OS, by the Model of Agricultural Production
policies.                                                          and its Impact on the Environment (MAgPIE) (Riahi et al.,
                                                                   2017; Popp et al., 2017; Calvin et al., 2017; Hurtt et al., 2020)
                                                                   for the period 2015–2100. SSP4 describes an inequality sce-
2.2   The LUH2 dataset                                             nario with low challenges to mitigation and high challenges
                                                                   to adaptation. SSP5, on the other hand, is characterised by
Detailed descriptions of the LUH2 data, the agricultural area      fossil-fuelled development with high challenges to mitiga-
dataset HYDE and their uncertainty assessments are given           tion and low challenges to adaptation. In the following, the
in Klein Goldewijk et al. (2017) and Hurtt et al. (2020) for       scenarios are referred to by their SSPs and their Represen-
HYDE3.2 and LUH2, respectively.                                    tative Concentration Pathways (RCPs) and not mainly by
   The LUH2 historical dataset provides a time series of an-       the Integrated Assessment Model (IAM) that produced them,
nual, fractional land use and gross transitions on a 0.25◦ ×       i.e. GCAM or MAgPIE. Hurtt et al. (2020) give a more de-
0.25◦ grid for the period 850–2015, though transitions are         tailed summary of the properties of the different land-use sce-
only available until 2014. Land use is characterised as ur-        narios. Of all available future scenarios, these four were se-
ban land, cropland (annual and perennial C3 and C4 crops           lected for this study because they are based on the same two
as well as C3 nitrogen fixers), managed pasture and range-         SSP scenarios but describe a range of possible RCP scenar-
land, as well as natural vegetation (forested and non-forested,    ios. For each of the different scenarios, no further uncertainty
primary and secondary land). Rangelands are distinguished          ranges are provided, but the set of scenarios is used to ex-
from managed pastures by an aridity index and population           plore the impact of past LULCC uncertainties on the future
density from the HYDE dataset and can imply a land-cover           net LULCC flux. More information is given in Appendix A2.
change (e.g. in Brazil’s Cerrado) but can also simply mean a          It should be noted that the LUH2 dataset, as proposed by
different management of the original land-cover type (e.g. in      CMIP6, does not capture the full range of uncertainty but
the semi-dry regions of Australia). In addition to five wood       is an estimate based on the available data (Klein Goldewijk
harvest transitions on primary and secondary, forested and         et al., 2017; Hurtt et al., 2020). Importantly, annual updates
non-forested land (for secondary forested land is further di-      to the LUH2 data, for use in the GCB, are provided when
vided by forest age), gross land-use transitions are available     further/new information becomes available, and customised
between the different land-use types. Wood harvest is char-        versions of the LUH2 data have been produced for use in
acterised alternatively by the harvested area or the removed       specific studies (e.g. Frieler et al., 2017). In particular, the
biomass. Land-use states and transitions are available for a       last years of the baseline LUH2 scenario have been substan-
baseline scenario and two additional scenarios which in this       tially revised for subsequent analyses related to the annual
study are used to quantify the uncertainty of the LULCC            GCB. This includes updates in the underlying agricultural
dataset: a high scenario assumes more land-use activity at         data from the FAO but also revisions of regionally incon-
the start of the LULCC dataset in 850 than in the baseline,        sistent data (e.g. erroneous data in Brazil in the GCB 2018
whereas the low scenario starts off with less land-use activ-      results, Le Quéré et al., 2018; Bastos et al., 2020). These cor-
ity, and vice versa at the end of the dataset.                     rections are not included in the current CMIP6 dataset.
   The uncertainty in agricultural area is estimated in the
HYDE dataset and linked to population uncertainty. The lat-        2.3   Experimental setup and analysis
est version of the HYDE dataset, HYDE3.2, provides data
every 100 years until 1700, every 10 years between 1700            We conduct 39 historical (from 850, 1700 or 1850 until 2015)
and 2000, and every year after 2000. The LUH2 dataset uses         and 12 future (2015–2100) simulations to quantify the rel-
agricultural data from the uncertainty range A of the HYDE         ative importance of the uncertainty in the LULCC dataset
product, an uncertainty range based on literature and expert       on the historical net LULCC flux with respect to other com-
judgement. The uncertainty in primary and secondary land is        mon uncertainties. Although land-use states are available un-
estimated in the LUH2 dataset partly through application of        til 2015 and 2100, the net LULCC flux based on the tempo-
three different wood harvest estimates based on two differ-        ral change in carbon pools can only be calculated until 2014
ent datasets before 1920 (Zon and Sparhawk, 1923; Kaplan           and 2099, respectively. In all experiments, the model is run
et al., 2017) and partly through the different gross transitions   at the spatial resolution of the LUH2 dataset (0.25◦ × 0.25◦ )
arising from the different LULCC time series. For the LUH2         with an annual time step.
dataset, HYDE data are interpolated and combined with an-

Earth Syst. Dynam., 12, 763–782, 2021                                                 https://doi.org/10.5194/esd-12-763-2021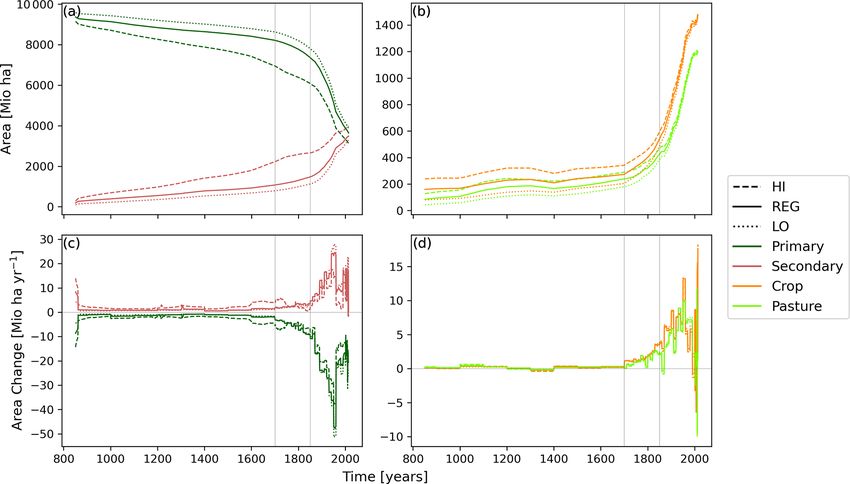
K. Hartung et al.: Bookkeeping estimates of the net land-use change flux                                                        767

Table 1. Naming of the main experiments based on LUH2 scenar-        To disentangle these effects, we conduct additional BLUE
ios with low, baseline and high LULCC and three different starting   simulations based on artificial LULCC information which is
years.                                                               not proposed by LUH2. Instead, it uses the original (REG)
                                                                     area initial conditions and adapted transitions (HI or LO)
         LULCC       850         1700         1850                   in experiments called Trans, or vice versa for initial condi-
         Low         LO850       LO1700       LO1850                 tion (IC) sensitivity experiments. Thus, the areas of these
         Baseline    REG850      REG1700      REG1850                simulations in 2014 are not consistent with the LUH2 dataset
         High        HI850       HI1700       HI1850                 (see Fig. A4). Indeed, the IC experiment with LO initial con-
                                                                     ditions and the Trans experiment with HI number of LULCC
                                                                     activities deviate significantly from the range of agricultural
                                                                     area in the main experiments (HI, REG and LO). This dif-
   The nine main experiments (Table 1) combine the un-               ference between simulations is associated with increased re-
certainty of the LUH2 scenarios (REG, LO and HI scenar-              maining primary land areas. Compared to REG1700, the dif-
ios) with different starting years and thus allow to com-            ference in primary land in 2014 is about 10 %–20 %, with
pare the relative uncertainty due to LULCC with the start-           lower values for HI IC and LO Trans setups initialised
ing year (StYr). StYr is varied between two pre-industrial           in 1700. The smallest differences in IC and Trans experi-
years (850 and 1700) and one marking approximately the               ments are found for the deviations from REG850, and dif-
beginning of the industrial era (1850). While most CMIP6             ferences in REG1850 are of similar magnitude to those dis-
historical model simulations start in 1850, previous studies         cussed for REG1700. However, these deviations of primary
discuss potential problems of initialising the model in 1850.        land area from the LUH2 dataset are still smaller than those
For example, Pongratz et al. (2009) found evidence for sub-          caused by not considering wood harvest (not shown).
stantial anthropogenic emissions already before 1850, which             By neglecting information on some of the LULCC activi-
is commonly associated with pre-industrial conditions. An-           ties from the input dataset, simulations without wood harvest
other example is DGVM simulations conducted for the an-              and with net instead of gross transitions can be produced (see
nual GCB: since GCB2018 (Le Quéré et al., 2018), simu-               Table 2). Note that the net LULCC flux is an aggregate of all
lations have been started in 1700 in order to reduce model           sources and sinks due to LULCC in 1 year and is not linked
initialisation effects in the time spans considered (i.e. af-        to net transitions; i.e. net and gross land-use transitions must
ter 1850). The three starting years chosen here thus represent       not be mixed up with the net or gross LULCC flux.
a range of options from the literature. All nine main simula-           Each of the three main simulations with starting year 1700
tions are produced by taking into account wood harvest and           (Table 1) is continued following each of the four future land-
gross transitions as provided by the LUH2 dataset. REG1700           use scenarios until 2100 (Table 3) to produce a total of 12
corresponds to the scenarios used in the GCB and is consid-          simulations for the period 2015–2100 (with net LULCC flux
ered the standard experiment.                                        calculated for the period 2015–2099). The experiments con-
   It should be noted that the extent of the LULCC areas in          tinuing from HI1700 and LO1700 are artificial because the
BLUE sometimes differs from the LUH2 input dataset, even             area distribution of land-cover types is not set up to match
for the nine main experiments, mainly because of a mis-              in 2015. However, differences in agricultural land are small
match in PFTs between the LUH2 (harvest) input and the               (Fig. A1), and changes in forest transitions are larger in fu-
BLUE model. For simulations that started in 1700 and 1850,           ture scenarios than differences between LULCC scenarios
the difference in primary land extent in 2014 is at most 4 %         in 2014/15 (not shown).
(Fig. A5), which is also true for REG and LO in 850. How-
ever, HI850 does end with about 12 % more primary land               3   Results and discussion
in 2014 than the LUH2 dataset. In all cases, the amount of
primary land is larger in BLUE than in the original LUH2             The time series of all three historical uncertainty estimates
dataset, at the cost of other land-cover types. Overall, this        (Fig. 1) shows the known feature of a peak in 1960 (Hansis
means that the total amount of net LULCC flux will be un-            et al., 2015; Friedlingstein et al., 2019). Before around 1960,
derestimated in BLUE, the most in the HI850 experiment.              the net LULCC flux is almost continuously rising and lev-
More information is provided in Sect. A2.                            els decrease after 1960 to the end of the historical LULCC
   In addition to the nine main experiments, we conduct              dataset in 2014. Around 2000, the annual net LULCC flux is
30 sensitivity experiments (Tables 2 and 3) in order to              of similar magnitude to that in the early 20th century.
(i) compare the sensitivity due to LULCC and StYr to other
LULCC properties and (ii) to assess how historical uncer-
tainty propagates into future scenarios.
   The three LUH2 LULCC estimates differ not only in the
temporal evolution of the LULCC activities but also in their
initial areas, especially when the simulation starts after 850.

https://doi.org/10.5194/esd-12-763-2021                                                 Earth Syst. Dynam., 12, 763–782, 2021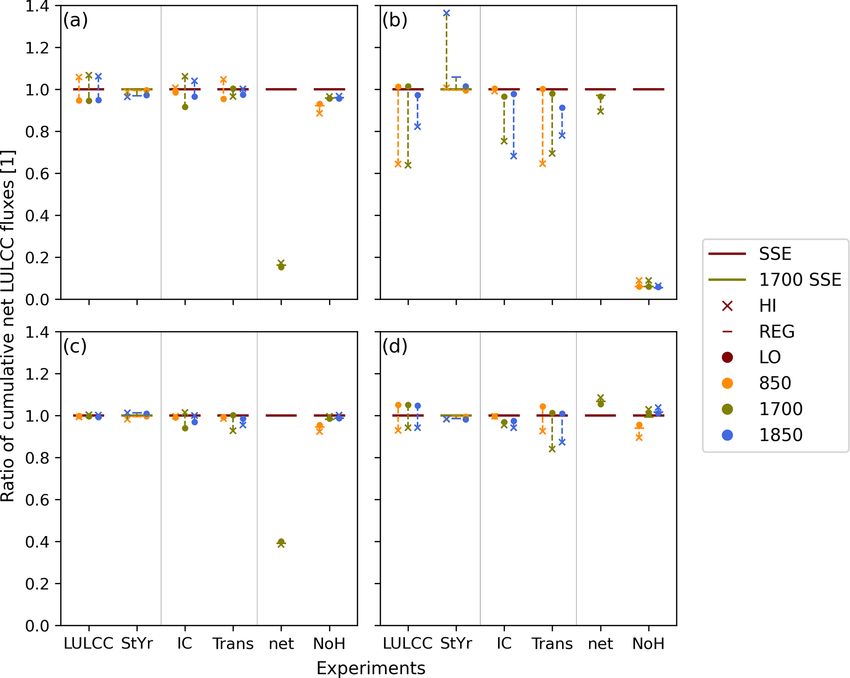
768                                                      K. Hartung et al.: Bookkeeping estimates of the net land-use change flux

Table 2. Overview of main experiments (first two rows; see also Table 1) and additional sensitivity experiments (third to fifth rows). The
first column gives the abbreviation of the experiment type described in the second column, and the last three columns provide reference sim-
ulations for the uncertainty analysis (more information in Fig. 3). If not specified otherwise, simulations are conducted with all three starting
years (850, 1700 and 1850) and simulated for HI, REG and LO. The two setups with changes to initial conditions (IC) and transitions (Trans)
modify the LUH2 dataset and are artificial. To find a reference simulation, the row and column of the last table section can be combined
to give one experiment setup (note that LULCC and StYr do not modify the setup, but IC, Trans, net and NoH do). If several reference
experiments are given, the ordering is the same as in the column header.

                                                                                           Reference simulations
            Name      Description of experiments                       LO/REG/HI 850         LO/REG/HI 1700        LO/REG/HI 1850
            LULCC     Main experiments, varying LULCC                  REG850                REG1700               REG1850
            StYr      Main experiments, varying starting year          LO/REG/HI 1700        LO/REG/HI 1700        LO/REG/HI 1700
            IC        IC from HI or LO and transitions from REG        REG850                REG1700               REG1850
            Trans     IC from REG and transitions from HI or LO        REG850                REG1700               REG1850
            net       Net transitions (only 1700)                      –                     LO/REG/HI 1700        –
            NoH       No wood harvest                                  LO/RE/HI 850          LO/REG/HI 1700        LO/REG/HI 1850

Table 3. Overview of future sensitivity experiments, continued from simulations with starting year 1700 for all three LULCC scenarios (see
Table 2).

                               Name            Description of sensitivity experiments
                               SSP4-3.4        Scenario 2014–2099 based on GCAM with RCP3.4
                               SSP4-6.0        Scenario 2014–2099 based on GCAM with RCP6.0 (baseline)
                               SSP5-3.4OS      Overshoot scenario 2014–2099 based on MAgPIE with RCP3.4
                               SSP5-8.5        Scenario 2014–2099 based on MAgPIE with RCP8.6 (baseline)

                                                                           mulative net LULCC flux is similar in experiments REG
                                                                           and LO. (2) Starting a simulation in 1850, rather than ear-
                                                                           lier, leads to a larger cumulative net LULCC flux over the pe-
                                                                           riod 1850–2014. Finally, (3) although HI produces the largest
                                                                           net LULCC flux initially, this is not true throughout and es-
                                                                           pecially at the end of the simulation. The increased land-use
                                                                           dynamics in LO in later times let LO exceed HI in terms of
                                                                           cumulative net LULCC flux at some point in time, which we
                                                                           will call a crossing point.
                                                                              Feature (1) is not in conflict with a roughly symmetric un-
                                                                           certainty of harvest, which at first could be assumed to result
                                                                           in equal difference in net LULCC flux between HI/REG and
Figure 1. Global annual net LULCC flux for simulations with start          LO/REG. However, harvest on forested primary land, which
year 1700 and HI, REG and LO LULCC scenarios of the LUH2                   is most important for the net LULCC flux, is similar between
dataset (LO1700, REG1700 and HI1700). From 2014 onwards,                   REG and LO (Fig. A2) and thus causes the similarity in net
each of the three historical simulations is continued with four dif-       LULCC flux. Harvest on secondary land does not produce
ferent scenarios of future LULCC.                                          a net flux to the atmosphere if considered over a long time-
                                                                           period (total source is equivalent to total sink). From about
                                                                           1800 onwards, less harvest on primary land can be observed
3.1     How do LULCC uncertainties influence overall                       in the HI LULCC estimate, slightly more in LO and the most
        emitted carbon?                                                    in REG.
                                                                              Feature (2) develops because the timescale of regrowth
3.1.1    Temporal variability of uncertainty
                                                                           (sink of carbon flux, i.e. flux from atmosphere to land) is
The temporal evolution of the cumulative net LULCC flux                    longer than that of clearing/harvest (source). The feature can
in the nine main simulations (Fig. 2) exhibits three central               be seen by comparing the orange and green crosses, repre-
features over the common period (1850–2014): (1) the cu-                   senting the cumulative net LULCC flux for the period 1850–

Earth Syst. Dynam., 12, 763–782, 2021                                                           https://doi.org/10.5194/esd-12-763-2021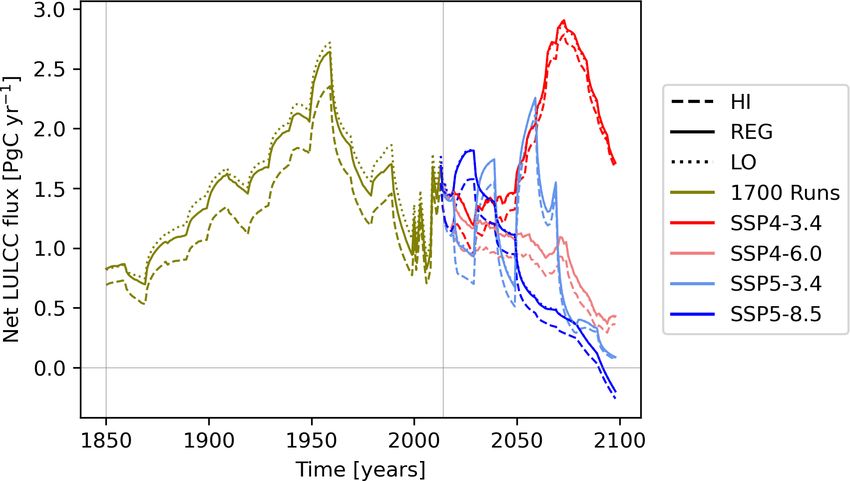
K. Hartung et al.: Bookkeeping estimates of the net land-use change flux                                                                 769

                                                                         Figure 3. Comparison of global cumulative net LULCC flux be-
Figure 2. Global cumulative net LULCC flux since the start of the        tween 1850 and 2014 for various simulations, normalised with a
individual simulations. The flux in the land-use scenario HI, REG        respective reference/standard sensitivity experiment (SSE, see also
and LO (compare lines with same colour) and the relevance of start-      Table 2): REGtt for LULCC (first column), xx1700 for start year
ing date (compare same line style across colours) are shown. The         (second column), REGtt for IC and Trans experiments (third to
three crosses in 2014 represent the total cumulative net LULCC flux      fourth columns), and xxtt for net and NoH experiments (fifth and
of the three REG experiments (REG850, REG1700 and REG1850)               sixth columns). Here, tt (xx) means that the reference year (land-use
if the flux is only calculated for the period 1850–2014. Note that the   scenario) varies for each experiment in the respective column. Ref-
orange and green crosses overlap and are only partly visible.            erence examples are REG1850 for HI1850 in the LULCC compari-
                                                                         son, REG1700 for REG1850 in the StYr comparison and LO850 for
                                                                         LO850NoH in the NoH comparison. The colour of the connecting
2014 in REG850 and REG1700 respectively, with the blue                   lines represents the reference simulations.
cross for REG1850 in Fig. 2.
   Finally, feature (3) can be explained by the link between
LULCC and the net LULCC flux. If one scenario has contin-                the cumulative net LULCC flux comparing experiments with
uously more LULCC than another, it will continue to pro-                 different StYr are produced in simulations from 1850 (sec-
duce a larger net LULCC flux, and therefore no crossing                  ond column). The net cumulative LULCC flux is more sensi-
points will occur. However, if the rate of LULCC varies dif-             tive to the LULCC uncertainty (22 % range in flux) and less
ferently with time in two scenarios, then the simulation with            sensitive to the starting year of the simulation (15 %). The
an initially larger number of LULCC activities exhibits fewer            magnitude of the net LULCC flux of HI – REG is often not
transitions towards the end. More information on properties              the same as the REG – LO difference even though the vari-
and origins of crossing points in our analysis is given in Ap-           ability of LULCC is asymmetric around REG. For the stan-
pendix B1.                                                               dard setup (REG1700), the influence of LULCC uncertainty
                                                                         (HI1700 and LO1700) is about 3 times larger than the sensi-
3.1.2   Comparison of components of uncertainty                          tivity to StYr (REG850, REG1850). These results are insen-
                                                                         sitive to the specific results of HI850, which shows a larger
As discussed in the previous section and shown in Fig. 2,                deviation from the LUH2 input dataset than the other exper-
Fig. 3 similarly shows that the cumulative net LULCC flux                iments (Fig. A5).
in the LO scenario (filled circles) exceeds the values in the               The artificial sensitivity experiments (IC and Trans) re-
HI scenario (crosses), and that REG (horizontal dash) and                veal that the sensitivity to ICs (visible as the spread across
LO produce more similar cumulative net LULCC fluxes. The                 LULCC estimates) increases more the later the simulation
main analysis is restricted to comparison of the net cumula-             starts (Fig. 3, second and third columns). Considering Trans,
tive LULCC flux between 1850 and 2014, but a discussion of               the sensitivity of the cumulative net LULCC flux decreases
the comparison over the full respective time periods is given            with later starting year. These relative temporal characteris-
in Appendix B2.                                                          tics can easily be explained by the divergence of land-use
   The cumulative net LULCC flux exhibits a reduced sensi-               states from 850 to 1850 (Fig. A1a) and generally decreas-
tivity to LULCC uncertainty with starting year 1850 (com-                ing uncertainty of LULCC activities with time (i.e. visible
pare vertical spread of blue markers in the LULCC column)                in uncertainty of agricultural areas decreasing after 1700,
since the input data have smaller uncertainty in more recent             Fig. A4). As the extent of agricultural areas increases af-
years (Fig. A1). At the same time, the largest estimates of              ter 1700, the reduced amount of agricultural land in IC and

https://doi.org/10.5194/esd-12-763-2021                                                       Earth Syst. Dynam., 12, 763–782, 2021
770 K. Hartung et al.: Bookkeeping estimates of the net land-use change flux
Trans experiments (Fig. A4) implies fewer transitions to crop Sensitivity of the cumulative net LULCC flux to harvest
and pasture. This likely explains why for simulations with is mainly found for HI setups (LULCC column) and any
start year 1700 all sensitivity experiments exhibit lower or LULCC simulation started in 1850 (StYr column). As men-
at most equal cumulative net LULCC flux than the refer- tioned in Sect. 3.1.1, harvest primarily results in net fluxes
ence scenario REG1700. The sensitivity of the cumulative associated with the primary-to-secondary land transitions.
net LULCC flux due to uncertainties in transitions (Trans) is The difference in these fluxes when comparing to HI ver-
larger (up to 21 %) than that due to IC (between a few per- sus REG setups is much greater than the differences between
cent to 11 %). Note that the sensitivity of net LULCC flux to the REG versus LO setups (Fig. 2). Similarities in REG and
IC and Trans is not expected to be additive to the total sensi- LO harvest on primary land are thus in line with similar net
tivity combining initial conditions and transitions (the LUH2 LULCC flux estimates in those experiments. This also ex-
input in columns LULCC and StYr) for several reasons: the plains why REG850 and LO850 produce similar amounts
biosphere and soil stocks are not in equilibrium at the end of of harvest emissions until 1700 (Fig. 2), although their to-
a simulation (e.g. Stocker et al., 2011), and as already men- tal harvested area is different. Both harvest and pasture ex-
tioned, the simulations start and end with different land-cover pansion exhibit larger cumulative net LULCC flux in LO
distributions. than HI experiments (Fig. 4b and d), while the opposite is
The sensitivity of the cumulative net LULCC flux to net true for abandonment (Fig. 4a), and crop expansion shows
versus gross transitions (Fig. 3, fifth column, about 13 % for minimal differences between the two experiments (Fig. 4c).
REG1700) is of a similar order of magnitude as that from the The LULCC activity showing the best agreement between
starting year of a simulation (StYr). Furthermore, all setups the three LULCC scenarios is crop expansion (Fig. 4c): re-
roughly exhibit the same ratio of net LULCC flux with net or sults of HI and LO experiments, as well as with StYr 850
gross transitions. and 1850, deviate little from REG1700 (columns LULCC
Neglecting harvest has a larger impact on the cumulative and StYr). Thus, most of the comparably large uncertainty
net LULCC flux (up to 28 % reduction) than the total sen- of crop transitions presented in Fig. A2 is associated with
sitivity to the uncertainty of LULCC (Fig. 3, sixth column). shifting cultivation and does not impact the net LULCC flux.
Harvest is also the main driver of the asymmetry between The sensitivity of the net LULCC flux to the uncertainty
cumulative net LULCC fluxes from HI/REG/LO scenarios from pasture expansion (Fig. 4d) is larger from transitions
after 1850. Omitting harvest causes the least reduction in HI (Trans, fourth column) than from initial conditions (IC, third
and the most in REG, which can be explained by the relative column). This can be explained by the fact that the agri-
amount of deforestation on forested primary land. cultural area (Fig. A4) shows a larger spread in Trans (red
The main conclusions from the comparison of the given line) than IC experiment (blue line) towards the end of the
estimates of LUH2 LULCC uncertainty with other sources time series, which is larger than that between the HI, REG
of sensitivity to the cumulative net LULCC flux over the pe- and LO experiments (green lines) in both setups. Similarly
riod 1850–2014 are that (1) the net LULCC flux is most sen- to findings from the main experiments, the order of IC ex-
sitive to accounting for wood harvest (decrease of up to 28 % periments for harvest and pasture (which show largest net
without wood harvest), (2) the sensitivity due to LULCC un- LULCC flux in the LO scenario) is opposed to crop and aban-
certainty (22 %) is larger than from StYr (15 %), (3) the cu- donment (largest net LULCC flux in the HI scenario), which
mulative net LULCC flux is similarly sensitive to StYr and is likely related to shifting cultivation. A reduction of the cu-
net versus gross transitions (13 %), and (4) later starting years mulative net LULCC flux in the IC and Trans experiments
reduce sensitivity to uncertainties in LULCC activities and initialised in 1700 or 1850 is both due to reduced contribution
increase sensitivity to uncertainties in initial conditions. from harvest and pasture (only IC) and the opposite ordering
of LULCC experiment in crop and abandonment contribu-
3.1.3 Impact of uncertainties of different LULCC tions.
activities on net LULCC flux The use of net instead of gross LULCC forcing leads to
the largest decrease in the net LULCC flux components from
The relative ordering of the impact of uncertainties of abandonment and crop expansion (80 % and 60 %, respec-
LULCC activities on the net LULCC flux (vertical spread tively), which can be expected due to shifting cultivation.
of experiments in the LULCC column) is as follows: har- Net transitions slightly decrease the contribution from har-
vest contributes the most (up to 40 % relative to the reference vest and increase the contribution from pasture expansion
setup, Fig. 4b) and uncertainties in abandonment and pasture to the net LULCC flux, both by about 10 %. The latter is
expansion cause approximately equal shares of sensitivity in most likely caused by pasture expansion occurring on pre-
total net LULCC flux (about ±10 %, Fig. 4a and d), which is viously less intensively used land with thus larger carbon
larger than LULCC uncertainty for crop expansion (Fig. 4c). stocks. If wood harvest is neglected, all other LULCC ac-
Note that abandonment is a carbon sink; thus, values larger tivities approximately produce the same spread of cumula-
than 1 indicate a stronger sink. tive net LULCC flux; i.e. the ratio of a simulation with and
without wood harvest is about 1 (see Table 2 for reference
Earth Syst. Dynam., 12, 763–782, 2021 https://doi.org/10.5194/esd-12-763-2021K. Hartung et al.: Bookkeeping estimates of the net land-use change flux 771
Figure 4. Global cumulative net LULCC flux as in Fig. 3a for the period 1850–2014 but separated by LULCC activity: (a) abandonment,
(b) harvest, (c) crop expansion and (d) pasture expansion. Normalisation is done individually for each LULCC activity. SSE refers to the
standard sensitivity experiment.
simulations). Only the net LULCC flux from simulations in large coherent areas over Central and North America and
starting 850 is slightly reduced. Note that in the experiments northern Europe/Asia with reduced cumulative net LULCC
without harvest, the cumulative net LULCC flux from har- flux in LO1700 compared to REG1700.
vest is not zero because a small contribution of transitions Some regions with reduced emissions in the HI scenario,
from primary to secondary land due to rangeland expansion like Poland and south-east Asia, correspond to regions where
is counted as harvest. fewer transitions of the LUH2 input data are used (Fig. A5),
The analysis of the contributions from the four LULCC which is further enhanced in the HI – REG comparison.
activities to the total net LULCC flux sensitivity reveals that Further division by LULCC activity is discussed in the
(1) LULCC uncertainty from harvest causes largest sensitiv- following and shown in the Supplement (see Fig. S1). Cu-
ity in the cumulative net LULCC flux, followed by equal con- mulative net LULCC flux estimates are most sensitive to
tributions from abandonment and pasture and negligible sen- harvest uncertainties, mainly over northern Europe, northern
sitivity due to crop uncertainty. For harvest, the sensitivity is Asia and south-eastern Asia (China and north-eastern India).
asymmetric; i.e. the net LULCC flux due to harvest in the Components of the cumulative net LULCC flux due to uncer-
HI scenario deviates further from REG than in the LO sce- tainty of crop expansion and abandonment follow the pattern
nario. (2) Uncertainties in wood harvest cause large sensitiv- of shifting cultivation in the tropics, which means that the
ity to starting year of the simulation (StYr), as well as to IC sensitivity to uncertainties in abandonment and crops is bal-
and Trans in the artificial LULCC experiments. anced with the opposite sign. The largest sensitivity of the
cumulative net land-use flux to LULCC using net transitions
is present over Europe from abandonment and over India and
3.1.4 Regional variations of uncertainty south-east Asia from uncertainties in crop transitions. The
sensitivity of the net LULCC flux to uncertainties of pasture
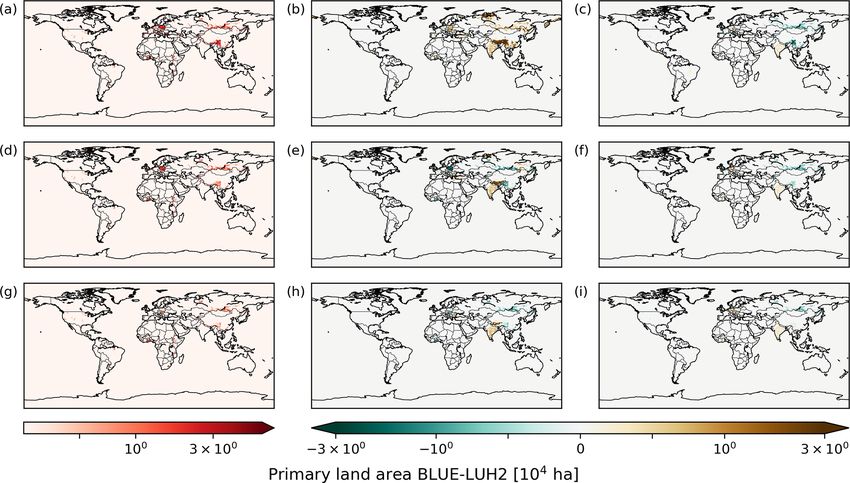
Europe, Asia and Africa exhibit the largest sensitivity of cu- and overall uncertainty of LULCC over Oceania is relatively
mulative net LULCC flux to LULCC uncertainties in the small. Interestingly, the cumulative net land-use change flux
REG, HI and LO simulations starting in 1700 (Fig. 5). In over Oceania is larger in HI1700 rather than LO1700 because
most regions, HI1700 produces a smaller cumulative net few transitions occur before 1700, so basically all transitions
LULCC flux than REG1700 and the cumulative flux is gen- are captured in the analysis period.
erally larger in LO1700 than REG1700. However, there are
https://doi.org/10.5194/esd-12-763-2021 Earth Syst. Dynam., 12, 763–782, 2021772 K. Hartung et al.: Bookkeeping estimates of the net land-use change flux
Figure 5. Cumulative net LULCC flux for the period 1850–2014 from REG1700 (a) as well as the difference HI1700 – REG1700 (b) and
LO1700 – REG1700 (c).
3.2 How does past uncertainty impact future scenarios?
3.2.1 The current state
Next, we want to analyse the magnitude of legacy emissions
at the end of the historical simulations in 2014 and how much
they are affected by past LULCC uncertainty. The magni-
tude of the annual net LULCC flux is determined by the size
of the disequilibrium pools, which aggregate information of
past LULCC events. If these disequilibrium pools are sim-
ilar between two setups in a given year and the upcoming
LULCC events are identical, then the annual net LULCC flux
in the following years will be similar as well.
In 2014, the annual net LULCC flux is 1.7 PgC yr−1 in
REG1700 (Fig. 6). Neglecting wood harvest (NoH) or only
using net transitions (net) leads to 3 times larger devia-
tions from the reference (see Table 2) than LULCC uncer-
tainties (first column) and reduces the net LULCC flux at Figure 6. Global annual net LULCC flux in 2014. Although the
most to about 1.1 PgC yr−1 . The 5 %–10 % sensitivity of overall layout is as in Fig. 3, the y axis is not scaled by a reference
the net LULCC flux to LULCC uncertainties (about 1.55 to simulation but presents the total net emissions in 2014. Note that
1.75 PgC yr−1 ) can mainly be explained by the uncertainty the experiment groups (LULCC and StYr) are now combined as the
of transitions. Almost no sensitivity of the net LULCC flux presented values show the absolute net LULCC flux.
to the starting year of the model simulations remains. The
impact of StYr and LULCC uncertainty on the net LULCC
flux in 2014 is similar to the characteristics discussed for 3.2.2 Estimates of future emissions
the cumulative net LULCC flux estimates (Fig. 3). LULCC
The extensions of the 12 scenario simulations as a continua-
differences still modulate annual net LULCC flux estimates
tion of the three historical simulations with starting year 1700
throughout the 20th century (Fig. S2), and the largest vari-
are shown in Fig. 1. The underlying area changes are pre-
ability of net LULCC flux, about ±0.1 to 0.3 PgC yr−1 , is
sented in Fig. A3, and the attribution of emissions to different
due to uncertainties in harvest and abandonment. In 2014,
land-use histories is shown in the Supplement (Fig. S3). Ta-
the largest impact of the remaining differences is due to har-
ble 4 provides the annual and cumulative emissions of the 12
vest (about ±0.05–0.1 PgC yr−1 ).
scenario simulations. For each experiment, the first number
is the SSP setup and the second the prescribed RCP value.
Earth Syst. Dynam., 12, 763–782, 2021 https://doi.org/10.5194/esd-12-763-2021K. Hartung et al.: Bookkeeping estimates of the net land-use change flux 773
Table 4. Annual net LULCC flux [PgC yr−1 ] in 2014 for historical mulative net LULCC fluxes over the 21st century, since fossil
simulations (Hist) starting in 1700 and in 2099 for four SSP scenar- fuel emissions are substituted partly by energy from biofuel
ios. For the REG experiments, the cumulative net LULCC flux of (Hurtt et al., 2020). This biofuel production causes additional
the future scenarios (2014–2099) is included in brackets [PgC]. cropland expansion and thus leads to net LULCC fluxes from
LULCC (see Fig. S3c). Still, the total carbon emissions are
Hist SSP4-3.4 SSP4-6.0 SSP5-3.4OS SSP5-8.5 expected to be larger in the baseline than the RCP3.4 scenar-
HI 1.54 1.67 0.36 0.07 −0.26 ios.
REG 1.69 1.71 (162) 0.43 (82) 0.09 (87) −0.2 (69)
LO 1.78 1.68 0.42 0.08 −0.2
3.3 Evaluation against previous studies
Our baseline scenario (REG1700) exhibits a cumulative net
LULCC flux of 242 PgC for the period 1850–2014. The
Land use in the baseline SSP4 scenario (SSP4-6.0) leads sensitivity range due to LULCC uncertainty and starting
to a relatively steady decline of the net LULCC flux over the year is about 22 % for comparable setups. In the nine main
21st century. More stringent mitigation policies (RCP3.4) re- experiments, the cumulative net LULCC flux is at least
sult in an initial plateau of the net LULCC flux up to the mid- 201 PgC (HI850) and at most 264 PgC (LO1850). The rel-
dle of the 21st century, followed by a peak in the second half ative change due to neglecting gross transitions is similar
of the 21st century of similar magnitude to the maximum in across LULCC setups, and for REG1700net the cumulative
the 1950s. This peak is mainly caused by crop expansion and net LULCC flux is reduced to 211 PgC. Wood harvest causes
a reduced sink from abandonment connected to a reduction the largest sensitivity in the cumulative net LULCC flux (the
of secondary land area from about 2050 (Fig. S3a and c). flux in REG1700NoH is 175 PgC).
The baseline SSP5 scenario (SSP5-8.5) on the other hand The sensitivity results presented here are limited by the
starts off with a minor maximum of the net LULCC flux fact that (i) initial and final areas of land cover are not the
which is followed by a declining estimate. The initial peak in same in the different experiments, (ii) the disequilibrium
SSP5 is mainly caused by pasture expansion and wood har- pools are not the same in 2014 because timescales of harvest
vest (Fig. A3); the evolution of secondary land and cropland and regrowth differ (no committed emissions), (iii) the uncer-
is similar to that in the SSP4 baseline, but less area is used tainty range of LUH2 is not exhaustive but represents known
for pasture. Overall, the net LULCC flux in 2099 is lower uncertainties (unintuitively, the known uncertainty is larger
than in SSP4-6.0 by about 0.6 PgC yr−1 . In the alternative in data-rich regions), and (iv) BLUE does not use 100 % of
3.4OS scenario, which differs from the SSP5 baseline mainly the suggested transitions from the LUH2 input dataset.
after 2040, a secondary peak after around 2050 is present, Point (iv) mostly affects usability of results from experi-
mainly caused by crop expansion over pasture. ment HI850. Considering the whole time period, HI850 pro-
Remaining sensitivities to LULCC uncertainties in future duces results between HI850NoH and the setup suggested
scenarios are due to harvest (Fig. S3) and decrease towards by the LUH2 dataset but is closer to the latter. As differences
the end of the 21st century but do not reach zero in 2099. of primary land area in 2014 between the LUH2 dataset and
These uncertainties in harvest also explain why the remain- the BLUE experiments are otherwise uniform across LULCC
ing spread of net LULCC flux is larger in HI than LO, similar scenario experiments, the qualitative properties of the results
to the historical period. will be valid also if accurately using the whole dataset.
The estimates of annual net LULCC flux estimates Over the period 1850–2014, the cumulative LULCC flux
in 2099 (Table 4) indicate a reduction of sensitivity to as determined by GCB2019 (Friedlingstein et al., 2019) is
LULCC uncertainties from ±0.15 PgC yr−1 to between 195 ± 60 PgC, compared to 400 ± 20 PgC from fossil fuels.
±0.07 and ±0.02 PgC yr−1 , respectively, for SSP4-6.0 and The baseline scenario is thus included in the GCB2019 un-
SSP5-3.4OS. Note that with an accuracy of the net LULCC certainty range; the sensitivity range of the cumulative net
flux of 0.1 PgC yr−1 , a difference in the future scenarios due LULCC flux due to LULCC uncertainty is smaller than
to LULCC uncertainty only remains in SSP5-8.5. The differ- the uncertainty in GCB2019, but the sensitivity due to in-
ence in net LULCC flux between historical LULCC uncer- clusion of wood harvest is of similar magnitude. However,
tainty setups for individual scenarios in 2099 is about 50 % towards the end of the historical time series, the sensi-
of their spread in 2014. This reduction occurs the most in tivity of the net LULCC flux to LULCC uncertainty and
RCP3.4 scenarios. In both SSP4 and SSP5, the cumulative to all other parameters is somewhat smaller than the un-
net LULCC flux is larger with lower RCP value (values in certainty presented in Friedlingstein et al. (2019) of 1.5 ±
brackets in Table 4). The impact of the initial uncertainty 0.7 PgC yr−1 (2008–2019). Around the baseline estimate
is thus further reduced relative to the magnitude of the net of 1.7 PgC yr−1 (REG1700), LULCC adds asymmetrically
LULCC flux in 2099, if followed by a larger cumulative net about ±0.15 PgC yr−1 and without harvest or gross transi-
LULCC flux. Scenarios with reduced radiative forcing due to tions the net LULCC flux in 2014 is reduced by 0.6 PgC yr−1 .
increased mitigation action (RCP3.4) produce increased cu- The importance of LULCC uncertainty for net LULCC flux
https://doi.org/10.5194/esd-12-763-2021 Earth Syst. Dynam., 12, 763–782, 2021774 K. Hartung et al.: Bookkeeping estimates of the net land-use change flux
decreases with time and therefore is more relevant for the cu- 4 Conclusion
mulative net LULCC flux than for the annual value in 2014.
DGVM-based modelling studies of Stocker et al. (2014) This study investigates the impact of LULCC uncertainties
and Arneth et al. (2017) agree that the contribution from compared to other common uncertainties on modelling of
shifting cultivation, i.e. gross transitions, and wood harvest LULCC fluxes with the bookkeeping model BLUE, like the
are of similar magnitude and increase the net LULCC flux, representation of wood harvest and shifting cultivation.
though both studies base their estimates on different time pe- We show that the sensitivity of the net LULCC flux to
riods and are therefore not necessarily comparable. Stocker the uncertainty of LULCC based on the LUH2 dataset is
et al. (2014) quantify the contribution to the total net LULCC not negligible and may explain part of the large uncertainty
flux at 19 % each from wood harvest and shifting cultivation range of DGVMs as part of the GCB (Friedlingstein et al.,
over the period 2000–2009, which can be added to the base 2019), since LULCC processes are captured with varying
value of 1.2 PgC yr−1 . In Arneth et al. (2017), the estimate comprehensiveness (see Table A1 in Friedlingstein et al.,
of a 30 % increase to the base value of 119±50 PgC due to 2019). The LULCC uncertainty has a comparable impact
both shifting cultivation and wood harvest is obtained with on the cumulative net LULCC flux to including harvest and
seven DGVMs and valid for the period 1901–2014. Wilken- gross transitions, while its impact on most recent annual es-
skjeld et al. (2014) find a reduction of the cumulative net timates is about 3 times smaller. For the starting years pre-
LULCC flux by 38 % if shifting cultivation is not consid- sented here (850, 1700 or 1850), the spread in cumulative
ered (1850–2005). The estimates found here with the book- net LULCC flux is about the same order as that from in-
keeping model BLUE and the LUH2 dataset (a 13 % de- cluding gross transitions but can be neglected for annual
crease by neglecting shifting cultivation and 28 % decrease fluxes in recent years. This means that it is of little impor-
by neglecting wood harvest) are thus comparable in magni- tance for estimates of the net LULCC flux over recent years
tude to previous studies, despite using a different modelling when a simulation was started, but it is important for cumula-
approach. tive fluxes, with relevant implications for comparisons of the
These results are also largely consistent with the findings GCB and CMIP6 model simulations. However, not account-
of Hurtt et al. (2011), in which the contributions of shifting ing for gross transitions and wood harvest, as is sometimes
cultivation and wood harvesting were the model factors that still the case in DGVMs, can cause even larger differences
the simulation output, in terms of the net LULCC flux, was between model estimates. Finally, it should be noted that
most sensitive to. In comparison to Hurtt et al. (2011), it can the two alternative LULCC scenarios (low and high land-use
be noted that sensitivities might look different in other met- scenarios) produce relatively smaller or larger estimates of
rics like forest age or area. Although the spatial and temporal the net LULCC flux than the LUH2 baseline scenario de-
representation of these processes has been significantly im- pending on the time period considered.
proved in LUH2 (versus LUH1), the choice of whether or Furthermore, the difference in net LULCC flux between
not to include these processes in DGVM simulations is still a high and low land-use scenarios is expected to be larger in
large contributor to the overall uncertainty in LULCC fluxes. DGVMs than in a bookkeeping model as they are influenced
However, assuming that the sensitivity in net LULCC flux by a higher CO2 concentration exposure via the loss of ad-
from one LULCC dataset with uncertainties (based on the ditional sink capacity. In DGVM simulations, a higher CO2
LUH2 dataset presented here) is similar to the comparison of exposure will most likely lead to larger vegetation and soil
two LULCC datasets (Gasser et al., 2020), results in Gasser carbon stocks in the 20th century in low simulations as com-
et al. (2020) point towards even larger contributions from, pared to high land-use simulations. The increasing number
e.g. uncertainties in carbon densities (both spatially and tem- of transitions in the 20th century in the low land-use simula-
porally). tions will thus increase the difference in emissions between
the two alternative scenarios. Another difference that can in-
fluence results comparing bookkeeping models and DGVMs
is that the former approach uses constant (present-day) car-
bon densities, while DGVMs work with variable carbon den-
sities which respond to environmental conditions. Neverthe-
less, the results presented here provide a reference for com-
parisons with the upcoming CMIP6 model simulations.
Earth Syst. Dynam., 12, 763–782, 2021 https://doi.org/10.5194/esd-12-763-2021You can also read