DIPS-Plus: The Enhanced Database of Interacting Protein Structures for Interface Prediction
←
→
Page content transcription
If your browser does not render page correctly, please read the page content below
DIPS-Plus: The Enhanced Database of Interacting
Protein Structures for Interface Prediction
Alex Morehead∗ Chen Chen
University of Missouri University of Missouri
acmwhb@missouri.edu chen.chen@missouri.edu
arXiv:2106.04362v1 [q-bio.QM] 6 Jun 2021
Ada Sedova Jianlin Cheng
Oak Ridge National Laboratory University of Missouri
sedovaaa@ornl.gov chengji@missouri.edu
Abstract
How and where proteins interface with one another can ultimately impact the
proteins’ functions along with a range of other biological processes. As such,
precise computational methods for protein interface prediction (PIP) come highly
sought after as they could yield significant advances in drug discovery and design
as well as protein function analysis. However, the traditional benchmark dataset for
this task, Docking Benchmark 5 (DB5) [1], contains only a paltry 230 complexes for
training, validating, and testing different machine learning algorithms. In this work,
we expand on a dataset recently introduced for this task, the Database of Interacting
Protein Structures (DIPS) [2, 3], to present DIPS-Plus, an enhanced, feature-rich
dataset of 42,112 complexes for geometric deep learning of protein interfaces. The
previous version of DIPS contains only the Cartesian coordinates and types of the
atoms comprising a given protein complex, whereas DIPS-Plus now includes a
plethora of new residue-level features including protrusion indices, half-sphere
amino acid compositions, and new profile hidden Markov model (HMM)-based
sequence features for each amino acid, giving researchers a large, well-curated
feature bank for training protein interface prediction methods.
1 Introduction
Proteins are one of the fundamental drivers of work in living organisms. Their structures often
reflect and directly influence their functions in molecular processes, so understanding the relationship
between protein structure and protein function is of utmost importance to biologists and other
life scientists. Here, we study the interaction between binary protein complexes, pairs of protein
structures that bind together, to better understand how these coupled proteins will function in vivo.
Predicting where two proteins will interface in silico has become an appealing method for measuring
the interactions between proteins as a computational approach saves time, energy, and resources
compared to traditional methods for experimentally measuring such interfaces [4].
A key motivation for determining protein-protein interface regions is to decrease the time required
to discover new drugs and to advance the study of newly designed and engineered proteins [5].
Towards this end, we set out to curate a dataset large enough and with enough features to develop a
computational model that can reliably predict the residues that will form the interface between two
given proteins. In response to the exponential rate of progress being made in applying representation
learning to biomedical data, we designed a dataset to accommodate the need for more detailed training
data to solve this fundamental problem in structural biology.
∗
https://amorehead.github.io/
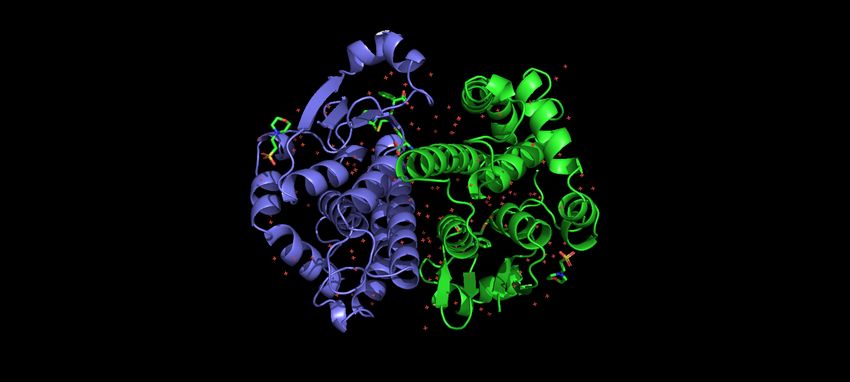
Preprint. Under review.Figure 1: A PyMOL [6] visualization for a complex of interacting proteins (PDB ID: 10GS).
2 Related Work
Machine learning has been used heavily to study biomolecules such as DNA, RNA, proteins and
drug-like bio-targets. From a classical perspective, a wide array of machine learning algorithms have
been employed in this domain. [7, 8] used Bayesian networks to model gene expression data. [9] give
an overview of HMMs being used for biological sequence analysis, such as in [10]. [11] have used
decision trees to classify membrane proteins. In a similar vein, Liu et al. [12] used support vector
machines (SVMs) to automate the recognition of protein folds.
In particular, machine learning methods have also been used extensively to help facilitate a biological
understanding of protein-protein interfaces. [13] created a random forests model for interface region
prediction using structure-based features. Chen et al. [14] trained SVMs solely on sequence-based
information to predict interfacing residues. Using both sequence and structure-based information,
[15] created an SVM for partner-specific interface prediction. Shortly after, [16] achieved even better
results by adopting an XGBoost algorithm and classifying residue pairs structured as pairs of feature
vectors.
Over the past several years, deep learning has established itself as an effective means of automatically
learning useful feature representations from data. These learned feature representations can be used
for a range of tasks including classification, regression, generative modeling, and even advanced
tasks such as playing Go [17] or folding proteins in silico [18]. Out of all the promising domains
of deep learning, one area of deep learning in particular, geometric deep learning, has arisen as a
natural avenue for modeling scientific as well as other types of relational data [19], such as the protein
complex shown in Figure 1.
Previously, geometric learning algorithms like convolutional neural networks (CNNs) and graph
neural networks (GNNs) have been used to predict protein interfaces. Fout et al. [20] designed a
siamese GNN architecture to learn weight-tied feature representations of residue pairs. This approach,
in essence, processes subgraphs for each residue in each complex and aggregates node-level features
locally using a nearest-neighbors approach. Since this partner-specific method derives its training
dataset from DB5, it is ultimately data-limited. [2] represent interacting protein complexes by
voxelizing each residue into a 3D grid and encoding in each grid entry the presence and type of the
residue’s underlying atoms. This partner-specific encoding scheme captures structural features of
interacting complexes, but it is not able to scale well due to its requiring a computationally-expensive
spatial resolution of the residue voxels to achieve good results.
Continuing the trend of applying geometric learning to protein structures, [21] perform partner-
independent interface region prediction with an attention-based GNN. This method learns to perform
binary classification of the residues in both complex structures to identify regions where residues
from both complexes are likely to interact with one another. However, because this approach predicts
partner-independent interface regions, it is less likely to be useful in helping solve related tasks such as
drug-protein interaction prediction and protein-protein docking [22]. To date, the best results obtained
by any model for protein interface prediction come from [23] where high-order (i.e. sequential and
coevolution-based) interactions between residues are learned and preserved throughout the network
2Table 1: Residue features added in DIPS-Plus
New Features (1) New Features (2)
Secondary Structure Half-Sphere Amino Acid Composition
Relative Solvent Accessibility Coordinate Number
Residue Depth Profile HMM Features
Protrusion Index Amide Normal Vector
in addition to structural features embedded in protein complexes. However, this approach is also
data-limited as it uses the DB5 dataset and its predecessors to derive its training data. As such,
it remains to be shown how much precision could be obtained with these and similar methods by
training them on much more exhaustive datasets.
3 Dataset
3.1 Overview
As we have seen, two main encoding schemes have been proposed for protein interface prediction:
modeling protein structures at the atomic level and modeling structures at the level of the residue.
Both schemes, when adopted by a machine learning algorithm such as a neural network, require
copious amounts of training examples to generalize past the training dataset. However, only one
exceedingly-large dataset for protein interface prediction currently exists, DIPS, and it is designed
solely for modeling structures at the atomic level. If one would like to model complexes at the residue
level to gain additional features for training, DB5 is currently the only available dataset for training
that meets this criterion. As such, one of the primary motivations for curating DIPS-Plus was to
answer the following two questions: Why must one choose between having a large dataset and having
enough features for their interface prediction models to generalize well? And is it possible for a
single dataset to facilitate both encoding schemes while maintaining its size and feature-richness?
3.2 Construction
As a follow-up to the above two questions, we constructed DIPS-Plus, a feature-expanded version of
DIPS accompanied, with permission from the original authors of DIPS, by a CC-BY 4.0 license for
reproducibility and extensibility. DIPS-Plus, compared to DIPS, not only contains the original PDB
features in DIPS such as amino acids’ Cartesian coordinates and their corresponding atoms’ element
types but now also new residue-level features shown in Table 1 following a feature set similar to
[15, 20, 23]. DIPS-Plus also replaces the residue sequence-conservation feature conventionally used
for interface prediction with a novel set of emission and transition probabilities derived from HMM
sequence profiles. Each HMM profile used to ascertain these residue-specific transition and emission
probabilities are constructed by HHmake [24] using MSAs that were generated after two iterations by
HHblits [24] and the Big Fantastic Database (BFD) (version: March 2019) of protein sequences [25].
Inspired by the work of Guo et al. [26], we chose to use HMM profiles to create sequence-based
features in DIPS-Plus as they have been shown to contain more detailed information concerning
the relative frequency of each amino acid in alignment with other protein sequences compared to
what has traditionally been done to generate sequence-based features for interface prediction, directly
sampling (i.e. windowing) MSAs to assess how conserved (i.e. buried) each residue is [24]. As is
standard for interface prediction [15, 20, 23], we define the labels in DIPS-Plus to be the IDs of
inter-protein residue pairs that, in the complex’s bound state, can be found within 6 Å of one another.
The original DIPS, being a carefully curated Protein Data Bank (PDB) subset, contains almost 200x
more protein complexes than frightfully-small 230 complexes in DB5, what is still considered to be
the gold-standard of protein-protein interaction datasets. DIPS-Plus consists of 42,112 complexes
compared to the 42,826 complexes in DIPS after pruning out 714 large and evolutionarily-distinct
complexes that are no longer available in the RCSB PDB (as of April 2021) or for which MSA
generation was prohibitively time-consuming and computationally expensive. Since we perform
minimal pruning to the complexes in DIPS to create DIPS-Plus, the number of complexes remaining
in DIPS-Plus should still be sufficient to train a deep network for many iterations. Similar to [2],
in the version of DB5 we update with new features from DIPS-Plus (i.e. DB5-Plus), we record the
3file names of the complexes added between versions 4 and 5 of Docking Benchmark as the final test
dataset for users’ convenience. This results in users having 55 well-sampled, difficulty-diversified
complexes on which to test their methods after training and with which to compare their results with
those of other methods.
3.3 New Features
The features we chose to add to DIPS to create DIPS-Plus were selected carefully and intentionally
based on our analysis of previously-successful interface prediction models. In this section, we
describe of these new features in detail, including why we chose to include them, how we collected or
generated them, and the strategy we took for normalizing the features and imputing missing feature
values when they arose. It should be noted beforehand that these features were derived only for
standard residues (e.g. amino acids) by filtering out hetero residues and waters from each PDB
complex before calculating, for example, half-sphere amino acid compositions for each residue.
This is, in part, to reduce the computational overhead of generating each residue’s features. More
importantly, however, we chose to ignore hetero residue features in DIPS-Plus to keep it consistent
with DB5 as hetero residues and waters are not present in DB5.
3.3.1 Secondary Structure
Secondary structure (SS) is included in DIPS-Plus as a categorical variable that describes the type
of local, three-dimensional structural segment in which a residue can be found. This feature has
been shown to correlate with the presence or absence of protein-protein interfaces [27]. As such,
we hypothesize adding it to protein interface prediction models could prove beneficial to model
performance. We generate each residue’s SS value using version 3.0.0 of the Database of Secondary
Structure Assignments for Proteins (DSSP) [28], a well-known and frequently-used software package
in the bioinformatics community. In particular, we use version 1.78 of BioPython [29] to call DSSP
and have it retrieve for us DSSP’s results for each residue. Each residue is assigned one of eight
possible SS values, ’H’, ’B’, ’E’, ’G’, ’I’, ’T’, ’S’, or ’-’. The symbol ’-’ signifies the default value
for unknown or missing SS values. Since this categorical feature is naturally one-hot encoded, it does
not need to be normalized numerically.
3.3.2 Relative Solvent Accessibility
Each residue can behave differently when interacting with water. Solvent accessibility is a scalar
feature that quantifies a residue’s accessible surface area, the area of a residue’s atoms that can be
touched by water. Polar residues typically have larger accessible surface areas, while hydrophobic
residues tend to have a smaller accessible surface area. It has been observed that hydrophobic residues
tend to appear in protein interfaces more often than polar residues [30]. Including solvent accessibility
as a residue-level feature, then, may provide models with additional information regarding how likely
a residue is to interact with another inter-protein residue.
Relative solvent accessibility (RSA) is simple modification of solvent accessibility that normalizes
each residue’s solvent accessibility by an experimentally-determined normalization constant specific
to each residue. These normalization constants are designed to help more closely correlate generated
RSA values with their residues’ true solvent accessibility [31]. Here, we again use BioPython and
DSSP together, this time to generate each residue’s RSA value. The RSA values returned from
BioPython are pre-normalized according to the constants described in [31] and capped to an upper
limit of 1.0. Missing RSA values are denoted by the NaN constant from NumPy [32], a popular
scientific computing library for Python. Since we use NumPy’s representation of NaN for missing
values, users have available to them many convenient methods for imputing missing feature values
for each feature type, and we provide the scripts to perform such feature imputation with our source
code for DIPS-Plus.
3.3.3 Residue Depth
Residue depth (RD) is a scalar measure of the average distance of the atoms of a residue from its
solvent accessible surface. Afsar et al. [15] have found that for interface prediction this feature
is complementary to each residues’ RSA value. Hence, this feature holds predictive value for
determining interacting protein residues as it can be viewed as a description of how "buried" each
4residue is. We use BioPython and version 2.6.1 of MSMS [33] to generate each residue’s depth,
where the default quantity for a missing RD value is NaN. To make all RD values fall within the
range [0, 1], we then perform structure-specific min-max normalization of each structure’s non-NaN
RD values using scikit-learn [34]. That is, for each structure, we find its minimum and maximum RD
values and normalize the structure’s RD values X using the expression
X − X.min(axis = 0)
X= × (max − min) + min
X.max(axis = 0) − X.min(axis = 0)
where min = 0 and max = 1.
3.3.4 Protrusion Index
A residue’s protrusion index (PI) is defined using its non-hydrogen atoms. It is a measure of the
proportion of a 10 Å sphere centered around the residue’s non-hydrogen atoms that is not occupied
by any atoms. By computing residues’ protrusion this way, we end up with a 1 x 6 feature vector that
describes the following six properties of a residue’s protrusion: average and standard deviation of
protrusion, minimum and maximum protrusion, and average and standard deviation of the protrusion
of the residue’s non-hydrogen atoms facing its side chain. We used version 1.0 of PSAIA [35] to
calculate the PIs for each structure’s residues collectively. That is, each structure has its residues’
PSAIA values packaged in a single .tbl file. Missing PIs default to a 1 x 6 vector consisting entirely
of NaNs. We min-max normalize each PI entry columnwise to get six updated PI values, similar to
how we normalize RD values in a structure-specific manner.
3.3.5 Half-Sphere Amino Acid Composition
Half-sphere amino acid compositions (HSAACs) are comprised of two 1 x 21 unit-normalized vectors
concatenated together to get a single 1 x 42 feature vector for each residue. The first vector, termed
the upward composition (UC), reflects the number of times a particular amino acid appears along
the residue’s side chain, while the second, the downward composition (DC), describes the same
measurement in the opposite direction. The 21st vector entry for each residue corresponds to the
unknown or unmappable residue, ’-’. Knowing the composition of amino acids along and away from
a residue’s side chain, for all residues in a structure, is another feature that has been shown to offer
crucial predictive value to machine learning models for interface prediction as these UC and DC
vectors can vary widely for residues, suggesting another way of assessing residue accessibility [15,
23]. Missing HSAACs default to a 1 x 42 vector consisting entirely of NaNs. Furthermore, since both
the UC and DC vectors for each residue are unit normalized before concatenating them together, after
concatenation all columnwise HSAAC values for a structure still inclusively fall between 0 and 1.
3.3.6 Coordinate Number
A residue’s coordinate number (CN) is conveniently determined alongside the calculation of its
HSAAC. It denotes how many other residues to which the given residue was found to be significant.
Significance, in this context, is defined in the same way as [15]. That is, the significance score for
two residues is defined as
−d2
s = e 2×st2 ,
where d is the minimum distance between any of their atoms and st is a given significance threshold
which, in our case, defaults to the constant 1e−3 . Then, if two residues’ significance score falls above
st, they are considered significant. As per our convention in DIPS-Plus, the default value for missing
CNs is NaN, and we min-max normalize the CN for each structure’s residues.
3.3.7 Profile HMM Features
Sequence profile features can carry rich evolutionary information regarding how each residue in a
structure is related all other residues. As such, to gather sequence profile features for DIPS-Plus, we
derive profile HMMs for each structures’ residues using HH-suite3 by first generating MSAs using
HHblits followed by taking the output of HHblits to create profile HMMs using HHmake. From these
5Table 2: A comparison of datasets for PIP
Dataset # Complexes # Residues # Residue Interactions # Residue Features
DB5 230 121,943 21,091 0
DB5-Plus 230 121,943 21,091 8
DIPS 42,826 22,547,678 5,767,039 0
DIPS-Plus 42,112 22,127,737 5,677,450 8
profile HMMs, we can then calculate each structure’s residue-wise emission and transition profiles.
A residue’s emission profile, represented as a 1 x 20 feature vector of probability values, illustrates
how likely the residue is across its evolutionary history to emit one of the 20 possible amino acid
symbols. Similarly, each residue’s transition profile, a 1 x 7 probability feature vector, depicts how
likely the residue is to transition into one of the seven possible HMM states.
To derive each structure’s emission and transition probabilities, for a residue i and a standard amino
acid k we extract the profile HMM entry (i, k) (i.e. the corresponding frequency) and convert the
frequency into a probability value with the equation
F reqik
pik = 2− 1000 .
After doing so, we get a 1 x 27 vector of probability values for each residue. Similar to other features
in DIPS-Plus, missing emission and transition probabilities for a single residue default to a 1 x 27
vector comprised solely of NaNs. Moreover, since each residue is assigned a probability vector as
its sequence features, we do not need to normalize these sequence feature vectors columnwise. It
should be noted that we chose to leave out three profile HMM values for each residue. These last
three omitted values represent the diversity of the alignment with respect to HHmake’s generation
of profile HMMs from HHblits’ generated MSAs for a given structure. Since we do not see any
predictive value in including these as additional residue features, we decided to leave them out of
both DIPS-Plus and DB5-Plus.
3.3.8 Amide Normal Vector
Each residue’s amide plane has a normal vector (NV) that we can derive by taking the cross product of
the difference between the residue’s alpha-carbon (CA) atom and beta-carbon (CB) atoms’ Cartesian
coordinates and the difference between the coordinates of the residue’s CB atom and its nitrogen (N)
atom. If users choose to encode the complexes in DIPS-Plus as pairs of graphs, these NVs can then
be used to define rich edge features such as the angle between the amide plane NVs for two residues
[20]. Similar to how we impute other missing feature vectors, the default value for an underivable NV
(e.g. for Glycine residues which do not have a beta-carbon atom) is a 1 x 3 vector consisting of NaNs.
Further, since these vectors represent residues’ amide plane NVs, we leave them unnormalized for, at
users’ discretion, additional postprocessing (e.g. custom normalization) of these NVs.
3.4 Analysis
Table 2 gives a brief summary of the datasets available for protein interface prediction to date and
the number of residue features available in them. In it, we can see that our version of DIPS, labeled
DIPS-Plus, contains many more residue features than its original version at the expense of minimal
pruning to the number of complexes available for training. As such, DIPS-Plus should enable machine
learning algorithms to learn a detailed representation of protein structures, one more closely aligned
with an atom-level view of each structure, using a plethora of features describing structural and
sequence-based features of each residue. Further, by using two orders of magnitude more training
data than would be possible with DB5, networks trained on DIPS-Plus have the opportunity to unearth
intricate representations of protein complexes that may enrich our understanding of protein-protein
interactions.
Complementary to Table 2, Table 3 shows how many features we were able to include for each
residue in DB5-Plus and DIPS-Plus, respectively. Regarding DB5-Plus, we see that for relative
solvent accessibility, residue depth, protrusion index, half-sphere amino acid composition, coordinate
number, and profile HMM features, the majority of residues have valid (i.e. non-NaN) entries. That
6Table 3: How many residue features were successfully generated for each PIP dataset
DB5-Plus DIPS-Plus DB5-Plus DIPS-Plus
SS: 95,614 SS: 17,835,959 HSAAC: 121,943 HSAAC: 21,791,175
RSA: 121,591 RSA: 22,104,449 CN: 121,943 CN: 22,127,737
RD: 121,601 RD: 22,069,320 HMM: 121,943 HMM: 22,127,050
PI: 121,943 PI: 19,246,789 NV: 113,376 NV: 20,411,267
is, more than 99.7% of all residues in DB5-Plus have valid values for these features. In addition,
secondary structures and amide plane normal vectors exist, respectively, for 78.4% and 93% of all
residues. Concerning DIPS-Plus, relative solvent accessibilities, residue depths, half-sphere amino
acid compositions, coordinate numbers, and profile HMM features exist for more than 98.5% of all
residues. Also, we notably observe that valid secondary structures, protrusion indices, and normal
vectors exist, respectively, for 80.6%, 87%, and 92.2% of all residues.
From the above analysis, we made a stand-alone observation. For both DB5-Plus and DIPS-Plus,
residues’ secondary structure labels are available from DSSP for, on average, 80.6% of all residues
in DIPS-Plus and DB5-Plus, collectively. This implies that there may be benefits to gain from
varying how we collect secondary structures for each residue, possibly by using deep learning-driven
alternatives to DSSP that predict the secondary structure to which a residue belongs, as in [26].
Complementing DSSP in this manner may yield even better secondary structure values for DIPS-Plus
and DB5-Plus. We defer the exploration of this idea to future work.
4 Impact and Challenges
4.1 Graph Learning
Over the last several years, machine learning of graphs has surfaced as a powerful means of uncovering
structural and relational features in graph-structured data [19]. To facilitate convenient processing
of each DIPS-Plus and DB5-Plus protein complex to fit this paradigm, we include with DIPS-Plus’
source code the scripts necessary to convert each complex’s Pandas DataFrame into two stand-
alone graph objects compatible with the Deep Graph Library (DGL) along with their corresponding
residue-residue interaction matrix [36]. These graph objects can then be used for a variety of graph
learning tasks such as node classification (e.g. for interface region prediction) or link prediction
(e.g. for inter-protein residue-residue interaction prediction). Our graph conversion scripts can also
be extended or adapted to facilitate alternative graph representation schemes for the complexes in
DIPS-Plus and DB5-Plus. By default, each DGL graph contains for each node 86 features either
one-hot encoded or extracted directly from the new feature set described above. Further, each graph
edge contains two distinct features after being min-max normalized, the angle between the amide
plane NV for a given source and destination node as well as the squared relative distance between the
source and destination nodes.
4.2 Biases
DIPS-Plus contains only bound protein complexes. On the other hand, our new PIP dataset for testing
machine learning models, DB5-Plus, consists of unbound complexes. As such, the conformal state
of DIPS-Plus’ complexes can bias learning algorithms to learning protein structures in their final,
post-deformation state since the structures in a complex often undergo deviations from their natural
shape after being bound to their partner protein. However, Townshend et al. [2] show that networks
well suited to the task of learning protein interfaces (i.e. those with suitable inductive biases for the
problem domain) can generalize beyond the training dataset (i.e. DIPS) and perform well on unbound
protein complexes (i.e. those in DB5). Hence, we leave it up to the designers of future PIP algorithms
how best to make use of DIPS-Plus’ structural bias for complexes.
4.3 Associated Risks
DIPS-Plus is designed to be used for machine learning of biomolecular data. It contains only publicly-
available information concerning biomolecular structures and their interactions. Consequently, all
7data used to create DIPS-Plus does not contain any personally identifiable information or offensive
content. As such, we do not foresee any negative societal impacts as a consequence of DIPS-Plus
being made publicly available. Furthermore, future adaptions or enhancements of DIPS-Plus may
benefit the machine learning community and, more broadly, the scientific community by providing
meaningful refinements to an already-anonymized, transparent, and extensible dataset for geometric
deep learning tasks in the life sciences.
5 Conclusion
We present DIPS-Plus, a comprehensive dataset for training and validating protein interface prediction
models. Protein interface prediction is a novel, high-impact challenge in structural biology that can
be vastly advanced with innovative algorithms and rich data sources. Several algorithms and even a
large atomic dataset for protein interface prediction have previously been proposed, however, until
DIPS-Plus no large-scale data source with rich residue features has been available. We expect the
impact of DIPS-Plus to be significantly enhanced quality of models and community discussion in
how best to design algorithmic solutions to this novel open challenge. Further, we anticipate that
DIPS-Plus could be used as a template for creating new large-scale machine learning datasets tailored
to the life sciences.
Acknowledgments and Disclosure of Funding
The project is partially supported by two NSF grants (DBI 1759934 and IIS 1763246), one NIH grant
(GM093123), three DOE grants (DE-SC0020400, DE-AR0001213, and DE-SC0021303), and the
computing allocation on the Andes compute cluster provided by Oak Ridge Leadership Computing
Facility (Project ID: BIF132). In particular, this research used resources of the Oak Ridge Leadership
Computing Facility at the Oak Ridge National Laboratory, which is supported by the Office of Science
of the U.S. Department of Energy under Contract No. DE-AC05-00OR22725.
References
[1] Thom Vreven et al. “Updates to the integrated protein–protein interaction benchmarks: docking
benchmark version 5 and affinity benchmark version 2”. In: Journal of molecular biology
427.19 (2015), pp. 3031–3041.
[2] Raphael Townshend et al. “End-to-End Learning on 3D Protein Structure for Interface Predic-
tion”. In: Advances in Neural Information Processing Systems. Ed. by H. Wallach et al. Vol. 32.
Curran Associates, Inc., 2019, pp. 15642–15651. URL: https://proceedings.neurips.
cc/paper/2019/file/6c7de1f27f7de61a6daddfffbe05c058-Paper.pdf.
[3] Raphael J. L. Townshend et al. ATOM3D: Tasks On Molecules in Three Dimensions. 2020.
arXiv: 2012.04035 [cs.LG].
[4] James A Wells and Christopher L McClendon. “Reaching for high-hanging fruit in drug
discovery at protein–protein interfaces”. In: Nature 450.7172 (2007), pp. 1001–1009.
[5] Yoichi Murakami et al. “Network analysis and in silico prediction of protein–protein interac-
tions with applications in drug discovery”. In: Current opinion in structural biology 44 (2017),
pp. 134–142.
[6] Schrödinger, LLC. “The PyMOL Molecular Graphics System, Version 1.8”. Nov. 2015.
[7] Nir Friedman et al. “Using Bayesian networks to analyze expression data”. In: Journal of
computational biology 7.3-4 (2000), pp. 601–620.
[8] Benedict Anchang et al. “Modeling the temporal interplay of molecular signaling and gene
expression by using dynamic nested effects models”. In: Proceedings of the National Academy
of Sciences 106.16 (2009), pp. 6447–6452.
[9] Anders Krogh et al. “Hidden Markov models in computational biology: Applications to protein
modeling”. In: Journal of molecular biology 235.5 (1994), pp. 1501–1531.
[10] Richard Durbin et al. Biological sequence analysis: probabilistic models of proteins and
nucleic acids. Cambridge university press, 1998.
[11] E Siva Sankari and D Manimegalai. “Predicting membrane protein types using various decision
tree classifiers based on various modes of general PseAAC for imbalanced datasets”. In:
Journal of theoretical biology 435 (2017), pp. 208–217.
8[12] Bin Liu, Chen-Chen Li, and Ke Yan. “DeepSVM-fold: protein fold recognition by combining
support vector machines and pairwise sequence similarity scores generated by deep learning
networks”. In: Briefings in bioinformatics 21.5 (2020), pp. 1733–1741.
[13] Mile Šikić, Sanja Tomić, and Kristian Vlahoviček. “Prediction of protein–protein interaction
sites in sequences and 3D structures by random forests”. In: PLoS Comput Biol 5.1 (2009),
e1000278.
[14] Peng Chen and Jinyan Li. “Sequence-based identification of interface residues by an integrative
profile combining hydrophobic and evolutionary information”. In: BMC bioinformatics 11.1
(2010), pp. 1–15.
[15] Fayyaz ul Amir Afsar Minhas, Brian J Geiss, and Asa Ben-Hur. “PAIRpred: Partner-specific
prediction of interacting residues from sequence and structure”. In: Proteins: Structure, Func-
tion, and Bioinformatics 82.7 (2014), pp. 1142–1155.
[16] Ruben Sanchez-Garcia et al. “BIPSPI: a method for the prediction of partner-specific pro-
tein–protein interfaces”. In: Bioinformatics 35.3 (July 2018), pp. 470–477. ISSN: 1367-4803.
DOI : 10 . 1093 / bioinformatics / bty647. eprint: https : / / academic . oup . com /
bioinformatics / article - pdf / 35 / 3 / 470 / 27700304 / bty647 . pdf. URL: https :
//doi.org/10.1093/bioinformatics/bty647.
[17] David Silver et al. “Mastering the game of Go with deep neural networks and tree search”. In:
nature 529.7587 (2016), pp. 484–489.
[18] John Jumper. High Accuracy Protein Structure Prediction Using Deep Learning. Nov. 2020.
URL : https://deepmind.com/blog/article/alphafold- a- solution- to- a- 50-
year-old-grand-challenge-in-biology.
[19] Michael M. Bronstein et al. Geometric Deep Learning: Grids, Groups, Graphs, Geodesics,
and Gauges. 2021. arXiv: 2104.13478 [cs.LG].
[20] Alex Fout et al. “Protein Interface Prediction using Graph Convolutional Networks”. In:
Advances in Neural Information Processing Systems. Ed. by I. Guyon et al. Vol. 30. Curran
Associates, Inc., 2017, pp. 6530–6539. URL: https://proceedings.neurips.cc/paper/
2017/file/f507783927f2ec2737ba40afbd17efb5-Paper.pdf.
[21] Bowen Dai and Chris Bailey-Kellogg. “Protein Interaction Interface Region Prediction by
Geometric Deep Learning”. In: Bioinformatics (Mar. 2021). btab154. ISSN: 1367-4803.
DOI : 10 . 1093 / bioinformatics / btab154. eprint: https : / / academic . oup . com /
bioinformatics/advance-article-pdf/doi/10.1093/bioinformatics/btab154/
36516110 / btab154 . pdf. URL: https : / / doi . org / 10 . 1093 / bioinformatics /
btab154.
[22] Shandar Ahmad and Kenji Mizuguchi. “Partner-aware prediction of interacting residues in
protein-protein complexes from sequence data”. In: PloS one 6.12 (2011), e29104.
[23] Yi Liu et al. “Deep learning of high-order interactions for protein interface prediction”. In:
Proceedings of the 26th ACM SIGKDD International Conference on Knowledge Discovery &
Data Mining. 2020, pp. 679–687.
[24] Martin Steinegger et al. “HH-suite3 for fast remote homology detection and deep protein
annotation”. In: BMC bioinformatics 20.1 (2019), pp. 1–15.
[25] Martin Steinegger, Milot Mirdita, and Johannes Söding. “Protein-level assembly increases
protein sequence recovery from metagenomic samples manyfold”. In: Nature methods 16.7
(2019), pp. 603–606.
[26] Zhiye Guo, Jie Hou, and Jianlin Cheng. “DNSS2: improved ab initio protein secondary
structure prediction using advanced deep learning architectures”. In: Proteins: Structure,
Function, and Bioinformatics 89.2 (2021), pp. 207–217.
[27] Jaru Taechalertpaisarn et al. “Correlations between secondary structure-and protein–protein
interface-mimicry: the interface mimicry hypothesis”. In: Organic & biomolecular chemistry
17.12 (2019), pp. 3267–3274.
[28] Wouter G Touw et al. “A series of PDB-related databanks for everyday needs”. In: Nucleic
acids research 43.D1 (2015), pp. D364–D368.
[29] Peter JA Cock et al. “Biopython: freely available Python tools for computational molecular
biology and bioinformatics”. In: Bioinformatics 25.11 (2009), pp. 1422–1423.
[30] Changhui Yan et al. “Characterization of protein–protein interfaces”. In: The protein journal
27.1 (2008), pp. 59–70.
9[31] Burkhard Rost and Chris Sander. “Conservation and prediction of solvent accessibility in
protein families”. In: Proteins: Structure, Function, and Bioinformatics 20.3 (1994), pp. 216–
226.
[32] Charles R. Harris et al. “Array programming with NumPy”. In: Nature 585.7825 (Sept. 2020),
pp. 357–362. DOI: 10.1038/s41586-020-2649-2. URL: https://doi.org/10.1038/
s41586-020-2649-2.
[33] Michel F Sanner, Arthur J Olson, and Jean-Claude Spehner. “Reduced surface: an efficient
way to compute molecular surfaces”. In: Biopolymers 38.3 (1996), pp. 305–320.
[34] F. Pedregosa et al. “Scikit-learn: Machine Learning in Python”. In: Journal of Machine
Learning Research 12 (2011), pp. 2825–2830.
[35] Josip Mihel et al. “PSAIA–protein structure and interaction analyzer”. In: BMC structural
biology 8.1 (2008), pp. 1–11.
[36] Minjie Wang et al. “Deep Graph Library: Towards Efficient and Scalable Deep Learning on
Graphs.” In: (2019).
[37] Peter W Rose et al. “The RCSB Protein Data Bank: redesigned web site and web services”. In:
Nucleic acids research 39.suppl_1 (2010), pp. D392–D401.
[38] The pandas development team. pandas-dev/pandas: Pandas. Version latest. Feb. 2020. DOI:
10.5281/zenodo.3509134. URL: https://doi.org/10.5281/zenodo.3509134.
[39] Michael M McKerns et al. “Building a framework for predictive science”. In: arXiv preprint
arXiv:1202.1056 (2012).
10A Appendix
A.1 Datasheet
A.1.1 Motivation
For what purpose was the dataset created? Was there a specific task in mind? Was there a specific gap that
needed to be filled? Please provide a description.
DIPS-Plus was created for training and validating deep learning models aimed at predicting protein
interfaces and inter-protein interactions. Without DIPS-Plus, deep learning algorithms that encode
protein structures at the level of a residue would be limited either to the scarce protein complexes
available in the Docking Benchmark 5 (DB5) dataset [1] or to the original, feature-limited Database
of Interacting Protein Structures (DIPS) dataset [2, 3] for training.
Who created this dataset (e.g., which team, research group) and on behalf of which entity (e.g., company,
institution, organization)?
DIPS-Plus was created by Professor Jianlin Cheng’s Bioinformatics & Machine Learning (BML) lab
at the University of Missouri. The original DIPS was created by Professor Ron Dror’s Computational
Biology lab at Stanford University and was enhanced to create DIPS-Plus with the original authors’
permission.
Who funded the creation of the dataset? If there is an associated grant, please provide the name of the
grantor and the grant name and number.
The project is partially supported by two NSF grants (DBI 1759934 and IIS 1763246), one NIH grant
(GM093123), three DOE grants (DE-SC0020400, DE-AR0001213, and DE-SC0021303), and the
computing allocation on the Andes compute cluster provided by Oak Ridge Leadership Computing
Facility (Project ID: BIF132). In particular, this research used resources of the Oak Ridge Leadership
Computing Facility at the Oak Ridge National Laboratory, which is supported by the Office of Science
of the U.S. Department of Energy under Contract No. DE-AC05-00OR22725.
A.1.2 Composition
What do the instances that comprise the dataset represent (e.g., documents, photos, people, countries)?
Are there multiple types of instances (e.g., movies, users, and ratings; people and interactions between them;
nodes and edges)? Please provide a description.
DIPS-Plus is comprised of binary protein complexes (i.e. bound ligand and receptor protein struc-
tures) extracted from the Protein Data Bank (PDB) of the Research Collaboratory for Structural
Bioinformatics (RCSB) [37]. Both protein structures in the complex are differentiable in that they are
stored in their own Pandas DataFrame objects [38]. Each structure’s DataFrame contains informa-
tion concerning the atoms of each residue in the structure such as their Cartesian coordinates and
element type. For the alpha-carbon atoms of each residue (typically the most representative atom of a
residue), each structure’s DataFrame also contains residue-level features like a measure of amino
acid protrusion and solvent accessibility.
How many instances are there in total (of each type, if appropriate)?
There are 42,826 binary protein complexes in the original DIPS and 42,112 binary protein complexes
in DIPS-Plus after additional pruning.
Does the dataset contain all possible instances or is it a sample (not necessarily random) of instances from
a larger set? If the dataset is a sample, then what is the larger set? Is the sample representative of the larger set
(e.g., geographic coverage)? If so, please describe how this representativeness was validated/verified. If it is not
representative of the larger set, please describe why not (e.g., to cover a more diverse range of instances, because
instances were withheld or unavailable).
The dataset contains all possible instances of bound protein complexes obtainable from the RCSB
PDB for which it is computationally reasonable to generate residue-level features. That is, if it takes
more than 48 hours to generate an RCSB complex’s residue features, it is excluded from DIPS-Plus.
This results in us excluding approximately 100 complexes after our pruning of RCSB complexes.
11What data does each instance consist of? “Raw” data (e.g., unprocessed text or images)or features? In either
case, please provide a description.
Each instance, consisting of a pair of Pandas DataFrames containing a series of alpha-carbon (CA)
atoms and non-CA atoms with residue and atom-level features, respectively, is stored in a Python
dill file for data compression and convenient file loading [39]. Each Pandas DataFrame contains a
combination of numeric, categorical, and vector-like features describing each atom.
Is there a label or target associated with each instance? If so, please provide a description.
The dataset contains the labels of which pairs of CA atoms from opposite structures are within 6
Å of one another (i.e. positives), implying an interaction between the two residues, along with an
equally-sized list of randomly-sampled non-interacting residue pairs (i.e. negatives). For example,
if a complex in DIPS-Plus contains 100 interacting residue pairs (i.e. positive instances), there will
also be 100 randomly-sampled non-interacting residue pairs included in the complex’s dill file for
optional downsampling of the negative class during training.
Is any information missing from individual instances? If so, please provide a description, explaining why
this information is missing (e.g., because it was unavailable). This does not include intentionally removed
information, but might include, e.g., redacted text.
All eight of the residue-level features added in DIPS-Plus are missing values for at least one residue.
This is because not all residues have, for example, DSSP-derivable secondary structure (SS) values
[28] or profile hidden Markov models (HMMs) that are derivable by HH-suite3 [24], the software
package we use to generate multiple sequence alignments (MSAs) and subsequent MSA-based
features. A similar situation occurs for the six other residue features. That is, not all residues have
derivable features for a specific feature column, governed either by our own feature parsers or by
the external feature parsers we use in making DIPS-Plus. We denote missing feature values for all
features as NumPy’s NaN constant with the exception of residues’ SS value in which case we use ’-’
as the default missing feature value [32].
Are relationships between individual instances made explicit (e.g., users’ movie ratings, social network
links)? If so, please describe how these relationships are made explicit. If so, please provide a description,
explaining why this information is missing (e.g., because it was unavailable). This does not include intentionally
removed information, but might include, e.g., redacted text.
The relationships between individual instances (i.e. protein complexes) are made explicit by the
directory and file-naming convention we adopt for DIPS-Plus. Complexes’ DataFrame files are
grouped into folders by shared second and third characters of their PDB identifier codes (e.g.
1x9e.pdb1_0.dill and 4x9e.pdb1_5.dill reside in the same directory x9/).
Are there recommended data splits (e.g., training, development/validation, testing)? If so, please provide
a description of these splits, explaining the rationale behind them.
Since DIPS-Plus is relatively large (i.e. has more than 10,000 complexes), we provide a randomly-
sampled 80%-20% dataset split for training and validation data, respectively, in the form of two text
files: pairs-postprocessed-train.txt and pairs-postprocessed-val.txt. The file pairs-postprocessed.txt is
a master list of all complex file names from which we derive pairs-postprocessed-train.txt and pairs-
postprocessed-val.txt for cross-validation. It contains the file names of 42,112 complex DataFrames,
filtered down from the original 42,112 complexes in DIPS-Plus to complexes having no more than
17,500 CA and non-CA atoms, to match the maximum possible number of atoms in DB5-Plus
structures and to create an upper-bound on the computational complexity of learning algorithms
trained on DIPS-Plus. However, we also include the scripts necessary to conveniently regenerate
pairs-postprocessed.txt with a modified or removed atom-count filtering criterion and with different
cross-validation ratios.
Are there any errors, sources of noise, or redundancies in the dataset? If so, please provide a description.
As mentioned in missing information point above, not all residues have software-derivable features
for the feature set we have chosen for DIPS-Plus. In the case of missing features, we substitute
NumPy’s NaN constant for the missing feature value with the exception of SS values which are
replaced with the symbol ’-’. We also provide with DIPS-Plus postprocessing scripts for users to
perform imputation of missing feature values (e.g. replacing a column’s missing values with the
12column’s mean, median, minimum, or maximum value or with a constant such as zero) depending on
the type of the missing feature (i.e. categorical or numeric).
Is the dataset self-contained, or does it link to or otherwise rely on external resources (e.g., websites,
tweets, other datasets)? If it links to or relies on external resources, a) are there guarantees that they will exist,
and remain constant, over time; b) are there official archival versions of the complete dataset (i.e., including the
external resources as they existed at the time the dataset was created); c) are there any restrictions (e.g., licenses,
fees) associated with any of the external resources that might apply to a future user? Please provide descriptions
of all external resources and any restrictions associated with them, as well as links or other access points, as
appropriate.
The dataset relies on feature generation using external tools such as DSSP and PSAIA. However, in
our Zenodo data repository for DIPS-Plus, we provide either a copy of the external features generated
using these tools or the exact version of the tool with which we generated features (e.g. version 3.0.0
of DSSP for generating SS values using version 1.78 of BioPython). The most time-consuming and
computationally-expensive features to generate, profile HMMs and protrusion indices, are included
in our Zenodo repository for users’ convenience. We also provide the final, postprocessed version of
each DIPS-Plus complex in our Zenodo data bank.
Does the dataset contain data that might be considered confidential (e.g., data that is protected by legal
privilege or by doctor-patient confidentiality, data that includes the content of individuals non-public
communications)? If so, please provide a description.
No, DIPS-Plus does not contain any confidential data. All data with which DIPS-Plus was created is
publicly available.
Does the dataset contain data that, if viewed directly, might be offensive, insulting, threatening, or might
otherwise cause anxiety? If so, please describe why.
No, DIPS-Plus does not contain data that, if viewed directly, might be offensive, insulting, threatening,
or might otherwise cause anxiety.
Does the dataset relate to people? If not, you may skip the remaining questions in this section.
No, DIPS-Plus does not contain data that relates directly to individuals.
A.1.3 Collection Process
How was the data associated with each instance acquired? Was the data directly observable (e.g., raw text,
movie ratings), reported by subjects (e.g., survey responses), or indirectly inferred/derived from other data (e.g.,
part-of-speech tags, model-based guesses for age or language)? If data was reported by subjects or indirectly
inferred/derived from other data, was the data validated/verified? If so, please describe how.
The data associated with each instance was acquired from the RCSB’s PDB repository for protein
complexes (https://ftp.wwpdb.org/pub/pdb/data/biounit/coordinates/divided/), where each complex
was screened, inspected, and analyzed by biomedical professionals and researchers before being
deposited into the RCSB PDB.
What mechanisms or procedures were used to collect the data (e.g., hardware apparatus or sensor, man-
ual human curation, software program, software API)? How were these mechanisms or procedures vali-
dated?
X-ray diffraction, nuclear magnetic resonance (NMR), and electron microscopy (EM) are the most
common methods for collecting new protein complexes. These techniques are industry standard in
biomolecular research.
Who was involved in the data collection process (e.g., students, crowdworkers, contractors) and how were
they compensated (e.g., how much were crowdworkers paid)?
Unknown.
Over what timeframe was the data collected? Does this timeframe match the creation timeframe of the data
associated with the instances (e.g., recent crawl of old news articles)? If not, please describe the timeframe in
which the data associated with the instances was created.
The protein structures in the RCSB PDB have been collected iteratively over the last 50 years.
13Were any ethical review processes conducted (e.g., by an institutional review board)? If so, please provide
a description of these review processes, including the outcomes, as well as a link or other access point to any
supporting documentation.
Unknown.
Does the dataset relate to people? If not, you may skip the remaining questions in this section.
No, DIPS-Plus does not contain data that relates directly to individuals.
A.1.4 Preprocessing, Cleaning, and Labeling
Was any preprocessing/cleaning/labeling of the data done (e.g., discretization or bucketing, tokenization,
part-of-speech tagging, SIFT feature extraction, removal of instances, processing of missing values)? If
so, please provide a description. If not, you may skip the remainder of the questions in this section.
All eight of the residue-level features added in DIPS-Plus are missing values for at least one residue.
This is because not all residues have, for example, DSSP-derivable secondary structure (SS) values
[28] or profile hidden Markov models (HMMs) that are derivable by HH-suite3 [24], the software
package we use to generate multiple sequence alignments (MSAs) and subsequent MSA-based
features. A similar situation occurs for the six other residue features. That is, not all residues have
derivable features for a specific feature column, governed either by our own feature parsers or by
the external feature parsers we use in making DIPS-Plus. We denote missing feature values for all
features as NumPy’s NaN constant with the exception of residues’ SS value in which case we use ’-’
as the default missing feature value [32]. In the case of missing features, we substitute NumPy’s NaN
constant for the missing feature value. We also provide with DIPS-Plus postprocessing scripts for
users to perform imputation of missing feature values (e.g. replacing a column’s missing values with
the column’s mean, median, minimum, or maximum value or with a constant such as zero) depending
on the type of the missing feature (i.e. categorical or numeric).
Was the “raw” data saved in addition to the preprocessed/cleaned/labeled data (e.g., to support unantici-
pated future uses)?
The version of each complex prior to any postprocessing we perform for DIPS-Plus complexes is
saved separately in our Zenodo data repository. That is, each pruned pair from DIPS is stored in our
data repository prior to the addition of DIPS-Plus features. The raw complexes from which DIPS
complexes are derived can be retrieved from the RCSB PDB individually or in batch using FTP or
similar file-transfer protocols (from https://ftp.wwpdb.org/pub/pdb/data/biounit/coordinates/divided/).
Is the software used to preprocess/clean/label the instances available? If so, please provide a link or other
access point.
Our GitHub repository with source code and instructions for generating DIPS-Plus from scratch can
be found at https://github.com/amorehead/DIPS-Plus.
A.1.5 Uses
Has the dataset been used for any tasks already? If so, please provide a description.
At the time of publication, DIPS-Plus has not yet been used for any tasks since it is a newly-released
expansion of DIPS. However, we have internally been using DIPS-Plus for ongoing projects that will
be published in the near future.
Is there a repository that links to any or all papers or systems that use the dataset? If so, please provide a
link or other access point.
We will be linking to all papers or systems that use DIPS-Plus (as we find out about them) in our
GitHub repository for DIPS-Plus (https://github.com/amorehead/DIPS-Plus).
What (other) tasks could the dataset be used for?
This dataset can be used with most deep learning algorithms, especially geometric learning algorithms,
for studying protein structures, complexes, and their inter/intra-protein interactions at scale. This
dataset can also be used to test the performance of new or existing geometric learning algorithms for
node classification, link prediction, object recognition, or similar benchmarking tasks.
14Is there anything about the composition of the dataset or the way it was collected and prepro-
cessed/cleaned/labeled that might impact future uses? For example, is there anything that a future user
might need to know to avoid uses that could result in unfair treatment of individuals or groups (e.g., stereotyping,
quality of service issues) or other undesirable harms (e.g., financial harms, legal risks) If so, please provide a
description. Is there anything a future user could do to mitigate these undesirable harms?
There is minimal risk for harm: the data DIPS-Plus was created from was already public.
Are there tasks for which the dataset should not be used? If so, please provide a description.
This data is collected solely in the proteomics domain, so systems trained on it may or may not
generalize to other tasks in the life sciences.
A.1.6 Distribution
Will the dataset be distributed to third parties outside of the entity (e.g., company, institution, organiza-
tion) on behalf of which the dataset was created? If so, please provide a description.
Yes, the dataset’s source code is publicly available on the internet
(https://github.com/amorehead/DIPS-Plus).
How will the dataset will be distributed (e.g., tarball on website, API, GitHub)? Does the dataset have a
digital object identifier (DOI)?
The dataset is distributed on Zenodo (https://zenodo.org/record/4815267) with 10.5281/zen-
odo.4815267 as its DOI.
When will the dataset be distributed?
The dataset has been distributed on Zenodo as of June 7th, 2021.
Will the dataset be distributed under a copyright or other intellectual property (IP) license, and/or under
applicable terms of use (ToU)? If so, please describe this license and/or ToU, and provide a link or other access
point to, or otherwise reproduce, any relevant licensing terms or ToU, as well as any fees associated with these
restrictions.
The dataset will be distributed under a CC-BY 4.0 license, and the code used to generate it will be
distributed on GitHub under a GPL-3.0 license. We also request that if others use the dataset they cite
the corresponding paper:
DIPS-Plus: The Enhanced Database of Interacting Protein Structures for Interface Prediction. Alex
Morehead, Chen Chen, Ada Sedova, and Jianlin Cheng. arXiv, 2021.
Have any third parties imposed IP-based or other restrictions on the data associated with the instances?
If so, please describe these restrictions, and provide a link or other access point to, or otherwise reproduce, any
relevant licensing terms, as well as any fees associated with these restrictions.
No.
Do any export controls or other regulatory restrictions apply to the dataset or to individual instances? If
so, please describe these restrictions, and provide a link or other access point to, or otherwise reproduce, any
supporting documentation.
Unknown.
A.1.7 Maintenance
Who is supporting/hosting/maintaining the dataset?
Alex Morehead (https://amorehead.github.io/) is supporting the dataset.
How can the owner/curator/manager of the dataset be contacted (e.g., email address)?
Alex Morehead’s email address is acmwhb@missouri.edu.
Is there an erratum? If so, please provide a link or other access point.
No. Since DIPS-Plus was released on June 7th, 2021, there have not been any errata discovered.
15You can also read