DCE@urLAB: a dynamic contrast-enhanced MRI pharmacokinetic analysis tool for preclinical data
←
→
Page content transcription
If your browser does not render page correctly, please read the page content below
Ortuño et al. BMC Bioinformatics 2013, 14:316
http://www.biomedcentral.com/1471-2105/14/316

 SOFTWAR E                                                                                                                                  Open Access

DCE@urLAB: a dynamic contrast-enhanced
MRI pharmacokinetic analysis tool for
preclinical data
Juan E Ortuño1,2* , María J Ledesma-Carbayo2,1 , Rui V Simões3 , Ana P Candiota1,4,5 , Carles Arús4,1,5
and Andrés Santos2,1

  Abstract
  Background: DCE@urLAB is a software application for analysis of dynamic contrast-enhanced magnetic resonance
  imaging data (DCE-MRI). The tool incorporates a friendly graphical user interface (GUI) to interactively select and
  analyze a region of interest (ROI) within the image set, taking into account the tissue concentration of the contrast
  agent (CA) and its effect on pixel intensity.
  Results: Pixel-wise model-based quantitative parameters are estimated by fitting DCE-MRI data to several
  pharmacokinetic models using the Levenberg-Marquardt algorithm (LMA). DCE@urLAB also includes the
  semi-quantitative parametric and heuristic analysis approaches commonly used in practice. This software application
  has been programmed in the Interactive Data Language (IDL) and tested both with publicly available simulated data
  and preclinical studies from tumor-bearing mouse brains.
  Conclusions: A user-friendly solution for applying pharmacokinetic and non-quantitative analysis DCE-MRI in
  preclinical studies has been implemented and tested. The proposed tool has been specially designed for easy
  selection of multi-pixel ROIs. A public release of DCE@urLAB, together with the open source code and sample
  datasets, is available at http://www.die.upm.es/im/archives/DCEurLAB/.
  Keywords: DCE-MRI, Imaging, Levenberg-Marquardt, Fitting, Preclinical, Pharmacokinetics, Animal models,
  High field MR, IDL

Background                                                                          with the shortening of spin-lattice or longitudinal relax-
Dynamic contrast-enhanced magnetic resonance imaging                                ation time (T1 ), the time course of which can be related to
(DCE-MRI) involves the acquisition of sequential images                             physiological parameters. The most common CA used in
in rapid succession during and after the intravenous                                T1 -weighted DCE-MRI, Gadolinium-diethylenetriamine
administration of a, usually, low-molecular weight con-                             penta-acetic acid (Gd-DTPA), is able to transverse the vas-
trast agent (CA), which includes a paramagnetic compo-                              cular endothelium (except when the blood-brain barrier
nent such as gadolinium (Gd3+ ). This functional imaging                            is intact) and enter the extravascular-extracellular space
modality has proven to be useful in tumor differentia-                              (EES), but is unable to cross the cellular membrane. Thus,
tion, being a sensitive marker of antiangiogenic treatment                          in DCE-MRI the measured signal intensity changes derive
effect [1,2].                                                                       mostly from CA that extravasates to the EES [3,4]. The
  When T1 -weighted magnetic resonance (MR) sequen-                                 dynamics of exchange between the capillary bed and the
ces are used, the CA induces a signal enhancement related                           EES can be evaluated and are usually modeled as an open
                                                                                    two-compartment model, dependent on the washout
*Correspondence: juanen@die.upm.es                                                  rate between EES and plasma (kep ), and the volume
1 CIBER de Bioingeniería, Biomateriales y Nanomedicina (CIBER-BBN), 50018
Zaragoza, Spain                                                                     transfer constant between plasma and EES, denoted as
2 Biomedical Image Technologies Group, Departamento de Ingeniería                   K trans [5].
Electrónica, Universidad Politécnica de Madrid, 28040 Madrid, Spain
Full list of author information is available at the end of the article

                                        © 2013 Ortuño et al.; licensee BioMed Central Ltd. This is an Open Access article distributed under the terms of the Creative
                                        Commons Attribution License (http://creativecommons.org/licenses/by/2.0), which permits unrestricted use, distribution, and
                                        reproduction in any medium, provided the original work is properly cited.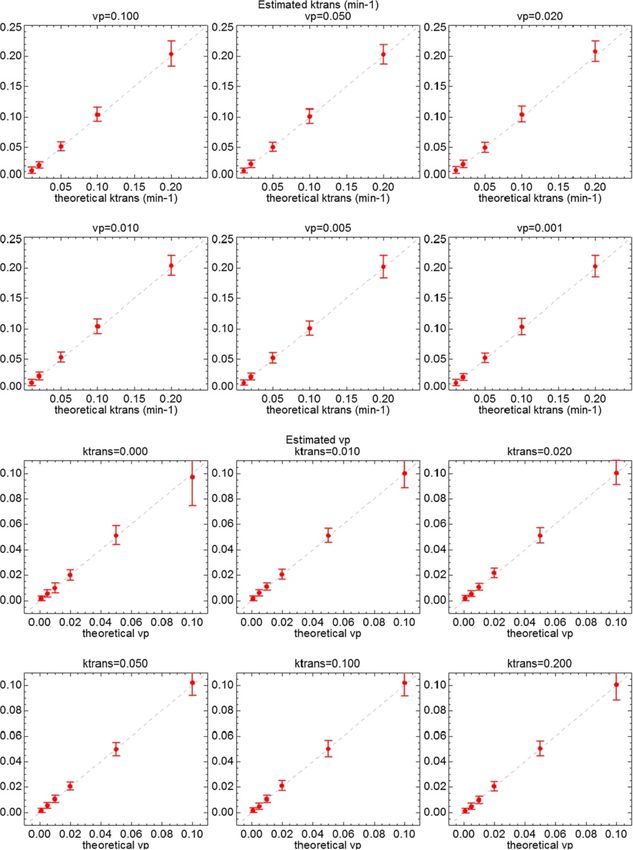
Ortuño et al. BMC Bioinformatics 2013, 14:316                                                                  Page 2 of 17
http://www.biomedcentral.com/1471-2105/14/316

   DCE-MRI has been used to investigate permeability and       can generate pixel maps, it does not work with coarse
perfusion in small animal tumor models [6,7]. A key con-       resolutions and is limited to the Tofts model, with a
sideration in rodents is that the concentration of CA in       bi-exponential model of Cp .
vascular plasma evolves rapidly compared to tissue, and           PermGUI and PCT [22] are freeware applications ori-
is quite difficult to sample the maximum signal intensity      ented to extract the permeability coefficient of the blood
to effectively characterize the tissue pharmacokinetics.       brain barrier (BBB) in human patients. The tools ana-
Since sampling the blood (the gold standard in humans)         lyze DCE-MRI images using the Patlak model [28]. This
is very invasive in small animals, kinetic models that do      model is also used in the package Toppcat, which runs as
not rely on arterial input function (AIF) measurements are     a plugin of ImageJ [29]. Toppcat is also free of charge for
desirable in preclinical DCE-MRI.                              educational and research purposes.
   Therefore, the software application presented in this          DcemriS4 [24] is a collection of shell scripts to help
manuscript is aimed at filing this gap and providing a pow-    automate the quantitative analysis of DCE-MRI and dif-
erful and versatile T1 -weighted DCE-MRI processing tool,      fusion weighted imaging (DWI), and written in the R
and at the same time, intuitive and easy-to-use in preclin-    programming environment [30]. Kinetic parametric esti-
ical studies. It has been implemented in Interactive Data      mation is performed with the Tofts model and non-
Language (IDL), accessible at http://www.exelisvis.com/        linear regression, Bayesian estimation or deconvolution
idl.                                                           algorithms. AIF is parameterized with a tri-exponential
   The DCE@urLAB application integrates pixel-wise             function [31] to obtain an analytical solution of the con-
pharmacokinetic analysis using the following models:           volution integral and increase computational efficiency.
Tofts [8], Hoffmann [9], Larsson [10], and a reference            DATforDCEMRI [25] is an R package tool which allows
region (RR) model [11]. The Tofts pharmacokinetic model        performing kinetic deconvolution analysis [32] and visu-
has been widely applied to characterize murine tumors          alizing the resulting pixel-wise parametric maps. Like
[12-14], as well as the Hoffmann pharmacokinetic model         DcemriS4, this software package requires an end-user
[15,16]. The Larsson model has not been extensively            training in R programming environment.
applied to small animal DCE-MRI, but is the third model           These software packages are primarily designed for
typically used in theoretical studies and reviews [5,17].      human studies and thus are not well suited for some
Finally, the RR model has been proposed as an alternative      typical requirements of preclinical DCE-MRI, e.g., the dif-
when AIF cannot be precisely estimated.                        ficulty in accurately measuring the AIF in small animals
                                                               makes that typical models in human studies cannot be
Existing software                                              used and ultimately requires the use of the Hoffmann
Model-based and semi-quantitative analysis of T1 -             or RR models. These models are not implemented in
weighted DCE-MRI can be performed with general pur-            available software packages. Other important functional-
pose pharmacokinetic compartmental analysis packages,          ities such as the difficulty in reading the imaging format
either non-commercial, like WinSAAM [18], JPKD [19],           produced by preclinical studies prevent from the use of
or commercial, like SAAM II [20]. These are complex            those packages by the preclinical research community.
tools that require specific training and need to be adjusted   Thus, in-house solutions are commonly used in DCE-MRI
to the particular problem of DCE-MRI. Pixel-wise analy-        small animal studies, using Matlab programming envi-
sis and ROI selection of images are also not included in       ronment [33,34], LabView [35] or IDL [36-39], but they
these platforms.                                               are mostly designed for a specific study and with limited
  Among the software specifically designed for DCE-MRI         availability.
data are the packages BioMap [21], PermGUI and PCT
[22], Toppcat [23], DcemriS4 [24], and DATforDCEMRI            Implementation
[25].                                                          In this section, the compartmental models implemented
  BioMap is built in IDL, and supports compartmen-             in the DCE@urLAB analysis tool are described. Addi-
tal analysis over ROIs through the perfusion tool. Two         tional information and technical details can be found in
ROIs must be defined, one describing the CA tissue-            the “DCEurLAB Methods.pdf ” document included in the
concentration and the other the concentration of the CA        software package, accessible at http://www.die.upm.es/
in blood plasma (Cp ). When Cp cannot be measured in           im/archives/DCEurLAB/ and in the Additional file 1. This
an ROI, either because the image does not contain a            section also includes a brief description of the graphical
large blood vessel, or the signal from the blood vessel is     user interface (GUI) usage.
corrupted by pulsation, movement or saturation effects,
a theoretical bi-exponential decay function can be used        DCE-MRI pharmacokinetic modeling
as Cp . Published results with DCE-MRI using BioMap            Model-based pharmacokinetic analysis of T1 -weighted
include small animal studies [12,26,27]. Although BioMap       DCE-MRI used in the DCE@urLAB application tool is
Ortuño et al. BMC Bioinformatics 2013, 14:316                                                                                             Page 3 of 17
http://www.biomedcentral.com/1471-2105/14/316

open bi-compartmental, representing the blood plasma                        for Cp . In that case, the solution of Equation 1 for an
and the EES, and assume some basic concepts in tracer                       instantaneous bolus injection reduces to:
kinetics and MR [5]. As the CA does not enter the
intracellular space, this compartment is not considered
                                                                                                     2
                                                                                                                   e−K t/ve − e−mi t
                                                                                                                      trans

in the model. The blood plasma is associated with                               Ct (t) = DK trans             ai                      ,
                                                                                                                     mi − K trans /ve
the central compartment, the wash-out to the kidneys                                                  i=0
                                                                                                                                                  (2)
and the intake from the injected contrast, while the
                                                                                             2
                                                                                                          −mi t
EES is the peripheral compartment. This compartmen-                             Cp (t) = D         ai e
tal scheme is shown in Figure 1. We should note that a                                       i=0
bi-compartmental model does not consider the complex
biology of the tumor. Although multi-compartment mod-                       from which K trans and ve can be estimated through a min-
els have been proposed [40], the open bi-compartmental                      imization algorithm. Amplitudes ai and time constant mi
model has been able to fit DCE-DRI data surprisingly                        are estimated from a population average and D is the
well and is therefore widely accepted by the research                       injected CA dose. The extended or modified Tofts model
community. Time-course changes in tissue CA concen-                         [5] corresponds to the adding of the contribution of the
tration are modeled as a result of first-order exchange                     blood plasma fraction vp Cp (t) to account for the tracer in
of the CA molecules between compartments. A modi-                           the vasculature. In this case, the unknown parameters are
fied general rate equation [41] describes the CA accu-                      K trans , ve , and vp . The discrete approximation measured,
mulation and wash-out rate in the EES, under the                            or population averaged vascular plasma CA concentra-
assumption that the CA is well-mixed in the blood                           tions at sampling times, can be solved with least-squares
plasma:                                                                     minimization methods, e.g., using the matrix-vector for-
                                                                            mulation of the discrete convolution:
    dCe (t)   K trans
            =          Cp (t) − Ce (t) , vp Cp + ve Ce = Ct                      Ct (t) = Cp (t) ∗ K trans e−kep t                   (3)
      dt        ve
                                                         (1)
                                                                              The Tofts model produces reliable results if the tissue is
                                                                            weakly vascularized, while the extended Tofts model can
where Ce is the CA concentration in EES, Ct is the total
                                                                            also be applied to highly perfused tumors [43]. It is impor-
CA concentration in the tissue, vp is the fractional volume
                                                                            tant to note that the quantification of Tofts parameters
of blood plasma, and ve = K trans /kep is the fractional vol-
                                                                            requires the estimation Cp (t) from the acquired MR sig-
ume of EES. The physiological meaning of K trans depends
                                                                            nal. Thus, an additional MRI model has been included in
on the biological mechanism of CA exchange (i.e., blood
                                                                            the DCE@urLAB application and is discussed later.
flow, permeability, or a mixed case). If no prior informa-
tion about the tissue is available, then is prudent to leave                Hoffmann model
the interpretation open.                                                    The Hoffmann model [9] is derived from the Brix model
                                                                            [44] for fast bolus injection, and assumes that the CA
Tofts model                                                                 transfer from blood plasma to EES is a slow process. The
The Tofts pharmacokinetic model [8,42] is derived from                      model establishes a direct relationship between MR signal
Equation 1, excluding the contribution from vascular                        enhancement and CA exchange rates, without the need
plasma. Tofts originally proposed a bi-exponential model                    for AIF estimation and MR quantification. After the bolus
                                                                            injection, the model is described as:

                                                                                S(t)                          e−kep t − e−kel t
          Contrast agent (CA)                                                        = 1 + AH kep                                                 (4)
                                                                                 S0                             kel − kep

                                Transfer const. (Ktrans)
                                                                            where S(t) is the MR signal course from tissue and S0 is
                                                           Extracellular-   the MR signal before CA injection. The fitting parameters
   Haematocrit     Blood
                                                           extravascular
      (Htc)       plasma
                                                           space (EES)      are: kep ; AH , which approximately corresponds to the size
                                 Rate constant (kep)
                                                                            of the EES; and kel , the renal elimination constant.

              Renal excretion
                                                                            Larsson model
                                                                            The Larsson model [10] uses a known blood plasma CA
 Figure 1 Pharmacokinetic model. Body compartments accessed by
 low molecular weight CA injected intravenously (e.g., Gd-DTPA).
                                                                            concentration course, either measured from blood sam-
                                                                            ples or estimated from the MRI data. It is assumed that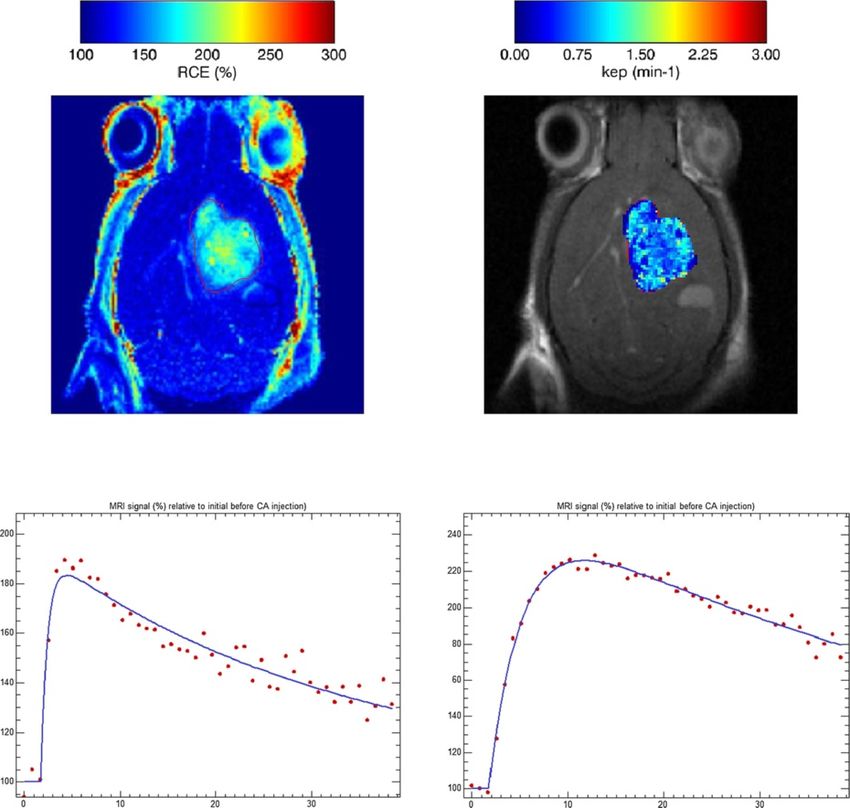
Ortuño et al. BMC Bioinformatics 2013, 14:316                                                                         Page 4 of 17
http://www.biomedcentral.com/1471-2105/14/316

the MR signal is linearly related to the CA concentration.              For spoiled gradient-echo pulse sequences with flip
In that case, the MR signal is modeled as:                            angle α, the MR signal is equal to:
                 ⎛      ⎞

               ⎜ Ṡ(t)        ⎟
                               N                                                       S0 1 − e−TR/T1 (t) sinα
               ⎜       ⎟       e−kep t − e−mi t                          S(t) =                                              (10)
   S(t) = S0 + ⎜       ⎟    ai                                  (5)                      1 − e−TR/T1 (t) cosα
               ⎝ N ⎠             mi − kep
                     ai i=0
                        i=0                                              The signal intensity is converted to CA concentration in
                                                                      tissue using the equation from [46] to calculate T1 (t):
where Ṡ(t) is the initial slope of the MR signal and S0 the
MR signal value prior to CA injection. Cp is approximated                                       ⎛                           ⎞
                                                                                                       S(t)−S0      1−m
as a sum of N exponentials with amplitudes ai and time                                 1        1 −     S0 sinα + 1−m cos α
constant mi .                                                           T1 (t)−1   =−    ln ⎝                               ⎠,
                                                                                      TR            S(t)−S0       1−m
                                                                                              1 − S0 sinα + 1−m cos α cosα
RR model
An alternative to a populations-based or estimated                            m = e−TR/T10
AIF, is the RR model [11]. The approach uses a                                                                               (11)
well-characterized tissue to combine two versions of
Equation 1, one for the RR and another one for the tissue             and CA concentration in tissue is calculated from
of interest. This allows the removal of Cp in the solution            Equation 7. Note that r1 and T10 must be known to
of the resulting equation [11].                                       quantify the tissue concentration from the MR signal.
                                  trans,r                          T10 may be estimated using the ratio of two spin-echo
             K trans                 K              K trans           images collected with different TR. The estimation error
    Ct (t) = trans,r Ct,r (t) +                  −
            K                           ve,r          ve              can be reduced with a higher number of images with a
               t                                              (6)
                          −K trans (t−t )/v                      least-squares minimization algorithm.
            ×      Ct,r t e                    e dt
                    0
                                                                      Estimation of model parameters
where Ct,r is the concentration of CA in the RR tissue and            Curve fitting routines have been implemented using inter-
K trans,r and ve,r are the quantitative parameters for the RR.        nal IDL functions and the freely available MPFIT IDL
                                                                      library [47]. MPFIT contains a set of non-linear regres-
MRI model                                                             sion algorithms for robust least-squares minimization,
The Tofts and RR models require the calibration of CA                 based on the freely available MINPACK package (Univ.
concentration from measured MRI parameters. If the bulk               of Chicago, http://www.netlib.org/minpack/) a library of
magnetic susceptibility (BMS) shift is negligible, the rela-          FORTRAN subroutines for solving nonlinear equation
tionship between T1 and CA concentration is determined                systems.
by the Solomon-Bloembergen equation [45]:                                DCE@urLAB uses the Levenberg-Marquardt algorithm
      1       1                                                       (LMA) [48] to perform the non-linear least squares
           =     + r1 Ct (t)                                    (7)   regression in each pixel of the analyzed ROI. LMA
    T1 (t)   T10
                                                                      has demonstrated robustness in the pharmacokinetic
where T10 is the T1 value before CA injection and r1 is               modeling of DCE-MRI [49]. LMA is used to estimate
the longitudinal relaxivity. The relationship between CA              appropriate parameters in several models: Tofts (with
concentration and the relative increase in signal intensity           bi-exponential Cp of Equation 2 or solving the discrete
can be derived from the Bloch equations for any imag-                 convolution Equation 3); the equivalent extended Tofts
ing sequence, e.g., the signal for a T1 -weighted spin-echo           model; Hoffmann (Equation 4); Larsson (Equation 5); and
pulse sequence (at short echo time) with repetition time              also the RR model (Equation 6).
(TR) is:                                                                 Pixel-based processing of dynamic MRI data can be
                                                                    demanding in terms of memory and CPU, and hardware
    S(t) = S0 1 − eTR/T1 (t)                             (8)          requirements will vary depending on the size of data sets,
                                                                      as well as the number of pixels selected. In any case, it
  From Equation 7 and 8, Ct is equal to:                              is recommended to run the program in systems with at
                                                                      least 2 GB of RAM memory. In addition to pharmacoki-
                                                                  netic modeling, model-free semi-quantitative analysis can
         1         1                 S0               1
Ct (t) =             ln                          −                  be performed, including IAUC (initial area under curve),
         r1       TR      S0 − S(t) 1 − e−TR/T10     T10              RCE (relative contrast enhancement) and TTM (time to
                                                                (9)   max enhancement) [50].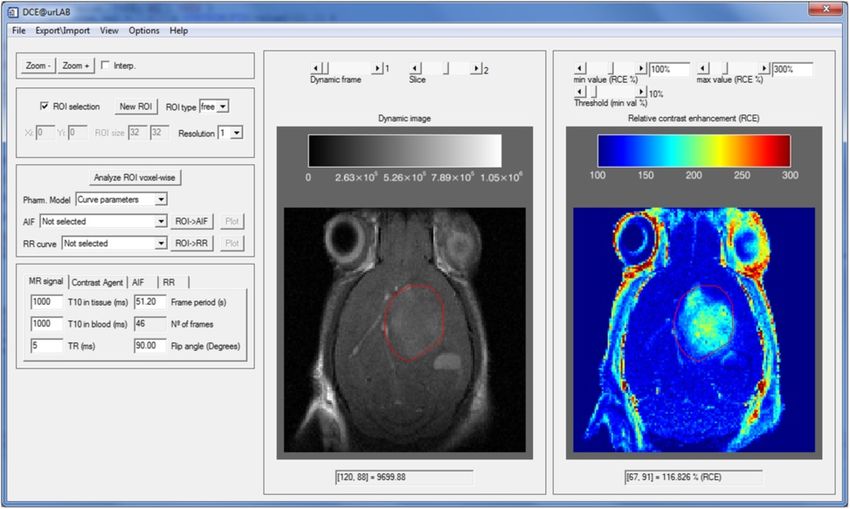
Ortuño et al. BMC Bioinformatics 2013, 14:316                                                                                               Page 5 of 17
http://www.biomedcentral.com/1471-2105/14/316

Description and use of the GUI                                                4D data set in the left display tab, and a relative con-
The DCE@urLAB GUI is composed of a main window,                               trast enhancement (RCE) image in the right display tab
which opens when the tool is executed, and auxiliary                          (Figure 2).
windows for results, input/output processes, or auxil-                          The platform is specially designed to perform ROI or
iary activities. Figure 2 shows an appearance of the main                     pixel-wise analysis over the selected ROI belonging to a
window once the DCE-MRI study is loaded in memory.                            single slice in the Z dimension (Z-slice for short). These
The complete and detailed functionality of the GUI is                         ROIs can be exported in a custom format and subse-
described in the user manual included in the download-                        quently imported in another work session. When required
able software package. A general overview is presented in                     for a specific MRI model, T10 maps can be loaded from
this section.                                                                 the menu file tab. AIF data can also be imported from
                                                                              previously saved sessions or external acquisitions.
Input data
The software tool accepts DCE-MRI sequences and aux-                          Displaying data sets
iliary inputs: T10 maps, AIF data and pre-calculated                          After loading a valid DCE-MRI sequence, main processing
ROIs. Interface functionality is disabled until a 4-                          options and menus will become activated. The user is now
dimensional DCE-MRI study is open. The tool considers                         able to select ROIs, change parameters, as well as config-
the sequence set to be a 4D stack of images in X-Y-Z-                         ure visualization options. Nevertheless, other options will
time order. Data can be imported from DICOM format,                           not be activated until a valid ROI is drawn or imported.
Bruker Biospin MRI data format (http://www.bruker.com/                           The user can navigate through dynamic frames or Z-
products/mr/mri.html), as well as from binary unformat-                       slices to select an active ROI for the pharmacokinetic
ted data. If the dynamic MR sequence is loaded properly,                      analysis. The color palette of both MRI and RCE dis-
the interface will show a single 2D slice of the whole                        plays can be changed by selecting this option on the menu

 Figure 2 Main window interface. In this example, a mouse brain tumor study is displayed: GL261 glioblastoma (see also the Results section). The
 main window interface is shown before the ROI has been selected. In the right side of the window, the RCE image is drawn with a “rainbow” color
 palette. The DCE-MRI image is drawn with “black & white” color palette in the central part. The Upper slides allow changing the current time frame
 and Z-slice. Other tabs, such as zoom options, ROI selection options, parametric selection and initial constants, are grouped in the left side of the
 main window interface.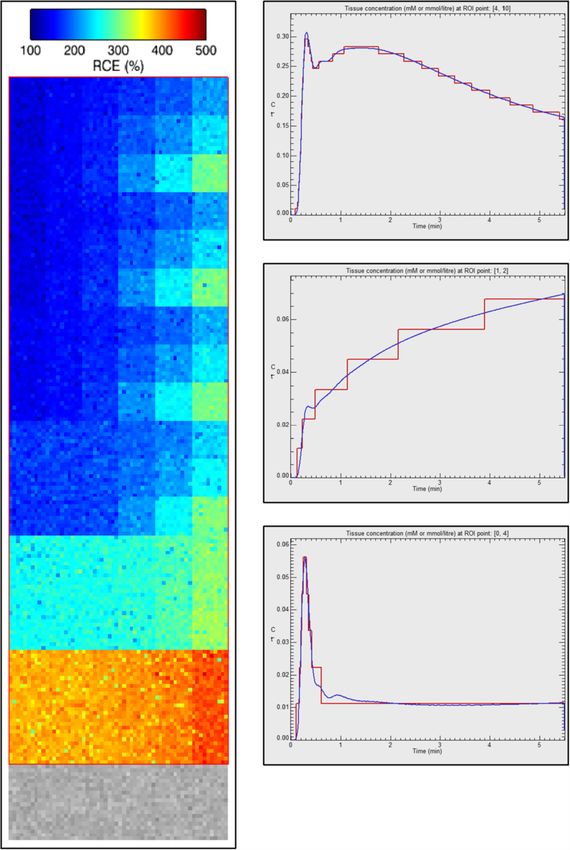
Ortuño et al. BMC Bioinformatics 2013, 14:316                                                                                          Page 6 of 17
http://www.biomedcentral.com/1471-2105/14/316

bar (options drop down menu). The user can addition-                       be deleted in every moment using the New ROI button
ally change the brightness, contrast, alpha channel, etc.                  and starting again. Finally, the user must also choose the
Pressing mouse buttons on the display images produces                      resolution in the Z-slice, i.e., select the pixel size for pro-
different actions depending on the ROI selection mode.                     cessing options. The finest resolution corresponds to the
When the ROI selection mode is not activated, the actions                  intrinsic resolution of the image, but the user can also
allowed are:                                                               select coarser resolutions from 2×2 to 10×10 pixels in the
                                                                           Z-slice (x-y plane). This option allows a direct comparison
  • Pressing the right mouse button on any image will
                                                                           with other applications using low-resolution maps. The
    plot the dynamic MR signal course of the pointed                       selected ROIs are currently limited to a single Z-slice.
    pixel.
  • If the left mouse button is pressed over the MRI                       Input parameters
    window, the value of the current pixel appears in the                  Processing input parameters should be checked before
    information label located at the bottom of the MRI                     each ROI analysis to obtain accurate results. Input param-
    window tab.                                                            eters are organized in tabs (located on the lower-right
  • When the left mouse button is pressed on the RCE                       of the main window interface). Each tab groups a set
    image, the RCE value (%) of the current pixel will be                  of related parameters. The MR signal tab contains MRI
    shown in the associated information label.                             data related constants (e.g., frame period, repetition time,
                                                                           etc.). The AIF tab groups the parameters used in the
Selecting and defining ROIs                                                bi-exponential model for the CA concentration in blood
If the ROI selection mode is activated, right and left mouse               plasma proposed by Tofts. The CA tab must be completed
buttons are used to manually place ROIs in the selected                    with information concerning the injected contrast (e.g.,
slice. The ROI types can be Box, Full or Free-drawing type.                injection frame, relaxivity, injected dose, etc.). Finally, the
The ROI definition depends on the type of ROI selected.                    RR tab contains additional data used in the reference
If a Box-type is selected, the upper left and bottom right                 region model. These input parameters will be used or
corners of the ROI are defined by pressing the left mouse                  not depending on the pharmacokinetic study selected,
button over the image, or alternatively, typing their X and                e.g., the AIF tab is only read when the Tofts model is
Y coordinates in editable text fields. If the Full ROI type                applied.
is selected, the current Z-slice is then defined as a ROI.
In the Free-drawing ROI type, the user moves the pointer                   Pharmacokinetic processing and analysis
while pressing down the left mouse button over the image                   Pharmacokinetic models are estimated by pressing the
to manually delineate the contour of the ROI. The ROI can                  Analyze ROI button. Note that this option is inactive until

 Figure 3 Pixel resolution. The pixel where pharmacokinetic modeling is performed can vary in resolution: From intrinsic image resolution (the
 finest) to coarse resolution. In the figure, two different coarse resolutions are shown for a mouse GL261 glioblastoma.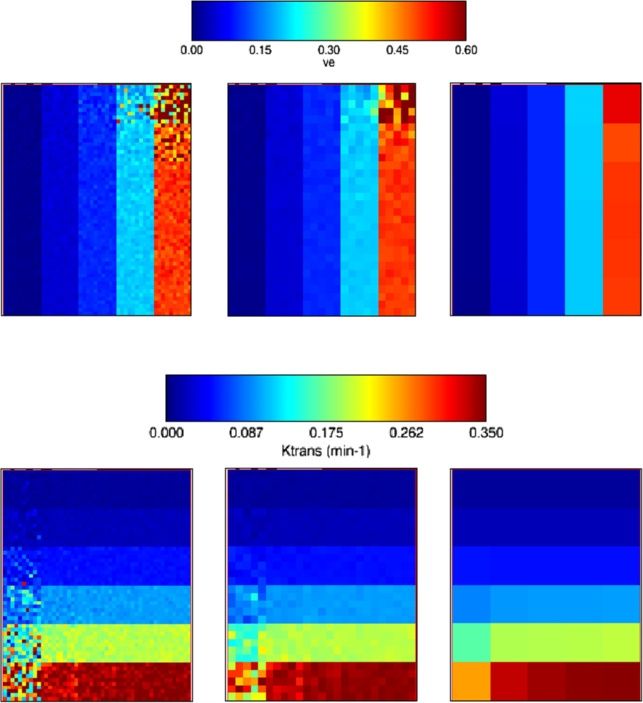
Ortuño et al. BMC Bioinformatics 2013, 14:316                                                                                           Page 7 of 17
http://www.biomedcentral.com/1471-2105/14/316

 Figure 4 Modeled and acquired DCE-MRI curves. Modeled (left) and acquired (right) DCE-MRI curves. The software tool can plot the time-course
 changes in individual pixels or in the whole ROI. The curve can be compared with the analytic pharmacokinetic model (left plot), where the
 acquired data are represented as dots and the fitted evolution as a continuous curve.

a valid ROI has been previously drawn or imported. Hoff-                    depending on the type of AIF loaded. Once the analy-
mann, Tofts (standard and extended), Larsson and RR                         sis is finished, the user can select the parameter to be
models can be selected for analysis. Model-free param-                      displayed or saved in disk, by using the drop lists associ-
eters (i.e., semi-quantitative parameters) are included as                  ated to each pharmacokinetic model. An example of the
an independent option. Analytical or numerical solu-                        result with Box-type ROIs and two different resolutions is
tions of the convolution integral are automatically chosen                  shown in Figure 3. The visualization menu located on the

 Figure 5 QIBA test data corresponding to the Tofts model. Left: RCE values of 30 combinations of K trans and ve values of simulated QIBA test
 data without added noise. Upper-right: curve-fitting with the Tofts model over two random points of the QIBA test data without noise. Lower-right:
 curve-fitting of the Tofts model adding Gaussian noise of zero mean and σ = 20% of the signal baseline.
Ortuño et al. BMC Bioinformatics 2013, 14:316                                                                                     Page 8 of 17
http://www.biomedcentral.com/1471-2105/14/316

 Figure 6 QIBA test data corresponding to the extended Tofts model. Left: RCE values of 108 parameter combinations, adding Gaussian noise of
 zero mean and σ = 20% of signal prior to CA injection. Right: Extended Tofts model fitting over three random ROIs where each ROI comprises a
 single 10×10 pixels box with common parameters.
Ortuño et al. BMC Bioinformatics 2013, 14:316                                                                                         Page 9 of 17
http://www.biomedcentral.com/1471-2105/14/316

left (Figure 2) can select the transparency and scale of the               Results
parametric map.                                                            Validation using simulated data
  The software tool also provides detailed information of                  Tofts and extended Tofts models have been validated with
the estimated pharmacokinetic model at pixel level; if the                 the Quantitative Imaging Biomarkers Alliance (QIBA)
left mouse button is pressed when the pointer is loca-                     DCE-MRI synthetic data, which are publicly available
ted over the ROI, the adjusted curve of the parametric                     at http://dblab.duhs.duke.edu. The physiologic model is
model associated to the selected pixel is plotted together                 described in [51] and was simulated using JSIM [52]. Two
with the DCE-MRI sequence values. An example of this                       sets of DCE-MRI images were used, corresponding to the
plot is shown in Figure 4. The plot represents the model                   Tofts model and the extended Tofts model. Data is avail-
curve with the estimated parameters displayed on the                       able in DICOM part 10 format. Simulation parameters of
right side.                                                                the Tofts model were: Flip angle, 30°; TR, 5 ms; time inter-
  Complementary results and data can be accessed from                      val between frames, 0.5 s; T10 in tissue, 1000 ms; T10 in
the menu bar, e.g., in the Export/import drop-down menu,                   blood vessels, 1440 ms; Haematocrit, 45%. A 10 minute
several options can be selected to export images shown on                  study was simulated, with injection of CA occurring at
the screen, ROI kinetics, or the set of parametric values                  60 s. The data in the test images was generated using
of the selected ROI. Single column, multiple column, and                   several combinations of K trans and ve . K trans takes values
matrix format are available.                                               {0.01, 0.02, 0.05, 0.1, 0.2, 0.35} min−1 and ve takes {0.01,

                       ve

                                       σ=20%                            σ=10%                              σ =2%

                    Ktrans

                                       σ=20%                            σ=10%                              σ=2%
 Figure 7 Parametric map of Tofts model applied to QIBA test data. K trans    and ve parametric maps calculated over the whole QIBA test data
 (Tofts model), adding Gaussian noise of σ = 20% of the signal baseline. Coarser resolutions of 2×2 and 10×10 pixel size, with an equivalent
 Gaussian noise of σ = 10% and 2% are also shown.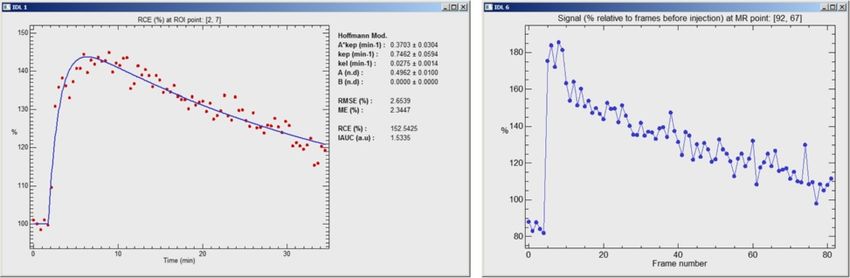
Ortuño et al. BMC Bioinformatics 2013, 14:316                                                                                           Page 10 of 17
http://www.biomedcentral.com/1471-2105/14/316

 Figure 8 Tofts model applied to QIBA test data. Standard deviations of K trans (upper) and ve (down) values calculated over the whole QIBA test
 data (Tofts model), adding Gaussian noise of σ = 20% of the signal baseline, and compared with the theoretical values plotted as the diagonal line.
Ortuño et al. BMC Bioinformatics 2013, 14:316 Page 11 of 17
http://www.biomedcentral.com/1471-2105/14/316
0.05, 0.1, 0.2, 0.5}. The image frames contain 10×10 pixels test data set. Box-type ROI covering the whole tissue
patches of each and combination. The vascular region was region was selected (i.e., 50×60 pixels with 30 combina-
located in the bottom strip of the image. An RCE image is tions K trans and ve values). Coarser resolutions were also
shown in Figure 5. studied (i.e., 2×2 and 10×10 pixel size), with an equiv-
The extended Tofts model data have the following alent Gaussian noise of σ = 10% and 2% of the signal
parameters: Flip angle, 25°; TR, 5 ms; time interval baseline, respectively. Noise level of σ = 20% is appre-
between frames, 0.5 s; T10 in tissue, 1000 ms; T10 in blood ciated in lower-right images in Figure 5, compared with
vessels, 1440 ms; Haematocrit, 45%. A 3.5 min study is noise free dynamic values of the same two pixels, shown
simulated, with injection of CA occurring at 5 s. The data in the upper-right graphs. The fitting of discrete convolu-
were generated using combinations of K trans ,ve and vp ; tion of Equation 3 was applied to all pixels in the selected
K trans varies over {0, 0.01, 0.02, 0.05, 0.1, 0.2} min−1 , ve ROI. Graphical results for and values are represented in
takes values {0.1, 0.2, 0.5}, while vp takes {0.001, 0.005, Figure 7. Standard deviations referenced to the theoreti-
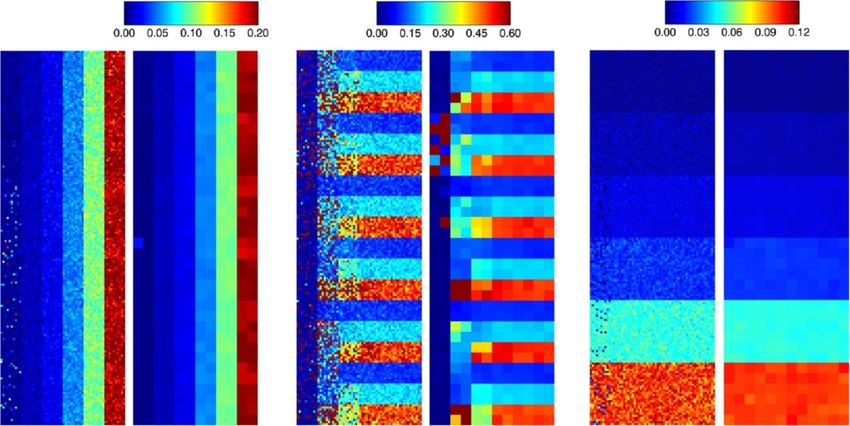
0.01, 0.02, 0.05, 0.1}. Each combination of these three cal values are represented in Figure 8 for K trans (up) and
parameters is contained in a 10×10 pixel patch. The vas- ve (bottom).
cular region is the bottom 60×20 pixels strip of the image.
An RCE image of this test data is represented in Figure 6. Results with Extended Tofts model applied to QIBA test data
The kinetic variation of three different combinations of Gaussian noise of zero mean and σ = 20% of the signal
parameters is also shown in Figure 6. It can be appreci- baseline was added to the test data set. A Box-type ROI
ated that the discretization uncertainty in this data set is of 60×180 pixels was selected to cover the 108 combina-
larger than in the former data set (Figure 5), and it is due tions of K trans , ve and vp values. A coarser resolution map
to the lower value of equilibrium magnetization used in of 5×5 pixel size, which reduces noise σ = 4% of the base-
the simulation. line signal level, was also calculated. Color maps of the
resultant parameters are represented in Figure 9. Standard
Results with Tofts model applied to QIBA test data deviations and bias referenced to the theoretical values are
Gaussian noise of zero mean and standard deviation (σ ) represented in Figure 10 for K trans (up) and vp (bottom).
equal to 20% of the signal baseline was added to the ve = 0.5 was used in all cases.
Ktrans (min-1) ve vp
σ=20% σ=4% σ=20% σ=4% σ=20% σ=4%
Figure 9 Parametric map of extended Tofts model applied to QIBA test data. Values of K trans , ve and vp maps using the extended Tofts model
supplied in the QIBA test data, adding Gaussian noise of σ = 20% of the signal baseline. Parametric maps using resolution of 5×5 pixels, resulting in
an equivalent noise of σ = 4%, are also shown.Ortuño et al. BMC Bioinformatics 2013, 14:316 Page 12 of 17 http://www.biomedcentral.com/1471-2105/14/316 Figure 10 Extended Tofts model applied to QIBA test data. Standard deviations of K trans (upper) and vp (down) values calculated over the whole QIBA test data of extended Tofts model, adding Gaussian noise of σ = 20% of the signal baseline. Values are compared with the theoretical values plotted as the diagonal line.
Ortuño et al. BMC Bioinformatics 2013, 14:316 Page 13 of 17
http://www.biomedcentral.com/1471-2105/14/316
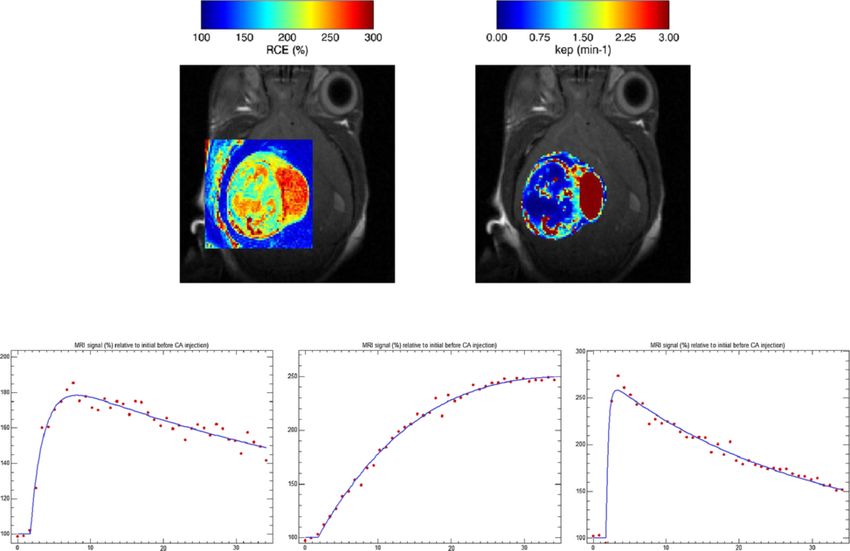
Example with mouse brain tumor thickness, 1 mm; in-plane resolution, 138×138 μm/pixel.
The platform has been tested over real acquisitions of The studies were carried out at the joint NMR facility of
T1 -weighted DCE-MRI small animal data. Two different the Universitat Autònoma de Barcelona and CIBER-BBN
C57BL/6 mouse models have been used in this study. (Cerdanyola del Vallès, Spain), using a 7 T horizontal mag-
First, a genetically engineered mouse (GEM, S100-v-ErbB; net (BioSpec 70/30; Bruker BioSpin, Ettlingen, Germany).
Ink4a-Arf(+/-)), female, age 40 weeks, bearing a Schwan- Pixel-wise Hoffmann analyses were performed over
noma (confirmed by histopathological studies carried out a manually delineated ROI in a Z-slice for both cases
by Dr. Martí Pumarola, Murine Pathology Unit, Centre (Figures 11 and 12, top). The MR signal courses are
de Biotecnologia Animal i Teràpia Gènica, UAB). Animals shown in Figures 11 and 12 (bottom) with signifi-
from this colony generally develop oligodendrogliomas cant differences in their biophysical parameters. For
[53], although a small percentage of animals can develop the GEM Schwannoma case, kep estimated values were
other tumour types [54]. The second model studied was a 0.54±0.05 min−1 for pixel (1) and 0.03±0.01 min−1 for
mouse bearing a stereotactically-induced GL261 glioblas- pixel (2), while pixel (3) region contains highly vascu-
toma, described elsewhere [55,56], age 20 weeks. larised tissue and the Hoffmann model did not apply
A bolus of CA (Gd-DTPA –Magnevist, Bayer Schering correctly in these cases (only a few pixels presented
Pharma AG, Berlin, Germany–, 50 mM in saline, acceptable fittings: an example is shown in Figure 11,
0.2 mmol/kg, 10 s duration) was manually injected after estimated kep = 2.81 ± 0.46 min−1 ). For the GL261
acquiring five pre-contrast images. A series of 41 dynamic glioblastoma example (Figure 12), the kep estimated values
spin-echo images was acquired with temporal resolu- were 1.41±0.23 min−1 (tumour border, better perfusion)
tion of 51.2 s per frame and the following parameters: and 0.29 ± 0.01 min−1 (tumour core). The mean kep value
TR/TE, 200/5 ms; field of view, 17.6×17.6 mm2 ; slice for this tumour was 0.77±0.35 min−1 , which is similar to
(1)
(3)
(2)
MRI signal (relative to baseline level)
(1) (2) (3)
kep=0.54±0.05 min-1 kep=0.03±0.01 min-1 kep=2.81±0.46 min-1
Time (min) Time (min) Time (min)
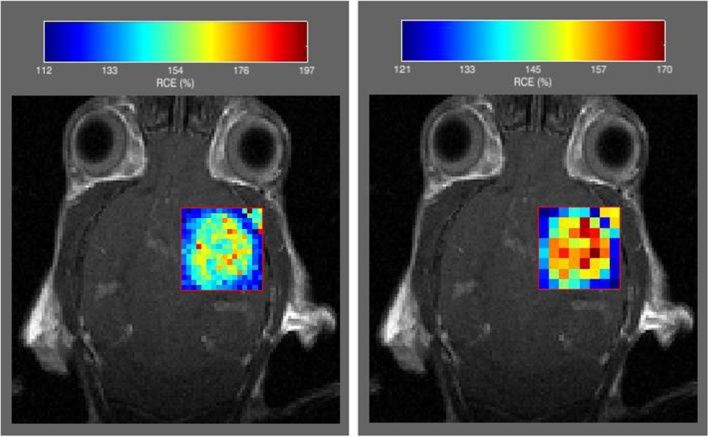
Figure 11 Pixel-wise Hoffmann analysis over a manually delineated ROI in a mouse Schwannomma. Upper-left: RCE image over a Box-type
ROI with the locations of three pixels. Upper-right: kep map over a Free-drawing ROI type (Hoffmann model). Lower: MR signal courses and fitted
Hoffmann model in the three selected pixels.Ortuño et al. BMC Bioinformatics 2013, 14:316 Page 14 of 17
http://www.biomedcentral.com/1471-2105/14/316
(1)
(2)
MRI signal (relative to baseline level)
(1) (2)
RCE (%)
RCE (%)
kep=1.41±0.23 min-1 kep=0.29±0.01 min-1
Time (min) Time (min)
Figure 12 Pixel-wise Hoffmann analysis over a manually delineated ROI in a stereotactically-induced mouse GL261 glioblastoma.
Upper left: RCE image over a Free-drawing ROI type with the locations of two pixels. Upper right: kep map (min−1 ) over a Free-drawing ROI type
(Hoffmann model). Lower: MR signal courses and fitted Hoffmann model in the two selected pixels.
the mean values calculated for other GL261 cases in our In both cases, the differences observed in the MR sig-
group (0.87 ± 0.59, n = 8). These values also agree with nal time courses between well-perfused and badly per-
previously described studies in the literature. For example, fused (hypoxic regions) agree with the ones described by
it was possible to calculate kep from K trans and ve values authors in [15,57].
reported by authors in [46], which studied a rat glioma
model: the kep value calculated was 0.86 min−1 . Regard- Computational implementation and requirements
ing to mouse glioma models, the same kep estimation DCE@urLAB has been implemented in a flexible and
approach was possible from the study performed in [7] modular way, so that the addition of new analysis mod-
taking into account graphs in their page 612: the estimated els is straightforward. The different models can also be
kep value in this case was 0.75 min−1 , for tumours with a used as inline functions to allow flexibility of use and batch
volume (60–80 mm3 ) similar to our GL261 (69±43 mm3 ). programming of multiple studies for advanced users.Ortuño et al. BMC Bioinformatics 2013, 14:316 Page 15 of 17
http://www.biomedcentral.com/1471-2105/14/316
Regarding complexity, the optimization (LMA) per- easy expert interpretation and pharmacokinetics valida-
formed in each pixel has a global algorithmic complexity tion. The most relevant and used models in literature
bound dependent on stopping criterion and number of (Tofts models) have been validated with publicly avail-
maximum iterations. The algorithmic complexity by iter- able simulated data. Preliminary experiments have been
ation is determined by the cost function (i.e., the pharma- conducted using T1 -weighted DCE-MRI dynamic data
cokinetic model) through the calculation of its jacobian from tumor-bearing mouse brains. A public release of
matrix. It has been experimentally verified that the com- DCE@urLAB, together with the open source code and
puting time needed to perform a pharmacokinetic analysis sample datasets, is available at http://www.die.upm.es/im/
depends linearly on the number of pixels contained in the archives/DCEurLAB/ and in Additional files 1 and 2.
ROI and the number of dynamic frames of DCE dataset.
This behaviour is expected since the average number of Availability and requirements
iterations of the LMA does not substantially change for Project name: DCE@urLAB 1.0
large number of pixels. For example, in a 2.8 GHz Intel Project home page: http://www.die.upm.es/im/archives/
Quad Core CPU with 8 GB RAM personal computer, DCEurLAB/
it took 20 seconds to fit a ROI of 1024 pixels and 40 Operating system(s): Microsoft Windows 7/Vista/XP
dynamic frames to the Tofts model. Although unrealis- Programming language: IDL
tic, because tumor ROIs are smaller, the complete analysis Other requirements: IDL 6.4 or higher, IDL Virtual
using the Tofts model of the whole DCE dynamic slice Machine 6.4 or higher
(128 × 128 = 16384 pixels) and 40 dynamic frames, License: BSD license
took about 5 minutes in the personal computer formerly
described. A maximum of 1.5 GB RAM was required
in this case. Should more computer power be required Additional files
(e.g., with higher resolution images), the program could be
easily parallelized and several cores used. Additional file 1: Compressed file (zip format) with executable
DCE@urLAB is designed to run under Microsoft Win- software, source code, and user manual. Unzip and read the file
“/help/DCEurLAB_UserGuide.pdf” for instructions and details.
dows XP/Vista/7 (both 32 and 64 bits). In order to use
Additional file 2: Compressed file (zip format) with examples to test
the application tool, IDL (version 6.4 or posterior) must and validate the DCE@urLAB application.
have been installed. Another possibility is to install the
IDL virtual machine (version 6.4 or posterior), which can Abbreviations
be downloaded freely and does not require a license. AIF: Arterial input function; BMS: Bulk magnetic susceptibility; CA: Contrast
agent; CPU: Central processing unit; DCE: Dynamic contrast-enhanced; DWI:
Diffusion weighted imaging; EES: Extracellular extravascular space; Gd-DTPA:
Conclusions Gadolinium-diethylene-triamine penta-acetic acid; GEM: Genetically
Up to date there is no friendly software application for engineered mouse; GUI: Graphical user interface; IAUC: Initial area under curve;
IDL: Interactive Data Language; LMA: Levenberg–Marquardt algorithm; MR:
pixel-wise and ROI analysis of DCE-MRI data that can Magnetic resonance; MRI: Magnetic resonance imaging; RAM: Random access
apply different pharmacokinetic models in a preclinical memory; RR : Reference region; RCE: Relative contrast enhancement; ROI:
environment. DCE@urLAB is a user-friendly software Region of Interest; TE: Echo time; TR: Repetitition time; TTM: Time to max
enhancement.
designed to fulfill the potential needs of the preclini-
cal DCE-MRI community. It has been focused on the Competing interests
analysis of T1 -weighted DCE-MRI studies, and tested The authors declare that they have no competing interests.
and optimized according to the requirements of pre-
Authors’ contributions
clinical data analysis. The proposed tool has also been JEO, RVS, MJLC and APC participated in the design of the application tool. JEO
specially designed for easy selection of multi-pixel ROIs. implemented the software. RVS and APC carried out test of the application
and software validation MJLC, CA and AS contributed with data interpretation.
The platform incorporates the compartmental pharma-
CA and AS coordinated the work. All authors contributed with the know-how
cokinetic models of Tofts, Hoffmann, Larsson, and RR, in biomedical imaging, helped to draft the manuscript and read and approved
complemented with non-parametric analysis. Pixel-wise the final version.
and ROI options allow the user to choose from a vari-
Acknowledgements
ety of forms and pixel sizes (i.e., resolutions). If required This work was partially supported by Spain’s Ministry of Science & Innovation
by the model, AIF and T10 maps can also be estimated through CDTI-CENIT (AMIT project), INNPACTO (PRECISION & XIORT projects),
from the acquired data. DCE@urLAB reads multi-slice PHENOIMA (SAF 2008-0332), MARESCAN (SAF 2011-23870), projects TEC2010-
21619-C04-03 & TEC2011-28972-C02-02; Comunidad de Madrid (ARTEMIS
DCE-MRI data from proprietary and binary raw formats. S2009/DPI-1802), and IMAFEN (2008–2009), PROGLIO (2010–2011) and
Results can be exported as color maps superimposed PROGLIO2 (2012–2013), intramural projects of CIBER-BBN, with contribution
to the DCE image, or as text files that can easily be from European Regional Development Funds (FEDER). CIBER-BBN is an
initiative funded by the VI National R&D&i Plan 2008–2011, Iniciativa Ingenio
read with other statistical software packages. Individual 2010, Consolider Program, CIBER Actions and financed by the Instituto de Salud
pixel and ROI dynamic curves can also be visualized, for Carlos III with assistance from the European Regional Development Fund.Ortuño et al. BMC Bioinformatics 2013, 14:316 Page 16 of 17
http://www.biomedcentral.com/1471-2105/14/316
Author details 15. Cho HJ, Ackerstaff E, Carlin S, Lupu ME, Wang Y, Rizwan A, O’Donoghue J,
1 CIBER de Bioingeniería, Biomateriales y Nanomedicina (CIBER-BBN), 50018 Ling CC, Humm JL, Zanzonico PB, Koutcher JA: Noninvasive
Zaragoza, Spain. 2 Biomedical Image Technologies Group, Departamento de multimodality imaging of the tumor microenvironment: registered
Ingeniería Electrónica, Universidad Politécnica de Madrid, 28040 Madrid, Spain. dynamic magnetic resonance imaging and positron emission
3 Department of Maternal-Fetal Medicine (ICGON), Fetal and Perinatal Medicine tomography studies of a preclinical tumor model of tumor hypoxia.
Research Group (IDIBAPS), Hospital Clínic, Universitat de Barcelona, Sabino de Neoplasia 2009, 11(3):247–259.
Arana 1- Helios III, 08028 Barcelona, Spain. 4 Departament de Bioquímica i 16. Muruganandham M, Lupu M, Dyke JP, Matei C, Linn M, Packman K,
Biologia Molecular, Unitat de Biociències, Universitat Autònoma de Barcelona, Kolinsky K, Higgins B, Koutcher JA: Preclinical evaluation of tumor
Edifici Cs, Campus UAB, 08193 Cerdanyola del Vallès, Spain. 5 Institut de microvascular response to a novel antiangiogenic/antitumor agent
Biotecnologia i de Biomedicina Vicent Villar Palasí (IBB), Universitat Autònoma RO0281501 by dynamic contrast-enhanced MRI at 1.5 T. Mol Cancer
de Barcelona, Edifici Cs, Campus UAB, 08193 Cerdanyola del Vallès, Spain. Ther 2006, 5(8):1950–1957.
17. Yang XY, Liang JC, Heverhagen JT, Jia G, Schmalbrock P, Sammet S, Koch
Received: 18 July 2013 Accepted: 28 October 2013 R, Knopp MV: Improving the pharmacokinetic parameter
Published: 4 November 2013 measurement in dynamic contrast-enhanced MRI by use of the
arterial input function: theory and clinical application. Magn Reson
Med 2008, 59(6):1448–1456.
References
18. Stefanovski D, Moate PJ, Boston RC: WinSAAM: a windows-based
1. Leach MO, Brindle KM, Evelhoch JL, Griffiths JR, Horsman MR, Jackson A,
compartmental modeling system. Metabolism 2003, 52(9):1153–1166.
Jayson GC, Judson IR, Knopp MV, Maxwell RJ, McIntyre D, Padhani AR,
Price P, Rathbone R, Rustin GJ, Tofts PS, Tozer GM, Vennart W, Waterton 19. JPKD 3.0, Java PK for Desktop. http://pkpd.kmu.edu.tw/jpkd/.
JC, Williams SR, Workmanw P: The assessment of antiangiogenic and 20. Barrett PHR, Bell BM, Cobelli C, Golde H, Schumitzky A, Vicini P, Foster DM:
antivascular therapies in early-stage clinical trials using magnetic SAAM II: simulation, analysis, and modeling software for tracer and
resonance imaging: issues and recommendations. Brit J Cancer 2005, pharmacokinetic studies. Metabolism 1998, 47(4):484–492.
92(9):1599–1610. 21. Rausch M, Stoeckli M: BioMap. http://www.maldi-msi.org/.
2. Yankeelov TE, Gore JC: Dynamic contrast enhanced magnetic 22. Cetin O: An analysis tool to calculate permeability based on the
resonance imaging in oncology: theory, data acquisition, analysis, patlak method. J Med Syst 2012, 36(3):1317–1326.
and examples. Curr Med Imaging Rev 2007, 3(2):91–107. 23. Daniel P: Barboriak Laboratory, Duke University School of Medicine:
3. Choyke PL, Dwyer AJ, Knopp MV: Functional tumor imaging with Toppcat, T1-weighted Perfusion Imaging Parameter Calculation
dynamic contrast-enhanced magnetic resonance imaging. J Magn Toolkit. http://dblab.duhs.duke.edu/modules/dblabs_topcat/.
Reson Imaging 2003, 17(5):509–520. 24. Whitcher B, Schmid VJ: Quantitative analysis of dynamic
4. Collins DJ, Padhani AR: Dynamic magnetic resonance imaging of contrast-enhanced and diffusion-weighted magnetic resonance
tumor perfusion. IEEE Eng Med Biol 2004, 23(5):65–83. imaging for oncology in R. J Stat Softw 2011, 44(5):1–29.
5. Tofts PS: Modeling tracer kinetics in dynamic Gd-DTPA MR imaging. 25. Ferl GZ: DATforDCEMRI: an R package for deconvolution analysis
J Magn Reson Imaging 1997, 7:91–101. and visualization of DCE-MRI data. J Stat Softw 2011, 44(3):1–18.
6. Kiessling F, Farhan N, Lichy MP, Vosseler S, Heilmann M, Krix M, Bohlen P, 26. Keyzer FD, Vandecaveye V, Thoeny H, Chen F, Ni Y, Marchal G, Hermans R,
Miller DW, Mueller MM, Semmler W, Fusenig NE, Delorme S: Dynamic Nuyts S, Landuyt W, Bosmans H: Dynamic Contrast-enhanced and
contrast-enhanced magnetic resonance imaging rapidly indicates diffusion-weighted MRI for early detection of tumoral changes in
vessel regression in human squamous cell carcinomas grown in single-dose and fractionated radiotherapy: evaluation in a rat
nude mice caused by VEGF receptor 2 blockade with DC101. rhabdomyosarcoma model. Eur Radiol 2009, 19(11):2663–2671.
Neoplasia 2004, 6(3):213–223. 27. Wang HJ, Li JJ, Chen F, Keyzer FD, Yu J, Feng YB, Nuyts J, Marchal G, Ni YC:
7. Pike MM, Stoops CN, Langford CP, Akella NS, Nabors LB, Gillespie GY: Morphological, functional and metabolic imaging biomarkers:
High-resolution longitudinal assessment of flow and permeability assessment of vascular-disrupting effect on rodent liver tumours.
in mouse glioma vasculature: sequential small molecule and SPIO Eur Radiol 2010, 20(8):2013–2026.
dynamic contrast agent MRI. Magn Reson Med 2009, 61(3):615–625. 28. Patlak CS, Blasberg RG, Fenstermacher JD: Graphical evaluation of
8. Tofts PS, Kermode AG: Measurement of the blood-brain barrier blood-to-brain transfer constants from multiple-time uptake data.
permeability and leakage space using dynamic MR imaging. 1. J Cerebr Blood F Met 1983, 3:1–7.
fundamental concepts. Magn Reson Med 1991, 17(2):357–367. 29. U. S. National Institutes of Health Bethesda, MD: ImageJ, Image
Processing and Analysis in Java. http://imagej.nih.gov/ij/.
9. Hoffmann U, Brix G, Knopp MV, Hess T, Lorenz WJ: Pharmacokinetic
30. R Development Core Team: R: A language and Environment for Statistical
mapping of the breast - a new method for dynamic MR
Computing. Vienna: R Foundation for Statistical Computing; 2011.
mammography. Magn Reson Med 1995, 33(4):506–514.
http://www.R-project.org/.
10. Larsson HBW, Stubgaard M, Frederiksen JL, Jensen M, Henriksen O, 31. Orton MR, d’Arcy JA, Walker-Samuel S, Hawkes DJ, Atkinson D, Collins DJ,
Paulson OB: Quantitation of blood-brain-barrier defect by magnetic- Leach MO: Computationally efficient vascular input function models
resonance-imaging and gadolinium-DTPA in patients with multiple for quantitative kinetic modelling using DCE-MRI. Phys Med Biol 2008,
sclerosis and brain tumors. Magn Reson Med 1990, 16:117–131. 53(5):1225–1239.
11. Yankeelov TE, Luci JJ, Lepage M, Li R, Debusk L, Lin PC, Price RR, Gore JC: 32. Ferl GZ, Xu L, Friesenhahn M, Bernstein LJ, Barboriak DP, Port RE: An
Quantitative pharmacokinetic analysis of DCE-MRI data without an automated method for nonparametric kinetic analysis of clinical
arterial input function: a reference region model. Magn Reson DCE-MRI data: application to glioblastoma treated with
Imaging 2005, 23(4):519–529. bevacizumab. Magn Reson Med 2010, 63(5):1366–1375.
12. Weidensteiner C, Rausch M, McSheehy PMJ, Allegrini PR: Quantitative 33. Bradley DP, Tessier JJ, Lacey T, Scotta M, Jurgensmeier JM, Odedra R,
dynamic contrast-enhanced MRI in tumor-bearing rats and mice Mills J, Kilburn L, Wedge SR: Examining the acute effects of cediranib
with inversion recovery TrueFISP and two contrast agents at 4.7 T. (RECENTIN, AZD2171) treatment in tumor models: a dynamic
J Magn Reson Imaging 2006, 24(3):646–656. contrast-enhanced MRI study using gadopentate. Magn Reson
13. Kim JH, Im GH, Yang J, Choi D, Lee WJ, Lee JH: Quantitative dynamic Imaging 2009, 27(3):377–384.
contrast-enhanced MRI for mouse models using automatic 34. Loveless ME, Lawson D, Collins M, Nadella MVP, Reimer C, Huszar D,
detection of the arterial input function. NMR Biomed 2012, Halliday J, Waterton JC, Gore JC, Yankeelov TE: Comparisons of the
25(4):674–684. efficacy of a Jak1/2 Inhibitor (AZD1480) with a VEGF signaling
14. Jensen LR, Huuse EM, Bathen TF, Goa PE, Bofin AM, Pedersen TB, inhibitor (cediranib) and sham treatments in mouse tumors using
Lundgren S, Gribbestad IS: Assessment of early docetaxel response in DCE-MRI, DW-MRI, and histology. Neoplasia 2012, 14:54–64.
an experimental model of human breast cancer using DCE-MRI, ex 35. Kim H, Folks KD, Guo LL, Stockard CR, Fineberg NS, Grizzle WE, George JF,
vivo HR MAS, and in vivo H-1 MRS. NMR Biomed 2010, 23:56–65. Buchsbaum DJ, Morgan DE, Zinn KR: DCE-MRI detects early vascularOrtuño et al. BMC Bioinformatics 2013, 14:316 Page 17 of 17
http://www.biomedcentral.com/1471-2105/14/316
response in breast tumor xenografts following anti-DR5 therapy. 56. Simoes RV, García-Martín ML, Cerdán S, Arús C: Perturbation of mouse
Mol Imaging Biol 2011, 13:94–103. glioma MRS pattern by induced acute hyperglycemia. NMR Biomed
36. Yankeelov TE, DeBusk LM, Billheimer DD, Luci JJ, Lin PC, Price RR, Gore JC: 2008, 21(3):251–264.
Repeatability of a reference region model for analysis of murine 57. Stoyanova R, Huang K, Sandler K, Cho H, Carlin S, Zanzonico PB,
DCE-MRI data at 7T. J Magn Reson Imaging 2006, 24(5):1140–1147. Koutcher JA, Ackerstaff E: Mapping tumor hypoxia in vivo using
37. Kato Y, Okollie B, Artemov D: Noninvasive H-1/C-13 magnetic pattern recognition of dynamic contrast-enhanced MRI data.
resonance spectroscopic imaging of the intratumoral distribution of Trans Oncol 2012, 5(6):437–447.
temozolomide. Magn Reson Med 2006, 55(4):755–761.
38. Artemov D, Solaiyappan M, Bhujwalla ZM: Magnetic resonance doi:10.1186/1471-2105-14-316
pharmacoangiography to detect and predict chemotherapy Cite this article as: Ortuño et al.: DCE@urLAB: a dynamic contrast-enhanced
delivery to solid tumors. Cancer Res 2001, 61(7):3039–3044. MRI pharmacokinetic analysis tool for preclinical data. BMC Bioinformatics
39. Luo YP, Jiang F, Cole TB, Hradil VP, Reuter D, Chakravartty A, Albert DH, 2013 14:316.
Davidsen SK, Cox BF, McKeegan EM, Fox GB: A novel multi-targeted
tyrosine kinase inhibitor, linifanib (ABT-869), produces functional
and structural changes in tumor vasculature in an orthotopic rat
glioma model. Cancer Chemoth Pharm 2012, 69(4):911–921.
40. Port RE, Knopp MV, Hoffmann U, Milker-Zabel S, Brix G:
Multicompartment analysis of gadolinium chelate kinetics:
blood-tissue exchange in mammary tumors as monitored by
dynamic MR imaging. J Magn Reson Imaging 1999, 10(3):233–241.
41. Kety SS: The theory and applications of the exchange of inert gas at
the lungs and tissues. Pharmacol Rev 1951, 3:1–41.
42. Tofts PS, Berkowitz B, Schnall MD: Quantitative analysis of dynamic
Gd-DTPA enhancement in breast tumors using a permeability
model. Magn Reson Med 1995, 33(4):564–568.
43. Sourbron SP, Buckley DL: On the scope and interpretation of the Tofts
models for DCE-MRI. Magn Reson Med 2011, 66(3):735–745.
44. Brix G, Semmler W, Port R, Schad LR, Layer G, Lorenz WJ:
Pharmacokinetic parameters in CNS Gd-DTPA enhanced MR
imaging. J Cerebr Blood F Met 1991, 15(4):621–628.
45. Haase A, Frahm J, Matthaei D, Hanicke W, Merboldt KD: Flash imaging -
rapid NMR imaging using low flip-angle pulses. J Magn Reson 1986,
67(2):258–266.
46. Li X, Rooney WD, Varallyay CG, Gahramanov S, Muldoon LL, Goodman JA,
Tagge IJ, Selzer AH, Pike MM, Neuwelt EA, Springer CS:
Dynamic-contrast-enhanced-MRI with extravasating contrast
reagent: rat cerebral glioma blood volume determination. J Magn
Reson 2010, 206(2):190–199.
47. Markwardt CB: Non-linear least squares fitting in IDL with MPFIT.
In c XVIII, Volume 411. Edited by Bohlender D, Dowler P, Durand D.
Quebec: Astronomical Society of the Pacific; 2009:251–254.
48. Marquardt DW: An algorithm for least-squares estimation of
nonlinear parameters. J Soc Ind Appl Math 1963, 11(2):431–441.
49. Ahearn TS, Staff RT, Redpath TW, Semple SIK: The use of the
Levenberg-Marquardt curve-fitting algorithm in pharmacokinetic
modelling of DCE-MRI data. Phys Med Biol 2005, 50(9):N85–N92.
50. Parker GJM, Buckley DL: Tracer kinetic modelling for T1-weighted
DCE-MRI. In Dynamic Contrast-Enhanced Magnetic Resonance Imaging in
Oncology, Medical Radiology: Diagnostic, Imaging and Radiation
Oncology. Edited by Jackson A, Buckley DL, Parker GJM. Berlin:
Springer-Verlag; 2003:81–92.
51. Barboriak DP, MacFall JR, Viglianti BL, Dewhirst MW: Comparison of
three physiologically-based pharmacokinetic models for the
prediction of contrast agent distribution measured by dynamic MR
imaging. J Magn Reson Imaging 2008, 27(6):1388–1398. Submit your next manuscript to BioMed Central
52. Raymond GM, Butterworth E, Bassingthwaighte JB: JSIM: free software and take full advantage of:
package for teaching physiological modeling and research. FASEB J
2003, 17(4):A390–A390.
• Convenient online submission
53. Weiss WA, Burns MJ, Hackett C, Aldape K, Hill JR, Kuriyama H, Kuriyama N,
Milshteyn N, Roberts T, Wendland MF, DePinho R, Israel MA: Genetic • Thorough peer review
determinants of malignancy in a mouse model for • No space constraints or color figure charges
oligodendroglioma. Cancer Res 2003, 63(7):1589–1595.
54. Delgado-Goni T, Martin-Sitjar J, Simoes RV, Acosta M, Lope-Piedrafita S, • Immediate publication on acceptance
Arús C: Dimethyl sulfoxide (DMSO) as a potential contrast agent for • Inclusion in PubMed, CAS, Scopus and Google Scholar
brain tumors. NMR Biomed 2013, 26(2):173–184. • Research which is freely available for redistribution
55. Cha S, Johnson G, Wadghiri YZ, Jin O, Babb J, Zagzag D, Turnbull DH:
Dynamic, contrast-enhanced perfusion MRI in mouse gliomas:
correlation with histopathology. Magn Reson Med 2003, 49(5):848–855. Submit your manuscript at
www.biomedcentral.com/submitYou can also read