THE DANISH AIR QUALITY MONITORING PROGRAMME - Annual Summary for 2012 AU
←
→
Page content transcription
If your browser does not render page correctly, please read the page content below
THE DANISH AIR QUALITY MONITORING
PROGRAMME
Annual Summary for 2012
Scientific Report from DCE – Danish Centre for Environment and Energy   No. 67   2013

AU
              AARHUS
              UNIVERSITY
              DCE – DANISH CENTRE FOR ENVIRONMENT AND ENERGY
THE DANISH AIR QUALITY MONITORING
     PROGRAMME
     Annual Summary for 2012

     Scientific Report from DCE – Danish Centre for Environment and Energy   No. 67   2013

     Thomas Ellermann
     Jacob Klenø Nøjgaard
     Claus Nordstrøm
     Jørgen Brandt
     Jesper Christensen
     Matthias Ketzel
     Stefan Jansen
     Andreas Massling
     Steen Solvang Jensen

     Aarhus University, Department of Environmental Science

AU
     AARHUS
     UNIVERSITY
     DCE – DANISH CENTRE FOR ENVIRONMENT AND ENERGY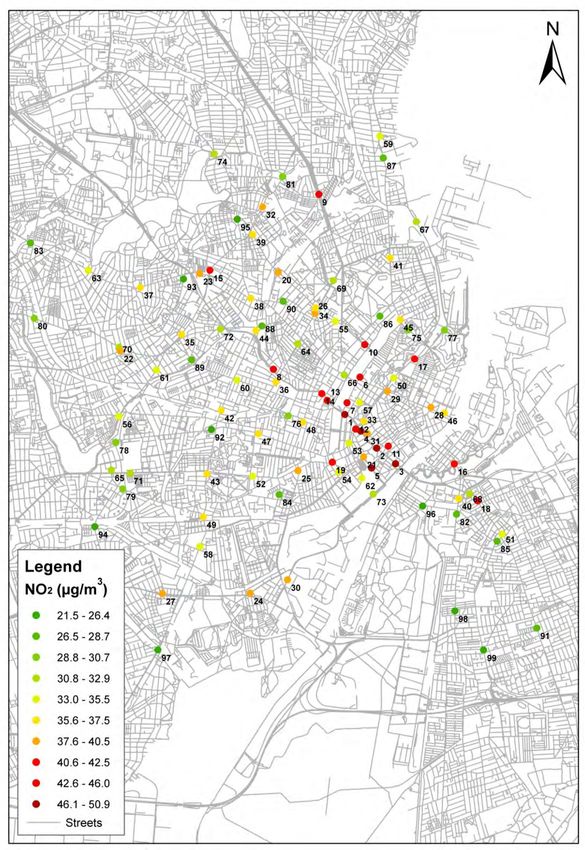
Data sheet

    Series title and no.:   Scientific Report from DCE – Danish Centre for Environment and Energy No. 67

                  Title:    The Danish Air Quality Monitoring Programme
                Subtitle:   Annual Summary for 2012

               Authors:     Thomas Ellermann, Jacob Klenø Nøjgaard, Claus Nordstrøm, Jørgen Brandt, Jesper
                            Christensen, Matthias Ketzel, Stefan Jansen, Andreas Massling & Steen Solvang
                            Jensen
           Department:      Institute of Environmental Science

              Publisher:    DCE – Danish Centre for Environment and Energy
                            Aarhus University - Denmark
                   URL:     http://www.dce.au.dk

    Year of publication:    October 2013

               Referee:     Ole Hertel

    Technical support:      Lone Grundahl, Bjarne Jensen, Christina F. Emborg, Henrik W. Madsen, Birgit
                            Thomsen, Jane Søfting, Lizzi Stausgaard, Hans P. Ahleson, Hans Nielsen, Mary-Ann
                            Chrillesen, Jonna Riedel & Stephan Bernberg.

     Financial support:     Ministry of the Environment and Municipalities of Copenhagen, Aalborg, Aarhus and
                            Odense.

         Please cite as:    Ellermann, T., Nøjgaard, J.K., Nordstrøm, C., Brandt, J., Christensen, J., Ketzel, M.,
                            Jansen, S., Massling, A. & Jensen, S. S. 2013: The Danish Air Quality Monitoring
                            Programme. Annual Summary for 2012. Aarhus University, DCE – Danish Centre for
                            Environment and Energy. 59 pp. Scientific Report from DCE – Danish Centre for En-
                            vironment and Energy. No. 67. http://dce2.au.dk/pub/SR67.pdf

                            Reproduction permitted provided the source is explicitly acknowledged

               Abstract:    The air quality in Danish cities has been monitored continuously since 1982 within
                            the Danish Air Quality Monitoring network. The aim is to follow the concentration lev-
                            els of toxic pollutants in the urban atmosphere and to provide the necessary
                            knowledge to assess the trends, to perform source apportionment, and to understand
                            the governing processes that determine the level of air pollution in Denmark. In 2012
                            the air quality was measured in four Danish cities and at two background sites. In
                            addition model calculations were carried out to supplement the measurements. At
                            one street station (H.C. Andersens Boulevard) in Copenhagen NO2 was found in
                            concentrations above EU limit values while NO2 levels in Odense, Aarhus and Aal-
                            borg were below the limit value. Model calculations indicate exceedances of NO2 limit
                            values at several streets in Copenhagen. Annual averages of PM10 and PM2.5 were
                            below limit values at all stations. The concentrations for most pollutants have been
                            decreasing during the last decades.

             Keywords:      Atmospheric pollution, urban pollution, nitrogen compounds, ozone, sulphur com-
                            pounds, heavy metals, volatile organic pollutants, dispersion models and measure-
                            ments.

                Layout:     Majbritt Pedersen-Ulrich

                ISBN:       978-87-7156-019-0
     ISSN (electronic):     1600-0048

     Number of pages:       59

       Internet version:    The report is available in electronic format (pdf) at DCE website
                            http://dce2.au.dk/pub/SR67.pdf

2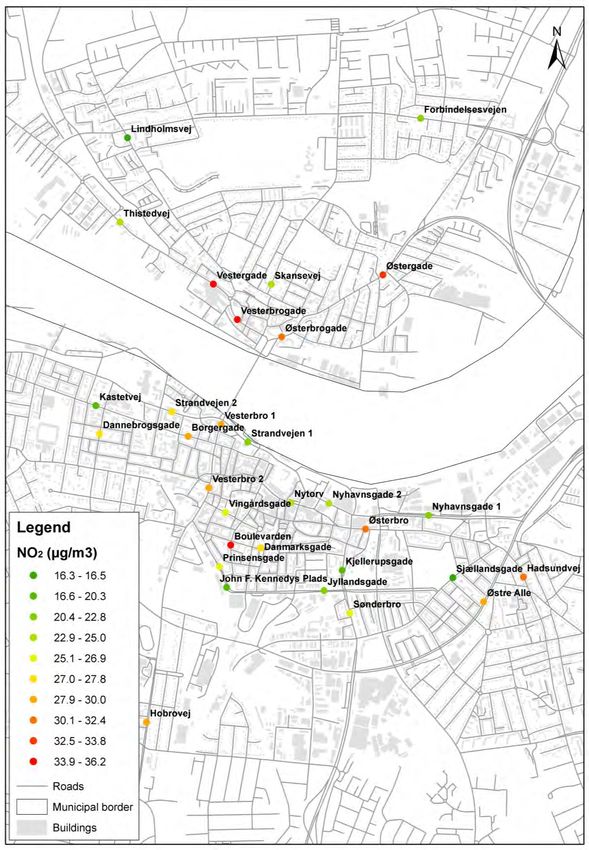
Contents

Summary and Conclusion                                    5

Danish summary - Dansk resumé                             7

1      Introduction                                       9

2      Measurements and model calculations                11
2.1     Measurements                                      11
2.2     Model calculations                                13

3      Nitrogen oxides                                    15
3.1     Annual statistics                                 15
3.2     Trends                                            16
3.3     Results from model calculations                   18
        3.3.1 Model calculations for Copenhagen           19
        3.3.2 Model calculations for Aalborg              23

4      Ozone                                              25
4.1     Annual statistics                                 25
4.2     Trends                                            26
4.3     Results from model calculations                   27

5      Carbon monoxide                                    30
5.1     Annual statistics                                 30
5.2     Trends                                            30

6      Benzene and Toluene                                32
6.1     Annual statistics                                 32
6.2     Trends                                            33

7      Particles (TSP, PM10, PM2.5 and particle number)   34
7.1     Annual statistics                                 35
7.2     Trends                                            37
7.3     Impact of salt from winter salting and sea        39

8      Heavy Metals                                       41
8.1     Annual statistics                                 41
8.2     Trends                                            42

9      Sulphur dioxide                                    44
9.1     Annual statistics                                 44
9.2     Trends                                            44

10 Polyaromatic Hydrocarbons (PAHs)                       46
10.1    Annual Statistics                                 46
10.2    Trends                                            48

11 Organic carbon and elemental carbon                    49
11.1    Annual statistics                                 49

                                                           3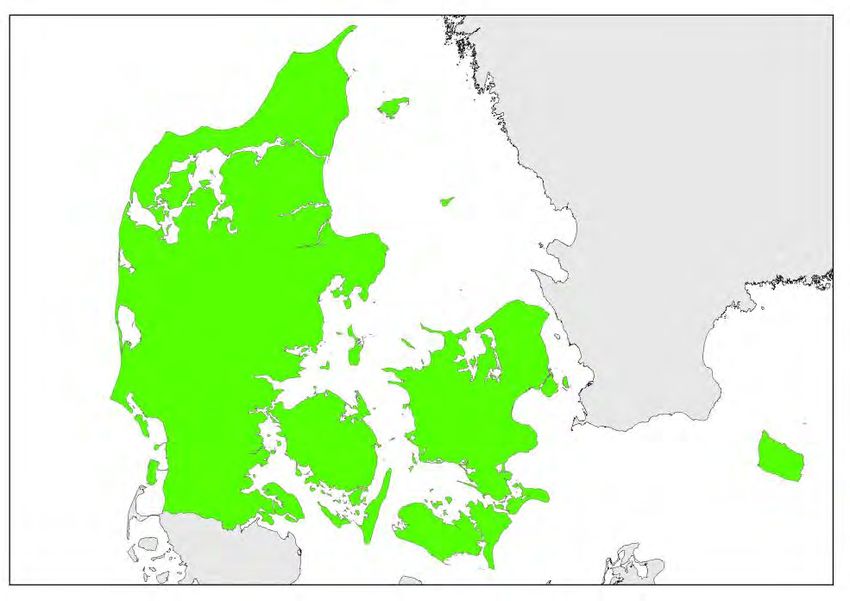
12 Chemical composition of PM2.5         51

    13 Ozone precursors                      54
    13.1   Annual statistics                 54

    14 References                            55

    Appendix 1                               58
    Pollutants measured in the LMP Network   58

4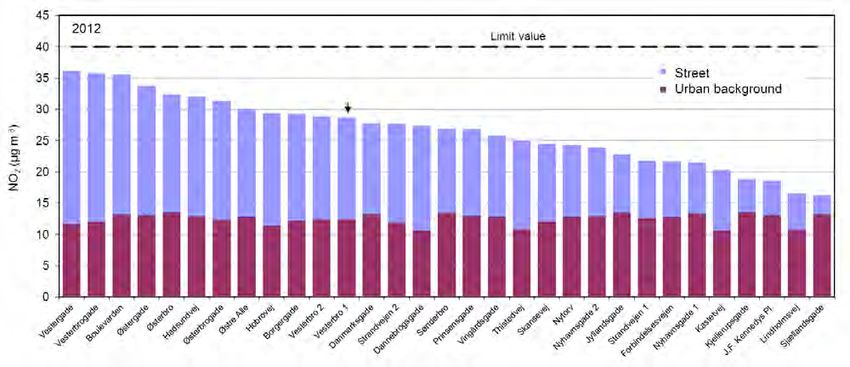
Summary and Conclusion

This report presents the result from the Danish Air Quality Monitoring
Programme in 2012. The monitoring programme is carried out by the
DCE - Danish Centre for Environment and Energy (DCE) at Aarhus Uni-
versity. The core part of this programme consists of continuous meas-
urements at nine monitoring stations; seven stations situated in the four
largest cities and two stations located in background areas. These meas-
urements are supplemented with model calculations using DCE’s air
quality models.

The aim of the program is to monitor air pollutants relevant to human
health in accordance with the EU air quality directives. The programme
includes measurements of sulphur dioxide (SO2), nitrogen oxides
(NOx/NO2), particulate mass (PM10 and PM2.5), particle number, benzene
(C6H6), toluene (C7H8), carbon monoxide (CO), ozone (O3), lead (Pb), ar-
senic (As), cadmium (Cd), mercury (Hg), nickel (Ni), and polycyclic ar-
omatic hydrocarbons (PAH). In 2009 the programme was expanded with
measurements of a number of volatile organic compounds (VOC’s) that
are precursors for formation of ozone. The measurements and model cal-
culations are used to evaluate the Danish air quality in relation to limit
values as well as to follow trends. Further, the program serves as basis
for determination of sources of the air pollutants, basis for evaluation of
the impact of regulations of emissions and as basis for various research
projects related to air quality.

In 2012 the daily limit value for PM10 were not exceeded at any station in
the measuring network including stations where exceedances previously
have occurred (e.g. the two traffic stations in Copenhagen). There were
likewise no exceedances of the annual limit values for PM10 (40 µg/m3)
and PM2.5 (25 µg/m3 from 2015).

The number of particles in ambient air was about 14000 particles per cm3
at the street station H.C. Andersens Boulevard. This is a factor of about
2.5 and 5 higher than in urban and rural background, respectively. A
significant reduction in particle number has been observed since 2002.

The sodium content in PM10 on street stations were about 1.5 µg/m3 cor-
responding to an estimated annual salt content (NaCl) of about 4.0
µg/m3. High diurnal values of salt were observed during periods with
winter salting of roads.

The annual limit value for NO2 (40 µg/m3) was exceeded at one street
station in Copenhagen (H.C. Andersens Boulevard), whereas no exceed-
ances were observed in Odense, Aalborg and Aarhus. The NO2 concen-
trations decreased from 2011 to 2012 at part of the stations while no
changes was observed at the remaining part. At H.C Andersens Boule-
vard (Copenhagen/1103) there were still elevated concentrations of NO2.
The background for these elevated concentrations are currently investi-
gated in an on-going project for the Danish Environmental Protection
Agency.

                                                                         5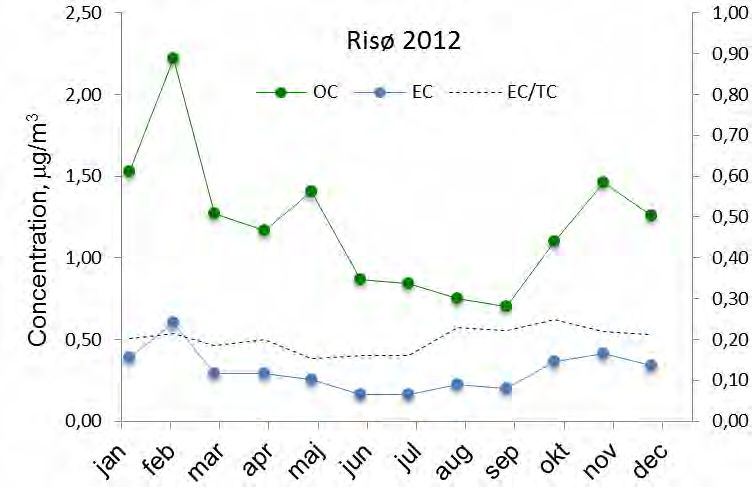
Model calculations at selected streets in Copenhagen and Aalborg indi-
    cate that the limit value was exceeded at several streets in Copenhagen
    but not at any streets in Aalborg in 2012. In general, modelling con-
    firmed that the street station at H.C. Andersens Boulevard (1103) in Co-
    penhagen represents one of the most polluted streets in Copenhagen,
    whereas the traffic station in Aalborg (6153) represents a site with a pol-
    lution level around the average for the 31 selected streets in Aalborg.

    The ozone levels were in 2012 almost the same as in 2011 at all rural and
    urban background stations and no clear trend was thus observed. The in-
    formation threshold at 180 µg/m3 was exceeded once in 2012. The target
    value for the max 8 hours ozone concentration on 120 µg/m3 was not ex-
    ceeded, but the long-term objective for this target was exceeded at all
    non-traffic stations.

    The report presents results for volatile organic compounds (VOC) meas-
    ured at the urban background in Copenhagen. VOC’s can act as ozone
    precursors, although the formation of ozone in Denmark is in general
    small due to moderate solar radiation. The ozone pollution in Denmark
    is to a large extent the result of long distance transport of pollutants from
    other European countries south of Denmark.

    The levels of SO2 and heavy metals have decreased for more than two
    decades and are now far below the limit values. The limit values for ben-
    zene and CO are not exceeded and the levels have decreased for the last
    decade.

    Measurements of particle bound PAH concentrations were performed at
    H.C. Andersens Boulevard, Copenhagen. The average concentration of
    benzo[a]pyrene was 0.25 ng/m3. The target value for benzo[a] pyrene (1
    ng/m3) was not exceeded in 2012.

    For the second time this report presents results from determination of
    the chemical content in PM2.5. The annual average concentrations of
    NH4+, Na+, K+, Mg2+, Cl-, NO3-, SO42- are very similar at the street station
    at H.C. Andersens Boulevard and at the rural station at Risø. The main
    difference between the two stations are for elemental carbon (EC), organ-
    ic matter (OM) and Ca2+ where the concentrations are higher at the street
    station compared to the rural background station. This is mainly due to
    emissions of these compounds from the traffic in Copenhagen.

    Actual data, annual and multi-annual summaries are available at the
    website of DCE (http://www.dmu.dk/International/Air), in Danish
    (http://dce.au.dk/myndigheder/luft/).

6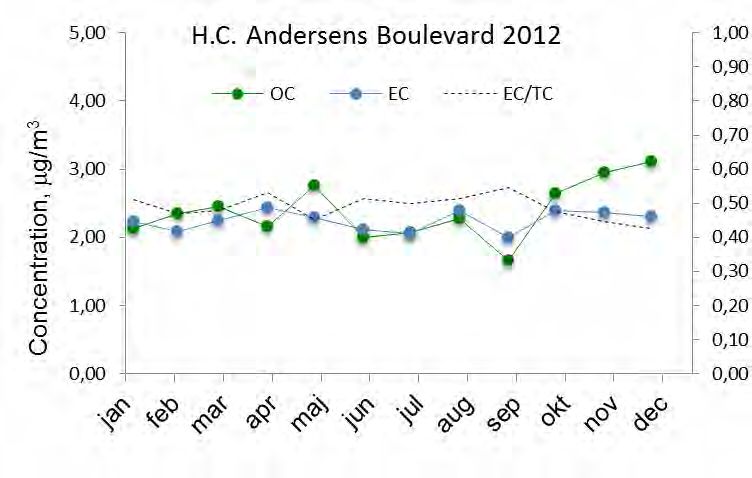
Danish summary - Dansk resumé
Rapporten præsenterer resultater for 2012 fra Overvågningsprogrammet
for luftkvalitet i danske byer. Programmet, som udføres af DCE - Natio-
nalt Center for Miljø og Energi (DCE) ved Aarhus Universitet, er baseret
på målinger ved ni målestationer placeret i de fire største danske byer
samt ved to baggrundsmålestationer udenfor byerne. Disse målinger
kombineres med anvendelse af modelberegninger udført med DCE’s
luftkvalitetsmodeller.
Formålet med programmet er at overvåge luftforurening af betydning
for sundhed i overensstemmelse med EU’s luftkvalitetsdirektiver. I hen-
hold til disse og øvrige danske behov måles koncentrationer af svovldi-
oxid (SO2), nitrogenoxider (NOx/NO2), partikelmasse (PM10 og PM2.5),
partikel antal, benzen (C6H6) og toluen (C7H8), carbonmonoxid (CO),
ozon (O3), udvalgte tungmetaller (fx bly (Pb), arsen (As), cadmium (Cd),
kviksølv (Hg), nikkel (Ni)) og polyaromatiske kulbrinter (PAH) samt
udvalgte flygtige kulbrinter (VOC), der kan føre til dannelse af ozon.
Målingerne og modelberegningerne anvendes til at vurdere om EU’s
grænseværdier for luftkvalitet er overholdt. Rapporten beskriver endvi-
dere udviklingen i koncentrationerne. Samtidig tjener resultaterne som
grundlag for vurdering af kilderne til luftforureningen, vurdering af ef-
fekt af reduktionstiltag og som grundlag for en række videnskabelige
undersøgelser fx vurdering af små partiklers effekt på sundheden.
Der er fastsat grænse- og målværdier for flere af de målte stoffer. Græn-
seværdierne skal være overholdt fra 2005, 2010 eller 2015 alt efter, hvilke
stoffer der drejer sig om. En detaljeret beskrivelse af gældende mål- og
grænseværdier og deres gennemførelse findes i en bekendtgørelse fra
Miljøministeriet (Miljøministeriet 2010). Bekendtgørelsen er baseret på
det 4. datterdirektiv om tungmetaller og PAH (EC 2005) samt det nye
luftkvalitetsdirektiv vedtaget i 2008 (EC 2008). En af de væsentligste æn-
dringer i det nye direktiv i forhold til de tre første datterdirektiver (1999,
2000 og 2002) er, at der stilles krav om målinger af de fine partikler
(PM2.5), og at der er indført en grænseværdi for PM2.5, som skal overhol-
des i 2015.
De væsentligste konklusioner fra overvågningsprogrammet i 2012 er føl-
gende:
I 2012 blev grænseværdien for NO2 overskredet på en (H.C. Ander-
sens Boulevard) af de to gademålestationer i København. I Odense,
Aarhus og Aalborg var der ingen overskridelser. Koncentrationerne
af NO2 faldt på visse af målestationerne fra 2011 til 2012, mens der på
de øvrige målestationer var stort set uændrede koncentrationer. På
gademålestationen ved H.C. Andersens Boulevard er der fortsat en
forhøjet koncentration af NO2. Årsagerne til den forøgede koncentra-
tion på H.C. Andersens Boulevard er ved at blive undersøgt i et
igangværende projekt for Miljøstyrelsen.
Modelberegninger indikerer, at grænseværdien i 2012 var overskredet
på en række gadestrækninger i København, men ikke på udvalgte
gadestrækninger i Aalborg. Modelberegningerne viste endvidere, at
gademålestationen ved H.C. Andersens Boulevard (1103) i Køben-
7
havn repræsenterer en af de mest forurenede gader i København,
mens gademålestationen i Aalborg (6153) repræsenterer et middelni-
veau set i forhold til de 31 udvalgte gader i Aalborg.
I 2012 var der ingen målestationer, hvor årsmiddelværdierne for luf-
tens indhold af partikler mindre end 10 µm (PM10) overskred grænse-
værdien for den årlige middelværdi for PM10. Ej heller blev antallet af
overskridelser af den daglige middelværdi for PM10 (50 µg/m3 må ik-
ke overskrides mere end 35 gange årligt) overskredet ved nogen må-
lestation i måleprogrammet.
Indholdet af partikler mindre end 2,5 µm (PM2.5) overskred ikke de
kommende grænseværdier, som skal overholdes fra 2015.
Antallet af partikler mellem 6 og 700 nm var omkring 14.000 partikler
per cm3 på gademålestationen H.C. Andersens Boulevard, mens det
var betydeligt mindre i by- og landbaggrund. Antallet af partikler er
faldet betydeligt siden 2002.
Indholdet af natrium i PM10 på gademålestationerne var omkring 1,5
µg/m3 svarende til et estimeret saltindhold (NaCl) på omkring 4,0
µg/m3. Høje døgnmiddelværdier for saltindholdet i PM10 som følge
af navnlig vejsalt var anledning til at den daglige grænseværdi for
PM10 blev overskredet på de to gademålestationer i København.
Der er ikke fastsat egentlige grænseværdier for ozon (O3), men kun
"målværdier" og ”langsigtede mål” (hensigtsværdier). Der var i 2012
ingen overskridelser af målværdierne for beskyttelse af sundhed.
mens de langsigtede mål blev overskredet på alle bybaggrunds- og
landstationerne. Tærsklen for information af befolkningen om høje
ozonniveauer (timemiddel 180 µg/m3) blev overskredet én gang i
2012.
De øvrige målte stoffer findes i koncentrationer under grænseværdi-
erne, og for flere stoffer (fx svovldioxid og bly) er koncentrationerne
faldet betydeligt siden målingernes start.
Målinger af partikelbundet PAH blev fortaget på H.C. Andersens
Boulevard i København. Middelværdien for benz[a]pyren var 0,25
ng/m3. Målværdien på 1 ng/m3 var således ikke overskredet i 2012.
For fjerde år præsenterer rapporten resultater for måling af udvalgte
flygtige organiske kulbrinter (VOC) i bybaggrund i København. Disse
VOC bidrager til den kemiske dannelse af ozon i Europa. I Danmark
skyldes størstedelen af ozon langtransport af luftforurening fra cen-
trale og sydlige dele af Europa.
For anden gang præsenteres resultater for bestemmelse af det kemi-
ske indhold i PM2.5 ved gademålestationen ved H. C. Andersens Bou-
levard og ved landbaggrundsmålestation på Risø. De årlige gennem-
snits koncentrationer for NH4+, Na+, K+, Mg2+, Cl-, NO3- og SO42- er
stort set ens på de to stationer, hvilket skyldes, at de for en stor del
stammer fra partikler transporteret til målestationer langvejs fra. De
væsentligste forskelle mellem de to målestationer ses for elementært
carbon (EC), organiske forbindelser (OM) og Ca2+, hvor koncentratio-
nerne er højere på gadestationen som følge af udledninger relateret til
trafikken i København.
81 Introduction
The Danish Air Quality Monitoring Programme (LMP) originates back to
1981. Today the programme is part of the National Monitoring Pro-
gramme for the aquatic and terrestrial environment (NOVANA). The
program consists of an urban monitoring network with stations in the
four largest Danish cities and two background stations in rural areas
(figure 2.1) which is supplemented by model calculations. The results are
used for assessment of the air pollution in Denmark with special focus
on Danish urban areas. The programme is carried out in co-operation be-
tween the DCE - National Centre for Environment and Energy (DCE),
the Danish Environmental Protection Agency, and the Municipalities of
Copenhagen, Aarhus, Aalborg and Odense. DCE is responsible for oper-
ating and maintaining the programme. Statistical parameters and actual
data are accessible at the website: http://www.dmu.dk/-International-
/Air , in Danish (http://dce.au.dk/myndigheder/luft/). Selected actual
data are also available at tele-text, Danish National Television. In addi-
tion, this report presents results from model calculations of air quality in
Denmark carried out as supplement to the measurements.
The monitoring programme is carried out in accordance with the Danish
Statutory Order No. 851 of 30 June 2010 from the Ministry of Environ-
ment (Miljøministeriet 2010) that implements the EU directives on air
quality in Denmark. The EU legislation consisted previously of the
framework directive (EC 1996), giving general rules for network design
and limit value strategies, and a number of daughter directives giving
limit values, target values, alert thresholds, reference methods and moni-
toring strategies for specific pollutants. Four daughter directives for
NO2, SO2, particulate matter (PM10) and Pb (EC, 1999), CO and benzene
(EC, 2000), O3 (EC, 2002) and As, Cd, Ni, Hg and PAH (EC, 2005) had
been adopted. In 2008 a new directive (EC, 2008) replaced the framework
directive and the three first daughter directives. This new directive is
now implemented through the Danish statutory order (Miljøministeriet
2010). One of the major changes in the new directive is that monitoring
of PM2.5 is now part of the measurement programme.
One of the main objectives for the monitoring programme is to assess the
air quality in relation to various air quality criteria (i.e. limit values, mar-
gin of tolerance, target values, long term objectives and alert thresholds)
of which the limit values are the legally most important. The Danish
quality criteria’s are identical with those laid down in the EU directives
described above. The limit values had to be attained in 2005 or here from
2010.
The program was revised in 2010. Due to this revision of the monitoring
program there is a number of changes in the monitoring program and in
this year’s report. The main changes are the following:
The two Danish monitoring programs (the background monitoring
programme aimed at assessing the atmospheric depositions to nature
and the air quality programme measurements related to human
health) were integrated into one program with two annual reports.
The first one with focus on air quality and human health and the sec-
9ond one with focus on air quality and environment. The material pre-
viously presented in this report on air quality and vegetation has
therefore been moved to the second report.
The rural monitoring station at Lille Valby was moved about two km
west in June 2010 and is now situated at Risø close to DCE .
The program concerning measurements of heavy metals has been re-
duced since the concentrations are low compared to limit values.
Moreover, a new analysis technique (ICP-MS) has been used for anal-
ysis of heavy metals. In 2011 the new technique was not fully imple-
mented and only few heavy metals (As, Cd, Ni, Pb, Hg) could be re-
ported for 2010. However, the technique was improved in 2012 and
this year’s report includes results for eleven heavy metals.
As a new thing this report presents results for PM10 that has been cor-
rected for the content of sodium chloride from sea salt and winter
salting of roads.
Finally, the report presents results from measurements of the chemi-
cal composition of PM2.5 measured in rural background at Risø and at
the street station at H.C. Andersens Boulevard, Copenhagen.
Five low volume samplers (LVS) for gravimetric determination of
particle mass based on the reference method were introduced into the
regular measuring programme and installed at four stations in the
network (HCAB PM10 and PM2.5 ; HCØ PM2.5 ; Jagtvej PM10 ; Risø
PM2.5) during August and September 2012 to replace some of the old-
er SM200 instruments that needed to be renewed. At Jagtvej PM2.5 a
low volume sampler was running for three months (June, July and
August) for control of a SM200 and these measurements were also
used for the reporting the 2012 PM data.
In the following chapters the results from measurements and model cal-
culations for 2012 are presented and compared to limit and threshold
values. Please refer to the EU Directives for a detailed description of the
exact definitions of the limit values, margin of tolerance, target values
and alert thresholds.
102 Measurements and model calculations
2.1 Measurements
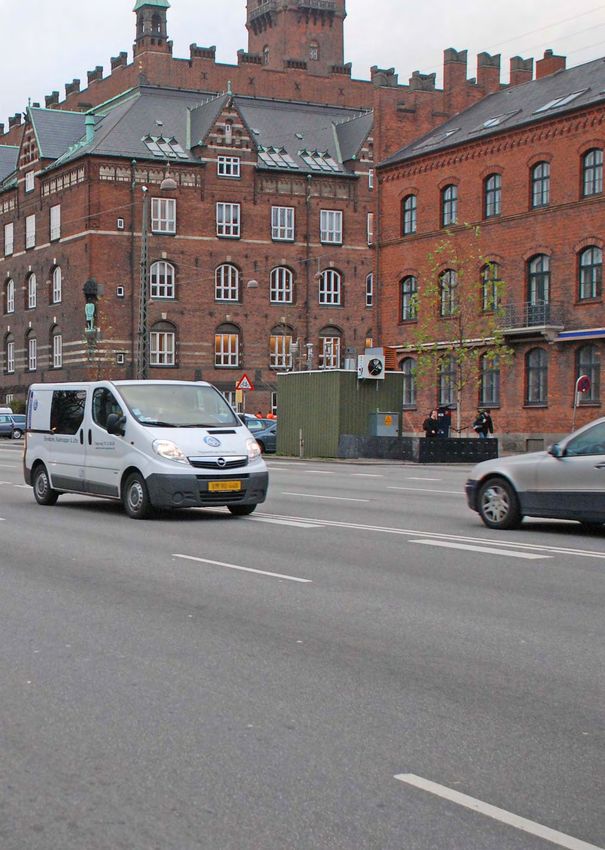
The measuring strategy is in short to place one or more pairs of stations
in each of the four largest Danish cities. In each city one of the stations is
located close (at the sidewalk) to a street lane with a high traffic density.
The other is located within a few hundred meters from the street station,
and is placed so that it is representative for the urban background pollu-
tion; meaning that it is placed so that it is not influenced by pollutants
from a single or a few streets or other nearby sources. In most cases the
background stations are placed on rooftops. In addition, two rural sta-
tions monitor the pollution outside city areas. The rural station at Lille
Valby was in the middle of 2010 moved about 2 km west to Risø and is
now situated close to DCE. Further information about the program and
results is found at the website: http://www.dmu.dk/International/Air,
in Danish (http://dce.au.dk/myndigheder/luft/).
Gadestationer
Street station
Ålborg Bybaggrund
Urban background
Land, background
Rural natur og vand
Anholt
Ulborg Idom hede
Tange
Sepstrup Sande Århus
København
Risø
DMU/Ris ø
Odense
Lindet Pedersker
Keldsnor
Figure 2.1 Main stations used for monitoring of air quality in relation to health.
Table 2.1. Main stations used for monitoring of air quality in relation to health in 2011
Name Street/location Type
Copenhagen/1257 Jagtvej Street
Copenhagen/1259 H.C. Ørsted Institute (HCØ) Urban background
Copenhagen/1103 H.C. Andersens Boulevard Street
(HCAB)
Århus/6153 Banegårdsgade Street
Århus/6159 Valdemarsgade Urban Background
Odense/9155 Albanigade Street
Odense/9159 Town hall in Odense Urban background
Aalborg/8151 Vesterbro Street
Aalborg/8158 Østerbro Urban background
Lille Valby/Risø - Rural
Keldsnor/9055 - Rural
11The following compounds were measured in 2012:
Nitrogen oxides (NO, NO2 and NOx (= NO + NO2)) were measured at
all stations.
Particle mass (PM10 and PM2.5) were measured at all stations except
Odense/9159. PM was at these stations measured by means of β-
absorption as 24 h averages.
In addition to the β-measurements, five low volume samplers (LVS)
for gravimetric determination of particle mass based on the reference
method were introduced into the network and installed at four sta-
tions (HCAB PM10 and PM2.5 ; HCØ PM2.5 ; Jagtvej PM10 and PM2.5;
Risø PM2.5) during the summer 2012.
Elements (heavy metals) in PM were measured at Copenhagen/1103,
Copenhagen/1257, Copenhagen/1259, Århus/6153, Århus/6159 and
Lille Valby/Risø.
Additionally PM10 and PM2.5 was measured at both Copenha-
gen/1103 and Risø by means of TEOM that measures on a half hour-
ly basis making it possible to resolve the diurnal variation. Part of
these measurements was carried out in a research project funded
separately by the Danish EPA.
Particle number was measured at Copenhagen/1103, Copenha-
gen/1259 and Lille Valby/Risø in cooperation with particle research
funded separately by the Danish EPA.
Ozone (O3) was measured at all urban background and rural sta-
tions, and at the street stations Copenhagen/1257 and Copenha-
gen/1103.
Carbon monoxide (CO) was measured at all street stations as well as
at the urban background station, Copenhagen/1259 and the rural site
Lille Valby /Risø.
Benzene and Toluene were measured at Copenhagen/1103 and Co-
penhagen/1257 using passive sampling on a weekly basis.
PAH were measured at Copenhagen/1103.
SO2 was measured at Aalborg/8151 and at Copenhagen/1103. The
main purpose was to monitor episodic high concentrations.
Elemental carbon (EC) and organic carbon (OC) were measured at
Copenhagen/1103 and Lille Valby/Risø.
The meteorological parameters - temperature, wind speed and direc-
tion, relative humidity and global radiation - were measured at all
urban background stations.
The pollutants are described in more detail in Appendix 1.
Measurements of gasses (NO, NOx, NO2, O3, CO, SO2) and particle
number were recorded as ½-hour averages. Particle mass (PM10 and
PM2.5) were measured both as 24 hour averages using beta measure-
ments and low volume sampling (gravimetric method) and at ½-hour
averages using TEOM (only part of particle mass). Elements in the parti-
cles as well as PAH were measured as 24 hour averages. EC and OC
12were measured as 24 hour averages. Benzene and Toluene were meas-
ured weekly by passive sampling. Besides this volatile organic com-
pounds were sampled at 24 hour averages.
2.2 Model calculations
In monitoring programme the measurements at the permanent meas-
urement stations are supplemented with model calculations using the
Thor modelling system (Brandt et al., 2000). This is an integrated model
system, capable of performing model calculations at regional scale to ur-
ban background scale and further down to individual street canyons in
cities – on both sides of the streets (thor.dmu.dk). At present, the system
includes global meteorological analysed data from National Centres for
Environmental Prediction, United States, which is used as input to the
meteorological model MM5v3 (Grell et al., 1995). The meteorological da-
ta for 2011 from MM5v3 is subsequently used to drive the air pollution
models, including the Danish Eulerian Hemispheric Model, DEHM
(Christensen, 1997; Brandt et al., 2011), the Urban Background Model,
UBM (Berkowicz, 2000b) and the Operational Street Pollution Model,
OSPM® (Berkowicz 2000a; Ketzel et al., 2012). DEHM is providing air
pollution input data for UBM which again is providing air pollution in-
put data to OSPM. Further details about the integrated THOR system
can be found in Brandt et al. (2001 and 2003).
Model calculations of air quality on national scale is carried out using
DEHM (version 5.0), which is an Eulerian model where emissions, at-
mospheric transport, chemical reactions, and dry- and wet depositions of
air pollutants are calculated in a 3D grid covering the northern hemi-
sphere with a resolution of 150 km x 150 km. The model includes a two-
way nesting capability, which makes it possible to obtain higher resolu-
tion over limited areas. Three nested domains are used in LMP, where
the first nest is covering Europe with a resolution of 50 km x 50 km. The
second nest is covering Northern Europe with a resolution of 16.7 km x
16.7 km. The calculations of air quality in Denmark are carried out in a
third nest with a horizontal resolution of 5.6 km x 5.6 km. In the vertical
direction the model is divided into 29 layers covering the lowest 15 km
of the atmosphere. Of these the lowest layers are relatively thin (20 m)
while the upper layers are relatively thick (2000 m). The model includes
a comprehensive chemical scheme designed for calculation of the chemi-
cal reactions in the lower part of the atmosphere. The emission invento-
ries used in DEHM have a geographical resolution of 1 km x 1 km for
Denmark transformed into the 5.5 km x 5.5 km resolution domain and 17
km x 17 km for the remaining part of Europe. The emissions are based on
Danish national emission inventories for the year 2010 made by DCE
(dce.au.dk) and international emission inventories for the year 2009 col-
lected and distributed by EMEP (www.emep.int).
The Urban Background Model, UBM, calculates the urban background
air pollution based on emission inventories with a spatial resolution of 1
km x 1 km and based on input data from DEHM concerning the regional
background. UBM is suitable for calculations of urban background con-
centrations when the dominating sources are areal sources like road traf-
fic. The model includes a simple scheme for calculation of the dispersion
and transport of the air pollutants and a simple chemical model account-
ing for the photochemical reactions of NOx and ozone. The model is de-
13scribed in detail in Berkowicz (2000b). The emissions used in the UBM
model are based on the newly developed SPREAD model that spatially
distributes national emissions from 2008 from all sectors on a 1 km x 1
km grid for Denmark (Plejdrup & Gyldenkærne 2011). Previous assess-
ments have only included road traffic emissions also on a 1 km x 1 km
grid for Denmark but using a bottom up approach based on traffic levels
on the road network and emission factors from the emission module of
the OSPM model.
Finally, the street canyon model OSPM (http://ospm.dmu.dk/) is used
to calculate the air pollution at 2 m height at the sidewalks of selected
streets. Meteorological data from the meteorological model MM5v3 and
air pollution concentrations from UBM are used as input to the model.
The model includes emissions from traffic, simple chemical reactions de-
scribing the reactions of air pollutants in the street canyons and the dis-
persion of the air pollution in the street canyon (due to meteorological
conditions and turbulence induced by traffic).
The traffic emission data used as input for the calculations with OSPM
have been substantially updated for this year’s report by detailed infor-
mation (average daily traffic, vehicle distribution) for the selected streets
obtained from the municipalities of Copenhagen and Aalborg based on a
project on evaluation of the effects of environmental zones (Jensen at al.
2011). Emission factors are based on the latest version of the COPERT IV
model applied for 2011 conditions taking account of the effect of the en-
vironmental zones by means of a detailed analysis of the vehicle compo-
sition using video number plate analysis linked to the National Auto
Registry at a street in Copenhagen, for details see Jensen at al. (2011). The
input data for the OSPM model on traffic volume and street configura-
tions for the selected urban streets are generated using the AirGIS sys-
tem (Jensen et al., 2001; http://envs.au.dk/videnudveksling/-
luft/model/airgis/
The model calculations for 2011 for Copenhagen and Aalborg have been
carried out using the full model calculation system based on the THOR
system, including DEHM, UBM, and OSPM. The calculations were car-
ried out in order to determine the NO2 concentration in 138 streets in
Copenhagen and 31 streets in Aalborg.
143 Nitrogen oxides
The nitrogen oxides (NO, NO2, NOx) are measured at eleven monitoring
sites using gas monitors based on chemiluminescence. The concentra-
tions are measured continuously throughout the year with a time resolu-
tion on minute scale that is aggregated to hourly averages for this report-
ing.
3.1 Annual statistics
The annual statistics for 2012 for nitrogen dioxide and nitrogen oxides
are shown in Table 3.1 and 3.2. There was only exceedance of the annual
limit value for NO2 (EC, 2008) at H.C. Andersens Boulevard (Copenha-
gen/1103). There were no exceedances of the hourly limit value for NO2
on 200 µg/m3. This value must not be exceeded more than 18 times in a
calendar year (see 19th highest hourly concentration in Table 3.1). In 2012
there was no information to the public due to exceedance of the infor-
mation threshold for NO2 (three hours average must not exceed 400
µg/m3).
Table 3.1. Nitrogen dioxide (NO2) in 2012. All parameters are based on hourly averages.
98. 19.
Unit: µg/m3 Number Average Median
percentile highest
Traffic:
Copenhagen/1257 7981 38 33 96 121
Copenhagen/1103 7845 55*) 51 126 150
Aarhus/6153 7577 35 31 86 113
Odense/9155 7233 26 20 84 117
Aalborg/8151 8003 30 25 90 121
Urban Background:
Copenhagen/1259 7864 17 13 50 69
Aarhus/6159 6951 17 14 57 84
Odense/9159 7922 13 10 43 62
Aalborg/8159 8270 13 10 48 77
Rural:
Risø 7922 9 6 37 59
Keldsnor/9055 7364 8 8 32 49
Limit value 2010 >7455 40 200
*)
Limit value exceeded
15Table 3.2. Nitrogen oxides (NOx = NO + NO2) in 2012. All parameters are based on hourly
averages.
98. 19.
Unit: µg/m3 Number Average Median
percentile highest
Traffic:
Copenhagen/1257 7981 83 62 284 465
Copenhagen/1103 7845 145 116 465 633
Aarhus/6153 7577 77 60 265 515
Odense/9155 7233 60 33 303 526
Aalborg/8151 8003 87 58 350 532
Urban Background:
Copenhagen/1259 7864 20 15 75 147
Aarhus/6159 6951 24 16 106 262
Odense/9159 7922 17 12 67 195
Aalborg/8159 8270 19 12 92 254
Rural:
Risø 7922 11 7 46 90
Keldsnor/9055 7364 9 6 39 68
3.2 Trends
The long term trends for NO2 and NOx are shown in Figure 3.1. For NOx
there are clear down ward trends at all stations. The decreases in the
concentrations of nitrogen oxides are due to the national and interna-
tional regulations of the emissions. The large emission reductions in the
cities are achieved by improvement of the vehicles and obligatory use of
catalytic converters.
The long term trend for nitrogen dioxide decreases much slower than
observed for NOx. This is mainly due to an increase in the share of diesel
cars where up to about half of the emissions of NOx consist of NO2. In
comparison gasoline cars emit nearly all NOx as NO. This increase of the
direct emissions of NO2 slows down the decrease of the concentrations of
NO2 compared to NOx.
1680
NO2 - annual averages
70
60
50
µg/m3
40
30
20
10
0
1983 1985 1987 1989 1991 1993 1995 1997 1999 2001 2003 2005 2007 2009 2011
Copenhagen/1103 Copenhagen/1257 Århus/6153
Odense/9155 Aalborg/8151 Copenhagen/1259
Århus/6159 Odense/9159 Ålborg/8159
Lille Valby/Risø Keldsnor/9055
300
NOx - annual averages
250
200
µg/m3
150
100
50
0
1983 1985 1987 1989 1991 1993 1995 1997 1999 2001 2003 2005 2007 2009 2011
Copenhagen/1103 Copenhagen/1257 Århus/6153
Odense/9155 Aalborg/8151 Copenhagen/1259
Århus/6159 Odense/9159 Ålborg/8159
Lille Valby/2090 Keldsnor/9055
Figure 3.1 The graphs show the time series for the annual average values of NO2 and
NOx. The dashed line on the upper graph shows the limit value that entered into force in
2010. Previous results from Copenhagen/1103 can be found at the homepage of Copen-
hagen Environmental Protection Agency (www.Miljoe.kk.dk)
17Both NO2 and NOx were higher in 2010-2012 compared to 2009 at the
street station H.C. Andersens Boulevard (Copenhagen/1103). At all oth-
er street stations the levels in 2010-2012 were equal to or lower than ob-
served in 2009. In an on-going project for the Danish Environmental Pro-
tection Agency DCE are currently investigating the reasons behind this
difference between H.C. Andersens Boulevard and the other street sta-
tions. Results from this project will be published by DCE during autumn
2013.
3.3 Results from model calculations
Model calculations of NO2 and NOx have been performed for selected
streets in Copenhagen (capital) and Aalborg (fourth largest city) as well
in a resolution of 5.6 km x 5.6 km for the entire country.
The selected streets represent busy streets and are mainly street canyons.
Concentrations are elevated in this type of streets due to the high
emissions and restricted dispersion conditions. 99 streets were selected
in Copenhagen and 31 in Aalborg. Average Daily Traffic (ADT) was
between 5,400 and 67,600 vehicles/day in Copenhagen and between
2,700 and 28,600 vehicles/day in Aalborg. On average traffic volumes are
1% lower in Aalborg and about 7% lower in Copenhagen compared to
2011. Based on information from Copenhagen and Aalborg
municipalities the ADT and vehicle distribution on all streets have been
updated with the most recent available traffic data. Last year the vehicle
distribution for Copenhagen was based on the percentage of heavy-duty
vehicles. Therefore, assumptions about the average percentage of vans,
and the average distribution of heavy-duty on trucks (32t) and
buses had to be made. This year the vehicle distribution (passenger cars,
vans, type of trucks, type of buses) have been obtained based on manual
counts.
Furthermore, manual traffic counts were for the first time available at the
street segments in front of the measurement stations of H.C. Andersens
Boulevard and Jagtvej. Compared to previous assumptions for H.C.
Andersens Boulevard average daily traffic is about 8% higher compared
to 2011, and the percentage of vans is higher and the percentage of
heavy-duty vehicles is lower. Compared to previous assumptions for
Jagtvej average daily traffic is about 26% lower compared to 2011, and
the percentage of vans is higher and the percentage of heavy-duty
vehicles is slightly higher.
Travel speeds have not been changed for any of the streets. However,
analysis of travel speed data based on GPS measurements from a new
national database of the Danish Road Directorate (SpeedMap) show that
travel speeds are lower compared to previous assumptions for H.C.
Andersens Boulevard and Jagtvej. Therefore, it is likely that lower travel
speeds can be expected for all other roads. The next assessment for 2013
will include travel speed data for all 99 streets based on SpeedMap.
Model calculations have been carried out in order to determine the
annual concentrations of NO2 to be able to compare with limit values.
The air quality limit value for the annual mean is 40 µg/m3. The number
of exceedances is also given. An exceedance is registered if the calculated
18concentration is higher than 40.5 µg/m3 since the limit value is given as
an integer.
An interlinked modelling approach has been applied. The Danish
Eulerian Hemispheric Model (DEHM) calculates regional background
concentrations, the Urban Background Model (UBM) calculates the
urban background concentrations based on DEHM data, and the
Operational Street Pollution Model (OSPM) calculates street
concentrations based on UBM data.
A recent validation study of the OSPM has been carried out for 10
selected streets in Copenhagen that is a subdivision of all selected streets.
Passive measurements of NO2 were carried out from October 24 to
November 28, 2011. The results showed good agreement between
measured and modelled concentrations after updating of input data to
the OSPM model (Ellermann et al. 2012, Ketzel et al. 2012).
Calculations with the full model chain of DEHM-UBM-OSPM have been
compared to measured NO2 concentrations in 2012 for the fixed street
monitoring stations in Copenhagen and Aalborg. The model system
predicts annual NO2 concentrations within 2% for Jagtvej (Copenhagen),
-10% for H.C. Andersens Boulevard (Copenhagen), -11% for Vesterbro
(Aalborg). Calculations with the coupled DEHM-UBM models have also
been compared to the fixed background monitoring stations in
Copenhagen and Aalborg. Here the model system predicts annual NO2
concentrations within 13% for H.C. Ørsted Institute (Copenhagen) and -
7% Østerbro (Aalborg).
The comparison of the modelled NO2 concentrations presented in this
report for 2012 with measurements at the 3 street locations and 2
background locations in Copenhagen and Aalborg shows a good
agreement within ± 15%.
3.3.1 Model calculations for Copenhagen
The annual mean concentrations of NO2 for Copenhagen in 2012 are
shown in Figure 3.2 (bar chart) and Figure 3.3 (map).
In 2012 the limit value for the annual mean concentration was exceeded
in 19 out of the 99 selected streets in Copenhagen (Figure 3.2). In 2011 the
number of streets exceeding the limit value was 17 out of 99.
The number of streets exceeding the limit value is very sensitive to small
changes in concentrations and uncertainties in the assumptions taken in
the emission estimation and model calculations as can be seen from
Figure 3.2 since small changes will lead to either more or less
exceedances. The total average of NO2 concentrations at all 99 streets has
decreased very little while the average of the concentrations at the 20
streets with the highest concentration has increased slightly leading to a
small increase in the number of exceedances, both changes below 1
µg/m3 in difference.
19Figure 3.2 Annual mean concentrations of NO2 in 2012 for 99 streets in Copenhagen. The contribution from traffic in the street
canyons is based on the street canyon model OSPM®. The urban background (dark red colour) is obtained from calculations with
the urban background model UBM with input from the regional scale model DEHM. The value for a street is for the kerb side with
the highest annual mean concentration. The names of the streets can be seen in Table 3.3. Arrows indicate the street segments
with measurement stations.
The streets where the limit value were exceeded all have daily traffic
intensity in the range of 11,000 to 67,600 vehicles per day. However, it is
not only the traffic intensity alone which determines the concentration of
NO2. Also the width of the streets, the height of the surrounding
buildings, openings in the building façade, the share of heavy-duty
vehicles and orientation of the street have large impact on the
concentration of NO2 in a street.
The names of the 99 streets are given in Table 3.3 and the locations of the
streets together with the annual NO2 concentration levels are shown in
Figure 3.3. It is seen that the exceedances are concentrated in the central
part of the city and at the main arterial roads from H.C. Andersens
Boulevard to Ågade, and also Nørre Søgade to Øster Søgade.
20Table 3.3. Number and names for the streets that are shown in Figure 3.2 and 3.4. The streets are numbered (1-99)
according to NO2 levels in 2012 (1 = highest, 99 = lowest). The numbers in parenthesis refer to different segments of the
same street that has more than one model calculation. * indicate the street segments with measurement stations.
Number Street name number Street name number Street name
1 Gyldenløvesgade 34 Tagensvej (3) 67 Strandvænget (2)
2* H.C. Andersens Boulevard (1) 35 Hulgårdsvej (2) 68 Amager Boulevard
3 H.C. Andersens Boulevard (2) 36 Falkoner Alle (2) 69 Jagtvej (2)
4 H.C. Andersens Boulevard (3) 37 Frederikssundsvej (8) 70 Slotsherrensvej (2)
5 Bernstorffsgade (2) 38 Frederikssundsvej (1) 71 Roskildevej (1)
6 Øster Søgade 39 Tagensvej (1) 72 Hillerødgade (3)
7 Nørre Søgade 40 Amagerfælledvej 73 Kalvebod Brygge
8 Ågade 41 Østerbrogade (1) 74 Frederiksborgvej (1)
9 Lyngbyvej (2) 42 Nordre Fasanvej (1) 75 Dag Hammerskjölds Allé
10 Fredensgade 43 Søndre Fasanvej (2) 76 Bülowsvej (2)
11 Stormgade 44 Nordre Fasanvej (3) 77 Folke Bernadottes Allé
12 Hammerichsgade 45 Østerbrogade (4) 78 Peter Bangs Vej (1)
13 Åboulevard (1) 46 Toldbodgade 79 Ålholmvej (2)
14 Åboulevard (3) 47 Gammel Kongevej (1) 80 Slotherrensvej (1)
15 Tomsgårdsvej (2) 48 H.C. Ørsteds Vej (2) 81 Tuborgvej (1)
16 Torvegade 49 Toftegårds Allé (1) 82 Røde Mellemvej (1)
17 Øster Voldgade (1) 50 Øster Voldgade (2) 83 Frederikssundsvej (2)
18 Amagerbrogade (2) 51 Amagerbrogade (1) 84 Vesterfælledvej
19 Vesterbrogade (1) 52 Vesterbrogade (3) 85 Englandsvej (1)
20 Tagensvej (2) 53 Vester Farimagsgade 86 Blegdamsvej
21 Bernstorffsgade (1) 54 Istedgade 87 Strandvejen (2)
22 Jyllingevej (1) 55 Tagensvej (4) 88 Hillerødgade (1)
23 Frederikssundsvej (3) 56 Grøndals Parkvej 89 Godthåbsvej (2)
24 P. Knudsens Gade (2) 57 Nørre Farimagsgade 90 Halmetgade
Gammel Køge
25 Enghavevej 58 91 Amagerbrogade (3)
Landevej (1)
*
26 Jagtvej (1) 59 Strandvejen (1) 92 Peter Bangs Vej (2)
27 Folehaven (1) 60 Godthåbsvej (3) 93 Bellahøjvej
28 Bredgade 61 Rebildvej 94 Vigerslevvej (2)
29 Gothersgade (1) 62 Ingerslevsgade 95 Frederiksborgvej (2)
30 Scandiagade 63 Frederikssundsvej (5) 96 Artillerivej
31 Vester Voldgade 64 Jagtvej (3) 97 Gammel Køge Landevej (2)
32 Tuborgvej (2) 65 Ålholmvej (1) 98 Røde Mellemvej (2)
33 Nørre Voldgade (2) 66 Nørrebrogade 99 Englandsvej (2)
21Figure 3.3. Map showing the locations of the selected streets in Copenhagen and the annual mean concentrations of
NO2 for 2012. The contribution from traffic in the street canyons is based on the street canyon model OSPM ®. The
urban background is obtained from calculations with the urban background model UBM with input from the regional
scale model DEHM. The value for a street is for the kerb side with the highest annual mean concentration. The
names and numbers for the streets are shown in Table 3.3.
223.3.2 Model calculations for Aalborg
For Aalborg the model calculations show in general the same level in the
NO2 concentrations compared with 2011 for the same reasons given for
Copenhagen in the previous section. The average NO2 concentration at
street level has changed by less than 1 µg/m3 compared to 2011 due to
small changes in vehicle fleet and traffic data. A small reduction in the
street contribution (Street level minus background concentrations) has
been compensated by a slight increase in the modelled urban back-
ground levels due to changes in emissions and meteorology.
According to the model calculations the limit value for the annual mean
concentration in 2012 was not exceeded at any of the 31 selected streets
which was also the case in 2011 (Figure 3.4 and Figure 3.5). The order of
the streets has changed slightly due to updated traffic data.
Figure 3.4. Annual mean concentrations of NO2 in 2012 for 31 streets in Aalborg. The contribution from traffic in the street canyons
is based on the street canyon model OSPM®. The urban background (dark red colour) is obtained from calculations with the urban
background model UBM with input from the regional scale model DEHM. The value for a street is for the kerb side with the highest
annual mean concentration. The arrow indicates the street segment (Vesterbro 1) with the measurement station.
23Figure 3.5. Map showing the location of the selected streets in Aalborg and the annual mean concentrations of NO 2
for 2012. The contribution from traffic in the street canyons is based on the street canyon model OSPM ®. The urban
background is obtained from calculations with the urban background model UBM with input from the regional scale
model DEHM. The value for a street is for the kerb side with the highest annual mean concentration. Vesterbro 1 is
the street segment with the measurement station.
244 Ozone
Ozone is measured at seven monitoring sites using gas monitors based
on ultraviolet photometry. The concentrations are measured continuous-
ly throughout the year with a time resolution on minute scale that is ag-
gregated to hourly averages for this reporting.
4.1 Annual statistics
The annual statistics for 2012 for ozone are shown in Table 4.1. The max-
imum 8 hours daily mean value must not exceed 120 µg/m3 more than
25 days per calendar year averaged over three years (EC, 2008). This tar-
get value was not exceeded for 2010-2012 at any of the stations. The long
term objective (maximum 8 hours daily mean value must not exceed 120
µg/m3; Table 4.1 column 5) was exceeded at five of the stations. Howev-
er, the long term objective has not entered into force.
In 2012 there was one exceedance of the information threshold (hourly
average 180 µg/m3) and no exceedance of the alert threshold (hourly av-
erage 240 µg/m3) for ozone. The exceedance of the information threshold
took place at the rural background station at Risø on the 20th August
2012 with a duration of only one hour. By a mistake no information to
the public was given about the exceedance.
Table 4.1. Ozone (O3) in 2012. All parameters are based on one-hour average values. The eight hour values are calcu-
lated as a moving average based on hourly measurements. Days above target value is the number of days that the max-
imum running eight hour average exceeds 120 µg/m3.
Days above
Number Max Max
Unit: µg/m3 Average Median target value
of results 8 hours 1 hour
8 hours
Traffic:
Copenhagen/1259 7603 56 58 143 4 173
Aarhus/6159 7233 52 54 135 1 144
Odense/9159 7735 57 58 151 6 160
Aalborg/8158 7124 55 58 145 2 156
Rural:
Risø 7941 62 64 93 7 185
Keldsnor/9055 7698 59 61 142 5 157
Traffic
Copenhagen/1103 7728 32 31 93 0 104
1
Target value >7154 - - - 25 -
Long term objective >7154 - - 120 - -
Information threshold - - - - - 180
1
As average over 3 years
254.2 Trends
The long term trends of ozone are shown in Figure 4.1. The annual aver-
ages of ozone have been nearly constant since 1992. The Danish and Eu-
ropean reductions of the precursors to ozone formation (NOx, volatile
organic compounds) have therefore not been sufficient to reduce the
ozone concentration. However, the reductions of the precursors have de-
creased the maximum concentrations of ozone. This is illustrated by the
decrease in the maximum eight hour average concentrations.
90
80 O3 - annual average
70
60
50
3
µg/m
40
30
20
10
0
1992 1994 1996 1998 2000 2002 2004 2006 2008 2010 2012
Copenhagen/1103 Copenhagen/1257 Copenhagen/1259
Århus/6159 Ålborg/8159 Odense/9159
Lille Valby/2090 Keldsnor/9055
250
O3 - max 8 h. average
200
150
3
µg/m
100
50
0
1992 1994 1996 1998 2000 2002 2004 2006 2008 2010 2012
Copenhagen/1103 Copenhagen/1257 Copenhagen/1259
Århus/6159 Ålborg/8159 Odense/9159
Lille Valby/2090 Keldsnor/9055
Figure 4.1 Annual average values and the max. 8 hour average value. The latter is calcu-
lated as 8 hourly running averages according to the provisions in the EU Directive (EC,
2008). Previous results from Copenhagen/1103 can be found at the Website of the Co-
penhagen Environmental Protection Agency (www. Miljoe.kk.dk).
264.3 Results from model calculations
The annual mean concentration of ozone is fairly constant throughout
Denmark (Figure 4.2). This is because the main production of ozone
takes part in the southern part of Europe and ozone is subsequently long
range transported to Denmark. At the coasts the concentrations are
slightly higher than over the remaining land areas, because ozone is de-
posited faster over land than over sea. In the cities the concentrations are
lower than the average, because ozone is degraded by nitrogen oxide
emitted from mainly traffic in the cities.
The target value for protection of human health is that the running 8
hour means concentration of ozone must not exceed 120 µg/m3 more
than 25 times during a calendar year. The long term objectives are that
the running 8 hour mean concentration of ozone must not exceed 120
µg/m3. The target value and long term objective are given in the EU Di-
rective (EC, 2008). Results from the model calculations for 2012 show
that the maximum daily 8 hour mean value of 120 µg/m3 was only ex-
ceeded up to 6 days during 2012 (Figure 4.3). Similar results were ob-
tained for 2010 and 2011 and hence the target value was not exceeded.
However, the long term objective was exceeded at in large parts of Den-
mark, while no exceedances were observed in northern Jutland and
north east Zealand (Figure 4.4).
According to the directive (EC, 2008) the public has to be informed if the
one hour average concentration exceeds the information threshold at 180
µg/m3. Based on measurements this threshold was exceeded one time in
2012, while the model calculations show that the one hour mean concen-
tration was not exceed 180 µg/m3 in 2012 (Figure 4.5). This difference is
due to an underestimation of the model calculated ozone concentrations
with about 10-20%. One of the main reasons for this discrepancy is most
likely that the model does not include emissions of ozone precursors
from wild fires that are known to increase episodic ozone concentrations.
27Figure 4.2. Annual mean concentrations of O3 (µg/m3) for 2012 calculated using DEHM.
The figure shows the average concentrations for the 6 km x 6 km grit cells used in the
model.
Figure 4.3. Number of exceedances of 120 µg/m3 for 8-hour running mean concentra-
tions of ozone in 2012. The calculations were carried out using DEHM.
28Figure 4.4. Maximum 8 hour running mean concentration (µg/m 3) of ozone in 2012
calculated using DEHM.
Figure 4.5. Maximum one hour mean concentration of ozone (µg/m3) in 2012 calculat-
ed using DEHM.
295 Carbon monoxide
Carbon monoxide is measured at the four traffic oriented monitoring
sites and at urban background in Copenhagen using gas monitors based
on non-dispersive infrared spectroscopy. The concentrations are meas-
ured continuously throughout the year with a time resolution on minute
scale that is aggregated to hourly averages for this reporting.
5.1 Annual statistics
The annual statistics for 2012 for carbon monoxide are shown in Table
5.1. The limit value for carbon monoxide is based on the maximum daily
eight hour average concentration that must not exceed 10.000 µg/m3
(EC, 2008). This limit value was not exceeded at any of the stations.
Table 5.1. Annual statistics for carbon monoxide (CO) in 2012. All parameters are based on hourly average. The 8-
hour values are calculated as a moving average based on hourly results.
98. 99.9 Max Max
Unit: µg/m3 Number Average Median
percentile percentile 8 hours hour
Traffic:
Copenhagen/1103 8060 405 374 831 1235 1101 2443
Aarhus/6153 6948 314 278 700 1310 1426 1973
Odense/9155 7666 355 276 1087 2276 2202 4283
Aalborg/8151 8024 362 307 893 1327 1269 2042
Urban Background:
Copenhagen/1259 7663 258 238 492 744 698 1049
Rural:
Risø 7479 250 230 439 751 773 841
EU Limit value - - - - - 10.000 -
WHO Guideline values 10.000 30.000
- - - - -
(WHO, 2000)
5.2 Trends
The long term trends for carbon monoxide are shown in Figure 5.1. Dur-
ing the last two decades there has been a large decrease of both the an-
nual concentrations and of the maximum daily eight hour average con-
centrations. The reductions are due to national and international regula-
tion of the emissions, among others by requirement of catalytic convert-
ers on all vehicles.
301800
1600 CO - annual averages
1400
1200
1000
3
µg/m
800
600
400
200
0
1994 1996 1998 2000 2002 2004 2006 2008 2010 2012
Copenhagen/1103 Copenhagen/1257 Copenhagen/1259
Aahus/6153 Odense/9155 Aalborg/8151
Lille Valby-Risø
10000
9000 CO - annual 8 h max
8000
7000
6000
3
µg/m
5000
4000
3000
2000
1000
0
1994 1996 1998 2000 2002 2004 2006 2008 2010 2012
Copenhagen/1103 Copenhagen/1257 Copenhagen/1259
Aahus/6153 Odense/9155 Aalborg/8151
Lille Valby-Risø
Figure 5.1. Annual average values and highest 8-hour value calculated based on an hour-
ly moving average. Previous results from Copenhagen/1103 can be found at the website
of the Copenhagen Environmental Protection Agency (www.Miljoe.kk.dk).
31You can also read