A meteo-hydrological prediction system based on a multi-model approach for precipitation forecasting
←
→
Page content transcription
If your browser does not render page correctly, please read the page content below
Nat. Hazards Earth Syst. Sci., 8, 143–159, 2008
www.nat-hazards-earth-syst-sci.net/8/143/2008/                                                   Natural Hazards
© Author(s) 2008. This work is licensed                                                                and Earth
under a Creative Commons License.                                                               System Sciences

A meteo-hydrological prediction system based on a multi-model
approach for precipitation forecasting
S. Davolio1 , M. M. Miglietta2 , T. Diomede3,4 , C. Marsigli3 , A. Morgillo3 , and A. Moscatello2
1 Institute
          of Atmospheric Sciences and Climate, ISAC-CNR, Bologna, Italy
2 Institute
          of Atmospheric Sciences and Climate, ISAC-CNR, Lecce, Italy
3 Regional Hydro-Meteorological Service ARPA-SIM, Bologna, Italy
4 Centro Interuniversitario di Ricerca in Monitoraggio Ambientale (CIMA), Università degli studi di Genova e della

Basilicata, Savona, Italy
Received: 9 October 2007 – Revised: 25 January 2008 – Accepted: 25 January 2008 – Published: 28 February 2008

Abstract. The precipitation forecasted by a numerical              1   Introduction
weather prediction model, even at high resolution, suffers
from errors which can be considerable at the scales of in-         Severe weather events and heavy precipitations occurring
terest for hydrological purposes. In the present study, a frac-    over complex terrain are often associated with flood, produc-
tion of the uncertainty related to meteorological prediction       ing risk conditions for society and environment. Accurate
is taken into account by implementing a multi-model fore-          and reliable meteo-hydrological forecasts, issued with suffi-
casting approach, aimed at providing multiple precipitation        cient lead time, may result in the reduction of flood damages
scenarios driving the same hydrological model. Therefore,          and efficient management of the risk. For these reasons, the
the estimation of that uncertainty associated with the quan-       scientific community has increasingly devoted resources and
titative precipitation forecast (QPF), conveyed by the multi-      attention to bring together hydrological and meteorological
model ensemble, can be exploited by the hydrological model,        communities and, in particular, to couple meteorological and
propagating the error into the hydrological forecast.              hydrological models in order to provide more accurate and
   The proposed meteo-hydrological forecasting system is           timely flood forecasts.
implemented and tested in a real-time configuration for sev-          During the last few years, several international research
eral episodes of intense precipitation affecting the Reno river    projects have dealt with different aspects of this subject.
basin, a medium-sized basin located in northern Italy (Apen-       For example, RAPHAEL (Runoff and Atmospheric Pro-
nines). These episodes are associated with flood events of         cesses for flood HAzard forEcasting and controL) project
different intensity and are representative of different mete-      (Bacchi and Ranzi, 2000) was aimed at developing and im-
orological configurations responsible for severe weather af-       plementing coupled meteo-hydrological systems at the re-
fecting northern Apennines.                                        gional scale to improve flood forecasting and management
   The simulation results show that the coupled system is          in mountain catchments. More recently, HEPEX (Hydro-
promising in the prediction of discharge peaks (both in terms      logical Ensemble Prediction EXperiment) has been focus-
of amount and timing) for warning purposes. The ensem-             ing on the ensemble prediction approach, with the aim of
ble hydrological forecasts provide a range of possible flood       meeting end-users’ needs, in order to implement decision
scenarios that proved to be useful for the support of civil pro-   making procedures (Hamill et al., 2005; Schaake at al.,
tection authorities in their decision.                             2007). The European COST Action 731, “Propagation of
                                                                   Uncertainty in Advanced Meteo-Hydrological Forecast Sys-
                                                                   tems” addresses the problem of forecasting (heavy) precip-
                                                                   itation events and the corresponding hydrological processes
                                                                   and to thoroughly investigate the propagation of uncertainty
                                                                   through the various steps of modelling and decision making
                                                                   (Rossa et al., 2005). Finally, a more operational approach
                                                                   is proposed by MAP D-PHASE (Mesoscale Alpine Pro-
Correspondence to: S. Davolio                                      gramme, Demonstration of Probabilistic Hydrological and
(s.davolio@isac.cnr.it)                                            Atmospheric Simulation of flood Events in the Alps) project,

Published by Copernicus Publications on behalf of the European Geosciences Union.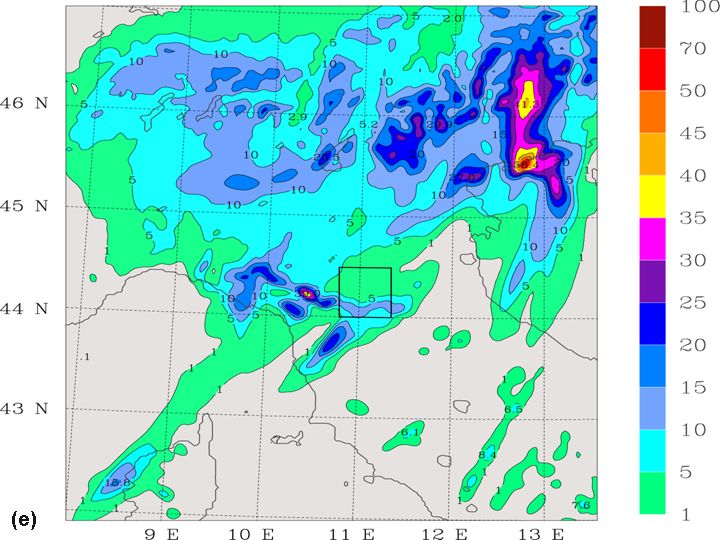
144                                                                  S. Davolio et al.: Multi-model meteo-hydrological forecasting

an end-to-end forecasting system for Alpine flood events that         of the orography and improved description of fine-scale ef-
has been set up to demonstrate state-of-the-art forecasting           fects in mountainous areas, such as lifting or blocking. Of
of precipitation-related high-impact weather (Rotach et al.,          course, even at such high resolutions, models are not perfect
2005).                                                                and can not describe the atmospheric motion and predict the
   The need for coupled meteorological and hydrological               precipitation field exactly.
models can be understood considering that quantitative in-               Although the main uncertainty of a flood forecasting sys-
formation about rainfall is an essential input for hydrological       tem results from the rainfall prediction (Krzysztofowicz,
forecasts. For very large catchments, hydrological predic-            1999; Koussis et al., 2003; Ebert et al., 2006; Ranzi et
tion can be based upon rainfall observations, since the re-           al., 2007), the uncertainties associated with the hydrological
sponse time of the basin is long enough to allow for timely           models should be considered too. Each model component
civil protection plans. On the contrary, for medium sized             has its own source of uncertainty, producing a sort of cas-
(from 1000 to 10 000 km2 ) and smaller catchments charac-             cade of errors propagating from the atmospheric conditions
terized by complex orography, the response times are usually          to rainfall forecasts, from rainfall to runoff prediction, and
shorter, of the order of a few hours. Therefore, hydrological         from runoff to flood wave (Pappenberger et al., 2005).
models need an alternative forcing function (Melone et al.,              To cope and deal with all these uncertainties, forecasts
2005) so that timely river flow forecasts, with lead time from        have to be provided in a probabilistic form, following an en-
several days (early warning) to 24–48 h (warning and alarms)          semble approach (Hou et al., 2007). This procedure allows
ahead, can be provided by coupling hydrological models and            to provide both the most likely evolution, represented by the
meteorological numerical weather prediction (NWP) mod-                ensemble mean, and an estimate of the range of the possi-
els.                                                                  ble outcomes (ensemble spread), that should be taken into
   Precise and suitable discharge predictions require accu-           account in the decision making process. Although still asso-
rate precipitation forecasts in terms of both spatial and tem-        ciated with uncertainties, progressively increasing for longer
poral details: in other terms, the quality of meteorological          lead times, this information is beneficial for the hydrolog-
forecasts can be a key controlling factor for the quality of          ical services because it provides likely flood scenarios and
a hydrological forecast (Pappenberger et al., 2005). This is          the possibility for a flood event in the near future (Thielen
particularly relevant in mountainous regions, where intense           at al., 2007). As a consequence, users of hydrological fore-
rainfalls quite often produce a rapid rise in water level and         casts prefer more and more quantitative estimates of forecast
sudden flow peak. Unfortunately, precipitation forecasting            uncertainty rather than the single most likely scenario.
is probably the most difficult task for NWP models, since                Probabilistic approaches to quantify uncertainties of flood
rain is the end result of many complex and interacting pro-           predictions have been applied recently (Siccardi et al., 2005)
cesses ranging from the large scale motions to the micro-             and ensemble predictions have been increasingly exploited in
physics. Moreover, further complexity arises over mountain-           flood forecasting systems (de Roo et al., 2003; Gouweleeuw
ous areas, since the orographic forcing needs to be properly          et al., 2005; Pappenberger et al., 2005; Diomede at al., 2008):
resolved and described (Richard et al., 2007). Although the           the operational use of ensemble prediction systems for prob-
use of high resolution limited-area models (LAMs) has im-             abilistic flood forecasting, based on NWP models providing
proved the short-range prediction of locally intense events, it       an input to hydrological models, represents a challenge for
is sometimes difficult to forecast accurately their space-time        the scientific community and for decision makers (Krzyszto-
evolution, especially for ranges longer than 48 h (Marsigli et        fowicz, 2001; Montani et al., 2003; Moore et al., 2006;
al., 2005), so that quantitative precipitation forecasts (QPF)        Ramos et al., 2007).
is still a challenging task at the scale of interest for hydrolog-       Recent efforts to generate short-range hydrological ensem-
ical prediction.                                                      ble forecasts on the Reno river basin (Fig. 1) have been done
   The extent to which a QPF is beneficial for hydrological           by coupling an atmospheric multi-model ensemble, based on
predictions depends considerably on the ability of the NWP            different high resolution limited area models, with an hy-
models to resolve the scales and processes relevant for hy-           drological model (Diomede et al., 2008). This approach al-
drological applications (Gebhardt et al., 2007). Nowadays,            lows to represent the uncertainty intrinsic in the meteorolog-
due to the rapid progress in computing performance and at-            ical models (which is only a fraction of the total uncertainty
mospheric modelling, high-resolution NWP models run with              in the forecasting process) exploiting the fact that models
horizontal grid resolution down to a few kilometres and are           from different institutes have been developed almost inde-
used to predict weather operationally at local scales, filling        pendently and, thus, numerical and physical schemes are dif-
the gap in the spatial scale with the hydrological models. The        ferent among them. The results, based on a few case studies,
very small grid spacing employed allows to explicitly (with-          were promising.
out parameterization) simulate small-scale processes which               The aim of the present study is to deepen and consoli-
are relevant also for hydrology, such as deep convection              date the findings of Diomede et al. (2008) by extending the
which is often involved in severe weather episodes. More-             previous results to a wider range of weather events, repre-
over, higher resolution means a much better representation            sentative of different meteorological configurations typically

Nat. Hazards Earth Syst. Sci., 8, 143–159, 2008                                   www.nat-hazards-earth-syst-sci.net/8/143/2008/
S. Davolio et al.: Multi-model meteo-hydrological forecasting                                                                        145

                                                                       Fig. 2. Model integration domains, the outer (inner) being used for
Fig. 1. Localisation of the Reno river basin, its sub-catchments       low (high) resolution forecasts.
(light green line) and the main river (cyan). The upper basin closed
at Casalecchio Chiusa river section is evidenced with dark green
lines.                                                                    TOPKAPI is driven by the hourly precipitation provided
                                                                       by several limited-area meteorological models, whose set up
affecting northern Apennines and responsible for remarkable            is shown in Table 1. BOLAM and MOLOCH models have
river flow increasing. The multi-model approach produces               been developed and implemented by the Institute of Atmo-
a range of possible meteorological inputs to feed the same             spheric Sciences and Climate – National Research Coun-
hydrological model. In this way, the uncertainty associated            cil (ISAC-CNR) in Bologna. A detailed description can be
with the meteorological forecasts can propagate into the hy-           found respectively in Davolio and Buzzi (2004) and Davo-
drological model, providing an estimation of the uncertainty           lio et al. (2007). The Weather Research and Forecasting
associated with the discharge prediction. The performance              (WRF) Model (Klemp et al., 2000; Michalakes et al., 2004;
of the probabilistic coupled system, implemented in a real-            Skamarock et al., 2005) has been implemented by ISAC-
time configuration, is evaluated for the Reno river basin, a           CNR in Lecce and is described in the WRF model website
medium-sized catchment (total dimension about 5000 km2 )               (www.wrf-model.org). COSMO model (formerly known as
located in northern Italy (Fig. 1).                                    Lokal Model and here referred to as LM) has been imple-
                                                                       mented by ARPA-SIM. For a complete description of LM,
   Meteorological and hydrological models are briefly de-
                                                                       the reader is referred to the COSMO (COnsortium for Small-
scribed in Sect. 2. Section 3 is devoted to the description
                                                                       scale MOdelling) web site (www.cosmo-model.org).
and analyses of the three case studies. A general discussion
                                                                          All the models are non-hydrostatic, except for BOLAM,
is presented in Sect. 4 and concluding remarks are drawn in
                                                                       with horizontal resolution ranging from 2.5 to 8 km. For the
Sect. 5.
                                                                       low resolution integrations, moist convection is parameter-
                                                                       ized. BOLAM implements the Kain-Fritsch (Kain, 2004)
                                                                       convective scheme. The same scheme, but with some modi-
2   Meteorological and hydrological models set up                      fication is used by WRF. LM implements the Tiedtke mass-
                                                                       flux scheme (Tiedtke, 1989). At higher resolution, deep
The hydrological predictions are performed using TOPKAPI               moist convection parameterization is switched off in all the
(TOPographic Kinematic APproximation and Integration)                  models (MOLOCH, WRF and LM).
(Todini and Ciarapica, 2001), a distributed rainfall-runoff               Model integration domains are shown in Fig. 2. For the
model. A detailed description can be found in Liu and To-              coarse resolution run, initial conditions are provided by the
dini (2002). For the implementation of the model over the              operational ECMWF analysis, while boundary conditions are
Reno river basin, the calibration and validation runs have             provided every 3 h, over the outer domain, by the ECMWF
been performed using the hourly meteo-hydrological dataset             operational forecasts. The high resolution simulations, pro-
available from 1990 to 2000. TOPKAPI is currently em-                  vided by nesting as described in Table 1, are performed over
ployed for operational discharge forecasting by ARPA-SIM               the inner domain shown in Fig. 2. In this case, for simu-
(Agenzia Regionale Prevenzione e Ambiente – Servizio Idro              lations using one-way nesting, the boundary conditions are
Meteorologico), the HydroMeteorological Service of Emilia-             updated hourly. This implementation is therefore equivalent
Romagna Region.                                                        to a real-time forecasting system.

www.nat-hazards-earth-syst-sci.net/8/143/2008/                                      Nat. Hazards Earth Syst. Sci., 8, 143–159, 2008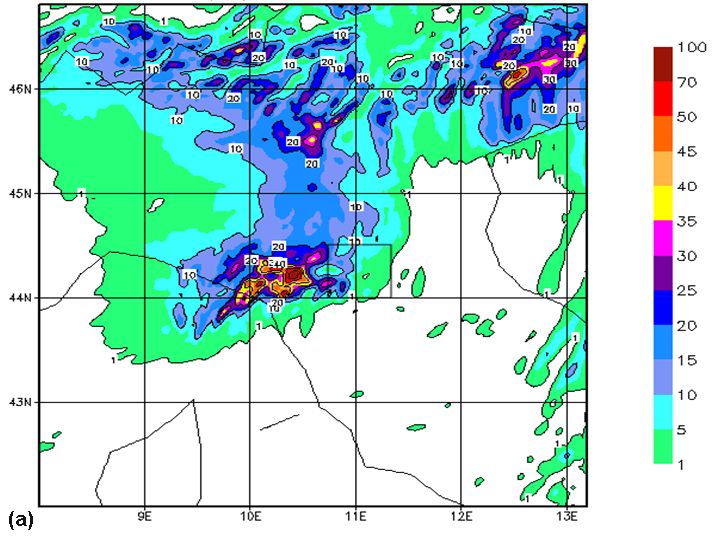
146                                                                    S. Davolio et al.: Multi-model meteo-hydrological forecasting

Table 1. Summary of model configurations.

          MODEL         Horizontal Resolution (km)      Grid points    Levels     Initial/boundary conditions   Nesting Procedure
          BOLAM                       8                 200×240         42        ECMWF analyses/forecasts               /
          MOLOCH                     2.8                240×240         50             BOLAM                       1-way nesting
          LM7                         7                 234×272         41        ECMWF analyses/forecasts               /
          LM2.8                      2.8                246×240         41               LM7                       1-way nesting
          WRF7.5                     7.5                200×240         42        ECMWF analyses/forecasts               /
          WRF2.5                     2.5                244×238         42              WRF7.5                     2-way nesting

Table 2. List of the meteorological events, maximum precipitation registered by the raingauge network within the Reno river basin and
forecast details.

      Date                     Meteorological event                          Max cumulated rainfall     Forecast initial time and range
                                                                               (over Reno basin)
      6–7 November 1999        Intense Alpine orographic cyclogenesis              117 mm/48 h          6 Nov 1999, 00:00 UTC, 48 h
      21–23 January 2003       Deep trough and cold front progressing               89 mm/48 h          21 Jan 2003, 00:00 UTC, 48 h
                               eastward
      7–9 November 2003        Retrograde (cold-core) cyclone                      171 mm/48 h          7 Nov 2003, 12:00 UTC, 48 h
      10–12 April 2005         Alpine orographic cyclogenesis                      135 mm/60 h          10 Apr 2005, 00:00 UTC, 72 h
      2–3 December 2005        Deep trough and cold front progressing              137 mm/48 h          2 Dec 2005, 12:00 UTC, 48 h
                               eastward

   The performance of the probabilistic coupled system is                1999, where the 6-hourly reanalysis fields and intermediate
evaluated over the upper portion (about 1000 km2 ) of the                3-hourly fields, provided by the ECMWF 4D-VAR trajec-
Reno river basin, which is located to the north-eastern slopes           tories, have been chosen. Finally, the limitations due to the
of the northern Apennines (Fig. 1). (Hereafter with “Reno                small number of ensemble members and to the few sources of
river basin” we refer only to this upper zone of the entire              errors considered in the ensemble generation could produce
watershed). The closure section of this mountainous basin,               a limited spread and reduce the performance of the hydro-
Casalecchio Chiusa, is characterized by a concentration time             meteorological modelling system.
of about 10–12 h.
   In the operational practice, a flood event at such river sec-
tion is defined when the water level, recorded by the gauge              3      Results
station, reaches or overcomes the value of 0.8 m (correspond-
ing to a discharge value of about 80 m3 /s), corresponding to            The proposed multi-model approach to QPF has been im-
the warning threshold. The alarm level is set to 1.6 m (corre-           plemented in five episodes of intense precipitation, associ-
sponding to a discharge value of about 630 m3 /s).                       ated with remarkable river flow increasing (Table 2). These
   We should keep in mind that some weaknesses are present               episodes are representative of three different kinds of weather
in our analysis. First, the statistics is limited to just five cases     systems that can affect northern Apennines and in particular
and thus the number of experiments is too small to infer                 the Reno river basin.
a general conclusion, although covering a range of typical                  Alpine orographic cyclogenesis is a quite typical meteoro-
meteorological situations for northern Apennines. The en-                logical configuration especially in autumn and spring. The
semble is not homogeneous, due to different modelling sys-               interaction between a baroclinic wave and the Alpine chain
tems and boundary conditions employed. In fact, RAMS,                    favours the development of a secondary cyclone on the lee
instead of WRF, was included in the two cases shown in                   side (south) of the Alps (Buzzi and Tibaldi, 1978). The cy-
Diomede et al. (2008): RAMS was set up differently with                  clonic circulation around the orographic low, that progres-
respect to the horizontal resolution, the grid domain exten-             sively intensifies and moves south-eastward, can affect the
sion and the number of vertical levels. Also, the ECMWF                  northern Apennines with precipitation that can sometimes be
operational model forecasts have been provided as bound-                 intense. Another typical meteorological condition is repre-
ary conditions, in order to simulate a real-time forecast-               sented by the passage of a deep trough over the Mediter-
ing, in all the events except for the case of 6–7 November               ranean basin, associated to a cold front progressing eastward

Nat. Hazards Earth Syst. Sci., 8, 143–159, 2008                                           www.nat-hazards-earth-syst-sci.net/8/143/2008/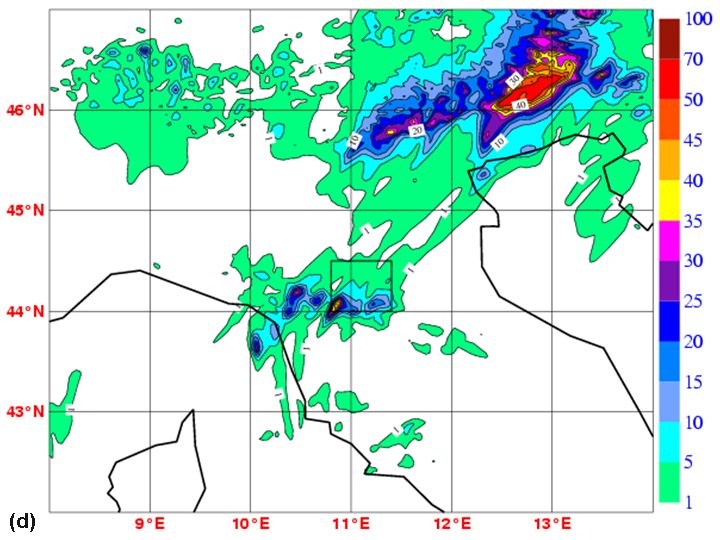
S. Davolio et al.: Multi-model meteo-hydrological forecasting                                                                       147

Fig. 3. ECMWF analyses of geopotential at 500 hPa (black isolines, contour interval 40 gpm), temperature at 850 hPa (colors) and mean sea
level pressure (dashed lines, contour interval 3 hPa) for 7 Nov 2003 at (a) 00:00 UTC, (b) 12:00 UTC and for 8 Nov 2003 at (c) 00:00 UTC,
(d) 12:00 UTC.

quite rapidly. During the autumn and winter seasons, this              latter obtained using observed meteorological data as input
configuration can produce intense, although not long-lasting,          and the same set up applied in the forecasting system for
rainfall over the Apennines, due to the rapid movement of the          the hydrologic model. To obtain the calculated discharge,
frontal system. Finally, the case of the retrograde cold-core          the Thiessen Polygon method has been employed to spa-
cyclone, that is a cyclonic disturbance at mid troposphere             tially distribute the observed precipitation. This procedure
moving westward over northern Italy, is not a very common              can be affected by an intrinsic limitation, since it could dis-
situation, but it is very interesting since it is associated with      tribute the rainfall over a too wide area, especially for iso-
severe weather.                                                        late measurements located in mountainous region, causing
                                                                       an unrealistic overestimation of the total amount of rainfall.
   The first two episodes in Table 2 have been already de-
                                                                       Nevertheless, the calculated curve, instead of the observed
scribed and analysed in Diomede et al. (2008) and will be
                                                                       discharge, has been used for comparison with the results de-
considered here only in the final discussion. The other three
                                                                       rived from the meteorological models so that the systematic
selected flood events, corresponding to three different meteo-
                                                                       error of the hydrological model would not affect the compar-
rological conditions, will be thoroughly analysed. Forecasted
                                                                       ison. On the other hand, the rainfall fields predicted by the
discharges have been compared to calculated discharges, the

www.nat-hazards-earth-syst-sci.net/8/143/2008/                                      Nat. Hazards Earth Syst. Sci., 8, 143–159, 2008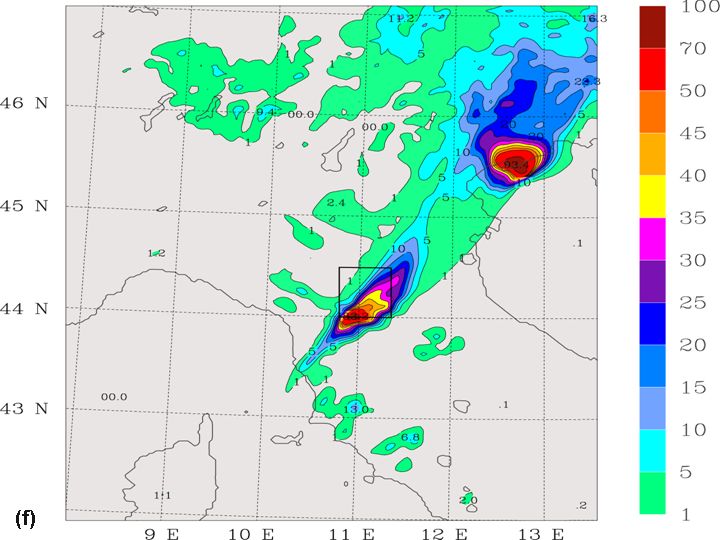
148 S. Davolio et al.: Multi-model meteo-hydrological forecasting
different meteorological models were down-scaled to the hy-
drological model grid resolution by assigning to each cell the
rainfall value provided on the nearest meteorological model
grid point.
3.1 First case study: 7–9 November 2003
3.1.1 Meteorological features
The episode occurred from 7 to 9 November 2003 was as-
sociated with a westward moving cyclone. The maximum
observed water level for this event was 1.75 m, correspond-
ing to the 13th most intense event recorded in the basin1 .
The ECMWF analysis of 7 November 2003, 00:00 UTC,
shows a 500 hPa cut-off low, with a cold core at 850 hPa,
centred over Croatia, so that the associated cyclonic circu-
lation affected mainly the Adriatic and the Balcanic regions
(Fig. 3a). The main axis of the elliptical isolines surrounding
the closed minimum was elongated in WNW-ESE direction,
from Germany to Turkey. In the following 12 h the cut-off
cyclone moved westward and a closed minimum of about
5520 gpm was located over the western Alps (Fig. 3b). At
the same time, the associated trough rotated anticlockwise.
During 8 November 2003, the westward movement of the
minimum and its anticlockwise rotation continued (Fig. 3c).
At 12:00 UTC, the centre of the cyclone was located over
northern France and a trough, elongated from NW to SE,
crossed northern and central Italy (Fig. 3d). At low levels,
a high pressure area over Scandinavia produced an intense
easterly flow over northern Italy.
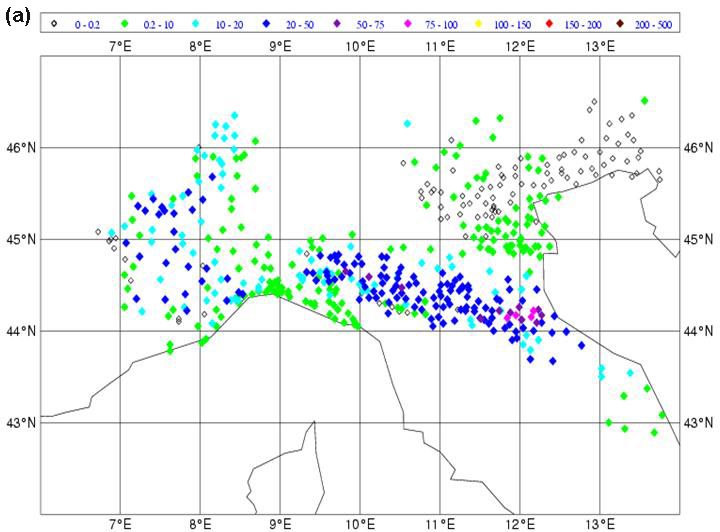
The analysis of the raingauge recordings allows to iden-
tify two distinct periods of precipitation. During the first
phase, mainly on 7 November, the low level easterly flow
impinged on the Apennines producing a wide area of intense
rainfall: a maximum larger than 75 mm/24 h was recorded
at some stations in the southern part of the Emilia-Romagna
region (Fig. 4a). Simultaneously, precipitation affected the
Piedmont region, close to the western Alps. Such distribu-
tion of rainfall, concentrated mainly on the side of the moun-
tains that is upstream with respect to the prevailing low level
easterly winds, can be considered as a fingerprint of the sta-
ble orographic precipitation mechanism working during this
phase. Later, in the morning of 8 November (Fig. 4b), the
largest precipitation amount was recorded along a narrow
band, extended from Veneto to Emilia-Romagna region (data
over Tuscany are not available). In the following 6 h, the
band shifted further eastward, affecting the plains of north-
eastern Italy (Fig. 4c). During the 12-h period between
Fig. 4. Observed precipitation (mm). (a) 24-h accumulated rainfall 06:00 and 18:00 UTC of 8 November, heavy rainfall insisted
during 7 Nov 2003; 6-h accumulated rainfall between (b) 06:00– mainly over the Reno river basin, exceeding 100 mm/12 h at
12:00 UTC and (c) 12:00–18:00 UTC, 8 Nov 2003. The square in- several locations. The origin of the rainfall during this phase
dicates the upper portion of the Reno river basin. can be attributed to the passage of the upper level trough over
1 The historical archive of flood events covers the period between
1981 and 2004.
Nat. Hazards Earth Syst. Sci., 8, 143–159, 2008 www.nat-hazards-earth-syst-sci.net/8/143/2008/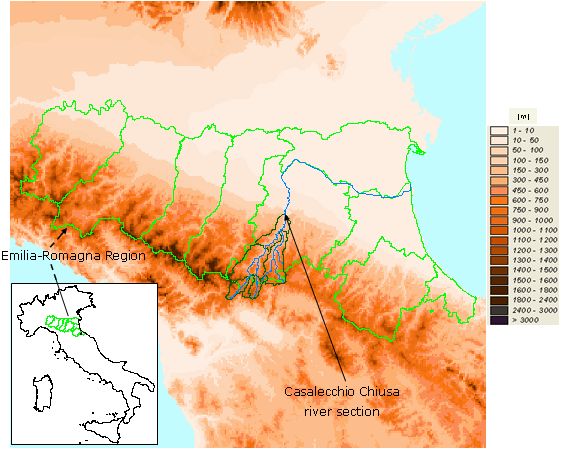
S. Davolio et al.: Multi-model meteo-hydrological forecasting                                                                      149

the area (Fig. 3) associated with the meridional wind imping-
ing over the Apennines.

3.1.2   Observed and forecast precipitation

The observed and forecast 6 h-accumulated precipitation, av-
eraged over the Reno river basin, are shown in Fig. 5a. It is
apparent that the maximum precipitation was recorded in the
second part of the event, from 12:00 to 18:00 UTC, 8 Novem-
ber (corresponding to the 24–30 h forecast range in Fig. 5a),
when the rainfall peak was larger than 40 mm/6 h. None of
the models did predict correctly the temporal evolution of the
event, as they largely overestimated the rainfall during the
first phase (00–12 h forecast range) and most of them missed
completely the peak in the second part.
   The hourly cumulated rainfall, shown in Fig. 5b, allowed a
more detailed intercomparison among the rainfall predictions
and the observations. During the first phase, on 7 November,
all the members of the ensemble remained very close each
other, although largely above the observed curve. Thus, the
ensemble was not able to provide a reliable estimation of the
meteorological uncertainty, due to the considerable under-
dispersion, i.e. insufficient spread among the members. This
behaviour was found for very short range forecasts and
medium-sized river basins also by Hou et al. (2007). More-
over, the similar and incorrect behaviour held by the different
meteorological models at such a short forecast range suggests
that probably the initial and boundary conditions provided to
the models were inaccurate. Depending on the large-scale
flow, the initial and boundary conditions may exert a no-
ticeable influence on the forecast, so that they can induce
a considerable amount of error into the meteorological sim-
ulations and, consequently, in the hydrological application.
A more comprehensive approach would have included in the
ensemble also the uncertainties associated with the initial and
boundary conditions (multi-model, multi-analysis approach),
but the application of this technique is out of the purposes of
the present paper.
   On 8 November, all the models strongly underestimated          Fig. 5. 7–9 Nov 2003 event. (a) 6 h observed and forecast precip-
the observed cumulated rainfall (Fig. 5b). The sharp precip-      itation (mm) averaged over the Reno river basin. (b) Precipitation
itation increase observed from 12:00 to 18:00 UTC (24–30 h        (mm) averaged over the Reno river basin cumulated from the begin-
forecast range), was reproduced approximately well only by        ning of the forecast, using hourly data. (c) Discharge forecast (m3 /s)
MOLOCH, although underestimate and with nearly 6 hours            vs. forecast range (h). In (c), the different curves have been obtained
of delay. From Fig. 5b it is apparent that, in general, the       by feeding the TOPKAPI model with the precipitation forecast by
                                                                  the different meteorological models and with the raingauge obser-
higher resolution simulations improved the rainfall predic-
                                                                  vations (red dashed line). The observed discharge (blue dotted line)
tions with respect to the coarser resolution runs since also      is also plotted for reference.
LM2.8 shows a small precipitation increase with the same
delay. Only for WRF the improvement was negligible, since
both the WRF runs missed almost completely the steep rain-
fall increase. The 2-way nesting technique probably sup-
pressed the differences between the finer and the coarser
runs.

www.nat-hazards-earth-syst-sci.net/8/143/2008/                                  Nat. Hazards Earth Syst. Sci., 8, 143–159, 2008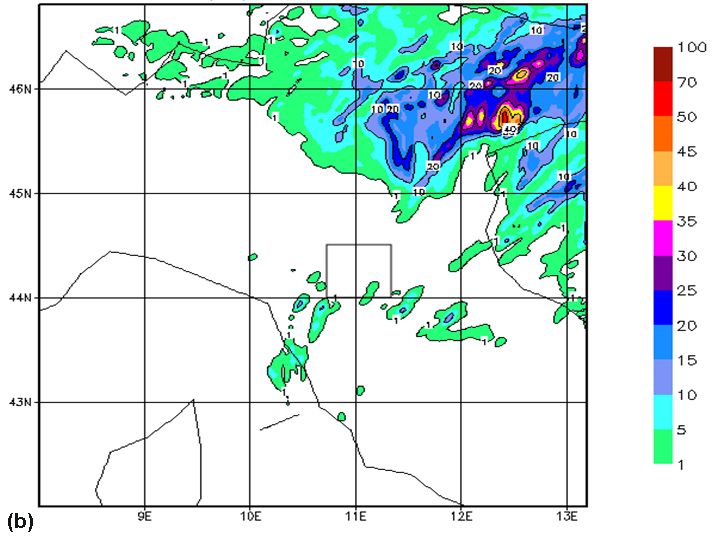
150 S. Davolio et al.: Multi-model meteo-hydrological forecasting
3.1.3 Observed and forecast discharge logical forecast, both in terms of rainfall amount and timing
of the event, can be considered quite satisfactory, since it is
Figure 5c shows the measured, the calculated and the pre- indicative of intense precipitation over the northern Apen-
dicted discharges vs. forecast time. A discharge quite similar nines area. In the following 6 h, the rainfall moved further
to the observed one, but with a slight overestimation of the north-eastward, far from the basin (Fig. 6b). Similar results
peak and the descending curve, was obtained by feeding the came out for the WRF coarse resolution run (not shown).
hydrological model with raingauge measurements, spatially Also LM2.8 predicted the location of the rainfall maxi-
distributed by the Thiessen Polygon method. The river flow mum out of the basin (Fig. 6c). However, differently from
increased after 06:00 UTC, 8 November, reaching the maxi- WRF, the rainfall persisted over the Apennines during the
mum discharge (about 900 m3 /s) during the night, at approx- following 6 h interval so that a maximum of about 45 mm/6 h
imately 22:00 UTC of 8 November. Then the flow decreased, was recorded in the Reno river basin from 18:00 UTC, 8
as a consequence of the reduced amount of precipitation. November, to 00:00 UTC, 9 November (Fig. 6d). In that
The response of the hydrological model was completely period, the 6 h-cumulated LM2.8-forecast precipitation, av-
different when it was forced with the forecast precipita- eraged over the basin, agreed well with the observed value
tion. This discrepancy among the discharges predicted by the (Fig. 5a). The rainfall predicted by LM7 (not shown) was
different hydrological forecast and the calculated discharge much smaller than the LM2.8 forecast (Fig. 5a, b).
based on the observed rainfall is a consequence of the fact Compared with LM2.8 and WRF, the rainfall maximum
that all the meteorological model simulations were affected predicted by MOLOCH in the northern Apennines from
by errors both in terms of timing and amount of rainfall over 12:00 and 18:00 UTC was significantly smaller (Fig. 6e). In
the Reno river basin, as shown in Fig. 5a and b. All the the following 6 h, the rainfall was distributed along a band
simulations produced a peak of discharge during the phase elongated from the Apennines to Veneto; a large peak of
of orographic precipitation, ranging from less than 200 m3 /s 83 mm was observed in the mountainous part of the Reno
(WRF) to about 300 m3 /s (LM2.8), while the observed dis- basin and in most of the watershed the predicted rainfall was
charge did not show any increase in this phase. On the oppo- larger than 20 mm (Fig. 6f), explaining the large discharge
site, all the simulations missed the observed peak, recorded peak observed during this phase (Fig. 5c). BOLAM precipi-
during the transit of the trough; only MOLOCH and LM2.8 tation forecast was affected by a large underestimation during
were able to produce a peak in this phase, but with a delay the entire period of interest (not shown).
of about 6 h and a significant underestimation with respect to In summary, the models predicted the general rainfall pat-
the calculated discharge (the forecast peak is 500 m3 /s and tern quite well, although with some significant differences
200 m3 /s for MOLOCH and LM2.8, respectively). with respect to the observations. The results proved that the
hydrological response of the Reno medium-sized catchment,
3.1.4 Further analysis modelled by the distributed rainfall-runoff model TOPKAPI,
is highly dependent not only on the rainfall amount and tim-
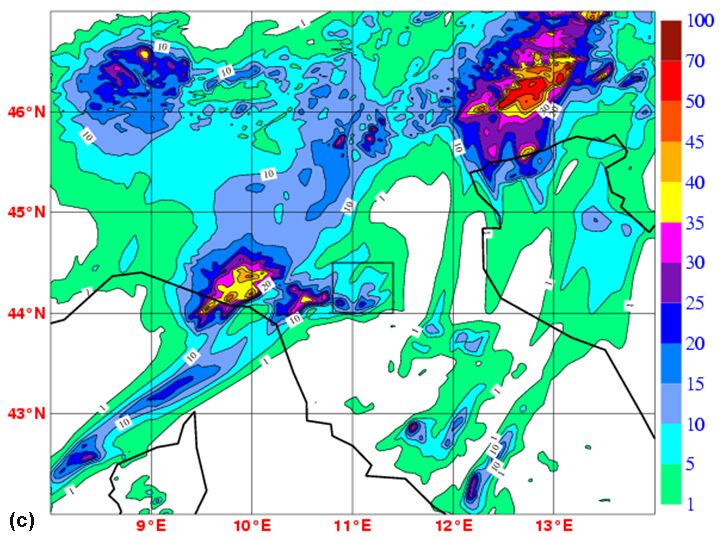
In order to better understand the reasons for the failure of the ing, but also on the correct localization of the precipitation.
models, it seems necessary to investigate more in detail the
distribution of the predicted rainfall in the region. The pre- 3.2 Second case study: 10–12 April 2005
cipitation forecasts were evaluated over an area larger than
the Reno river basin, which is too small to provide a gen- 3.2.1 Meteorological features
eral view of the meteorological models’ performance. We
will concentrate mainly on the time interval from 12:00 to The analysed period was characterized by the rapid devel-
18:00 UTC, 8 November, during the period of the maximum opment of an orographic cyclone south of the Alps and the
observed precipitation in the basin and of the largest model passage of a frontal system over northern Italy. During the 9
errors. During this phase, the observations showed two dif- April, a wide depression area, with several pressure minima,
ferent areas of intense rainfall (see Fig. 4c): the former was affected the Scandinavian Peninsula, while an intense trough,
located over the Apennines between Tuscany and Emilia- elongated in a northeast-southwest direction, moved over
Romagna regions, with a maximum rainfall of more than France, towards the Mediterranean basin. At upper level, a
70 mm/6 h registered in some stations in the upper part of PV streamer was associated with the trough (not shown).
the Reno river watershed; the latter was located north of the In the following 48 h a cyclogenesis occurred over the
Po mouth, close to the Adriatic coast of Veneto region. Mediterranean. During the first hours of 10 April (Fig. 7a)
Figure 6a shows the distribution of the precipitation field a lee cyclone appeared over the Mediterranean sea, west
for WRF2.5: an area of intense rainfall, of similar intensity of Corsica, underneath the mid tropospheric trough and in
to that one observed in the basin, was centred close to, but the following hours it deepened moving slowly southward
outside, the Reno watershed. The fact that the rainfall was over Sardinia. The intensification of the orographic depres-
shifted a few tents of kilometres to the west made the hydro- sion was favoured by the cold air outbreak at upper levels
logical prediction completely wrong although the meteoro- (−32◦ C at 500 hPa) over western Mediterranean and as a
Nat. Hazards Earth Syst. Sci., 8, 143–159, 2008 www.nat-hazards-earth-syst-sci.net/8/143/2008/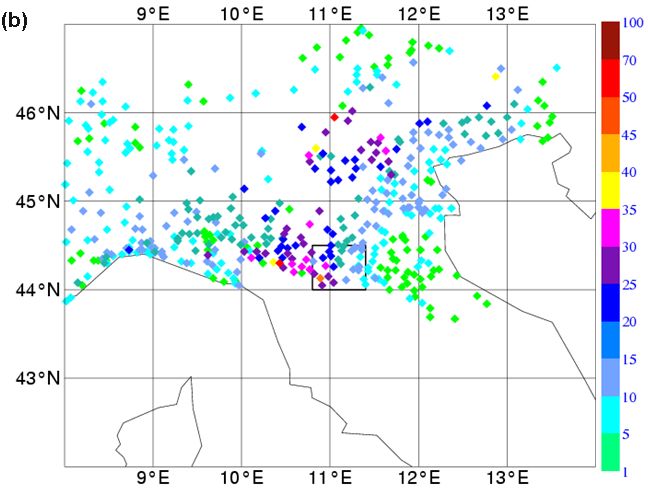
S. Davolio et al.: Multi-model meteo-hydrological forecasting                                                                    151

Fig. 6. 6-h accumulated precipitation at 18:00 UTC, 8 Nov 2003 (a, c, e) and at 00:00 UTC, 9 Nov2003 (b, d, f) as forecasted by WRF2.5
(a, b), LM2.8 (c, d) and MOLOCH (e, f).

www.nat-hazards-earth-syst-sci.net/8/143/2008/                                    Nat. Hazards Earth Syst. Sci., 8, 143–159, 2008
152 S. Davolio et al.: Multi-model meteo-hydrological forecasting
consequence of the interaction and merging with a surface
disturbance (visible in Fig. 7a) coming from northern Africa.
The upper level trough extended towards northern Africa,
producing a warm south to south-westerly flow over south-
ern and central Italian Peninsula. At the same time, another
cold air outbreak from the north-east affected the northern
Adriatic with strong Bora-type flow which favoured the pre-
cipitation on the windward (northern) side of the Apennines
and in particular over the Reno river basin.
During the morning of 11 April, the lee cyclone appeared
fully developed with a minimum pressure of 998 hPa close to
Sardinia (Fig. 7b) and it was well separated by the “parent”
cyclone over the Norwegian sea by a strong pressure ridge
north of the Alps. The cut-off was well developed at all lev-
els, and also the PV streamer completed the cut-off process
in the course of the afternoon. The cyclonic circulation af-
fecting the Mediterranean basin still favoured the persistence
of north-easterly flow impinging on the northern Apennines,
responsible for cloudiness (Fig. 7c) and further moderate pre-
cipitation over the analysed basin (Fig. 8a).
3.2.2 Observed and forecast precipitation
A detailed analysis of the observed precipitation field indi-
cates that the rainfall over the Reno river basin was partic-
ularly intense between 12:00 and 18:00 UTC, 10 April (cor-
responding to the 12–18 h forecast range in Fig. 8a and b),
with a number of raingauges recording more than 30 mm/6 h,
some of them above 40 mm/6 h (not shown). Also the fol-
lowing 6-h period was characterized by quite intense and
widespread precipitation, around 30 mm/6 h at some stations.
Later, during 11 April, the rainfall intensity progressively de-
creased except for a temporary phase of rainfall intensifica-
tion between 12:00 and 18:00 UTC. This behaviour is shown
also by the hourly cumulated precipitation (Fig. 8b, dashed
line) which increased during the first 24 h, then remained
nearly constant for many hours, before displaying a further
growth approximately 36 h after the beginning of the episode.
Although underestimating the main precipitation peak, all
the models predictions reproduce quite well the behaviour
of the rainfall field averaged over the basin (Fig. 8a), espe-
cially during the first 24 h. During the first 12 h of 11 April
(24–36 h forecast range), the models tend to overestimate the
rainfall, while in the following 12 h a progressive weakening
of the precipitation, instead of a second, minor peak, is fore-
cast. However, the hourly cumulated precipitation, averaged
over the basin (Fig. 8b) shows a remarkably good agreement
between observations and forecasts over the entire period.
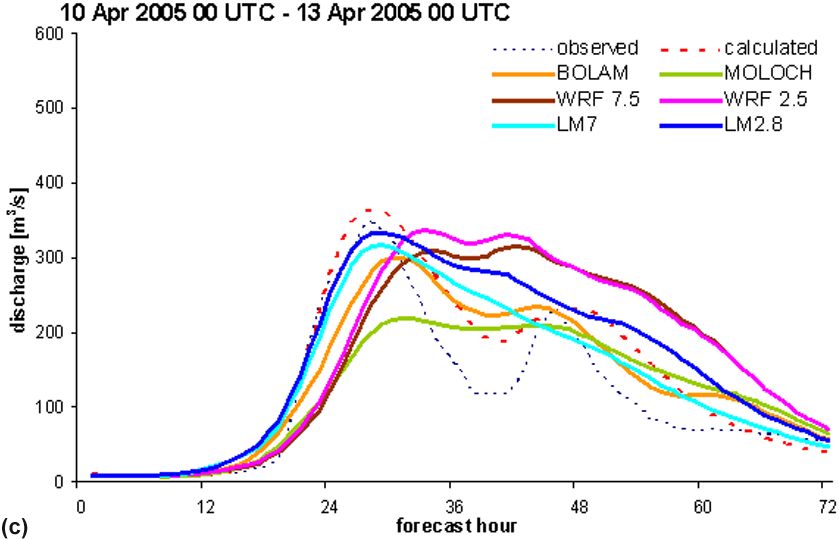
3.2.3 Observed and forecast discharge
Fig. 7. NCEP reanalysis for (a) 10 April 2005 at 00:00 UTC, (b) 11
April 2005 at 00:00 UTC: geopotential at 500 hPa (colors) and mean As it is reasonable to expect from the above evaluation, the
sea level pressure (isolines, contour interval 5 hPa). (c) AVHRR discharge predicted by the hydrological model fed with ob-
visible image at 13:28 UTC, 11 April 2005. served precipitation presents two peaks (Fig. 8c). The first
peak of about 360 m3 /s was attained in the early morning of
Nat. Hazards Earth Syst. Sci., 8, 143–159, 2008 www.nat-hazards-earth-syst-sci.net/8/143/2008/S. Davolio et al.: Multi-model meteo-hydrological forecasting 153
11 April, followed by a second weaker discharge maximum
of about 230 m3 /s during the following night. The computed
discharge is in good agreement with the observed one (max-
imum observed streamflow of about 345 m3 /s, correspond-
ing to the 50th most intense event recorded in the basin), the
latter displaying also two peaks of similar magnitude, but a
more pronounced decreasing phase between them.
Discharges based on rainfall observations and on differ-
ent meteorological model inputs display quite different be-
haviour in terms of hydrological forecasts. The discharge
forecasts driven by LM at both high and low resolution, re-
produce accurately the timing and intensity of the first dis-
charge peak, but in the following, tend to overestimate the
river flow displaying a steadily decrease of the flow, accord-
ing to the progressive ending of the forecast precipitation.
Forcing the hydrological model with both WRF rainfall fore-
casts produces a discharge prediction characterized by a good
estimate of the peak intensity, but with a slight (however less
than six hours) delay. Moreover, there is also the signature
of a second discharge maximum some hours later, whose in-
tensity is remarkably overestimated. This is a consequence
of the significant overestimation of the rainfall over the basin
during the first twelve hours of 11 April (Fig. 8a). The sec-
ondary maximum is properly reproduced by the hydrological
forecast driven by both BOLAM and, to some extent, also
by MOLOCH. Conversely, both these forecasts are affected
by an underestimation of the main discharge peak, which is
particularly remarkable in the MOLOCH-based simulation.
However, the discharge obtained using BOLAM rainfall re-
produces quite accurately the two different phases of the river
flow. This behaviour is due to the agreement of BOLAM
forecasts with the precipitation recordings shown in Fig. 8a,
characterized by weak average intensity in the first half of
11 April (24–36 h forecast range) and a temporary increase
in the following hours. As far as MOLOCH forecast is con-
cerned, since the total averaged amount of rainfall over the
basin is very close to those of BOLAM (Fig. 8b), the dif-
ferent behaviour in the discharge forecast can be ascribed to
a different localization of the rainfall within the Reno river
basin.
Fig. 8. As in Fig. 5, but for the 10–12 April 2005 event.
3.3 Third case study: 2–3 December 2005
3.3.1 Meteorological features
The third case occurred in the night between 2 and 3 De-
cember 2005. The maximum observed water level for this
event was 1.64 m, corresponding to the 19th most intense lands, since it moved slightly in north-east direction; mean-
event recorded in the basin. This event was originated by while, its minimum value increased only of a few hPa. In
the presence of a deep pressure minimum located over the the night of 2 December (Fig. 9), the upper level trough
British Isles. At 00:00 UTC of 2 December, the pressure min- progressed eastward and slightly rotated anticlockwise, ap-
imum was about 970 hPa. The associated 500 hPa trough was proaching the northern Italian regions. A shallow surface
elongated in north-south direction, extending from the North low, of about 1000 hPa, moved toward the Gulf of Genoa. As
Sea to Algeria, well inland in the African continent. In the a consequence of this configuration, intense southerly winds
following 48 h, the low pressure persisted over the British Is- affected northern Italy.
www.nat-hazards-earth-syst-sci.net/8/143/2008/ Nat. Hazards Earth Syst. Sci., 8, 143–159, 2008154 S. Davolio et al.: Multi-model meteo-hydrological forecasting Fig. 9. NCEP reanalysis 3 Dec 2005 at 00:00 UTC: Geopotential at 500 hPa (colors) and mean sea level pressure (isolines, contour interval 5 hPa). 3.3.2 Observed and forecast precipitation During the fast passage of the minimum and of the associated frontal system over northern Italy, the precipitation affected mainly the northern Apennines, where large values, close to 100 mm mostly concentrated in 6 h, have been recorded in some stations during the night between 2 and 3 December (not shown). Over the Reno river basin, the precipitation was mainly concentrated in this phase, with an averaged rainfall of about 30 mm/6 h between 00:00 and 06:00 UTC, 3 Decem- ber (corresponding to the 12–18 h forecast range in Fig. 10a). Afterward, the frontal system moved further eastward and affected more directly the north-eastern Italian regions. All the models forecast correctly the total rainfall in the basin (Fig. 10b) and the general rainfall pattern, that produces in- tense precipitation over the Apennines. 3.3.3 Observed and forecast discharge The discharge calculated by the hydrological model fed with Fig. 10. As in Fig. 5, but for the 2–3 Dec 2005 event. raingauge recordings shows that the river streamflow in- creased after 00:00 UTC, 3 December (Fig. 10c). The maxi- mum value (of about 850 m3 /s) was reached about 12 h later; then the streamflow decreased, as a consequence of the end- ing of the precipitation, and turned below 200 m3 /s at around 00:00 UTC, 4 December. The computed discharge overesti- bers of the ensemble came out to be quite large, since the mated the observed discharge during the whole duration of forecast discharge peaks ranged from 600 m3 /s (BOLAM) the event, in particular close to the peak (about 850 m3 /s vs. to more than 1200 m3 /s (LM2.8). Such a large spread can 600 m3 /s). be interpreted as an expression of low predictability for this The hydrological forecasts, based on meteorological specific event. However, the fact that each model predicted model inputs, were able to reproduce quite well the shape a discharge larger than or very close to the threshold that de- and the timing of the calculated streamflow, that lies inside limits the level of alarm (630 m3 /s) would leave no doubts to the range of the forecast scenarios. With respect to the fore- the authorities in charge of decision about the opportunity of cast of the level of alert, the spread among the different mem- issuing an alarm message for this case. Nat. Hazards Earth Syst. Sci., 8, 143–159, 2008 www.nat-hazards-earth-syst-sci.net/8/143/2008/
S. Davolio et al.: Multi-model meteo-hydrological forecasting                                                                155

3.3.4   Further analysis

The differences among the predicted discharges reflect, in
first approximation, the rainfall amount forecasted by the dif-
ferent meteorological models over the basin. All the models
underestimated the precipitation in the evening of 2 Decem-
ber (Fig. 10b), so that the increase in the calculated discharge
at about 00:00 UTC, 3 December (corresponding to the 12 h
forecast range), was delayed of a few hours by each mem-
ber of the ensemble (Fig. 10c). In the first few hours of 3
December, the rainfall forecast by BOLAM remained much
smaller than the observations and consequently, the simu-
lated peak was significantly underestimated. On the oppo-
site, LM2.8 overestimated the rainfall, so that a significant
overestimation affected also the discharge peak predicted by
this model. MOLOCH, WRF2.5, WRF7.5 and LM7 repro-
duced pretty well the cumulated rainfall averaged over the
basin, so that the predicted discharges fit correctly the cal-
culated discharge. In particular, the four ensemble members
converged to the computed curve a few hours after the peak.
   A feature which was common to all the modelling sys-
tems, apart from WRF, was the fact that the predicted dis-
charge was significantly larger for the higher resolution mod-
els compared to the coarser resolution ones. This is a conse-
quence of the rainfall distribution over the catchment, which
was concentrated mainly close to the mountains: the high
resolution runs tended to produce larger precipitation values
in these areas, due probably to the steeper terrain being re-
solved. Figure 11 shows the rainfall predicted from 00:00
to 06:00 UTC, 3 December, by the BOLAM (Fig. 11a) and
MOLOCH (Fig. 11b) models: it is apparent that the rainfall
predicted by MOLOCH had a smaller horizontal scale com-
pared with BOLAM, better reflecting the underlying topog-
raphy. It is interesting to observe that the average accumu-
lated rainfall amounts predicted by the two models (Fig. 10b)
were very close each other during the first phase. The curves
diverge only after the transit of the frontal system over the
basin, when the intense synoptic flow impinged directly on
the orography delimiting the basin on its south-western side.
The higher resolution of MOLOCH improved significantly
the prediction of precipitation with respect to BOLAM, both        Fig. 11. 6-h accumulated precipitation at 06:00 UTC, 3 Dec 2005
in terms of average rainfall and of river streamflow. Simi-        forecasted by (a) BOLAM and (b) MOLOCH models.
larly, the high resolution LM run, compared with the coarse
resolution simulation, produced larger rainfall but, differ-
ently from BOLAM-MOLOCH, degraded the quality of the               4   Application to operational discharge forecasting
forecast, largely overestimating the orographic precipitation
in the basin. Finally, in WRF, due to the 2-way nesting proce-     In the present Section, some considerations are drawn about
dure, the inner domain influenced the outer one and the dif-       the ability of the meteo-hydrological multi-model system to
ference between the high and low resolution fields was much        produce relevant information concerning the prediction of
smaller.                                                           discharges. In such an effort, the simulated discharges are
                                                                   compared with the calculated streamflow for the three case
                                                                   studies shown in the present paper and for the two events dis-
                                                                   cussed in Diomede et al. (2008). The five events are grouped
                                                                   in three subsets, as shown in Table 2, corresponding to three
                                                                   different weather situations.

www.nat-hazards-earth-syst-sci.net/8/143/2008/                                 Nat. Hazards Earth Syst. Sci., 8, 143–159, 2008
156 S. Davolio et al.: Multi-model meteo-hydrological forecasting The purpose of the present analysis is to evaluate the use- range of peaks lies almost completely above the threshold of fulness of the modelling system for operational forecasting 630 m3 /s. During the event of January 2003 (Fig. 12d), the applications, assessing its ability to provide more informative streamflow peak is less intense (about 400 m3 /s): on average, hydrological prediction through the estimation of the uncer- the magnitude was predicted pretty well even if the P10–P90 tainty associated with the meteorological models. Decision range lies under the calculated discharge and the temporal makers, final consignee of the forecasting procedure results, occurrence of the event is weakly delayed. The spread is not have recently realized the value of a forecast that includes the large enough to completely include the observed peak, but estimate of its uncertainty (Siccardi et al., 2005). In particu- the error is small and not crucial for warning purposes. lar, a suitable forecasting tool should be able to discriminate Finally, for the case of retrograde (cold-core) cyclone of among the threshold for warning (0.8 m for the Reno river 7–9 November 2003 (Fig. 12e), the ensemble mean com- basin, corresponding to about 80 m3 /s) and for alarm (1.6 m, pletely misses the event due to the wrong temporal phase and that is about 630 m3 /s) in order to allow the authorities in the large underestimation the individual members showed charge of decision to take the most appropriate actions. (Fig. 5c). The ensemble mean displays a low peak, missing The comparison is performed considering the discharge the observation in the first phase, while the observed maxi- forecast issued by the ensemble mean as the best forecast mum is largely underestimated and delayed of several hours. and representing the range of the possible outcomes, that is Neither the P90 curve would have given indication for issu- the ensemble forecast uncertainty, as the interval extending ing an alert for this event. between the 10th and the 90th percentile (respectively, P10 In conclusion, the information conveyed by the multi- and P90 hereafter). model system come out to be useful with respect to its po- The two cases of Alpine orographic cyclogenesis are anal- tential operational application. In four out of the five cases ysed first. For both the events, the peak of calculated dis- analysed here, the predictions agree pretty well with the ob- charge is relatively small, about 400 m3 /s. In the event of servations. For the purposes of discharge prediction, it is 6–7 November 1999 (Fig. 12a), the ensemble mean forecast relevant to observe that a suitable alert message (warning for discharge is affected by a delay of several hours with respect three events, alarm for one case) would have been issued with to the increase of the computed streamflow, so that the ob- a sufficient lead time. Only in the case of retrograde cyclone served peak is not exactly reproduced both in terms of timing the modelling system does not predict correctly the intensity (about 6 h delay) and discharge amount (underestimation). of the event and, based on the ensemble outputs, an ordinary The range P10–P90 lies below the calculated discharge and warning would have been emitted instead of a message of only at the end of the event the ensemble mean get closer alarm. Although a few case studies do not obviously pro- to the observations and the calculated discharge is included vide a sufficient basis for general conclusions, the presented in the range of the ensemble forecast. However, from the results point to the potential of the multi-model system to user perspective, the forecast is quite good, since the event represent uncertainty on scales which are relevant for hydro- intensity is well predicted and the timing error is not crucial logical applications. with respect to the involved forecast time range (+24–48 h). In the case of 10–12 April 2005 (Fig. 12b), the streamflow main peak is more correctly reproduced: the ensemble mean 5 Conclusions underestimates the peak only slightly and shifts its occur- rence of just a few hours. Although the time evolution of the In the present work, a multi-model approach to QPF has mean discharge does not agree exactly with the observation been implemented in order to provide an ensemble of hy- (it misses the decrease between the two peaks) the computed drological forecasts and has been tested on five episodes of discharge is encompassed by the P10–P90 range for most of intense precipitation, associated to streamflow increasing of the time. Again, the hydrological forecast turns out to be different intensity. The meteorological events span three dif- useful for warning purposes. ferent weather situations generally affecting northern Apen- Then, we pass to consider the two cases of deep trough nines and bearing intense rainfall over the Reno river basin and cold front progressing eastward. For the event of 2–3 in northern Italy. The estimation of the uncertainty associ- December 2005 (Fig. 12c), the calculated flow peak is about ated with the high resolution meteorological prediction con- 850 m3 /s. The ensemble mean curve remains very close to veyed by the multi-model ensemble is then exploited by the the calculated discharge, except for a few hour delay of the meteo-hydrological modelling chain, propagating it into the ascending curve, that is not reproduced by any member of discharge forecast. the ensemble. The spread is wide, especially around the For all the analysed events, the spread of the discharge peak, and distributed almost symmetrically with respect to ensemble seems to be adequate to convey a quantification the computed curve, as a consequence of the accurate tempo- of the discharge forecast uncertainty, useful to support civil ral phase of the forecast. However, the ensemble result would protection authorities in their decisions. Indeed, the occur- leave no doubt to the decision makers to issue a flood alert, rence of the flood episodes is properly predicted with a suffi- as stressed also in the previous Section, since the P10–P90 cient lead time, the timing error being not crucial with respect Nat. Hazards Earth Syst. Sci., 8, 143–159, 2008 www.nat-hazards-earth-syst-sci.net/8/143/2008/
S. Davolio et al.: Multi-model meteo-hydrological forecasting                                                                         157

Fig. 12. Ensemble discharge forecasts (m3 /s) vs. forecast time (h) for: (a) 6–7 Nov 1999 event; (b) 10–12 April 2005 event; (c) 2–3 Dec
2005 event; (d) 21–23 Jan 2003 event; (e) 7–9 Nov 2003 event. The bold line represents the ensemble mean, while the two grey dashed
lines represent the P10 and P90 curves (see text). Red line is the discharge computed with raingauge observation, blue line is the observed
discharge.

www.nat-hazards-earth-syst-sci.net/8/143/2008/                                       Nat. Hazards Earth Syst. Sci., 8, 143–159, 2008
158                                                                S. Davolio et al.: Multi-model meteo-hydrological forecasting

to the considered forecast range, while the magnitude of the        References
events can be appropriately estimated by the decision makers
considering the ensemble results from a probabilistic point         Bacchi, B. and Ranzi, R.: Runoff and Atmospheric Processes for
of view. Therefore, the proposed coupled system seems to              Flood Hazard Forecasting and Control, Contract ENV4-CT97-
                                                                      0552, Final report, Brescia, Italy, 2000.
be promising for operational use in the prediction of flood
                                                                    Buzzi, A. and Tibaldi, S.: Cyclogenesis in the lee of the Alps: a
events and for timely warning purposes.                               case study, Q. J. Roy. Meteor. Soc., 104, 271–287, 1978.
    The hydrological response of the Reno river basin, as sim-      de Roo, A. P. J., Gouweleeuw, B., Thielen, J., Bartholmes, J.,
ulated by the TOPKAPI model, turns out to be quite sen-               Bongioannini-Cerlini, P., Todini, E., Bates, P., Horritt, M.,
sitive not only to the total precipitation amount, but also to        Hunter, N., Beven, K. J., Pappenberger, F., Heise, F., Rivin, G.,
its correct space-time localization. This aspect supports the         Hills, M., Hollingsworth, A., Holst, B., Kwadijk, J., Reggiani, P.,
usefulness of an ensemble approach which takes into account           van Dijk, M., Sattler, K., and Sprokkereef, E.: Development of
the uncertainty associated to QPF. However, the multi-model           a European Flood Forecasting System, Int. J. River Basin Man-
ensemble allows to represent only that fraction of the total          agement, 1, 49–59, 2003.
uncertainty, in the forecasting process, associated with the        Davolio, S. and Buzzi, A.: A nudging scheme for the assimilation
                                                                      of precipitation data into a mesoscale model, Weather Forecast.,
model error. This limitation could be overcome both in-
                                                                      19, 855–871, 2004.
creasing the number of ensemble members (models) or per-            Davolio, S., Buzzi, A., and Malguzzi, P.: High resolution simula-
turbing the initial and boundary conditions (Tibaldi et al.,          tions of an intense convective precipitation event, Meteorol. At-
2006). The latter procedure would generate a multi-model,             mos. Phys., 95, 139–154, 2007.
multi-analysis ensemble displaying a larger variability since       Diomede, T., Davolio, S., Marsigli, C., Miglietta, M. M.,
it takes into account also the evolution of the error associated      Moscatello, A., Papetti, P., Paccagnella, T., Buzzi, A., and Mal-
to the initial condition. This larger ensemble should improve         guzzi, P.: Discharge prediction based on multi-model precipita-
the performance of the meteo-hydrological forecasting sys-            tion forecasts, Meteorol. Atmos. Phys., in press, 2008.
tem, especially for episodes like that of 7–9 November 2003,        Ebert, C., Bàrdossy, A., and Bliefernicht, J.: Integration strategy for
in which the main source of error seems ascribable to the             ensemble predictions of a limited area model into a short-range
global model analysis/forecast, driving the high resolution           flood forecasting system, Proceedings of the CHR-Workshop –
                                                                      Expert Consultation “Ensemble prediction and uncertainties in
models. This will be the subject of future investigations.
                                                                      flood forecasting”, Bern, Switzerland, 107–108, 2006.
    Finally, it is worth noting that the obtained results might     Gebhardt, C., Theis, S., Krahe, P., and Renner, V.: Experimental en-
be also affected by the filtering operated by the hydrologi-          semble forecasts of precipitation based on a convection-resolving
cal model, whose structure affects the performances of the            model, 3rd HEPEX workshop, Book of Abstracts, European
integrated real-time flood forecasting system implemented             Commission EUR22861EN, edited by: Thielen., J., Bartholmes,
for the Reno river basin. Generally, the hydrological model           J., and Schaake, J., 54–57, 2007.
performance appears not to be fully satisfactory, being the         Gouweleeuw, B., Thielen, J., de Roo, A. P. J., and Buizza, R.:
calculated curve higher and wider than the observed one.              Flood forecasting using probabilistic weather predictions, Hy-
This overestimation can be probably ascribed to three dif-            drol. Earth Syst. Sci., 9, 87–102, 2005,
ferent factors: an inaccurate reproduction of the infiltration        http://www.hydrol-earth-syst-sci.net/9/87/2005/.
                                                                    Hamill, T., Clark, M., Schaake, J., and Buizza, R.: Second HEPEX
processes in the hydrological model, leading to an overesti-
                                                                      Workshop Summary Report, Boulder, Colorado, http://hydis8.
mation of precipitation available for runoff; the method em-          eng.uci.edu/hepex/scndwksp/HEPEX05-Summary.pdf, 2005.
ployed to spatially distribute the observed precipitation (i.e.     Hou, D., Mitchell, K., Toth, Z., Lohmann, D., and Wei, H.: Ensem-
the Thiessen Polygon method) that can cause an overestima-            ble streamflow forecasting with the coupled GFS-NOAH model-
tion of the total amount of rainfall over regions scarcely cov-       ing system, 3rd HEPEX workshop, Book of Abstracts, European
ered with raingauges; the presence of a small hydroelectric           Commission EUR22861EN, edited by: Thielen, J., Bartholmes,
reservoir, located in the upper Reno river basin, not modelled        J., and Schaake, J., 65–68, 2007.
within the TOPKAPI framework, whose impact may not be               Kain, J. S.: The Kain-Fritsch convective parameterization: an up-
negligible (Ranzi et al., 2007). For these reasons, we are            date, J. Appl. Meteorol., 43, 170–181, 2004.
planning to test different hydrological models over the Reno        Klemp, J. B., Skamarock, W. C., and Dudhia, J.: Conservative split-
river basin as well as to implement the proposed multi-model          explicit time integration methods for the compressible nonhydro-
                                                                      static equations, Mon. Weather Rev., 135, 2897–2913, 2007.
approach over different catchments.
                                                                    Koussis, A. D., Lagouvardos, K., Mazi, K., Kotroni, V., Sitzmann,
                                                                      D., Lang, J. G., Zaiss, H., Buzzi, A., and Malguzzi, P.: Flood
Acknowledgements. This work has been partly supported by the          forecasts for urban basin with integrated hydro-meteorological
project RISK AWARE, INTERREG IIIB, CADSES, by the Italian             model, J. Hydrol. Eng., 8, 1–11, 2003.
National Civil Protection in the framework of the MOD-MET           Krzysztofowicz, R.: Bayesian theory of probabilistic forecasting
Project and by the project PROSCENIO coordinated by CIMA.             via deterministic hydrologic model, Water Resour. Res., 35(9),
                                                                      2739–2750, 1999.
Edited by: L. Ferraris                                              Krzysztofowicz, R.: The case for probabilistic forecasting in hy-
Reviewed by: M.-C. Llasat and another anonymous referee               drology, J. Hydrol., 249, 2–9, 2001.

Nat. Hazards Earth Syst. Sci., 8, 143–159, 2008                                   www.nat-hazards-earth-syst-sci.net/8/143/2008/
You can also read