Financial Modelling Strategies for Social Life Cycle Assessment: A Project Appraisal of Biodiesel Production and Sustainability in Newfoundland ...
←
→
Page content transcription
If your browser does not render page correctly, please read the page content below
sustainability

Article
Financial Modelling Strategies for Social Life Cycle
Assessment: A Project Appraisal of Biodiesel
Production and Sustainability in Newfoundland and
Labrador, Canada
Zaman Sajid 1, *        and Nicholas Lynch 2
 1    Department of Process Engineering, Faculty of Engineering & Applied Science, Memorial University of
      Newfoundland, St. John’s, NL A1B 3X5, Canada
 2    Department of Geography, Faculty of Humanities & Social Science, Memorial University of Newfoundland,
      St. John’s, NL A1B 3X5, Canada; nicholas.lynch@mun.ca
 *    Correspondence: zaman.sajid@mun.ca; Tel.: +1-709-765-8844

 Received: 17 July 2018; Accepted: 13 September 2018; Published: 14 September 2018

 Abstract: Social Life Cycle Assessment (S-LCA) is a rapidly evolving social impact assessment tool
 that allows users to identify the social impacts of products along with their life cycles. In recent years,
 S-LCA methodologies have been increasingly applied to energy systems and resources with notable
 success yet with limited reliability and even less flexibility or geographic specificity. In response,
 this study develops a novel assessment tool, named the GreenZee model, to reflect the social impacts
 of products and their sustainability using local currency units. The model is developed through
 evaluating both qualitative and quantitative inputs that capture the perceived monetary value of
 social impacts. To demonstrate the operationalization of the model, we explore a hypothetical case
 study of the biodiesel industry in Newfoundland and Labrador (NL), Canada. Results indicate that
 biodiesel production in NL would have positive socio-cultural impacts, high cultural values, and
 would create employment opportunities for locals. Overall, the GreenZee model provides users
 with a relatively simple approach to translate a variety of qualitative and quantitative social impact
 inputs (as importance levels) into meaningful and understandable financial outputs (as strength
 levels). We argue that building and testing models such as the GreenZee are crucial to supporting
 more flexible approaches to life cycle assessments that need to address increasingly complex social
 categories, cultural values, and geographic specificity.

 Keywords: impact assessment; social impacts; biofuel; life cycle assessment; energy

1. Introduction
     In recent years, social life cycle assessment (S-LCA) has gained popularity as a viable
decision-making tool for achieving more inclusive and comprehensive sustainability standards [1–3].
An increasing number of industry leaders, public/non-profit stakeholders, and private manufacturers
have applied a range of S-LCA methodologies to not only identify socioeconomic aspects along
product life cycles, but also to “tell the story of social conditions in the production, use, and disposal of
products” [4–7]. In recent years, applications of S-LCA have targeted energy products and industries,
especially those related to alternative fuels, such as palm oil, biodiesel, and other bio-based value
chains [6,8–10]. Importantly, however, as S-LCA is a quickly evolving practice it remains under
considerable, yet nonetheless supportive, scrutiny as it moves beyond its initial methods [11–13].
In this paper, we explore the role and viability of financial models as a means of offering more flexible
approaches to life cycle assessments that increasingly incorporate complex social and cultural values.

Sustainability 2018, 10, 3289; doi:10.3390/su10093289                     www.mdpi.com/journal/sustainability
Sustainability 2018, 10, 3289 2 of 19
As outlined elsewhere [14,15], there exist a number of challenges relating to the methodological
approaches and operationalization of S-LCA. Some of the most pressing issues, for instance, involve
systematizing fundamental practices of S-LCA, such as harmonizing the selection of indicators and
streamlining S-LCA methodologies to established LCA approaches [16]. Likewise, attention to the
availability and geographic variability of complex social data and the consideration of the challenges
inherent in the compatibility between qualitative and quantitative assessment methods in any S-LCA
study are of considerable debate [17,18].
With these issues in mind, the focus of much academic literature in S-LCA remains centered on the
wide-scale applicability of S-LCA [9,10,19–22], and a number of attempts have been made to flesh out
a general yet functional S-LCA tool similar to those available for environmental life cycle assessments
(E-LCA) [23]. However, a number of S-LCA approaches use techniques, such as Likert or color
scales, to gauge social implications of a range of products under study [6,24–27] and are vulnerable to
uncertainties due, in part, to their general incompatibility with quantitative measurements.
Considering these ongoing challenges, in this paper we develop and test a unique S-LCA tool,
which we have called the GreenZee model. Using a software-based framework, the GreenZee model is
the first tool of its kind to offer clear a financial output of the social impacts of products along their
lifecycle. Specifically, the model employs a detailed technical framework adapted from established
S-LCA guidelines [1] and translates a variety of quantitative inputs, such as ‘importance levels’ of social
impact categories and their sub-categories, into financial (i.e., monetary) outputs, otherwise represented
as ‘strengths’ of social impact categories and their sub-categories. To test the operationalization of
the model, we explore a hypothetical case study of the biodiesel industry in Newfoundland, Canada.
While this represents a single perspective, in practice, the GreenZee model represents an important step
forward in building a tool that can widen S-LCA to other energy systems and industrial sectors and in
a variety of geographical contexts. While potentially offering a practical tool for life-cycle practitioners,
the GreenZee model also represents an important theoretical approach for S-LCA researchers to explore
and test alternative applications that are needed in this emerging field.
The paper is structured as follows. First, we begin with a brief discussion of the trajectory of recent
S-LCA approaches. Second, we outline the central methodological approaches of the GreenZee model.
Here, we define the model’s four phases: (i) the definitions of the goal and scope of the study; (ii) the
life cycle inventory analysis; (iii) the life cycle impact assessment; and (iv) the life cycle interpretation.
Third, we test the GreenZee model through a case study of biodiesel production in the context of
Newfoundland and Labrador, Canada. Fourth, we consider several methodological challenges and
explore key questions concerning the implementation and practical applications of the GreenZee
model in the biodiesel sector and beyond. Conclusions are drawn in the final section.
Geographies of Social Life Cycle Assessment
The relatively rapid development of S-LCA approaches in the last decade has resulted in a rich
literature and useful methodological debate. The widening range of case studies included in S-LCA
experimentation speaks directly to the growing awareness and possibilities of social analyses as
important life cycle assessment foci. At present, prominent S-LCA case studies and product prototypes
include fertilizers [28]; food [7,29]; electronics and electronic wastes [30–32]; construction materials [33];
and biofuels and bio-based value chains [6,9]. Recent S-LCA case studies that highlight biofuels,
such as‘palm oil, speak to the growing interest in assessing the (social) sustainability of alternative fuels
given their relatively rapid adoption in the face of climate change and global inequality. In particular,
many of these studies pinpoint social ‘hotspots’ in energy and fuel system production (e.g., exploitative
labor relations, alienation, and other negative impacts on the well-being of local communities) that are
in significant need of re-evaluation and change if social equity and sustainability continue as societal
priorities [9,10,34–36].
Although the level of interest in S-LCA continues to climb and a plethora of approaches test its
methodological boundaries, a standard S-LCA method is yet to be defined. The emerging S-LCASustainability 2018, 10, 3289 3 of 19
literature is replete with discussions about the challenges of methodological rigor and standardization,
and most identify data context, collection, and interpretation as central obstacles [3,14,17,18,37–39].
As Chen and Holden [40] argue, issues of context encumber our ability to develop a general S-LCA
that is geographically sensitive and capable of integrating location-specific data. In this case, there is
no one-size-fits-all for system modelling as economic, cultural, and political differences between scales
or locations (e.g., nations, regions, sectors) can vary dramatically. Indeed, a ‘geography of S-LCA’
highlights both an inherent variability in context and temporality in life-cycle research and the need for
methodological flexibility to meet changing spatial and temporal resolutions [40,41]. Yet, as has been
pointed out [3,14,30], access to sensitive data that pinpoint social impacts at more local scales—and
which potentially highlight critical socio-ethical hotspots—is extremely limited.
Besides context, varying approaches to data collection also represent a continuing challenge to
a standard S-LCA method and application. Indeed, data collection techniques have ranged widely and
include aggregated national data [30]; data derived from in-depth interviews with key informants [42];
dichotomous questionnaires (e.g., yes/no) [43] and Likert scales [6] that survey stakeholder opinions
and attitudes; and mixed methods and multi-criteria analyses [44]. In the case of research approaches
that use Likert scales, data interpretation is particularly limited as complex subjective phenomena
may not be aptly described using the limited wording of a descriptive approach [45]. In addition,
a participant may experience confusion when there are too many response categories to choose from
or too few categories that fully capture participants’ experiences, opinions, or intents [46]. Lastly,
Svensson [47] argues that the sum scores used in Likert methods may result in incorrect results
since, in the case of social assessments that use dichotomous classifications, there are many ongoing
challenges with the validity and reliability of research questionnaires developed for dichotomous
scales and their corresponding results. With dichotomous scales there remain challenges of ambiguity
and the potential for multiple values which cannot be uncovered simply by a pair of criteria [48].
Considering these and other ongoing limitations in S-LCA approaches, we explore the GreenZee
model as an alternative to current techniques. In particular, we argue that while the leading S-LCA
approaches offer valuable steps toward evaluating social criteria, other methods, such as those that
focus on qualitative financial inputs and outputs, contribute enhanced flexibility, robustness, and
sensitivity to the complex geographies of social values.
2. Materials and Methods
Our central objective is to develop a simple yet practical S-LCA methodology. In so doing,
we base our approach on internationally accepted and standardized principles of S-LCA developed
in the guidelines and criteria presented in the “Social Life Cycle Assessment of Products” and
compiled by the Society of Environmental Toxicology and Chemistry (SETAC) under the United
Nations Environmental Programme (UNEP) [1]. The aim of the UNEP S-LCA approach is to formalize
the analyses and assessments of the social impacts of a product over its life cycle. This analysis
is closely related to established LCA approaches as they offer the most well-defined and globally
understood methodologies for analyzing the environmental impacts of products. Following LCA and
the SETAC-UNEP approaches, the GreenZee model includes the goal and scope of the study, an S-LCA
data inventory, an impact assessment, and an interpretation of the results. The comparability and
reliability of the model is contingent on the level of variability or uncertainty of the input data [49].
Keeping this aspect in mind, the GreenZee model is developed through a deterministic rather than
stochastic approach (i.e., probability distributions) as it excludes randomness in the decision-making
process and strengthens the overall reliability of the model.
In this section, we outline the GreenZee model through an evaluation and consideration of each
of the S-LCA attributes. The technical framework of the methodology is presented in Figure 1.Sustainability 2018,
Sustainability 10,10,
2018, x FOR
3289PEER REVIEW 4 of 19 19
4 of
Product under study
Impact Category (IC) Sub-impact Category
screening SLCA
(SC) screening
guidelines
Monetary Strength of IC Monetary strength of SC
(Ai) (Bi)
Overall Strength = Ai x
Bi
Monetary expectations Monetary perceptions
GreenZee Score
+$ $0 -$
Legends:
+$
Fixed inputs/outputs Positive GreenZee Score
Variable inputs/outputs
-$
Negative GreenZee Score
Society
Monetary value assigned by Calculated monetary output
society
Figure 1. The GreenZee Model: Technical Framework. S-LCA, social life cycle assessment.
2.1. Phase 1: Definition of the Goal and Scope of the Study
Figure 1. The GreenZee Model: Technical Framework. S-LCA, social life cycle assessment.
According to the SETAC guidelines, the identification and definition of the goal and the scope of
2.1.the
Phase 1: Definition
study of the Goal steps
are the preliminary and Scope of the Studyany S-LCA. While the goal describes the intended
to performing
applications
Accordingtotoperform
the SETACthe study, the scope
guidelines, defines the depth
the identification and and breadthofofthe
definition thegoal
study
and[1]. We
the follow
scope
of the study are the preliminary steps to performing any S-LCA. While the goal describes the intendedthe
the SETAC guidelines to describe Phase 1 of the GreenZee methodology and to define the goal and
scope of the
applications to study.
performInthe
following thescope
study, the SETAC rationale,
defines we first
the depth and define
breadtha clear statement
of the study [1].specifying
We followthe
objective of the study for the GreenZee model. In particular, this is the use
the SETAC guidelines to describe Phase 1 of the GreenZee methodology and to define the goal and of the products/services
thewith
scopedefined
of theparameters. For example,
study. In following the objective
the SETAC of the
rationale, we study could abeclear
first define the S-LCA
statementof biodiesel
specifying [50].
In theofnext
the objective step, for
the study wethe
define the scope
GreenZee model.of In
the study and
particular, thisinclude a definition
is the use of the function
of the products/services
(i.e., the performance characteristics) and the functional unit (i.e., the bases
with defined parameters. For example, the objective of the study could be the S-LCA of biodiesel on which the study
[50]. is
performed)
In the nextofstep,
the product/service.
we define the scope In the casestudy
of the of biodiesel,
and includethe function is the
a definition of use of the biodiesel
the function (i.e.,
the performance characteristics) and the functional unit (i.e., the bases on which the biodiesel
as an alternate fuel to petroleum-based diesel fuels. Relative to petroleum-based fuels, study is is
performed) of the product/service. In the case of biodiesel, the function is the use of the biodiesel asSustainability 2018, 10, 3289 5 of 19
considered as ‘environmentally friendly’ with significantly less adverse environmental impacts [51].
Switching to biofuels is therefore being increasingly argued as a path to more cleaner environments
and healthier societies.
In this study, the functional unit is the social impact of producing and using 1 kg of biodiesel.
Typically, the size of a production unit is dependent on the requisite quantity of a product that one
intends to produce. A large production unit (typically over millions of tons) will produce large
volumes of a product [51], and therefore such huge quantities of products could have high social
impacts (either positive or negative) on society, while the opposite is also true. Hence, the functional
unit can be defined as the amount of product to be produced. It is clear, however, that using such
a simple definition means that the functional unit is both complex and dynamic in nature.
It is important to note that in defining the scope of the study, care should be taken to delineate the
study boundaries. If we consider again the example of biodiesel, we must acknowledge that biodiesel
is composed of a variety of chemical components and is produced through a series of complex chemical
reactions. In defining the system boundary for biodiesel production, we choose to include the social
implications of input streams (e.g., chemical inputs and utilities) and the biodiesel production process,
including its output streams. Since each chemical and utility in the input streams will have their own
S-LCA, their respective social implications are ignored and thus are excluded from the scope of the
current case study.
Recent treatments of S-LCA methodologies by life-cycle experts argue that the focus of S-LCA
studies should centre on the processes of product development [52]. Yet, as S-LCA practices have
evolved, others have argued that it is a firm’s ‘conduct’ (e.g., corporate social responsibility) that
should be the focus of the S-LCA approach [19,21,53,54]. With a focus on the process of product
development, limitations arise as distinct products are made from a wide range of raw materials that
can also be the products of other processes. Performing an S-LCA study on a single product process
therefore does not result in a complete and reproducible social impact study for all products. A focus
on the firm’s conduct, for instance, could ‘mislead’ the results since it is logistically challenging to
disentangle the complex assemblage of inputs and contributions of each product, especially in the case
where a firm/producer is involved in manufacturing more than one product.
In recognizing these limitations, the GreenZee model draws a clear system boundary around
product life-cycle stages and assesses the social implications of products on communities, or indeed
society, associated with each step by performing an S-LCA study on each individual stage. In this case,
there is a need to consider the raw materials of each product stage and how their associated social
implications should be included in the boundary definitions, unless their monetary values (refer to the
assessment section, Phase 3) are not considered a significant contribution. In situations where there
are too many products/processes (e.g., a petroleum refinery produces dozen of products at one time),
a system boundary should be defined by considering those products/processes for which there could
be considerable social and socio-economic impacts (positive or negative) as identified by stakeholders.
2.2. Phase 2: Life Cycle Inventory Analysis
In the life-cycle inventory phase of the GreenZee model, we first define the ‘social activity variables’
needed for the S-LCA study (see Figure 2). A key aspect of the GreenZee framework is its flexibility
and generalizability as an S-LCA model and its applicability to a wide range of products and services.
In this case, social activity variables are defined as a list of impact categories and subcategories.
In order to meet the requirements of a comprehensive inventory analysis, a detailed literature
review and survey is performed to develop an exhaustive database of possible social activity variables
associated with various products/services. In this case, we compile all of the legitimate activity
variables into the GreenZee model. These variables have been identified and highlighted across the
S-LCA studies in the literature [5–7,24,26,30,43,55].Sustainability 2018, 10, x FOR PEER REVIEW 6 of 19
Sustainability 2018, 10, 3289 6 of 19
2.3. Phase 3: Life Cycle Impact Assessment
2.3. Phase
As with3: Life
allCycle
LCAImpact Assessment
studies, the impact assessment, including a detailed LCA inventory and
thorough
As with deterministic
all LCA studies,modelling,
the impact represents
assessment, the including
most important
a detailedphase. The GreenZee
LCA inventory model
and thorough
consists of twomodelling,
deterministic novel steps: first, it assigns
represents the mostmonetary
important importance
phase. The levels to impact
GreenZee categories
model consistsand ofsub-
two
impact categories; and, second, it assigns ‘real’ money values to expectations
novel steps: first, it assigns monetary importance levels to impact categories and sub-impact categories; and perceptions in sub-
impact categories.
and, second, it assigns ‘real’ money values to expectations and perceptions in sub-impact categories.
As presented
presented in Figure 1, the first step in life-cycle impact assessment involves choosing the
social activity variables from the GreenZee model that are considered considered relevant
relevant toto the
the product/service
product/service
under
under consideration.
consideration.For Forexample,
example,if if wewe were
were to to
evaluate
evaluate thethe
human
human rights category
rights categoryconcerning
concerning the
case of biodiesel
the case of biodiesel then a child-labour-free
then a child-labour-free workplace
workplace and
andadequate
adequateworkingworkinghourshoursareare considered
important
important aspects
aspects to to the
the study. These variables are then incorporated incorporated into a comprehensive S-LCA S-LCA
of biodiesel. It It is worth mentioning
mentioning here that for simplicity purposes, the interdependencies among
social variables
variablesininthethe GreenZee
GreenZee model model areconsidered.
are not not considered.However,However,
there arethere are methodologies
methodologies available
available in the literature
in the literature [56,57]
[56,57] that study that
thestudy the interdependencies
interdependencies of variablesof variables
and can and can be integrated
be integrated into the
into the GreenZee
GreenZee model. model.
The
The identification
identification and andselection
selectionofofstakeholders
stakeholdersis is a crucial
a crucial step in assessing
step in assessing S-LCA using
S-LCA the
using
GreenZee
the GreenZee model. Stakeholders
model. are defined
Stakeholders as individuals
are defined or groupsorthat
as individuals may be
groups thataffected
may be byaffected
or may
affect
by or product/service at each stage
may affect product/service at of a product’s
each stage of alife cycle. Stakeholders
product’s include employees,
life cycle. Stakeholders include
government and non-government
employees, government organizations
and non-government related torelated
organizations the specific product/service
to the specific under
product/service
consideration,
under consideration,value chain
value actors, and local
chain actors, andcommunity
local community members. To have
members. a balanced
To have approach,
a balanced it is
approach,
recommended to have equal number of participants for each stakeholder
it is recommended to have equal number of participants for each stakeholder category and efforts category and efforts should
be made
should benot
made to not
include the participants
to include the participants having conflicts
having of interest
conflicts of interest either
eitherin inthe
thestudy
studyor or the
product/services
product/servicesunder underconsideration
consideration(more (moredetail
detailon onthis
this process
process is is available
available in in the
the following
following case
study
study section).
section).Stakeholders
Stakeholdersare areinterviewed
interviewedusing using questionnaires.
questionnaires. These
Thesequestionnaires
questionnaires areare
based
basedon
the
on thesocial activity
social activityvariables
variables chosen
chosenfor forthe
theproduct/service
product/serviceunder understudy.
study. The
The scoring
scoring approach
consists of assigning the monetary
consists of assigning the monetary values to eachvalues to each social activity variable
activity variable by the stakeholders
stakeholders in the
study. The scores represent the monetary importance level assigned to impact categories, sub-impact
categories, expectations, and perceptions. The The monetary
monetary scoresscores are
are assigned by reporting how much
stakeholders are willing to pay for the product/process
product/process or service in
or service in terms
terms ofof their
theirlocal
local currency.
currency. This
This
identifies
identifies the how important or unimportant that category is for related related stakeholders.
stakeholders. The lowest
possible bound is zero, an upper bound is pre-defined by mutual mutual consent
consent between
between the the stakeholders,
stakeholders,
and thethescoring
scoringshould
should be made between the lower and pre-defined upper
be made between the lower and pre-defined upper bounds. Figure 2 highlights bounds. Figure 2
highlights
an examplean example
whereby whereby
a biodiesel a biodiesel
consumer in theconsumer
United Statesin the United
is asked how States
muchisimportance,
asked howdefined much
importance, defined in USD ($), he/she gives
in USD ($), he/she gives to a child-labour-free workplace. to a child-labour-free workplace.
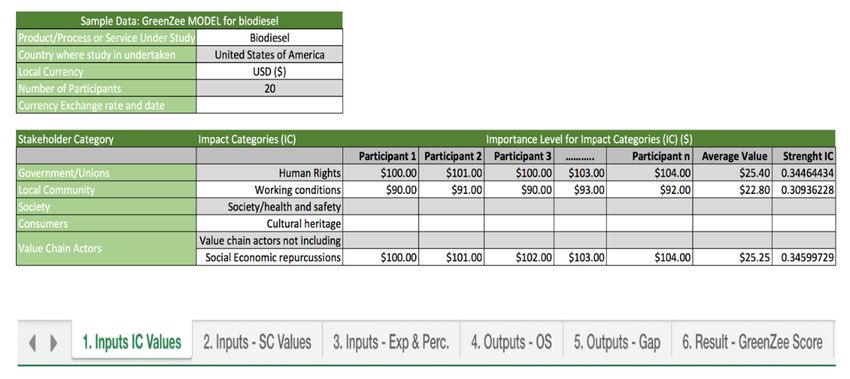
Figure 2.
Figure Example of
2. Example of GreenZee
GreenZee Model
Model Worksheets
Worksheets for
for Biodiesel
Biodiesel (See
(See Model
Model in
in Supplementary
Supplementary
Materials).
Materials).Sustainability 2018, 10, 3289 7 of 19
In Figure 2, there are six background worksheets consisting of three inputs, two outputs, and
a results worksheet. The inputs are the variables generated from the questionnaires for impact
categories (shown in Figure 2) and sub-impact categories and consumers’ expectations and perceptions
(second and third worksheet, respectively, not shown in Figure 2). In practice, the GreenZee user
populates the values in the ‘inputs’ worksheets, while the built-in code in MS Excel calculates ‘outputs’
(presented in the outputs worksheet) and generates the final ‘result’, otherwise called the GreenZee
score (see Section 2.3). The ‘Input—IC values’ worksheet (shown in Figure 2) is completed for our
biodiesel example. For this sample, we assume that the biodiesel product is made and consumed in
the United States and hence ‘currency exchange rate and date’ is ‘not applicable (N/A)’. The scores for
two impact categories are random inputs.
The GreenZee model allows more than one stakeholder to assign a monetary value to one social
activity variable. As a result, the final output is a “strength” reported for each variable. The variable’s
strength is the average monetary value for each category, ‘impact category’ (IC) and strength
subcategory (SC), of individual ICs and SCs and is computed using Equations (1) and (2), respectively.
AVmi = ∑Ami/N
where
AVmi represents an average value for an individual social variable i assigned by m participants;
Ami shows the monetary importance level allocated to i by m participant; and
N denotes total number of participants in the study.
The strength of an individual social variable is computed as follows:
Strength ICi = AVmi/∑ AVni (1)
where n is the number of social variables or impact categories.
Using a similar mode of calculation, the strength of a sub-category (SC) is calculated as below:
Strength SCi = AVmi/∑ AVni. (2)
Here, i represents an individual social variable for a sub-category (SC), and n is the number of
social variables of the sub-category under consideration.
The overall strength (OS), based on IC and SC, is then calculated by taking an algebraic product
of strength IC and strength SC as shown in the equation below and represented in Figure 1.
Overall strength OS(i) = (Strength ICi) × (Strength SCi)
In the second step, stakeholders assign money values to the expectations and perceptions of each
social activity variable filtered in Phase 2. The questionnaires are designed to collect stakeholders’
expectations, based on their role, about social aspects of the product under consideration. For example,
stakeholders could be asked: ‘how important or unimportant is it to make a product, such as biodiesel,
in an organization which is child-labour-free’? Given our focus on developing monetary values that can
be compared, we ask stakeholders to assign dollar values to their answers. In other words, stakeholders’
expectations are translated in dollar terms. A financial weightage of expectation (shown in Equation
(3)) is then calculated by taking the average of the monetary expectation of the respective social activity
variables as given by the following equation:
AEmi = ∑Ami/N
where AE mi represents the average value of expectations allocated by m participants to an individual
social variable i in the expectation category.Sustainability 2018, 10, 3289 8 of 19
Ami denotes the monetary value allocated to i by m participant
Weightage of expectation (i) = AEmi/∑ AEni. (3)
Similarly, the social perception is assessed by designing the questions based on stakeholders’
perceptions. Stakeholders are asked to re-assign a monetary value to the product based on the actual
state of social aspects. In this case, stakeholders could be asked: ‘according to your experience, how do
you perceive the current practices of product manufacturing with respect to being child-labour-free?’
A financial weightage of perception is then calculated by taking the average of the monetary perception
for each social activity variable. The monetary gap is then calculated by subtracting the average of the
monetary expectation from the average of the monetary perception for the respective social activity
variables as shown in the equation below:
Monetary gap (i) ($) = Weightage of perception (i) ($) − Weightage of expectation (i) ($).
The equation above is represented in USD currency units; however, the model can also be
replicated in any local currency. This unique aspect of the GreenZee model encourages the use of
S-LCA methods across contexts and geographies.
Both the GreenZee model and the methodology explained in this phase are automated in MS
Excel. The user only needs to input monetary values and the model will compute the average monetary
values and financial weightage values of both expectation and perception.
2.4. Phase 4: Life Cycle Interpretation
The outputs from the analysis in Phase 3 are used to compute the final GreenZee score.
The GreenZee score represents the financial sum product of the corresponding monetary values
of overall strength and the monetary gap computed in Phase 3. The mathematical model to compute
the GreeZee score is the following:
GreenZee Score = (Overall strength OS(i)) × (Monetary gap (i)).
All three quantities are reported in terms of currency units (dollars in our case). In MS Excel, the
GreenZee score is represented as: GreenZee Score ($) = SUMPRODUCT (array 1, array 2), where array
1 and array 2 denote the corresponding ranges of the OS and the Monetary gap. The function
SUMPRODUCT shows the sum of the products of the corresponding ranges or arrays.
There are three aspects associated with a GreenZee score: the sign (positive or negative),
the numeric value, and the currency units. With respect to the sign and the numeric values, there
are three significant outcomes that may occur, and each has a distinct interpretation. First, a positive
GreenZee score represents a positive social impact of the product/service on society; second, a negative
score represents a negative social impact of the product/service on society; and third and last, a zero
GreenZee score represents no effect on society.
While comparing the S-LCA of two or more different products/services, the GreenZee decision
scale, represented in Figure 3, can be used to understand and compare multiple S-LCAs. Referring
to Figure 3, there are three possible outcomes and interpretations of the GreenZee score. First, if two
or more products/services receive positive scores then the product/service with the higher positive
score (i.e., the higher numeric value) has the higher social impacts. Referring to Figure 3, a product
with a GreenZee score at point A has a higher positive S-LCA than a product at point B. Similarly,
if two or more products/services have negative scores the product/service with the lower negative
score (i.e., the lower numeric value) is determined to have less social impacts through its S-LCA
study. Referring to Figure 3, a product with a GreenZee score at point C has fewer social impacts than
a product having a GreenZee score at point D.Sustainability 2018, 10, 3289 9 of 19
Second, if one product/service has a positive score and another has a negative score then the
product/service with the positive score is considered as a ‘better’ overall product/service for the
society. In Figure 3, this situation can be presented by comparing positive scores holders (A and B) with
negative scores holders (C and D). In this case, products with positive scores holders (A and B) are better
to use than those with negative scores holders (C and D). In another instance, if one product/service
has a positive score and another has a zero score then the product with the positive score is considered
‘better’ for 2018,
Sustainability society
10, xwhile the product/service
FOR PEER REVIEW with a zero score has no impact on society. Finally, 9ifofthe
19
product/service has a negative score and another has a zero score then the product with a zero score
from economic‘better’
is considered and environmental LCA,
for society and while a product
is contingent withpositive
upon the a negative scorefrom
impacts results in negative
economic and
impacts on society.
environmental LCA, while a product with a negative score results in negative impacts on society.
D A
C B
0
- +
Figure 3.
Figure The GreenZee
3. The GreenZee Model
Model Decision
Decision Scale.
Scale.
2.5. Application: Testing the GreenZee Model: The Case of Biodiesel Production
2.5. Application: Testing the GreenZee Model: The Case of Biodiesel Production
In this section, we operationalize and test the GreenZee model using a local case study of biodiesel
In
productionthisinsection, we operationalize
Newfoundland and Labradorand(NL),
test athe GreenZee
Canadian modelwith
province using a local case study
a well-established of
oil and
biodiesel
gas sector.production
Recently, the in province
Newfoundland and Labrador
has invested in biodiesel(NL), a Canadian
production province
and biofuel with a well-
infrastructure as
established
a key strategy toward building a diversified and ‘greener’ energy profile. Although plans and
oil and gas sector. Recently, the province has invested in biodiesel production biofuel
for the first
infrastructure
biodiesel facility as have
a keymet strategy
with toward building
uncertainty, a diversified
increasing and ‘greener’
investments energy
in the region areprofile.
expected Although
to pave
plans
the way forfor
the first biodiesel
biodiesel production facility have
plants met withwith
co-located uncertainty, increasing
lumber facilities investments
already in the region
in place throughout the
are expected
province [58].toProponents
pave the way for biodiesel
of bio-based production
energy plants co-located
have increasingly fought for with lumber facilities
biorefineries already
in the province
in place throughout
particularly the province
as this sector [58].new
represents Proponents of bio-based
opportunities duringenergy
a period have increasingly fought
of considerable downturn for
biorefineries in the province particularly as this sector represents new opportunities
in the conventional oil economy. For our purposes, the biodiesel industry in NL represents a useful during a period
of
andconsiderable
important sectordownturn in the conventional
for exploring oil economy.
S-LCA. Overall, For our
proponents purposes,
claim the biodiesel
that a locally industry
based biodiesel
in NL represents
industry is crucialatouseful and provincial
building importantinnovation,
sector for exploring
providingS-LCA. Overall,
for skilled proponents
employment claim that
opportunities,
aenabling
locally based biodiesel industry is crucial to building provincial innovation, providing
rural development and agricultural transition (e.g., from small-scale to large-scale farming), for skilled
employment opportunities, enabling rural development and agricultural
and fulfilling soaring consumer energy demands [59–61]. Employment, for instance, represents transition (e.g., from small-an
scale to large-scale
important farming),
socio-economic and fulfilling
argument soaring
as skilled andconsumer
relativelyenergy demands
high-paid work[59–61]. Employment,
is required across the
for instance,
biodiesel represents
value chain, from an important
the productionsocio-economic argumentand
of biomass feedstock as skilled
chemical and relativelyof
conversion high-paid
biomass
work is required across the biodiesel value chain, from the production of biomass feedstock and
into biodiesel at the industrial level to the end-user supply chain. In addition, the development of
chemical conversion of biomass into biodiesel at the industrial level to the end-user supply chain. In
‘marginal’ and rural land to grow biomass feedstock and the potential to scale up the agriculture
addition, the development of ‘marginal’ and rural land to grow biomass feedstock and the potential
industry through biofuel production represent possible ‘game changers’ for the province. So too, the
to scale up the agriculture industry through biofuel production represent possible ‘game changers’
production of biodiesel would help to meet local and global demands both for alternative forms of
for the province. So too, the production of biodiesel would help to meet local and global demands
bioenergy and energy products that meet new environmental standards.
both for alternative forms of bioenergy and energy products that meet new environmental standards.
In recent years, as the value of biofuels has risen across NL and Canada, our understanding
In recent years, as the value of biofuels has risen across NL and Canada, our understanding of
of the economic, environmental, and especially social impacts remains limited [62–65]. To address
the economic, environmental, and especially social impacts remains limited [62–65]. To address this,
this, in this section we consider NL’s biodiesel industry as a case study to both assess the strengths
in this section we consider NL’s biodiesel industry as a case study to both assess the strengths and
and weaknesses of the GreenZee model and to build more transferable S-LCA approaches across
weaknesses of the GreenZee model and to build more transferable S-LCA approaches across varying
geographies and sectors. The scope of this case study covers all stages of biodiesel production,
including: the production and transportation of biomass raw materials (i.e., wood by-products); the
local refinement of biodiesel fuel in NL; the transportation of consumable biofuel to local gas stations;
and, finally, the consumption of biofuel within the province by local consumers.Sustainability 2018, 10, 3289 10 of 19
varying geographies and sectors. The scope of this case study covers all stages of biodiesel production,
including: the production and transportation of biomass raw materials (i.e., wood by-products);
the local refinement of biodiesel fuel in NL; the transportation of consumable biofuel to local gas
stations; and, finally, the consumption of biofuel within the province by local consumers.
To simplify, we assume that all of the key production processes are performed within the province
and there is no import of any material from outside NL. Furthermore, the inputs for the GreenZee
model are based on expert opinions, and we define experts as individuals who have an extensive
knowledge and understanding of the policy issues in biofuel. In this case study, experts are chosen
strategically so as to not have any conflicts of interest for the product under consideration. For example,
owners of local petroleum businesses would not be included in the study since the development of
a biofuel (or any alternate fuels to petroleum) may impact their business and the responses could bias
the results. Considering this issue, experts with wide-ranging backgrounds but who have knowledge
of the industry are selected. This list can include, for instance, experts from government agencies,
community leaders, academia, and non-governmental organizations (NGOs). When possible, and
in order to reduce bias, it is also important to obtain an equal representation of participants from
varied backgrounds.
To test the operationalization of the GreenZee model, we selected two local experts from academic
institutions to provide inputs. These experts were selected based on their extensive knowledge of the
local oil and gas industry and their insights into the social implications of the biofuel sector in NL.
In this hypothetical application, we average the participants’ scores to show the computational steps
of the GreenZee model.
The analysis follows through three steps. In step one, the participants shortlist the social factors
(i.e., impact categories and their associated subcategories) that they deem to be the most relevant to
the social sustainability of biodiesel. The shortlisted impact categories include: human rights, working
conditions, social/health and safety, cultural heritage, and socio-economic repercussions (Table 1).
In step two, the participants choose three sub-impact categories for each of the impact categories
selected in step one (Table 1). To simplify the calculations and their presentation, both impact categories
and subcategories are assigned abbreviations (e.g., Human rights (HR); a child-labour-free workplace
(HR1); and so on).
Table 1. List of Impact Categories and Sub-Impact Categories used in the analysis.
Impact Categories (IC) Sub-Impact Categories (SC)
A child-labour-free workplace (HR1)
Human rights (HR) Equal opportunities (no discrimination due to
gender/colour/race/religion/origin of birth) (HR2)
Fair salary/wages (HR3)
Minimum wages set according to legal framework (WC1)
Working Conditions (WC) Safe work environment (WC2)
Appropriate working equipment/tools (WC3)
Importance of sustainability issues (HS1)
Society/health and safety (HS) Economic growth and development (including reduction in
unemployment) (HS2)
Use of environmentally friendly (green) products in technology
upgrades (HS3)
Respect for people of faith (CH1)
Cultural Heritage (CH) Cultural diversity (CH2)
Consumer satisfaction practices (CH3)
Benefits for an employee’s family (SR1)
Socio-economic Repercussions (SR) Mental health (SR2)
Pollution level in workplace (SR3)
In step three, the participants complete questionnaires and offer ratings based on Table 1.
For example, to score the importance level for human rights (as shown in Table 2), participants
were asked how much monetary importance they give to human rights. The remaining questionnaires
are developed in the same fashion. In this case, participants provide their scores or ratings in localSustainability 2018, 10, 3289 11 of 19
currency (i.e., CDN) in four rounds of questionnaires. In the first round, the participants assign
a monetary value (or, importance level) to each impact category. While the minimum monetary
value assigned can be $0, there is no maximum monetary limit. However, in order to avoid wide
differences in responses, including ‘wild guesses’, participants mutually decide on a ‘floor limit’;
for instance, a score can have mutually decided parameters of $0 to $100. In this case, $0 would
represent the minimum score and $100 as the absolute maximum score, and the participants can assign
a score between these two extremes. Alternatively, experts can decide on a monetary value, otherwise
understood as a ‘reference value’, and can assign values around the reference value (either higher
or lower than reference value) based on their individual opinions. In this study, experts used the
second approach.
3. Results
In this section, we show the results of the case study, where the results of monetary strength of
impact categories (shown in Table 1) are presented in Table 2. As shown in Table 2, the first participant
assigned the human rights IC a value of $300 and the second participant assigned a higher value of $310.
The resulting calculation (third column of Table 2) is the arithmetic mean of these two participants’
score for same category. The resulting ‘strength’ of the IC is calculated using Equation (1).
Table 2. Monetary Strength of Impact Categories.
Impact Categories (IC) Importance Level for Impact Categories ($)
Participant 1 ($) Participant 2 ($) Average Value ($) Strength IC
Human rights (HR) 300 310 305.00 0.257
Working conditions (WC) 240 250 245.00 0.207
Society/health and safety (HS) 245 240 242.50 0.205
Cultural heritage (CH) 200 240 220.00 0.186
Socioeconomic repercussions (SR) 180 165 172.50 0.146
Σ = 1185.00 Σ=1
In the second round, the participants assign a monetary value (or importance level) to their
shortlisted sub-impact categories in Table 1 (the results of participants’ inputs are shown in Table 3;
where the ‘strength’ of the SC is computed using Equation (2)).
Table 3. Monetary Strength of Sub-Impact Categories.
Sub-Impact
Impact Categories Importance Level for Sub-Impact Categories
Categories (SC)
Participant 1 ($) Participant 2 ($) Average value ($) Strength SC
HR1 120 125 122.50 0.074
Human rights (HR) HR2 80 85 82.50 0.050
HR3 100 105 102.50 0.062
WC1 90 96 93.00 0.056
Working Conditions
WC2 140 155 147.50 0.089
(WC)
WC3 85 94 89.50 0.054
HS1 90 92 91.00 0.055
Society/health and
HS2 110 105 107.50 0.065
safety (HS)
HS3 130 135 132.50 0.080
CH1 125 130 127.50 0.077
Cultural Heritage (CH) CH2 140 145 142.50 0.086
CH3 100 93 96.50 0.058
SR1 110 99 104.50 0.063
Socioeconomic
SR2 100 94 97.00 0.058
Repercussions (SR)
SR3 124 134 129.00 0.077
Σ = 1665.50 Σ = 1.000
In the third round, the participants provide their inputs for each sub-impact category. Finally,
in the fourth round the participants provide a score of their ‘perception’ for each sub-impact category.
The resulting inputs for the last two rounds are shown in Table 4 and the results of weightage of
expectation and perception are calculated using Equation (3) and are shown in Table 4.Sustainability 2018, 10, 3289 12 of 19
Table 4. Monetary Weightage of Expectation and Perception.
Sub-Impact Weightage of Weightage of
Expectations ($) Perception ($)
Categories Expectation Perception
Participant 1 Participant 2 Average value Participant 1 Participant 2 Average value
HR1 150 100 125.00 0.044 130 135 132.50 0.043
HR2 200 210 205.00 0.072 240 248 244.00 0.080
HR3 190 200 195.00 0.069 210 211 210.50 0.069
WC1 180 170 175.00 0.062 190 185 187.50 0.061
WC2 250 260 255.00 0.090 260 265 262.50 0.086
WC3 180 175 177.50 0.063 190 185 187.50 0.061
HS1 220 225 222.50 0.079 240 235 237.50 0.077
HS2 130 140 135.00 0.048 140 135 137.50 0.045
HS3 140 155 147.50 0.052 150 140 145.00 0.047
CH1 200 190 195.00 0.069 250 260 255.00 0.083
CH2 210 220 215.00 0.076 230 232 231.00 0.075
CH3 180 192 186.00 0.066 195 220 207.50 0.068
SR1 200 200 200.00 0.071 210 240 225.00 0.073
SR2 200 210 205.00 0.072 190 197 193.50 0.063
SR3 194 192 193.00 0.068 210 215 212.50 0.069
Σ 2831.50 1.00 Σ 3069.00 1.00Sustainability 2018, 10, x FOR PEER REVIEW 13 of 19
Sustainability 2018, 10, 3289 13 of 19
4. Discussion
Our hypothetical operationalization of the GreenZee model presents several important findings,
4. Discussion
which are represented in radar charts (Figures 4 and 5). Figure 4 shows the average gap for the
respective impact categories
Our hypothetical where theof
operationalization gaptheindicates
GreenZee the sum of
model perception
presents minus
several expectation.
important Since
findings,
thereareare
which no negative
represented in values for the
radar charts five impact
(Figures 4 and categories,
5). Figure we can infer
4 shows that according
the average gap for to thethe
respective impact categories where the gap indicates the sum of perception minus expectation. of
participants’ inputs, none of the categories have negative social impacts and the production
biodiesel
Since there arein NL
no would
negative support
valuessocial
for thesustainability
five impactoverall. Considering
categories, that there
we can infer are no negative
that according to
thesocial implications
participants’ inputs, associated
none of between the participants
the categories have negative and social
the impact categories,
impacts and the itproduction
is important of to
exploreinthe
biodiesel NLpositive
would implications
support social of sustainability
each impact category.
overall. Considering that there are no negative
An important point concerns
social implications associated between the the gap between perception
participants and expectation.
and the impact categories, itInisparticular,
important in to an
ideal the
explore situation
positivethere should beofno
implications divergence
each (gap = 0) between the perception and expectation of
impact category.
social implications. The average gap denotes
An important point concerns the gap between perception the averageand gapexpectation.
values fromInthe GreenZee
particular, model
in an idealfor
the respective
situation impact
there should be categories.
no divergence Simply
(gap put, while a positive
= 0) between gap indicates
the perception a relatively
and expectation socially
of social
sustainable impact, a negative gap indicates negative impacts on
implications. The average gap denotes the average gap values from the GreenZee model for the society.
respectiveAsimpact
we show in Figure
categories. 4, theput,
Simply ‘society/health
while a positiveandgap safety’ category
indicates has thesocially
a relatively least significant
sustainablegap
between
impact, the perceived
a negative and expected
gap indicates negative conditions.
impacts on Insociety.
this test, we can see that with the three indicators
ofAs ‘society/health and safety’ (i.e., importance
we show in Figure 4, the ‘society/health and safety’ of sustainability
category issues;
has the economic growth
least significant gapand
development; the use of environmentally friendly products), perceptions
between the perceived and expected conditions. In this test, we can see that with the three indicators of are higher than
expectations.and
‘society/health Considering
safety’ (i.e.,the results of
importance sub-impact categories
of sustainability of ‘society/health
issues; economic growth and and safety’, the
development;
analysis suggests that the use of environmentally friendly products in
the use of environmentally friendly products), perceptions are higher than expectations. Consideringmanufacturing of biodiesel is
theofresults
considerable importance.
of sub-impact This of
categories aspect is justified through
‘society/health and safety’,analysing HS1, HS2,
the analysis and that
suggests HS3the in Figure
use
5, which shows the difference of expectations and perceptions
of environmentally friendly products in manufacturing of biodiesel is of considerable importance. for individual categories’
Thissubcategories.
aspect is justified through analysing HS1, HS2, and HS3 in Figure 5, which shows the difference
of expectations and perceptions for individual categories’ subcategories.
avergaegap Ideal
Human rights
$35.00
$30.00
$25.00
$20.00
$15.00
Socioeconomic
$10.00 Working conditions
Repercussions
$5.00
$0.00
Cultural Hertiage Society/health and safety
Figure 4. Monetary gap of Impact Categories.
The next least average gapsFigure
are ‘working conditions’ (+$10) and ‘socioeconomic repercussions’
4. Monetary gap of Impact Categories.
(+$11), respectively. The gap in both of these categories is relatively small and positive, indicating that
both impact categories
The next and their
least average respective
gaps categories
are ‘working WC1, WC2,
conditions’ (+$10)and
andWC3 and SR1, SR2,
‘socioeconomic and SR3
repercussions’
have positive social implications and that the social impacts are higher than those of ‘society/health
(+$11), respectively. The gap in both of these categories is relatively small and positive, indicating
andthat
safety’.
both impact categories and their respective categories WC1, WC2, and WC3 and SR1, SR2, and
SR3Thehave
human rights social
positive (HR) impact category
implications andthat
and its associated
the socialsub-impact of ‘working
impacts are conditions’
higher than those of
(WC) has an average gap of +$20.67,
‘society/health and safety’. indicating that the level of perceived conditions exceeds the level
of expectations and shows a positive social impact. As its sub-impact categories indicate in Figure 5,
it is expected that there will be no child labour force used in producing biodiesel in NL. This resultSustainability 2018, 10, x FOR PEER REVIEW 14 of 19
The human rights (HR) impact category and its associated sub-impact of ‘working conditions’
(WC) has an average gap of +$20.67, indicating that the level of perceived conditions exceeds the
Sustainability 2018, 10, 3289
level
14 of 19
of expectations and shows a positive social impact. As its sub-impact categories indicate in Figure 5,
it is expected that there will be no child labour force used in producing biodiesel in NL. This result is
isalso
alsosupported
supportedand andcontrolled
controlledbyby strict
strict state
state (e.g.,
(e.g., federal
federal andand provincial)
provincial) regulations
regulations regarding
regarding child
child labour in the workplace. Moreover,
labour in the workplace. Moreover, the results indicatethe results indicate that participants perceive the biodiesel
participants perceive the biodiesel
industry
industrytotopromote
promoteequalequalopportunities
opportunities (HR2
(HR2ininFigure
Figure 2)2)
inin
workplaces.
workplaces.This Thisindicates
indicatesthat
thatthere
thereisis
potential
potential for positive
for positive and
and tangible
tangible impacts
impacts ininshaping
shaping a socially
a sociallysustainable
sustainable biodiesel
biodieselsector inin
sector NL.NL.
Fair
Fair wages are also perceived to have positive impacts on society. On the ground, theNL
wages are also perceived to have positive impacts on society. On the ground, the NL
government
government has
hasset
setminimum
minimumwages wagesand andasassuch,
such,labourers
labourerscannot,
cannot,under
underlaw,
law,bebegiven
givenwages
wagesbelow
below
these
thesestandards
standards(The (Theformation
formation of labour
labourunions,
unions, which
which typically
typically drive
drive up wage
up wage standards,
standards, was notwas not
included
included in this
in this study ). study).
The
Themost
mostnotable
notablegap gapis is
represented
represented ininthe cultural
the cultural heritage
heritage category
category (+$32.5).
(+$32.5).With
Withthethewidest
widest
and most positive gap, we can infer that biodiesel production could involve
and most positive gap, we can infer that biodiesel production could involve positive socio-cultural positive socio-cultural
impacts
impacts in in
NL.NL.Considering
Considering the monetary
the monetary aspectsaspects
of the respective sub-impact
of the respective categories,categories,
sub-impact the biodiesel the
production in NL is perceived
biodiesel production in NL isto perceived
support a to wide rangeaofwide
support cultural
rangevalues, including
of cultural maintaining
values, including
support for a socio-culturally
maintaining diverse labour market
support for a socio-culturally diverse(Figure
labour5)market
and contributing
(Figure 5) to anda more sustainable
contributing to a
working environment
more sustainable and local
working community.
environment and local community.
InInFigure
Figure 5, the perception
5, the perceptionof twoof key
twosub-categories,
key sub-categories,the ‘usetheof ‘use
environmentally friendly (green)
of environmentally friendly
products
(green) in technology
products upgrades’ upgrades’
in technology (HS3) and (HS3)‘mental andhealth’ (SR2),
‘mental have(SR2),
health’ lower have
dollarlower
values than values
dollar their
expectations. In particular,In
than their expectations. HS3 shows anHS3
particular, averageshowsgapan −$2.50 while
of average gap ofSR2 shows
−$2.50 an average
while gap ofan
SR2 shows
−average
$11.50. Thisgap indicates
of −$11.50. that there
This is a perceived
indicates that there need
is atoperceived
use environmentally friendly productsfriendly
need to use environmentally while
installing
productsawhile biodiesel production
installing plantproduction
a biodiesel in NL. A higherplant negative
in NL. A gaphigherof mental
negativehealth
gap ofindicates that
mental health
there is a perceived
indicates that there needis for increased attention
a perceived need fortoincreased
mental health issuestoinmental
attention the production of biodiesel
health issues in the
inproduction
the province. of biodiesel in the province.
HR1
$60.00
Gap SR3 HR2
$50.00
Ideal
$40.00
SR2 HR3
$30.00
$20.00
$10.00
SR1 WC1
$-
$-10.00
$-20.00
CH3 WC2
CH2 WC3
CH1 HS1
HS3 HS2
Figure 5. Monetary gap of Sub-Impact Categories.
Figure 5. Monetary gap of Sub-Impact Categories.
Overall, our hypothetical test shows a GreenZee score of +3.13. Referring to Figure 3, the GreenZee
Overall,
score is our
positive, hypothetical
which suggests test
that shows a GreenZee
there are score
no perceived of +3.13.
negative Referring
social impactstoofFigure 3, the
producing
biodiesel in NL and therefore biodiesel production can potentially translate to more sustainable socialof
GreenZee score is positive, which suggests that there are no perceived negative social impacts
producing
impacts. biodiesel
With in NL and
this GreenZee therefore
score, biodiesel
the analysis production
has shown therecan potentially
would translate
be a positive to more
impact of
biodiesel production; however, to answer the question: ‘how much positive impact will there be on the
society?’, one would need to compare the biodiesel GreenZee score of +3.13 (from this analysis) withYou can also read