Fostering Social Project Impact with Twitter: Current Usage and Perspectives - MDPI
←
→
Page content transcription
If your browser does not render page correctly, please read the page content below
sustainability

Article
Fostering Social Project Impact with Twitter: Current
Usage and Perspectives
Mirjana Pejić Bach 1 , Cristina M. Pulido 2, * , Dalia Suša Vugec 1 , Vladia Ionescu 3 ,
Gisela Redondo-Sama 4 and Laura Ruiz-Eugenio 5
 1    Department of Informatics, Faculty of Economics and Business, University of Zagreb, 10000 Zagreb, Croatia;
      mpejic@efzg.hr (M.P.B.); dsusa@efzg.hr (D.S.V.)
 2    Department of Journalism and Communication Studies, Autonomous University of Barcelona,
      08000 Barcelona, Spain
 3    University of Barcelona, 08007 Barcelona, Spain; vladia.ionescu@gmail.com
 4    Faculty of Social Sciences, University of Deusto, 48007 Bilbao, Spain; gisela.redondo@deusto.es
 5    Department of Theory and History of Education, Faculty of Education, University of Barcelona,
      08035 Barcelona, Spain; lauraruizeugenio@ub.edu
 *    Correspondence: cristina.pulido@uab.cat

 Received: 5 July 2020; Accepted: 31 July 2020; Published: 4 August 2020

 Abstract: Social impact assessment has become a major concern within the research community.
 While different methodological advancements have been made to better display, as well as to
 measure, achieved impacts, social media has proved to be a potential domain to generate many
 new opportunities to support both the communication as well as the realization of social impact.
 Within this context, the current research presents an analysis of how Twitter is used among a subset
 of research projects to maximize social impact. The research focuses on the use of Twitter, as one of
 the most often used social media, by the members of scientific projects funded under one part of the
 FP7 funding framework of the European Union called Science in Society. The data were analyzed
 using NVivo, and WordStat Provalis software. The results presented in this study include exploratory
 data analysis, topic mining and the analysis of the impact of projects on Twitter. The results indicate
 moderate use of Twitter among the observed projects, but with a strong focus on the dissemination
 of project results, thus indicating a trend towards the usage of social media for communicating the
 social impact of research projects.

 Keywords: social impact assessment; Twitter; topic mining; FP7; text mining

1. Introduction

1.1. Impact and Social Media
     Impact evaluation has been at the center of research debate for less than a decade, and it is unlikely
to go away any time soon, as the demand for such research continues to increase. In addition to the
work of researchers, worldwide funding agencies are developing better monitoring and evaluation
methodologies. European Framework Program Horizon 2020 (2014–2020) has identified impact as one
of the three items to be evaluated in all research calls. The next Framework Program Horizon Europe
(2012–2027) aims at maximizing impact research [1].
     The debate about the limitations of measuring impact on the basis of academic citation dates back
to the early 1990s [2] and it is commonly found in the literature that the impact evaluation of science
cannot be limited to it. Academic citation is one of the measures, and recent developments include
also the societal and policy impact, with innovative methodologies being tested and developed [3,4].
Furthermore, citation analysis has the academia as a key agent with influence to increase or decrease

Sustainability 2020, 12, 6290; doi:10.3390/su12156290                         www.mdpi.com/journal/sustainability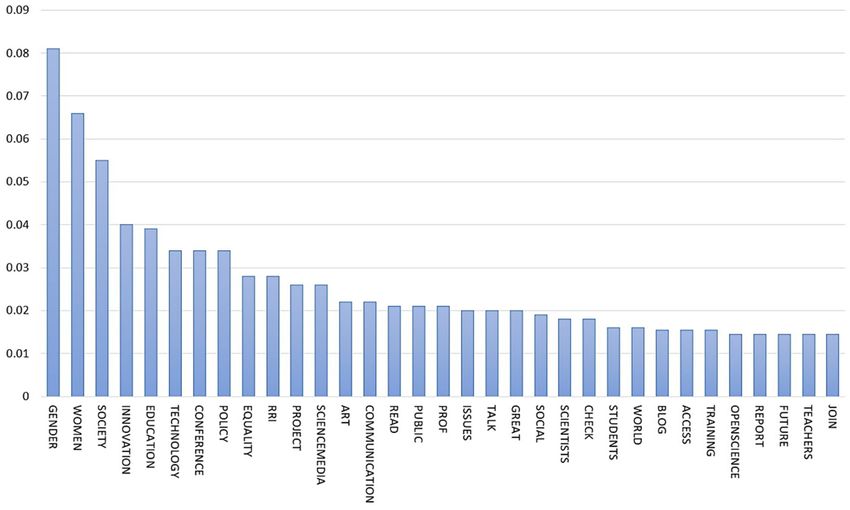
Sustainability 2020, 12, 6290                                                                        2 of 23

the impact of a scientific contribution, and other agents such as stakeholders have a lack of possibilities
to play a role in such citations. In this respect, it is important to mention the open access initiatives
that promote access to scientific knowledge to all, which can include diverse kind of feedback from
society to researchers. In this arena, Ravenscroft, Liakata, Clare and Duma [5] argued that the measure
of impact must go beyond academic citations, and other information sources should be integrated.
Considering the UK context, this team demonstrated that there is not a full correspondence between
academic citations and achieved impact for researchers, and other data must be collected to ensure
the adequate evaluation of the impact of science. Others have considered the requirements that
are necessary to develop mixed methods [6] for evaluating impact—quantitative data are relevant;
however, qualitative data are also needed, for instance, case studies [7]. Finally, another set of studies
highlights that communication and dissemination activities addressed to policymakers and civil society
are a preliminary step to achieving research impact because without including this step some research
results may only be limited to a scientific audience [8]. Additionally, there are other methodologies
designed to build predictive models that, for instance, predict the percentage of the possibility of
obtaining success [9]. The IMPACT-EV team developed the SIOR portal by which a set of five indicators
measure the social impact of research. Part of the same team developed novel methodologies oriented
to capture citizens’ inputs in social impact evaluation by means of the social impact in social media
methodology (SISM) [10]. The SISM methodology opens up new venues not only for assessing the
potential role of social media users but also for the researchers on how to make better use of these tools
to showcase the achieved impact. This is precisely the aim of the present article.
      Social networks all over the world play a relevant role in an increasing number of citizens’
lives. The statistics show that the number of people using social media is increasing yearly. In 2019,
2.77 billion people were using social networks, and, according to Statista, by 2021, the number will
reach 3.02 billion [11]. In the European Union, 65% of Internet users participate in social networks
[12], while in the United States, 79% of the population have a social media profile [13]. In the research
context, end-users play a fundamental role in the dissemination of research impact. As a result of
this trend, the citation analysis which is mainly dominated by researchers, is being accompanied by
interactions on social media from audiences beyond academia.
      If dissemination, which is understood as social media usage, is properly conducted, the impact of
research is extended to users of both academic and non-academic backgrounds [14], going beyond
academic citations. Grande [15] concluded that social media such as Twitter could make knowledge
transfer faster as Twitter users who are interested in a topic can obtain the information they need at
the same time it is shared. In this way, other researchers and stakeholders may focus their attention
on the improvement of strategies for driving impact in science [16]. This new path has established
a different channel for research communities to transfer and communicate their work to those who
are interested in their scientific findings [17]. Twitter can serve as the missing element that can be
used to foster the impact of scientific findings and increase scientific information among non-scientific
users [18]. For scientific projects to demonstrate their impact, researchers need tools such as Twitter to
spread their impact [16] and to gather evidence of such impact to continue exploring impact beyond
academic citations. For instance, Twitter is fundamental in the biomedical and social sciences fields
in the spreading of research results [19,20]. In addition to their role of knowledge transference and
information dissemination, social media can be a tool for the fostering of information dissemination [21].

1.2. Twitter Use for Driving Impact in Science
     The previous literature has underscored that social media usage, in general, provides functional,
social and hedonic benefits [22]. Parra-López et al. [22] proposed three hypotheses to analyze these
benefits. According to hypothesis 1, using social media is beneficial for users as the information
obtained from social media can be used for organizing and decision making; the example provided
by authors is related to organizing and taking vacation trips. Along the same lines, hypothesis 3
highlighted that when users are motivated to use social media, they have the intention of basing
Sustainability 2020, 12, 6290 3 of 23
their organizing and decision making on such use. If users are encouraged to use social media when
organizing and taking vacations trips, it follows that this same process could be transferred to the
field of research. If scientists stimulate the sharing of evidence on social media, this evidence could be
used by users for taking decisions based on science, promoting the impact of science. Exposure and
reputation [23] were shown to motivate contributions in social media in this analysis. The participation
of social media users in research, as the end-users and beneficiaries of research results, would be an
excellent opportunity to drive impact in scientific projects. Involving researchers and social media
users in science in search of open debate and active participation would transform research with
effective strategies that enhance the social impact of social sciences and humanities research [24,25].
Social media users consider Twitter to be a useful tool for expressing their concerns in a wide
variety of fields [26]. Among the different methods of analyzing what users share via social media,
we find that top-down and bottom-up approaches [27] can determine what users describe as their
daily concerns with the hashtags they use [28]. According to Cabré et al. [27], by comparing the
results of both approaches, some new items are revealed. The current research and official social
objectives leave some of the social needs out of the question. Far from being a negative aspect,
this provides a unique opportunity for future research and scientific projects. As research end-users
and social impact beneficiaries, society should be taken into consideration concerning the design of
future scientific research.
Some examples have already been analyzed. In terms of health, patients use social media such
as Facebook and Twitter to search for information, which affects the healthcare industry [29,30].
According to the results of Lander et al., only 2.2% of the physicians in the study had a professional
Twitter account; however, given the relevance that families and patients gave to social media (as seen
before, the statistics show that approximately 80% of the population in the US own a social media
profile), they could benefit even more from the use of their professional Twitter pages to increase
the scientific literacy rate among potential users or even to spread their collaborative actions with
other physicians.
Some questions remain to be answered. Are all data tweeted evidence-based? Do users tweet
or tag relevant, useful and beneficial information? Are all health professionals veridical? In 2012,
85% of Americans had access to the Internet [31], meaning that an increasing number of users have the
possibility of surfing the Internet searching for some medical advice. This also increases the risk of
obtaining false information. After an expert assessment, Alnemer et al. [32] found that only posts from
physicians or official institutions were correct. To avoid obtaining misleading information, the authors
identified four steps that would allow users to obtain trustworthy data: first, use hashtags related to the
search, and then verify the number of followers, the activity and the interactions. Above all, if we wish
to generate impact in science, all tweets must be supported by scientific evidence. This contribution is in
line with other authors who highlight the relevance of participation and co-creation of knowledge [33]
and dialogic evidence-based policies to achieve impact [34].
Among other uses of social media, Twitter can create communities around a specific discussion
to improve communications among various actors such as patients, researchers and organizations.
Users concerned or affected by the same health problem interact and use Twitter to this end. This is
the case with the “Breast Cancer Social Media” Twitter support community (#BCSM). The impact
provided by this group has demonstrated an 80.9% increment of overall knowledge about breast cancer
including treatment options, generic testing and risk assessment, and a 67% decrease in the patients’
anxiety before becoming members of the support group [35]. The American College of Radiology
Twitter poll (#ACR2016) is a useful tool to obtain users’ opinions about a session, a course or event,
with the double aim of providing access and involving all stakeholders in the same discussion [36].
Finally, #MPNSM, “Myeloproliferative Neoplasms on Social Media”, allows those affected to engage
with care professionals. Gathering users’ voices on Twitter can also provide new research opportunities
for future innovation and research [37].Sustainability 2020, 12, 6290 4 of 23
Although health issues constitute a large part of social media content, other authors have identified
the necessity of increasing Twitter use in the social sciences and the humanities (SSH) to obtain evidence
of impact in other fields [38]. In this particular study, the authors stress comparing the use of Twitter
by the soft and hard sciences and found that whereas hard sciences use social media, blogs or podcasts,
among others, no studies were emphasizing SSH communication using Twitter, and that when there
was an exchange of information, it was revealed to be non-academic. It remains to be seen how SSH
journals’ use of Twitter can enhance the citation of academic research articles.
By performing an analysis of more than 1500 articles from different ecology journals, Peoples,
Midway, Sackett, Lynch, and Cooney [39] concluded that Twitter was a significant tool that can
predict citation rates: “Twitter activity was a more important predictor of citation rates than a 5-year
journal impact factor”. Additionally, this statement accentuates that, depending on the social media
usage, articles in high-impact and low-impact journals can receive the same attention, contributing to
advancing knowledge to expand the role of citation analysis. Nevertheless, even if they may seem to
obtain the same results, the effects of traditional and alternative citations do not contribute equally.
Being active on Twitter regarding an article does not mean that the article is cited by other academic
works. It is indeed true that authors can be present on both social media and in scientific journals
without excluding any. Along the same lines, authors who actively disseminate their research results
observed how social media can, on one hand, offer a wider range of scenarios to share and promote
their work with the scientific community and, on the other, with policymakers [40], providing them
with information to enable future regulation modifications based on scientific evidence.
The abovementioned statistics confirm social media as the new tool to promote, disseminate
and share knowledge and information from academia to non-academia and vice versa. The existing
literature corroborates the benefits that society as a whole can gain from being active based on research
results and the feedback of the citizenry.
This study aims to highlight how the use of Twitter can establish a positive and powerful
impact in science, on multidirectional levels, among different science fields, among researchers and
non-researchers or citizens, policymakers and academia. We analyze how a subset of EU-funded projects
are using social media to showcase and update the achieved impact. In doing so, the methodology
used is described, including the findings of the selected projects’ sample. Four layers of analysis
are presented to fully determine the different current usages. Examples of how social media can be
used to increase the impact of scientific projects are provided. Twitter becomes an important tool that
facilitates these multidirectional exchanges in the precise moment when users trust tweets to be a
signal of academic and non-academic impact [41]. Twitter also proves to be an instrument that can
measure what users think of scientific articles and the impact of science by complementing traditional
and modern or alternative citations metrics [42]. All of the collected evidence indicates the relevance
of Twitter use for monitoring or measuring the impact of scientific projects. The article closes with a
discussion and some concluding remarks on how to enhance the use of social media to promote the
social impact of science.
2. Materials and Methods
It is a well-known fact that research and innovation influence and contribute to the level of
well-being and prosperity of both individuals and society in general. Moreover, research and
innovation, as well as knowledge and education, are the prerequisites for creating jobs and obtaining
citizens’ satisfaction in the long term. Therefore, the European Union is investing a great proportion of
its budget towards funding various scientific projects from all areas of science.
One of the frameworks under which the European Union is funding scientific projects is the
FP7, which was designed as an answer to issues about employment needs, competitiveness and the
quality of life in Europe [43]. FP7 stands for the Seventh Framework Programme for Research and
Technological Development, which was the main instrument for funding research in Europe from 2007
until 2013 [43]. The FP7 is legally based on Decision No. 1982/2006/EC of the European Parliament andSustainability 2020, 12, 6290 5 of 23
of the Council of 18 December 2006 concerning the Seventh Framework Programme of the European
Community for Research, Technological Development and Demonstration Activities (2007–2013).
The Decision states that the aim of the FP7 framework is “to contribute to the Union becoming the
world’s leading research area” [44] (p. 1). Moreover, it has been stated that FP7 is supposed to have
a strong focus on promotion and investment in excellent state-of-the-art research [ 44]. To meet the
objectives of the FP7 stated by the Decision, four types of activities have been identified as those that
must be promoted by the FP7 programmes; hence, four programmes have been established:
1. the Cooperation programme—focused on transnational cooperation on policy-defined themes,
2. the Ideas programme—focused on investigator-driven research based on the initiative of the
research community,
3. the People programme—focused on support for individual researchers and
4. the Capacities programme—focused on support for research capacities [44].
In addition to the named programmes, the FP7 also supported the Joint Research Centre as
scientific and technical support for policies of the European Union, as well as the Euroatom programme
for nuclear research [44].
For this study, a focus has been placed on the Science in Society part of the FP7 Capacities
Programme. According to the abovementioned Decision, the objective of the Science in Society part of
the framework is “to stimulate, to build an open, effective and democratic European knowledge-based
society, the harmonious integration of scientific and technological endeavor, and associated research
policies in the European social web, by encouraging pan-European reflection and debate on science
and technology and their relationship with the whole spectrum of society and culture” [44] (p. 34).
Furthermore, the Science in Society work programme states that Science in Society “acts on the relations
between societal actors involved in the research and innovation process, providing them with an
adequate framework for their engagement in the future Societal Challenges” [45] (p. 6).
This paper analyses the use of social networks for fostering project impact, with a special focus
on the analysis of the Twitter accounts and activities of such networks. To evaluate the potential of
Twitter use in fostering project impact, we have decided to focus on the Science in Society FP7 projects
funded by the European Union. One of the limitations of this study is that in the beginning of the FP7
projects the use of Twitter in research projects was not as popular as it is now and there are projects
that are not included in the analysis because they did not use it for this reason.
To meet the goals of this paper and for this research, the Community Research and Development
Information Service (CORDIS) was used for identifying the Science in Society projects. CORDIS is the
primary public repository and portal for information dissemination on all research projects funded by
the European Union [46]. Using CORDIS, overall, 181 projects were identified for participation in this
study. All of the projects had been completed at the time of the observation and analysis for this study.
Table 1 presents the descriptive statistics for the project duration and project funding for 181
observed Science in Society FP7 projects. According to the analysis and Table 1, the minimum
duration of the observed projects is 6 months, while the maximum is 63 months. Observing the means,
the average duration of the Science in Society FP7 projects is 33.17 months, with a standard deviation
of 11.37.
Table 1. Project duration descriptive statistics.
N Minimum Maximum Mean Standard Deviation
Project duration 181 6 63 33.17 11.37
2.1. Data Extraction
The data extraction for this study was conducted in August and September of 2017. Social media
accounts of the Science in Society FP7 project were identified by searching several social networks,Sustainability 2020, 12, 6290 6 of 23
namely, Twitter, YouTube, Facebook and LinkedIn. After the initial search, all social media accounts
of the observed Science in Society FP7 projects were extracted and analyzed. Next, the focus was on
Twitter social network use. For further data extraction and detailed analysis of the Twitter accounts
and tweets of the observed Science in Society FP7 projects, the qualitative data analysis software NVivo,
version 11 (Alfasoft, Göteborg, Sweden) and the text analysis software WordStat Provalis, version 7
(Provalis Research, Montreal, QC, Canada) were used.
NVIVO has an option to extract information from selected Twitter accounts. The information
was organized as follows: the extraction of each Twitter account contains the following information:
the first sheet collects tweets produced by the project Twitter account, and the second one collects
tweets from other accounts retweeted by the project Twitter account. Thus, the first sheet contains
tweets originally produced by the project to conduct content analysis. Additionally, the collected
tweets were organized by the number of retweets received to determine which type of content obtained
more attention from users. Finally, the extraction of the hashtags used could be useful to generate
keywords and to analyze the tweets from the Twitter project account. The “mentions” are useful to
determine which accounts are identified in the tweets.
2.2. Data Analysis
The data analysis for this study was conducted in four phases: (i) analysis of social media usage
for the Science in Society FP7 projects, (ii) exploratory data analysis of the tweets, (iii) topic mining
analysis, and (iv) analysis of the impact of the projects on Twitter.
2.2.1. Use of Social Media
After the search of Facebook, Twitter, LinkedIn and YouTube as the four selected social networks
and the identification of the social media accounts of the Science in Society FP7 projects, the analysis of
the social media usage for the observed projects was conducted. First, basic descriptive statistics were
employed, calculating the frequencies and percentages of social media accounts based on the selected
social networks. Second, a Spearman’s correlation analysis of the social media usage for Science in
Society FP7 projects was conducted.
2.2.2. Exploratory Data Analysis
For exploratory data analysis, the text analysis software WordStat Provalis was used. First, the 50
most frequently used words in tweets were identified and extracted by using the word extraction
approach. This approach was employed to detect the most frequently used words in tweets of the
Science in Society FP7 projects. Second, the proximity plot based on tweets that mention the most-used
word in tweets was created using the WordStat Provalis software. The proximity plot is the data
visualization chart that shows the distance between a most-used word and other observed words,
whereby the words that frequently tend to occur near the selected word are shown at the top of the
chart [47]. According to Provalis Research, the proximity plot is “the most accurate way to graphically
represent the distance between objects by displaying the measured from one or several target objects to
all other objects.” [47] (p. 80). The proximity plot is used in the present study to identify the words
that co-occur with one word that is used the most often in the tweets of the observed projects.
2.2.3. Topic Mining
Topic mining analysis was also conducted using the WordStat Provalis software. First, the tweet
topics were mapped. Second, the analysis of the tweet topics was conducted, revealing the eigenvalues,
percentage of variances, frequencies and the number and percentage of cases for each topic and its
keywords, also providing examples of the tweets for each of the topics. The topic mining approach was
used to identify the topics that emerge the most often in tweets of the Science in Society FP7 projects.
After the extraction of the topics based on the factor analysis, cluster analysis of the extracted topic wasSustainability 2020, 12, 6290 7 of 23
conducted to investigate the topics that occur together. A topic map was created based on the results
of the cluster analysis.
2.2.4. Impact of Projects on Twitter
The analysis of the impact of Science in Society FP7 projects on Twitter was based on Twitter
statistics, calculating the basic descriptive statistics of tweets and retweets, followers and following
accounts every month and for the entire duration of the observed projects. Moreover, the tweet
statistics were calculated and analyzed in terms of the topics. Besides, the tweets with the largest
number of retweets were extracted and analyzed. Finally, a Spearman’s correlation analysis of tweet
impact indicators was conducted
3. Results
This section of the paper presents the results of the previously described data analysis regarding
the social media usage for the observed Science in Society FP7 projects, exploratory data analysis of the
tweets, analysis based on the topic mining of the tweets and the analysis of the impact of Science in
Society FP7 projects on Twitter.
3.1. Use of Social Media
The use of social media within the Science in Society FP7 projects is presented in Tables 2 and 3.
For this analysis, the focus was on Twitter, Facebook, LinkedIn and YouTube. The results of the
percentage of Science in Society FP7 projects that use social media (Twitter, Facebook, LinkedIn and
YouTube) are presented by Table 2. Out of 181 projects, fewer than a half of them (30.4%) have Twitter
accounts, whereas a minority (7.7%) have LinkedIn accounts. A total of 19.9% of the observed projects
have YouTube accounts, whereas 26.5% of them have Facebook accounts.
Table 2. Usage of social media for Science in Society FP7 projects (N = 181 projects).
Social Media Account Number of Projects %
Twitter account 55 30.4%
Facebook account 48 26.5%
LinkedIn account 14 7.7%
YouTube account 36 19.9%
Table 3. Spearman’s correlation analysis of the usage of social media for Science in Society FP7 projects
(N = 181 projects).
Social Media Account Twitter Facebook LinkedIn YouTube
Twitter 1 0.474 ** 0.303 ** 0.393 **
Facebook 1 0.341 ** 0.516 **
LinkedIn 1 0.322 **
YouTube 1
** Correlation is significant at the 0.01 level (2-tailed).
Table 3 presents the results of the Spearman’s correlation analysis of the social media usage
for the Science in Society FP7 projects. All the presented correlations are significant at the 1% level.
The highest positive correlation among the observed social media accounts is visible between Facebook
and YouTube accounts, which means that the projects that have Facebook accounts are more likely to
also have YouTube accounts and vice versa.
3.2. Exploratory Data Analysis
Table 4 presents the frequencies of the 50 most-used words in tweets of the Science in Society FP7
projects. As shown in Table 4, the most-used word is “science” with a frequency of 2246 times used inSustainability 2020, 12, 6290 8 of 23
the Science in Society FP7 projects’ tweets. Other words in the top 5 most-used words in tweets are
“gender”, “RRI”, “conference” and “project”.
Table 4. Frequency of the 50 most-used words in tweets.
Extracted Words Frequency % Shown % Processed % Total
SCIENCE 2246 4.45% 1.10% 0.51%
GENDER 1392 2.76% 0.68% 0.32%
RRI 1224 2.42% 0.60% 0.28%
CONFERENCE 981 1.94% 0.48% 0.22%
PROJECT 915 1.81% 0.45% 0.21%
WOMEN 777 1.54% 0.38% 0.18%
INNOVATION 710 1.41% 0.35% 0.16%
POLICY 668 1.32% 0.33% 0.15%
GREAT 664 1.32% 0.32% 0.15%
THANKS 623 1.23% 0.30% 0.14%
WORKSHOP 603 1.19% 0.29% 0.14%
OPENACCESS 599 1.19% 0.29% 0.14%
OPENSCIENCE 567 1.12% 0.28% 0.13%
CHECK 566 1.12% 0.28% 0.13%
NEWS 542 1.07% 0.26% 0.12%
SCIENTISTS 502 0.99% 0.25% 0.11%
STEM 495 0.98% 0.24% 0.11%
READ 485 0.96% 0.24% 0.11%
ACCESS 437 0.87% 0.21% 0.10%
JOIN 417 0.83% 0.20% 0.10%
FOLLOW 406 0.80% 0.20% 0.09%
EDUCATION 403 0.80% 0.20% 0.09%
REPORT 397 0.79% 0.19% 0.09%
BLOG 386 0.76% 0.19% 0.09%
VIDEO 381 0.75% 0.19% 0.09%
EVENT 373 0.74% 0.18% 0.09%
FUTURE 372 0.74% 0.18% 0.09%
SOCIETY 369 0.73% 0.18% 0.08%
DAY 365 0.72% 0.18% 0.08%
UK 356 0.71% 0.17% 0.08%
FACEBOOK 351 0.70% 0.17% 0.08%
FISH 350 0.69% 0.17% 0.08%
TEACHERS 348 0.69% 0.17% 0.08%
EQUALITY 337 0.67% 0.16% 0.08%
SOCIAL 337 0.67% 0.16% 0.08%
FISHING 326 0.65% 0.16% 0.07%
PEOPLE 326 0.65% 0.16% 0.07%
UNIVERSITY 313 0.62% 0.15% 0.07%
INTERNATIONAL 304 0.60% 0.15% 0.07%
WEEK 303 0.60% 0.15% 0.07%
PUBLIC 302 0.60% 0.15% 0.07%
WORLD 301 0.60% 0.15% 0.07%
MEETING 294 0.58% 0.14% 0.07%
TIME 291 0.58% 0.14% 0.07%
TRAINING 289 0.57% 0.14% 0.07%
SCIENCEMEDIA 288 0.57% 0.14% 0.07%
SCIENTIFIC 287 0.57% 0.14% 0.07%
HEALTH 285 0.56% 0.14% 0.07%
CHANGE 284 0.56% 0.14% 0.06%
RESEARCHERS 284 0.56% 0.14% 0.06%
Figure 1 presents the proximity plot based on tweets that mention the word “science”.
The presented proximity plot reveals which words occur most frequently with the word “science”Sustainability 2020, 12, 6290 9 of 23
as the one used in Science in Society FP7 projects’ tweets most often according to the exploratory
data analysis presented above. As shown in Figure 2, the words “gender”, “women”, “society”,
“innovation” and “education” are used the most frequently along with the observed word “science”.
Figure 1. Proximity plot based on tweets that mention the word “science”.
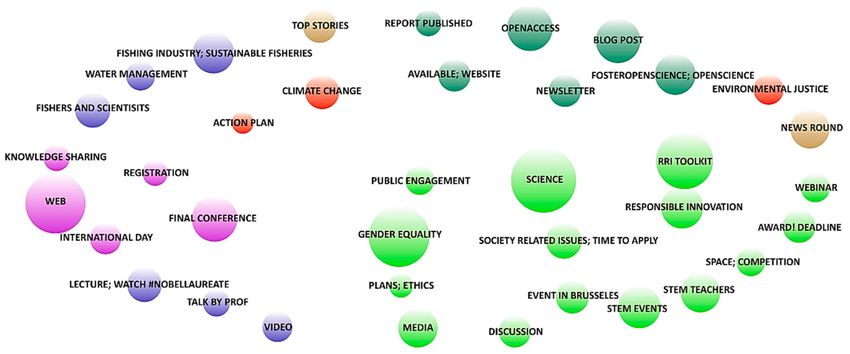
Figure 2. Topic mapping of tweets.
3.3. Topic Mining
Figure 2 presents the topic map of Science in Society FP7 projects’ tweets based on the topic
mining and cluster analysis of the extracted topics. As shown in Figure 2, there is a total of 7 groups of
topics present on the map where each group is color-coded. The size of the circle representing each of
the topics is proportional to the frequency and the number of cases in which a certain topic is present.
Overall, 40 topics are identified and presented on the topic map.
The identification of the topics in Science in Society FP7 projects’ tweets, showing the eigenvalues,
percentage of variances, frequencies and the number and percentage of cases for each topic and its
keywords are presented in Table 5. The topics shown in Table 5 are grouped based on the cluster
analysis of the topics and the topic mapping shown in Figure 2.Sustainability 2020, 12, 6290 10 of 23
Table 5. Identification of topics in tweets.
No Name Keywords Eigen-Value % Var Freq Cases % Of Cases
Group 1
WEB; FACEBOOK;
1 WEB 2.41 1.25 1607 1007 4.14%
FOLLOW; THANKS
KNOWLEDGE SHARING; KNOWLEDGE;
2 1.15 0.59 537 507 2.09%
SHARING INFORMATION
DAY; INTERNATIONAL;
3 INTERNATIONAL DAY 1.12 0.58 938 882 3.63%
MEETING
REGISTRATION; HELP;
4 REGISTRATION 1.12 0.57 465 443 1.82%
LINK
5 FINAL CONFERENCE CONFERENCE; FINAL 1.41 0.65 1147 1047 4.31%
Group 2
6 CLIMATE CHANGE CLIMATE; CHANGE 3.03 0.74 520 390 1.60%
ENVIRONMENTAL JUSTICE;
7 1.56 0.77 355 255 1.05%
JUSTICE ENVIRONMENTAL
8 ACTION PLAN ACTION; PLAN 1.2 0.58 253 236 0.97%
Group 3
9 NEWS ROUND NEWS; ROUND; STORIES 1.4 0.76 726 586 2.41%
10 TOP STORIES TOP; DAILY; STORIES 1.78 0.82 589 458 1.88%
Group 4
LECTURE;
LECTURE; WATCH
11 NOBELLAUREATE; 1.62 0.78 786 613 2.52%
#NOBELLAUREATE
WATCH; NOBEL
12 TALK BY PROF TALK; PROF 1.2 0.6 424 386 1.59%
13 VIDEO VIDEO; YOUTUBE 1.28 0.63 493 453 1.86%
Group 5
14 WATER MANAGEMENT MANAGEMENT; WATER 1.3 0.63 406 406 1.67%
FISHING INDUSTRY;
FISHING; FISHERIES; FISH;
15 SUSTAINABLE 1.52 0.74 1328 1124 4.62%
SUSTAINABLE; INDUSTRY
FISHERIES
FISHERS AND SCIENTISTS; FISHERS;
16 1.14 0.6 763 693 2.85%
SCIENTISTS FISHERMEN
Group 6
BLOG; POST; READ;
17 BLOG POST 1.44 0.72 1273 1036 4.26%
EXCHANGE
18 REPORT PUBLISHED REPORT; PUBLISHED 1.13 0.59 506 490 2.02%
OPENACCESS; POLICIES;
19 OPEN ACCESS 1.43 0.69 1212 1029 4.23%
ACCESS
FOSTER OPEN SCIENCE;
FOSTEROPENSCIENCE; OPEN SCIENCE; OPEN
20 1.25 0.67 1264 1092 4.49%
OPENSCIENCE DATA; TRAINING;
HORIZON
AVAILABLE; WEBSITE;
21 AVAILABLE; WEBSITE 1.24 0.61 885 797 3.28%
ONLINE; PROGRAMME
NEWSLETTER; ISSUE;
22 NEWSLETTER 1.17 0.59 984 950 3.91%
POLICY
Group 7
23 RRI TOOLKIT RRI; TOOLKIT; RRITOOLS 1.67 0.75 1511 1239 5.10%
EVENTS; DISCOVER; STEM;
24 STEM EVENTS 1.61 0.72 1128 977 4.02%
EVENT
DEADLINE; AWARD;
25 AWARD! DEADLINE PRACTICE; EDITION; 1.56 0.76 627 530 2.18%
APPLY
MEDIA; SCIENCEMEDIA;
26 MEDIA 1.5 0.75 803 645 2.65%
SOCIAL
27 GENDER EQUALITY GENDER; EQUALITY 1.47 0.75 1626 1334 5.49%Sustainability 2020, 12, 6290 11 of 23
Table 5. Cont.
No Name Keywords Eigen-Value % Var Freq Cases % Of Cases
COUNTRY; PRIZE;
28 COUNTRY 1.46 0.72 368 306 1.26%
CONTESTANT
TEACHERS; SCHOOL;
29 STEM TEACHERS 1.34 0.66 835 764 3.14%
STUDENTS; STEM
SOCIETY RELATED ISSUES; SOCIETY; APPLY;
30 1.29 0.63 816 768 3.16%
ISSUES; TIME TO APPLY TIME
31 DISCUSSION DISCUSSION; PANEL; JOIN 1.27 0.63 734 670 2.76%
ENGAGEMENT; PUBLIC;
32 PUBLIC ENGAGEMENT 1.26 0.64 587 528 2.17%
ENGAGE
RESPONSIBLE INNOVATION;
33 1.23 0.69 890 751 3.09%
INNOVATION RESPONSIBLE
CHILDREN; UNIVERSITIES;
34 CHILDREN 1.23 0.61 579 528 2.17%
UNIVERSITY
CAREER; RESEARCHERS;
35 CAREER RESEARCHERS 1.17 0.59 503 467 1.92%
FEMALE
36 WEBINAR WEBINAR; REGISTER; MISS 1.17 0.62 459 418 1.72%
BRUSSELS; TAKING;
37 EVENT IN BRUSSELS 1.16 0.63 478 449 1.85%
COMPETITION; EVENT
SPACE; COMPETITION;
38 SPACE; COMPETITION 1.16 0.62 486 459 1.89%
RESOURCES; TEACHING
39 PLANS; ETHICS PLANS; ETHICS; ROLE 1.13 0.59 454 427 1.76%
40 SCIENCE SCIENCE; TECHNOLOGY 1.13 0.62 2305 2229 9.17%
Within the first group, the largest eigenvalue (2.41), as well as the highest frequency (1607),
belongs to the topic of Web, which contains the keywords “web”, “Facebook”, “follow” and “thanks”.
However, when considering the number of cases, the topic Final Conference is mentioned in the highest
number of cases (1047) among the first group of topics. In the second group of topics, the largest
eigenvalue (3.03), as well as the highest frequency (520) and the highest number of cases (390), is shown
for the topic Climate Change. Out of the two topics present in the third group, the topic of Top Stories,
containing the keywords “top”, “daily” and “stories”, has the greater eigenvalue (1.78), while the topic
News Round has the higher frequency of 726 in 586 cases. Within the fourth group of topics, the topic
Lecture; Watch #Nobellaureate has the largest eigenvalue (1.62), as well as the highest frequency (786)
and the highest number of cases (613). The topic Fishing Industry; Sustainable Fisheries has the largest
eigenvalue (1.52), the highest frequency (1328) and the highest number of cases (1124) among the topics
of the fifth group. In the sixth group, the largest eigenvalue (1.44), as well as the highest frequency,
belongs to the topic Blog Post, while the highest number of cases is for with the topic Fosteropenscience;
Openscience (1029). The last, seventh, group of topics contains the most extracted topics. In this
group, the largest eigenvalue (1.67) is visible with the topic RRI Toolkit containing the keywords “RRI”,
“Toolkit” and “RRItools”. However, the highest frequency (2305), as well as the highest number of
cases (2229), belongs to the topic of Science, which contains the keywords “science” and “technology”.
When considering the overall results, the highest frequency mentions in the Science in Society FP7
projects’ tweets is obtained by the topic Science with a frequency of 2305 in 2229 cases, which amounts
to 9.17% of all observed cases. However, the largest eigenvalue of 3.03 in the overall results is obtained
by the Climate Change topic.
Whereas Table 5 presents the analysis of the topics of the Science in Society FP7 projects’ tweets,
Table 6 presents examples of tweets for each of the identified and extracted topics.Sustainability 2020, 12, 6290 12 of 23
Table 6. Example tweets per topics.
No Name Example Tweet
Group 1
@tkasputis Thanks for “the follow”! You can also find us on the web
1 WEB http://t.co/5wr10vE3 and Facebook http://t.co/9yvujCkJ
What is knowledge? Science, hard data? Or knowledge held by fishermen?” -
2 KNOWLEDGE SHARING does the answer to this shape how we collect information? #CFP
Going global: International perspectives on #RRI #Bulgaria #RRI_practice
3 INTERNATIONAL DAY meeting https://t.co/E9o1lBYp9r
@ISPRA_Press Help us spread the word about the #GAP2 Intl Symposium!
4 REGISTRATION Registration now open! Link here: http://t.co/Oa7jEzouY6.
#RRI #SDGs #climatechange See talk by Barron Joseph Orr at the @RRITools
5 FINAL CONFERENCE
Final Conference https://t.co/wbNGzfw3VQ https://t.co/trXMtihzZv
Group 2
Now: Our Common Future under Climate Change Paris 2015 #CFCC15
6 CLIMATE CHANGE #climate conference in preparation of #COP21 Videos:
https://t.co/A4FYx05PMS
@seharyeli you’re follower 700 at EJOLT. Can you tell us which
7 ENVIRONMENTAL JUSTICE #environmental #justice struggle you’re familiar with? Others: let us know!
@uduakarchibong1 University of Chemistry and tech Prague team sharing
8 ACTION PLAN
their action plan @genovatecafe @GenovateUnina https://t.co/n5U0SM3vQ2
Group 3
@BeyondAid @BHRRC bad news for Ecuador AND environmental justice.
9 NEWS ROUND Maybe they make a better chance in Latin-American courts?
Should #science #journalists read the #papers on which their stories are
10 TOP STORIES based? http://t.co/KW0bbZ2p
Group 4
LECTURE; WATCH He’ll give another #LindauLecture at #LiNoEcon. Watch #Nobel Laureate P.A.
11 Diamond’s lecture on #unemployment: https://t.co/wmqpqVv0He
#NOBELLAUREATE
Involving Industry & markets” Prof Martina Schraudner, @TUBerlin_PR/
12 TALK BY PROF @fraunhoferfokus talk at #gendersummit http://t.co/KHXTH2a #science
Spotlight on a project at #EUCYS 2010... Check this video
13 VIDEO out—EUCYS_2010_NORWAY.mov http://t.co/jCvcTMq via @youtube
Group 5
During a workshop in Tunis, 31 participants discussed how water
14 WATER MANAGEMENT management options could be implemented in an... https://t.co/hVeZW3h9Pi
FISHING INDUSTRY; If you’re interested in #fish #fishing#fisheries management, #collaborations
15 between science &fishers or #livelihoods- follow #FDI2014
SUSTAINABLE FISHERIES
@Welsh_Fishermen -working with scientists & gov to ensure the long-term
16 FISHERS AND SCIENTISTS sustainability of their fisheries (via FishNews) http://t.co/RCXd0KmSew
Group 6
You can now read all of the blog posts from the Italian-Dutch #GAP2exchange
17 BLOG POST in one place. Check it out: http://t.co/0KPBfEffkE @ISPRA_Press
The Royal Society report published on 21 June 2012 the report “#Science as an
18 REPORT PUBLISHED #open enterprise” http://t.co/ENdUaHfd http://t.co/17XKpxy2
Have you visited ROARMAP yet? THE international registry with over 600
19 OPEN ACCESS open access mandates and policies! http://t.co/zPu9rIAXLe
FOSTEROPEN SCIENCE; Blogpost by @ivnieuwe on the #fosteropenscience workshop organised by
20 VLIR in Brussels http://t.co/IxPRCDgcuY #opendata #openscience
OPENSCIENCE
Register as a user at the #Scientix website and meet more than 6200 other
21 AVAILABLE; WEBSITE #STEMteachers online! Sign up here - . . . https://t.co/Rsmd3ZDKYN
The new issue of the Ark of Inquiry Newsletter is out now. Download and
22 NEWSLETTER share via the following link: https://t.co/z1sOBwWH7r
Group 7
New in the #RRI Toolkit
23 RRI TOOLKIT What is science’s crisis really about?—article by @AndreaSaltelli &
@SFuntowicz . . . https://t.co/xob2rfG7oh
Have a look at this #ScientixEvent for #STEMDiscoveryWeek! Discover more
24 STEM EVENTS
events or submit your STEM event here: https://t.co/hyeNfFYYs0Sustainability 2020, 12, 6290 13 of 23
Table 6. Cont.
No Name Example Tweet
#Teachers! Last chance to register for @DesignSquad! Deadline to apply is
25 AWARD! DEADLINE tomorrow! Find more info here > https://t.co/wY1dWzbXpB
Understanding the very idea of ethics in sci research is a matter of social
26 MEDIA responsibility &media can & should play a role in this #sciencemedia
Initiatives to promote gender equality in STEM @uduakarchibong1
27 GENDER EQUALITY https://t.co/XvdGQmLAUR
#EUCYS flashback: #Swiss contestant Fabian Gafner, 2009 1st-prize winner,
28 CONTESTANT on his project @universciencetv – http://t.co/KMTrSrTl
#STEMAhead is a new competition for #STEM teachers! Go #Back2School
29 STEM TEACHERS this autumn and you may win a prize! More here: https://t.co/55ySS4fh3P
SOCIETY RELATED ISSUES; Did you apply for our #SummerSchool on #science in #society related issues
30 in #pandemics? There’s still time to do it http://t.co/3nez6Gn9Hr
TIME TO APPLY
Join GenPORT e-Discussion: Incorporating #Gender in Climate Action
31 DISCUSSION #H2020 @UNFCCC @COP21en https://t.co/0Abn0Yv02w
https://t.co/ZL2KkjnU6W
Leo Hennen: “Radical shift -From enlightening and educating the public to
32 PUBLIC ENGAGEMENT bring them into the system” #rri #engage2020
Find out what Responsible Research and Innovation is!
33 RESPONSIBLE INNOVATION https://t.co/47LuMXpvO5 #ValentinaAmorese @RRITools #RRI
Workshop for organizers of Children’s Universities at the University of
34 CHILDREN UNIVERSITY Magdeburg/Germany. Rector Strackeljan... http://t.co/1w4sc05AZA
New Resource on #GenPORT: #Career Trajectories of Male and Female Career
35 CAREER RESEARCHERS Development #Award Recipients #gender https://t.co/2BTyGlnXfj
Join the #webinar on Global Ocean Science Education on 19 December -
36 WEBINAR register here: https://t.co/KnrA8R2Piq #OceanLiteracy @emseassociation
Win a trip to Brussels by taking part in our #AllSTEM competition with your
37 EVENT IN BRUSSELS #STEM event or video! Participate now ! https://t.co/Fn1kWH4hYh
#space_awe announced the competition to celebrate and acknowledge space
38 SPACE; COMPETITION science teaching! Follow instructions here: https://t.co/A4BZRvoH9I
#Ethics has the main role in the spread of #epidemics. But few EU #flu
39 PLANS; ETHICS #pandemic plans care https://t.co/VZ3ECqigZB
First International perspective by Zhao Yandog of the Chinese Academy of
40 SCIENCE
Science and Technology for Development. #rriperspectives
3.4. Impact of Projects on Twitter
The impact of projects on Twitter is presented based on the statistics of tweets and retweets,
retweets of tweets, retweets of retweets, followers and following Twitter accounts, as well as the
Spearman’s correlation analysis of tweet impact indicators.
Table 7 presents the Twitter statistics for Science in Society FP7 projects during the total project
time. As shown in Table 7, during the total project time, 55 Twitter accounts belonging to the Science in
Society FP7 projects generated 64,973 tweets, out of which 16,373 were retweeted. The owners of the
observed Twitter accounts overall had 43,487 followers. At the same time, they followed 30,563 other
Twitter accounts. There were a total of 35,571 retweets of tweets during the total project time, and there
were 859,593 retweets of retweets during the same time.
Table 7. Twitter statistics for Science in Society FP7 projects during the total project time.
N Minimum Maximum Mean Standard Deviation Total
Tweets 55 6 16,341 1181.33 2575.93 64,973
Retweets 54 0 2418 303.20 474.22 16,373
Followers 55 8 9290 790.67 1657.88 43,487
Following 55 0 7268 555.69 1054.41 30,563
Retweets of tweets 55 0 8933 646.75 1410.16 35,571
Retweets of retweets 55 0 292,392 15,628.96 48,984.71 859,593Sustainability 2020, 12, 6290 14 of 23
The Twitter statistics for Science in Society FP7 projects monthly are presented in Table 8. Across all
Twitter accounts belonging to the Science in Society FP7 projects an average of 49.54 tweets were
generated per month. At the same time, the number of retweets was 10.48 on average per month.
Concerning the followers, Science in Society FP7 projects had an average of 74.45 followers monthly,
while they followed an average of 29.96 other Twitter accounts. On average, monthly, there were 19.89
retweets of the analyzed tweets. Moreover, there was an average of 905.02 retweets of retweets per month.
The highest and lowest values of tweets and retweets per month are presented in Table 9. As shown,
the highest number of tweets per month is 1361.75, while the lowest is only 0.69. Concerning retweets,
the highest number of retweets per month is 158.17, while the lowest is 0.
Table 8. Twitter statistics for Science in Society FP7 projects per month.
N Minimum Maximum Mean Standard Deviation
Tweets/month 55 0.11 1362 49.54 184.59
Retweets/month 54 0 158 10.48 23.48
Followers/month 55 0.15 493 28.37 74.45
Following/month 55 0 186 16.40 29.96
Retweets of tweets/month 55 0 229 19.89 42.99
Retweets of retweets/month 55 0 24,366 905.02 3949.03
Table 9. Highest and lowest values of tweets and retweets per month.
Extreme Values Rank Tweets/Month Retweets/Month
1 1361.75 158.17
2 215.21 67.17
Highest 3 179.89 39.46
4 90.1 25.8
5 80.58 22.92
1 0.13 0
2 0.31 0
Lowest 3 0.58 0
4 0.67 0
5 0.69 0
Table 10 presents the project and tweet statistics concerning the topics extracted in the earlier
analysis of topic mining. Overall, the highest number of Science in Society FP7 projects (52) tweeted
about the topic Available; Website containing the keywords “available”, “website”, “online” and
“programme”. The second-highest number of projects (49) tweeted about the topics of Science, Event in
Brussels and Final Conference. However, out of the 40 extracted topics, the lowest number of Science
in Society FP7 projects (22) tweeted about the Environmental Justice topic. The highest number of
tweets was obtained within the topic of Science (2229 tweets), whereas the lowest was obtained within
the Action Plan topic (236 tweets). Concerning retweets, the highest number of retweets was achieved
under the topics of RRI Toolkit and STEM Events (3535 retweets), whereas the lowest number of
retweets among the observed topics was noted in the case of the Water Management topic with only
29 retweets. The highest average of followers per project was present in the Climate Change topic
(2011.30), whereas the lowest average of 829.7 followers was noted in the case of the Available; Website
topic. The average number of retweets was the highest in the case of the Space; Competition topic with
an average of 4.99 retweets, whereas it was the lowest in the case of the Water Management topic with
an average of 0.07 retweets.
Table 11 presents the tweets with the largest number of retweets, showing the goals of the
presented tweets, as well as the tweet statistics and the acronym of the Science in Society FP7 project
which was the author of the presented tweet. The author of the tweet with the highest number of
retweets (83) is the SCIENTIX 2 project, which originated from Belgium.Sustainability 2020, 12, 6290 15 of 23
Table 10. Project and tweet statistics per topic.
Number of Tweets with Number of Number of Average Number of Average Numbet
No Name Keywords
At Least One Word Retweets Projects Followers per Project of Retweets
1 CLIMATE CHANGE CLIMATE; CHANGE 390 524 31 2011.30 1.34
2 WEB WEB; FACEBOOK; FOLLOW; THANKS 1007 386 47 901.6 0.38
3 TOP STORIES TOP; DAILY; STORIES 458 330 32 1227.50 0.72
4 RRI TOOLKIT RRI; TOOLKIT; RRITOOLS 1239 3535 31 1034.70 2.85
LECTURE; WATCH LECTURE; NOBELLAUREATE; WATCH;
5 613 889 34 1136.20 1.45
#NOBELLAUREATE NOBEL
6 STEM EVENTS EVENTS; DISCOVER; STEM; EVENT 977 3535 46 920.3 3.62
7 ENVIRONMENTAL JUSTICE JUSTICE; ENVIRONMENTAL 255 677 22 1577.50 2.65
DEADLINE; AWARD; PRACTICE;
8 AWARD! DEADLINE 530 1161 41 1010.90 2.19
EDITION; APPLY
FISHING INDUSTRY; FISHING; FISHERIES; FISH;
9 1124 1361 36 1104.30 1.21
SUSTAINABLE FISHERIES SUSTAINABLE; INDUSTRY
10 MEDIA MEDIA; SCIENCEMEDIA; SOCIAL 645 445 38 1051.70 0.69
11 GENDER EQUALITY GENDER; EQUALITY 1334 2227 25 1096.50 1.67
12 CONTESTANT COUNTRY; PRIZE; CONTESTANT 306 470 29 1235.90 1.54
13 BLOG POST BLOG; POST; READ; EXCHANGE 1036 1979 44 962.6 1.91
14 OPENA CCESS OPEN ACCESS; POLICIES; ACCESS 1029 2380 36 1107.50 2.31
15 FINAL CONFERENCE CONFERENCE; FINAL 1047 1493 49 877.2 1.43
16 NEWS NEWS; ROUND; STORIES 586 952 40 1027.40 1.62
17 STEM TEACHERS TEACHERS; SCHOOL; STUDENTS; STEM 764 3362 38 1026.40 4.40
18 WATER MANAGEMENT MANAGEMENT; WATER 406 29 29 1295.20 0.07
SOCIETY RELATED ISSUES;
19 ISSUES; SOCIETY; APPLY; TIME 768 1242 43 975.8 1.62
TIME TO APPLY
20 VIDEO VIDEO; YOUTUBE 453 769 41 992.4 1.70
21 DISCUSSION DISCUSSION; PANEL; JOIN 670 1651 42 996.4 2.46
22 PUBLIC ENGAGEMENT ENGAGEMENT; PUBLIC; ENGAGE 528 805 42 994.6 1.52
FOSTEROPENSCIENCE; FOSTER OPEN SCIENCE; OPEN SCIENCE;
23 1092 820 39 1044.1 0.75
OPENSCIENCE OPEN DATA; TRAINING;
AVAILABLE; WEBSITE; ONLINE;
24 AVAILABLE; WEBSITE 797 1477 52 829.7 1.85
PROGRAMME
25 RESPONSIBLE INNOVATION INNOVATION; RESPONSIBLE 751 1355 41 876.3 1.80
26 CHILDREN UNIVERSITY CHILDREN; UNIVERSITIES; UNIVERSITY 528 480 39 1051.8 0.91
27 TALK BY PROF TALK; PROF 386 548 36 1125.1 1.42
28 ACTION PLAN ACTION; PLAN 236 356 36 1123.1 1.51
30 CAREER RESEARCHERS CAREER; RESEARCHERS; FEMALE 467 885 36 1126.7 1.90
31 NEWSLETTER NEWSLETTER; ISSUE; POLICY 950 1677 48 890.1 1.77
32 WEBINAR WEBINAR; REGISTER; MISS 418 1434 41 1017.1 3.43
BRUSSELS; TAKING; COMPETITION;
33 EVENT IN BRUSSELS 449 2025 49 869.2 4.51
EVENTSustainability 2020, 12, 6290 16 of 23
Table 10. Cont.
Number of Tweets with Number of Number of Average Number of Average Numbet
No Name Keywords
At Least One Word Retweets Projects Followers per Project of Retweets
SPACE; COMPETITION; RESOURCES;
34 SPACE; COMPETITION 459 2290 41 997.9 4.99
TEACHING
35 KNOWLEDGE SHARING SHARING; KNOWLEDGE; INFORMATION 507 569 41 1011.1 1.12
36 FISHERS AND SCIENTISTS SCIENTISTS; FISHERS; FISHERMEN 693 1001 30 1271.1 1.44
37 PLANS; ETHICS PLANS; ETHICS; ROLE 427 777 38 1072.8 1.82
38 REPORT PUBLISHED REPORT; PUBLISHED 490 880 40 1028.3 1.80
39 SCIENCE SCIENCE; TECHNOLOGY 2229 3366 49 877.8 1.51
40 INTERNATIONAL DAY DAY; INTERNATIONAL; MEETING 882 1328 48 889.5 1.51
41 REGISTRATION REGISTRATION; HELP; LINK 443 770 40 1030.8 1.74
Table 11. Tweets with the largest number of retweets.
Tweet The Goal of the Tweet Acronym Number of Retweets Number of Tweets Number of Followers Number Following
We are proud to announce that #Scientix is
selected for the top 100 global innovations
in education at #BETT2017! Project achievement SCIENTIX 2 83 8393 9290 7268
https://t.co/yWNlO76wvZ
Canadian lawyers side with Ecuadorian
villagers in attempts to enforce a judgement
on Chevron http://t.co/W6XeJPPEME Environmental justice EJOLT 70 2013 6015 1657
http://t.co/7XWIgmXAsa
From Jan 2017, research data is open by
default, with possibilities to opt out
https://t.co/upxVBWsfd1 Interesting possibility FOSTER 62 1713 2603 2231
https://t.co/RY8RVqRzAO
No more #mountaintopremoval coal mining
in Laciana (Spain) http://t.co/hyiunRIglx
@MiningWatch @mining @londonmining Environmental justice EJOLT 52 2013 6015 1657
http://t.co/gKH51n91GS
BREAKING: Legal case against CEO of
#Chevron submitted to #ICC for crimes
against humanity Environmental justice EJOLT 49 2013 6015 1657
http://t.co/fHO9PXaGyC
http://t.co/ScOCJFEEPOSustainability 2020, 12, 6290 17 of 23
Table 11. Cont.
Tweet The Goal of the Tweet Acronym Number of Retweets Number of Tweets Number of Followers Number Following
Big themes of the #greenlight4oa conference
so far as captured by @Denkschets Event PASTEUR4OA 49 1092 1140 826
https://t.co/PcFu6HsAuG
‘Told you’! The cartoon on #openaccess just
shown by @bernardrentier is made by Information PASTEUR4OA 49 1092 1140 826
@hochstenbach https://t.co/7jITZ6cvr9
#Teachers! Join this #STEM competition and
you might win a trip to #Brussels! Please RT! Interesting possibility SCIENTIX 2 48 8393 9290 7268
More info here: https://t.co/KqzwOv5Cmx
We are looking for teachers to join our 3rd
#Scientix Ambassadors Training Course!
Want to become our Ambassador? Interesting possibility SCIENTIX 2 44 8393 9290 7268
https://t.co/xvbwhAn2vo
NEW: The Global Atlas of Environmental
Conflicts http://t.co/q3XmkFDw1H
#environmentaljustice Find, click... action! Environmental issue EJOLT 42 2013 6015 1657
http://t.co/J819UV7cXg
Is #OpenScience an essential rsrch skill Grad
Schools should train in prep for #REF2020 ? Information FOSTER 41 1713 2603 2231
#OpenSci4Doc @HEIRRI_
We have published the 8 science books for
our #STEMDiscoveryWeek competition!
Start reading now #WorldBookDay . . . Project achievement SCIENTIX 2 41 8393 9290 7268
https://t.co/Ve8OtQONEX
,Celebrating #WomenInScience on
#InternationalWomensDay Information LIN10 40 16,341 5913 1209
https://t.co/XCnQICZQkF
New in the #RRI Toolkit Providing
researchers with skills & competencies to
practise #openscience by . . . Interesting possibility RRI TOOLS 40 6476 2935 1994
https://t.co/XPAy7cewMG
This article shows how important it is to
increase students’ self-confidence and
Information SCIENTIX 2 40 8393 9290 7268
motivation in #STEM subjects
https://t.co/PwuiXzi0EgSustainability 2020, 12, 6290 18 of 23
The results of the Spearman’s correlation analysis of tweet impact indicators are presented in
Table 12. All the presented correlations are significant at the 1% level, and all of them are positive.
A very strong positive correlation (0.922) among the observed tweet impact indicators is visible between
monthly tweets and monthly retweets. A strong positive correlation (0.822) is also present between
monthly tweets and the number of following Twitter accounts every month.
Table 12. Spearman’s correlation analysis of tweet impact indicators.
Tweet_Month RTweet_Month Followers_Month Following_Month
Tweet_Month 1 0.922 ** 0.792 ** 0.822 **
RTweet_Month 1 0.765 ** 0.795 **
Followers_Month 1 0.739 **
Following_Month 1
** Correlation is significant at the 0.01 level (2-tailed).
4. Discussion
As mentioned in the literature review, the impact evaluation of science should include other
information sources in addition to academic citations [5]. This research focuses on the analysis of the
impact evaluation of science on Twitter. Although the results revealed that a moderate percentage of
the observed projects use social networks, there is still room for improvement. For instance, Table 2
reveals that only 30% of the observed projects use Twitter, which is lower than a third of the total
number of projects included in the Science for Society programme. Following recommendations of the
European Union regarding the maximization of the impact of science, and bearing in mind that social
networks are a great means of reaching a wide audience, the number of projects using Twitter (or other
social networks) should be greater.
Besides, when performing exploratory data analysis, the results presented in Table 4 revealed
that among 50 of the most frequently used words in tweets published from the Science in Society
FP7 projects’ Twitter accounts, the most-used word is “science”. Other words in the top five are
“gender”, “RRI”, “conference” and “project”. Considering that the sample in this research is composed
of European research projects focused on science in society, it makes sense that the most-used word
is “science”. Nevertheless, the word “society” has a low frequency in the context of the results
since it is situated below the middle line of the top 50 words and can be found in the 28th place.
Furthermore, if the goal of using Twitter for spreading impact is to be more connected to the public,
researchers should also use other keywords such as the words that people use in their daily life on
Twitter. Words such as “science”, “RRI”, “conference” and “project” are, in fact, specific concepts
from academia and could limit the scope. However, the keyword “gender” is a concept with a high
frequency (being in the second place of the top 50 most-used words) and indicates the relevance of this
topic for all projects. At the same time, this concept has a wider audience than the others and could
easily connect with a more diverse range of people and citizens than the others.
Furthermore, the exploratory analysis presented in Figure 2 and the proximity plot also revealed
that the most frequently used words in addition to the word “science” are “gender”, “women”,
“society”, “innovation” and “education”. This finding means that all of the listed words are topics to
which the projects paid attention. The concern about women in science or the gender dimension of
science is also present in this sample. However, other noted words such as “society”, “innovation”
and “education” indicate that science also aims to be more related to society. Besides, innovation and
education play a crucial role in this aim.
Some of the topics highlighted in Figure 2 and in Table 5, which present topic mapping and
tweet mining, reveal some crucial ideas for advancing in the improvement of the use of Twitter.
First, the phrase “final conference” has a high number of cases (1047 hits), which makes sense because
most researchers mainly use Twitter for final conferences. However, that can also be a limitation.
Researchers should use Twitter during the whole lifetime of a project. Nevertheless, in this research,You can also read