A Drive-through Simulation Tool for Mass Vaccination during COVID-19 Pandemic - MDPI
←
→
Page content transcription
If your browser does not render page correctly, please read the page content below
healthcare
Article
A Drive-through Simulation Tool for Mass
Vaccination during COVID-19 Pandemic
Ali Asgary 1, * , Mahdi M. Najafabadi 2 , Richard Karsseboom 3 and Jianhong Wu 4
 1    Disaster & Emergency Management, School of Administrative Studies and Advanced Disaster,
      Emergency and Rapid Response Simulation (ADERSIM), York University, Toronto, ON M3J 1P3, Canada
 2    Advanced Disaster, Emergency and Rapid Response Simulation (ADERSIM), York University,
      Toronto, ON M3J 1P3, Canada; mirmahdi@yorku.ca
 3    Duty Officer, Departmental Emergency Operations Centre, Community and Health Services, The Regional
      Municipality of York, Newmarket, ON L3Y 4W5, Canada; Richard.Karsseboom@york.ca
 4    Department of Mathematics and Statistics and Laboratory for Industrial and Applied Mathematics,
      York University, Toronto, ON M3J 1P3, Canada; wujh@yorku.ca
 *    Correspondence: asgary@yorku.ca; Tel.: +1-416-736-2100 (ext. 22879)

 Received: 5 October 2020; Accepted: 2 November 2020; Published: 9 November 2020

 Abstract: Several research and development teams around the world are working towards COVID-19
 vaccines. As vaccines are expected to be developed and produced, preparedness and planning for
 mass vaccination and immunization will become an important aspect of the pandemic management.
 Mass vaccination has been used by public health agencies in the past and is being proposed as a viable
 option for COVID-19 immunization. To be able to rapidly and safely immunize a large number of
 people against SARS-CoV-2, different mass vaccination options are available. Drive-through facilities
 have been successfully used in the past for immunization against other diseases and for testing
 during COVID-19. In this paper we introduce a drive-through vaccination simulation tool that can
 be used to enhance the planning, design, operation, and feasibility and effectiveness assessment of
 such facilities. The simulation tool is a hybrid model that integrates discrete event and agent-based
 modeling techniques. The simulation outputs visually and numerically show the average processing
 and waiting times and the number of cars and people that can be served (throughput values) under
 different numbers of staff, service lanes, screening, registration, immunization, and recovery times.

 Keywords: mass vaccination; point of dispensing; drive-through; mass immunization; COVID-19;
 agent-based simulation; discrete event simulation

1. Introduction
     The lockdown forced by the COVID-19 pandemic has reinforced efforts to find effective solutions
to counter SARS-CoV-2. Although there are still lots of unknowns about how SARS-CoV-2 may evolve
in the future, scientists believe that an effective vaccine, if invented and implemented globally, may be
the best solution to end the COVID-19 pandemic [1]. Several institutions and laboratories around the
world are working and sponsoring vaccine research and development to potentially help susceptible
populations to become immune to contamination. According to the New York Times [2], from over
165 coronavirus vaccines that researchers are working on around the world, about 135 are in their
preclinical stage (created in labs but not yet tested on human trials), 21 have entered Phase I (to be
tested for safety and dosage on human trials), 13 are in Phase II (to be tested on an expanded number of
human trials), 8 are in Phase III (to be tested on large-scale human trials), and 2 have already received
approval for limited use. Some experts predict that an approved vaccination solution for large-scale
implementation could be ready as soon as January 2021 or even earlier [1].

Healthcare 2020, 8, 469; doi:10.3390/healthcare8040469                      www.mdpi.com/journal/healthcare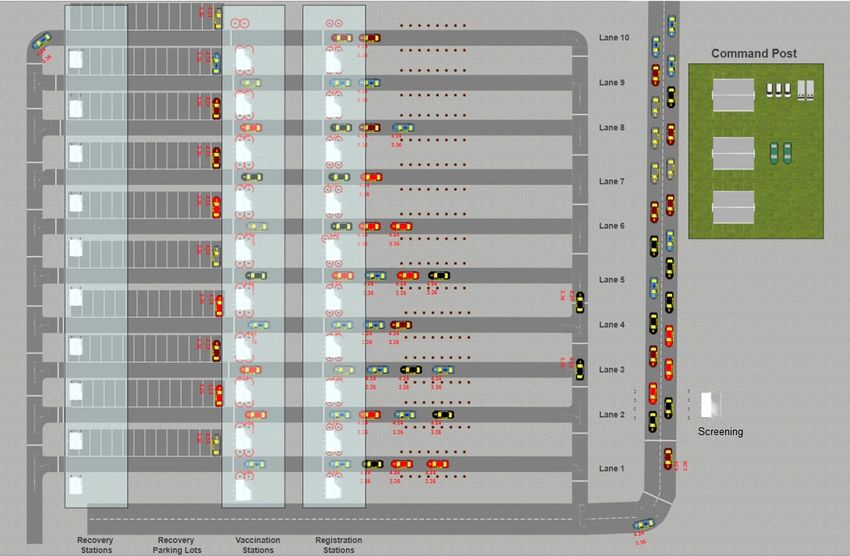
Healthcare 2020, 8, 469                                                                              2 of 21

      To bring the COVID-19 pandemic under control and substantially reduce hospitalization, morbidity,
and mortality rates, and in the meantime reopen the economy, a large portion of susceptible people
should receive the vaccine to become immune to the virus in a short period of time. Thus, similar to
other deadly pandemic cases, as soon as vaccine production reaches the level that it can be offered
to the general public, rapid mass vaccination should be implemented to minimize further human
and economic impacts [1,3–5]. Such a large-scale implementation of the COVID-19 vaccine could be
among the most challenging public health actions of the decade. From a preparation and planning
point of view, this translates into many local mass vaccination sites in each city and town that offer
immunization services.
      However, vaccine development is only the first phase in the COVID-19 immunization process.
After the successful development of COVID-19 vaccine, we will shift into vaccine production,
distribution, and dispensing phases each with their own socio-economic and logistical challenges.
Concurrent supply, distribution and dispensing of the vaccine to billions of people requires significant
planning and preparation in all aspects of COVID-19 vaccination at international, national, and local
levels. Since the ultimate goal of the vaccine process is to immunize the population against SARS-CoV-2,
the success of vaccine development, production, and distribution very much depends on timely and
efficient dispensing which requires extraordinary advance planning and preparation at different
levels [6]. This includes, but is not limited to, vaccination prioritization, vaccination delivery methods,
public awareness, and design of immunization and points of dispensing (PODs) facilities. In this
context, the development of simulation tools that build capacities and enable such planning and
preparation become very essential.
      One of the mass vaccination methods proposed in the literature and used in the past and during
the COVID-19 pandemic for testing is the drive-through method. Drive-through clinics are particularly
important in cases of communicable diseases because people wait in their own vehicles which limits
virus transmission compared to walk-in clinics [7]. Studies and available experiences confirm that
drive-through mass vaccination clinics offer many advantages and can be an efficient system for
rapid and safe vaccinations [5,8,9]. However, rapid mass vaccination using the drive-through method
requires thoughtful and comprehensive planning, design, trained human resources, and sufficient
preparedness to enhance their effectiveness and efficiency [10].
      This paper introduces a simulation tool developed for the design and operation of drive-through
mass vaccination facilities. The tool is developed using a hybrid approach and by integrating discrete
event and agent-based modeling methods. The simulation tool enables users to estimate how many
people may be vaccinated and how many staff are needed to run such facilities efficiently under different
setups and configurations. The simulation can help public health planners and decision makers to
evaluate and understand the repercussions of their mass vaccination plans using drive-through options
(e.g., different number of lanes, different number of personnel, different processing times that represent
different processes). The rest of this paper is organized as follows: In Section 2, we present the
current literature on mass vaccination and specifically on drive-through mass vaccination. In Section 3,
we explain the modeling process and different components of the simulation tool. In Section 4,
we demonstrate some of the model results. This is followed by a discussion and conclusion in Section 5,
which also concludes the paper.

2. Background

2.1. Drive-through in Public Health and Mass Vaccination
     Mass vaccination has been a common strategy in controlling infectious diseases. In the case of
COVID-19, once a vaccine becomes available for the general public or demand for mass flu vaccination
becomes necessary, different mass vaccination methods can be used to ensure wider access to all
segments of the society. Mass vaccination of COVID-19 will not only need to use the existing and
traditional points of dispensing facilities such as clinics, pharmacies, schools, workplaces, nursing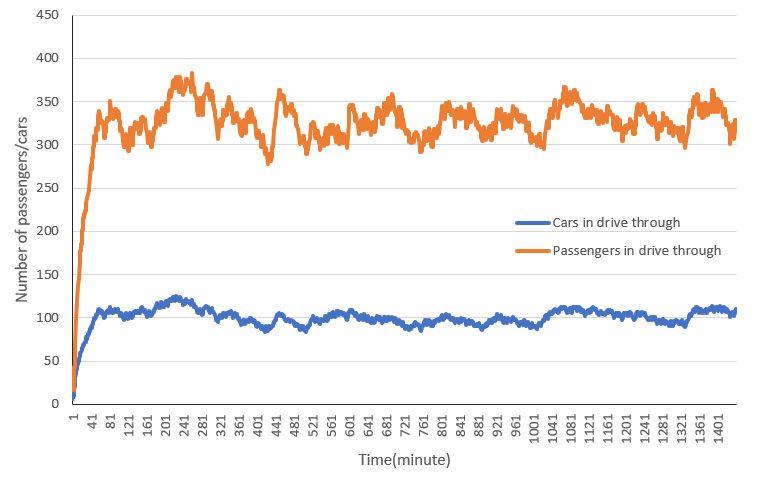
Healthcare 2020, 8, 469                                                                                3 of 21

homes, pharmacies, and places of worships, but also requires the creation of new and innovative
vaccination approaches. This is mainly because the use of some of the above listed facilities and settings
may be inefficient or unsafe for immunization during a deadly infectious disease. While many of these
settings have been used for mass influenza vaccination in the past, additional measures need to be
considered when utilizing them for COVID-19 vaccination to ensure that vaccination sites maintain
safe physical distancing [11].
     Drive-through service delivery is not a new phenomenon. It emerged in the early 20th century
with the massive use of automobiles in urban areas and continued to grow in different forms and
shapes since then. The primary rationale for drive-through facilities is to provide more efficient services.
While drive-through service delivery has a history of several decades now, its use in health services,
particularly for mass vaccination purposes, has been very limited and only dates back to the late
1990s and early 2000s when health agencies started to add drive-through sites as one of their flu shot
dispensing strategies [12–14].
     In drive-through facilities, people are asked to drive to these facilities, register and sign the
consent forms, receive the vaccine, and wait for a few minutes after that while staying in their vehicles
for the entire time [12]. Previous studies have examined some of the direct and indirect advantages
and disadvantages of drive-through facilities for mass immunization [5,7,14–16]. Some of the main
advantages of drive-through facilities are: (1) low disease transmission risk for staff and public; (2) low
exposure to virus (compared to closed settings); (3) large throughput; (4) reduced contamination of
health-settings; (5) visitors’ comfort and protection; (6) serving people with mobility issues; (7) accessible
to individuals in self isolation; and (8) useful for geographically scattered populations [17]. Some of
the key limitations of drive-through facilities include: (1) weather conditions; (2) need for significant
logistical preparation; (3) need large and suitable space; (4) clients that might faint in cars; (5) traffic
issues; (6) difficulty in communication with people in their cars; (7) carbon monoxide exposure of staff;
and 8) accessibility issues for those without cars [9].
     The widespread research and use of the drive-through method for vaccination started during
the 2009 H1N1 influenza pandemic (e.g., the work performed by Shim et al. [18]). Weiss et al. [7]
assessed the feasibility of the drive-through mass vaccination method by analyzing a full-scale human
simulation exercise for influenza vaccination in the USA. They found that the total median length of
stay in a drive-through was 26 min. They did not find any significant carboxyhemoglobin increase
in participants tested. They concluded that drive-through is a feasible and effective alternative to
traditional walk-in clinics by providing faster vaccination under lower disease transmission risks.
Reid [8] compared the efficiency of mass drive-through vaccination facilities versus walk-in clinics
that were established in the US during the 2009 H1N1 influenza pandemic. The study examined
several drive-through vaccination points of dispensing implemented by the Stanwood Camano Fire
Department and some walk-in clinics implemented by local hospitals. The findings of this study
indicated that drive-through facilities outperformed other mass vaccination facilities. In particular,
the study found that the drive-through clinics were able to vaccinate more people, in a shorter time,
while keeping the infectious risks lower.
     Drive-through facilities have been frequently used in some countries during the COVID-19
pandemic for a wide range of health services including COVID-19 testing [19,20]. For example,
Turrentine et al. [21] reported a drive-through that was set up for prenatal services during the
COVID-19 pandemic in the US. In this case, the drive-through was used to protect health care providers
and patients while providing access to this vital health service during the pandemic. They reported
that these drive-through visits provide services that were not possible through telehealth and remote
examinations, while reducing the need for clinical visits and thus reducing the anxiety of patients who
prefer face-to-face visits. Drive-through facilities have also been expanded and used for providing
pharmacy services during COVID-19 [22].
     Another study also found that drive-through vaccination is mostly preferred to other options
especially by those unwilling to leave their work to receive the vaccine. As reported by Bailey et al. [23],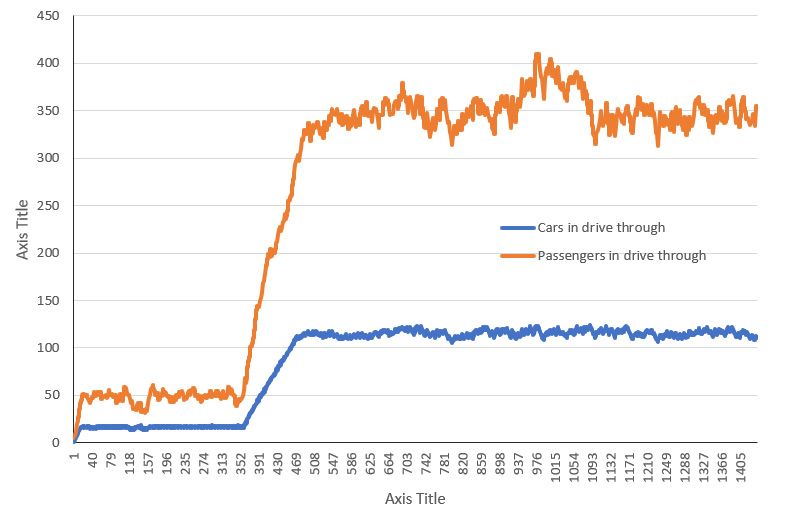
Healthcare 2020, 8, 469                                                                                 4 of 21

using a drive-through facility for seasonal flu vaccination for health workers as they entered their
work places enabled health agencies to vaccinate more health workers in a shorter time frame. Bailey
and her colleagues found that by using a drive-through facility, more health workers were vaccinated
per 100 min during the 2018–2019 flu season conveniently and safely. The study highly recommends
the use of this strategy for future pandemics. According to Nicola et al. [24] and Flynn et al. [16],
due to the lack of enough traditional airborne infection isolation rooms, drive-through testing facilities
are preferred for their shorter testing time, reducing infection among health workers and visitors by
minimizing their exposure, reducing the costs of personal protection measures, and improving the
efficiency and convenience for users.
      Garrison [25] reported a mass drive-through testing facilities created in a large parking lot of
a congregational Church in Birmingham, Alabama, US and reported that in this facility a total of
2216 people were tested over a five day period (17 to 21 March 2020). While 70 positive (3.15%
overall screening yield) cases were reported among those tested in the facility, no cases of direct
patient exposure or health worker contamination were reported. Similarly, Ton et al. [26] reported a
drive-through testing site for COVID-19 that was created on the Mayo Clinic Florida campus and found
that this was an effective method in minimizing patient contact and conserving personal protection
equipment (PPE). Operating six hours per day, seven days a week, and consisting of three stations
(patient identification and handout, assessment, nasal swab collection) staffed by two healthcare
providers, this facility tested 1153 individuals. They also reported that drive-through can be considered
as an effective testing strategy that conserves PPE during the COVID-19 pandemic.
      Finally, Lee and Lee [27] studied drive-through facilities in South Korea for COVID-19 testing.
Drive-through testing was first introduced on February 23rd as a low-cost, fast, and less risky
method in the country. The design of drive-through testing facilities included several stations including
registration, screening, swab sampling, and disinfection using a national standard procedure developed
for drive-through testing facilities. Each test took an average of 10 min per person, which was much
faster compared to alternative options that reported an average of 30 min.

2.2. Design and Operational Challenges of Drive-through Facilities for Mass Vaccination
      Despite their advantages and promising outcomes, the planning, design, and operation of
drive-through facilities for mass vaccination can be challenging [28] due to a number of factors
related to the service area population, existing infrastructure, available logistics, communication,
and coordination and partnership with different stakeholders such as first responders and humanitarian
agencies [29–31]. The number and configuration of drive-through mass vaccination clinics should be
planned based on the demographic attributes of the population, availability of adequate and accessible
space and various staff to run the sites, traffic conditions, and vaccine supply and other logistical issues
such as PPE. The number of sites in each community also depends on the size and spatial distribution
of the population in service areas, availability of alternative mass vaccination clinics, percentage of the
population able to use drive-through facilities, and targeted time frame for mass vaccination.
      The scale of drive-through facilities depends on the availability and size of the available spaces,
operational scope, available staff, and selected layout [12,28]. According to Lee et al. [32], space is a very
dynamic requirement and different sites and scales can be used for drive-through mass vaccination
facilities. When it is not be possible to create a large-enough drive-through facility to vaccinate the
whole population [30], a number of smaller facilities can be set up. This can help in addressing
some of the accessibility and traffic issues of drive-through facilities arising from a large number
of cars trying to enter the drive-through clinic [5]. For example, a large drive-through vaccination
facility in Ohio led to heavy traffic in the neighborhood [33]. To reduce traffic issues, drive-through
vaccination clinics should: (1) be located near major roads, highways, or freeways; (2) have large
access and exit points to support multiple lanes; (3) be large enough to accommodate multiple lanes
for dispensing [33]; and (4) have adequate traffic control and safety plans to prevent traffic overflow
onto adjacent transportation areas.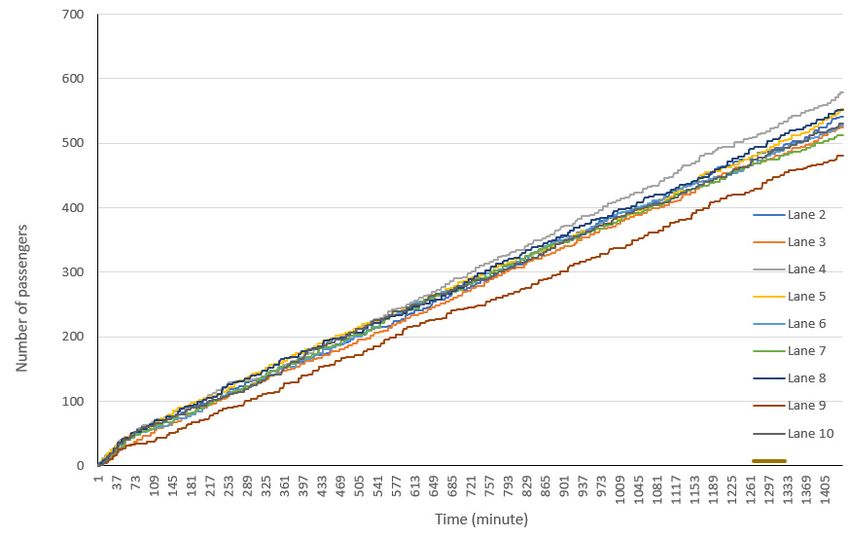
Healthcare 2020, 8, 469                                                                             5 of 21

      Finding suitable locations for drive-through mass-vaccination facilities can also be a challenge.
Drive-through clinics can be located in freeways, arterial highways, large parking lots, inside toll
booths, in large sport fields, and on fairgrounds [34]. A drive-through site needs sufficient space to
accommodate several vaccination lanes and their stations, a command post, an employee rest area,
logistic and vaccination supply storage, IT and administration spaces, and safety and security vehicles
and personnel [34]. For example, a large drive-through facility with 10 lanes is expected to have around
70 medical and non-medical staff per shift [28]. While suitable locations could be in private, public or
government-owned spaces, public and government-owned properties are preferred due to logistic
reasons and security precautions [34].
      Various designs and layouts for drive-through vaccination sites have been suggested and used in
the past [7,27,35,36]. A flu shot drive-through center usually has between two to ten lanes, three to
four stations per lane that include triage and screening, registration, shot dispensing, and recovery and
discharge. Drive-through vaccination sites with more dispensing lanes provide higher throughputs and
can perform better in preventing overflow of traffic onto neighboring streets [28]. Overall, the layout of
drive-through mass vaccination clinics can significantly affect their staffing requirements and overall
efficiency. Lee et al. [32] reported that a design improvement increased throughput by 10%, increased
the utilization of the facility by 18%, and decreased the waiting times in queues and vaccination stations
between 10% to 85%. This facility served between 2000 to 3000 vehicles and their passengers in a day.
      Human resources management at drive-through facilities is another key issue. Each drive-through
station requires an adequate number of medical and non-medical staff with different sets of skills.
In addition to these, drive-through facilities are also supported and managed by incident command posts,
requiring separate staff, space, parking lots, and security precautions. Moreover, large drive-through
sites need to be maintained by local law enforcement, fire departments, emergency services, information
technology service provider(s), and communication units of the responsible jurisdiction [23]. In terms
of operation hours and number of shifts, a drive-through facility can operate 24 hours a day in three
or four shifts depending on staff working hours, clients’ incoming rates in different times of the day,
weather conditions, and lighting.
      Finally, attention must be paid to staff and visitors’ safety and security regarding road traffic,
aggressive behaviors, extreme weather conditions, and virus transmission. Despite its low risk, infection
prevention should still be a priority at drive-through facilities. Considering the transmissibility of the
COVID-19 virus, proper protection of drive-through staff against the infectious disease is very important.
Similarly, even though studies show that security and law enforcement agencies believe that controlling
traffic at a drive-through clinic is an easily manageable task [37], it is important to implement all
necessary risk reduction and safety measures. Furthermore, depending on the local weather conditions
and location, the design of drive-through vaccination facilities should consider weather conditions
such as temperature, humidity, wind, and rain. Although passengers receiving immunization are
mostly protected in their vehicles against weather conditions, staff in drive-through vaccination sites
may be less protected. In harsh weather conditions, a McDonald’s model of drive-through may be an
alternative design option, in which immunization staff will reside inside a covered space or building,
providing the immunization through an open door or window [31]. Effective use of drive-through
facilities also requires public awareness campaigns to inform drive-through clients about what is
expected from them at the clinic. Prior registration and appropriate clothing for vaccination purposes
can save registration and vaccination times [38]. Finally, wearing a face mask reduces the risk of
disease transmission to vaccination staff.

2.3. Drive-through Mass Vaccination Modeling and Simulation Tools
     Several mathematical models, agent-based, discrete event simulations, and multicriteria decision
support systems have been developed and used for mass vaccination research and practice during
the past two decades [5,17,34,36,39–43]. The main focus of these models and simulation tools are site
selection, layout optimization, and resource and staff allocation [44,45]. Aaby et al. [36] developed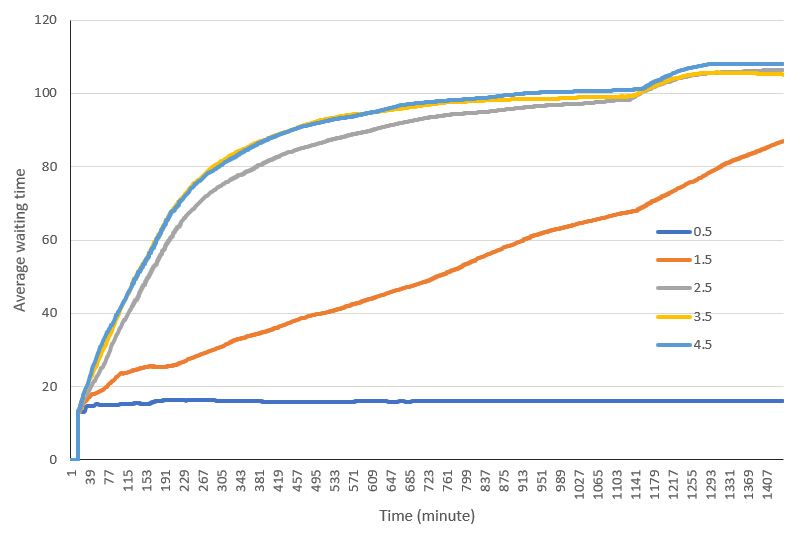
Healthcare 2020, 8, 469                                                                           6 of 21

an excel model named Clinic Planning Model Generator which helps decision makers to choose the
size, number of patients vaccinated, and number of staff needed. They used data from a smallpox
mass vaccination exercise conducted in Maryland (US) to calibrate their model and applied it to an
influenza pandemic scenario. Washington et al. [46] developed a discrete event simulation tool to
evaluate the capabilities and cost of mass influenza immunization clinics [5]. Wiggers et al. [9] and
Gupta et al. [5] studied and simulated a drive-through mass vaccination facility that was set up in the
city of Louisville during November 2009 as part of the HIN1 pandemic response. The facility was
very large with 10 lanes. Using the Tecnomatix Plant Simulation software they developed their model
based on data collected from an H1N1 drive-through vaccination clinic created in Louisville, Kentucky
in 2009. They further extended this model to be applicable to large and small cities. They developed a
customizable optimization tool for the design and operational planning of drive-through vaccination
facilities for decision makers to determine the length and number of drive-through lanes, number
of staff, and the resulting average waiting time. After providing model inputs including population
that needs to be vaccinated, client arrival rates, processing times, and number of dispensing units,
the model determines the required number of lanes, number and length of entrance lanes, number
of lanes for handing out and filling in consent forms, number of detour lanes, personnel needed at
different stops, and the average waiting time.
      Beeler et al. [37] worked on a discrete event simulation of a mass immunization clinic to improve
human resources management of mass influenza immunization clinics. They developed their simulation
using data from some Canadian clinics that responded to the H1N1 pandemic. The key attribute of
this simulation is the inclusion of flu transmission risk in the simulation. They also showed that the
marginal benefit of additional staff in mass vaccination facilities is underestimated when waiting costs
and infection transmission are not taken into consideration.
      Using a genetic algorithm approach, Ramirez-Nafarrate et al. [42] developed a mathematical
model to optimize site selection and capacity of point of dispensing (POD) clinics. Their model allows
decision makers to choose from potential mass vaccination points and suggests how to staff them to
minimize average travel and waiting times.
      Yaylali et al. [10] used simulation and optimization methods to assess and improve mass
vaccination clinics. Using a combination of secondary and primary data, they developed a number of
simulation tools for local mass vaccination clinics including drive-through and school-based facilities.
They utilized discrete event models with 3D visualization of vaccination clinics using the Simio
software. The model generates diverse mass vaccination clinic configurations that can be used to
inform the design and configuration of future mass vaccination clinics. Authors claim that the 3D
model of the clinics helps decision makers to better understand the mathematical models behind it,
and to better compare various clinic setups. Finally, Glass [47] developed a discrete event simulation
that provides the most optimal allocation of resources for mass vaccination clinics while minimizing
medication errors.
      A few mass vaccination site planning tools have emerged as the results of some of this research,
including Maxi-Vac and RealOpt. Maxi-Vac was developed by the US Centers for Disease Control and
Prevention in early 2000s in response to the growing threat of bioterrorism and potential need for mass
vaccination in response. Maxi-Vac is an analytical tool that helps with the optimal design and staff
setup of mass vaccination clinics that can have a range of one to nine stations. It shows how many
people can be vaccinated under different arrangements of the clinic [46,48]. While this tool can be used
for planning drive-through facilities, this type of planning is not its prime focus.
      Lee et al. (2009a) developed a decision support tool called RealOpt using a combination of
mathematical modeling, simulation, and optimization engines, and coupled them with automatic
graph-drawing tools and a user-friendly interface. RealOpt is a decision support tool that helps public
health agencies to find suitable locations for mass vaccination facilities, to design preferred layout
and determine staff resources need and their allocation, to perform disease propagation, analysis and
monitoring, and to develop a variety of “what if” scenarios [5,17,32,34].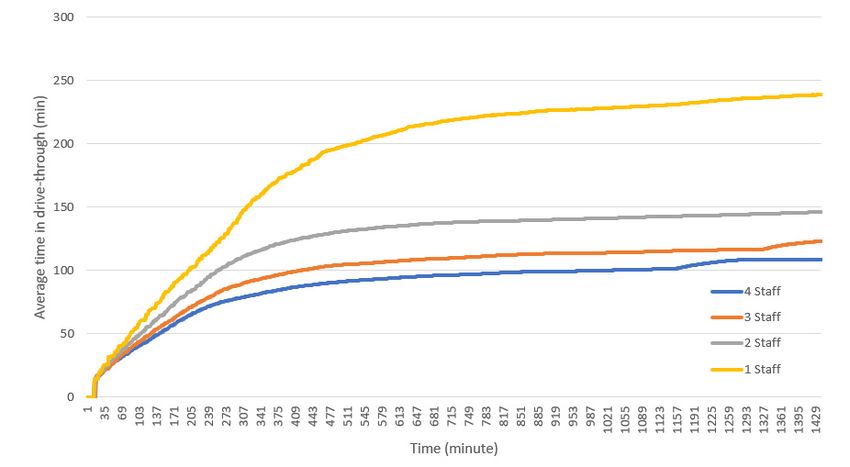
Healthcare 2020, 8, 469                                                                                7 of 21

      Despite the growing research and development in this area, there are still gaps in the current
models that need further research. For example, according to Chiquoine [45], most of the existing
models do not consider the impacts that arrival patterns have on model results, mass vaccination
sites operations, and their transportation-related issues. Additionally, with the recent and continuous
 Healthcare 2020, 8, x                                                                            7 of 23
improvements in computer hardware and software, development of new models and simulations are
becoming more possible and accessible. Finally, new diseases such as COVID-19 pose new challenges
 becoming more possible and accessible. Finally, new diseases such as COVID-19 pose new challenges
which require adjustments in the existing models and simulations.
 which require adjustments in the existing models and simulations.
3. Materials and Methods
 3. Materials and Methods
     For the purpose of this research, we used the AnyLogic (version 8.6-AnyLogic North America,
      For the purpose of this research, we used the AnyLogic (version 8.6-AnyLogic North America,
Oakbrook Terrace, IL, USA) simulation software. Our simulation tool is a combination of agent-based
 Oakbrook Terrace, IL, USA) simulation software. Our simulation tool is a combination of agent-based
and discrete events modeling. The model contains a physical layout, several agents that interact with
 and discrete events modeling. The model contains a physical layout, several agents that interact with
each other based on their predefined logic, and a model logic that implements the policies given to the
 each other based on their predefined logic, and a model logic that implements the policies given to
model as user inputs.
 the model as user inputs.
3.1. Drive-through Layout
 3.1. Drive-through Layout
      The full layout (Figure 1) consists of ten service lanes, which can be turned on and off by the
       The full layout (Figure 1) consists of ten service lanes, which can be turned on and off by the
user at the beginning of the simulation. The area (except the command post side) is 150 m by 130 m.
 user at the beginning of the simulation. The area (except the command post side) is 150 m by 130 m.
Cars enter the model at a given rate and go through a screening booth (a single service station before
 Cars enter the model at a given rate and go through a screening booth (a single service station before
dispatching the cars into different lanes). A fraction of cars will be rejected at this stage and take
 dispatching the cars into different lanes). A fraction of cars will be rejected at this stage and take the
the bypass extension to skip all service lanes and go out of the model. The rest of the cars will be
 bypass extension to skip all service lanes and go out of the model. The rest of the cars will be
disseminated to service lanes based on the existing queues in service lanes and based on user choices
 disseminated to service lanes based on the existing queues in service lanes and based on user choices
on High Occupancy Vehicles (HOVs) and Low Occupancy Vehicles (LOVs). Each lane consists of
 on High Occupancy Vehicles (HOVs) and Low Occupancy Vehicles (LOVs). Each lane consists of
multiple
 multiplebooths
            booths(service stations)
                     (service        that that
                               stations)  offer offer
                                                registration (and consent
                                                      registration        to receive
                                                                   (and consent    tovaccination), delivering
                                                                                      receive vaccination),
ofdelivering
   the vaccination,  and  recovery.
             of the vaccination, and recovery.

                    Figure1.1. The
                   Figure      The 2D
                                   2D layout
                                       layout of
                                              of the
                                                 the drive-through
                                                     drive-through mass
                                                                   mass vaccination
                                                                        vaccination simulation
                                                                                    simulationtool.
                                                                                               tool.

 3.2. Drive-through Model Agents and Processes
      Following modeling best practices, we have defined two super-agent types for agents with
 similar behaviors in different parts of the model. One super-agent pertains to the staff type (human
 agent) and the other is for different types of service stations. There are four subclasses in the model
 inherited from each of the super-agents above.
Healthcare 2020, 8, 469 8 of 21
3.2. Drive-through Model Agents and Processes
Following modeling best practices, we have defined two super-agent types for agents with similar
behaviors in different parts of the model. One super-agent pertains to the staff type (human agent) and
the other is for different types of service stations. There are four subclasses in the model inherited from
each of the super-agents above.
ABS_Staff is a super-agent that represents all staff in the model. Each staff has several properties
including parameters that connect it to PointNodes in the physical layout, variables that allow the staff
to know the car being served at the time, as well as resource units that it will utilize at runtime. Staff_S
represents the staff working in the screening booth. Since the model has only one screening booth
and each booth has up to four staff, there can be up to four instances of this agent type in the model
(i.e., the population of this agent will contain up to four agents). Staff_R represents the staff working
in the registration booths. The model supports up to ten registration booths (one per service lane)
and each booth has up to four staff. Thus, the population of this agent will contain up to 40 agents.
Staff_V represents the staff working in the vaccination delivery booths. The model supports up to ten
vaccination booths (one per service lane) and each booth has up to four staff. Thus, the population of
this agent will contain up to 40 agents. Staff_RE represents the staff working in the recovery booths.
The model supports up to ten recovery booths (one per service lane) and each booth has up to four
staff. Thus, the population of this agent will contain up to 40 agents.
The specific service stations instantiated from the service super-agent are: a screening booth;
a number of registration booths; vaccination booths; and recovery booths. There is only one screening
booth in the model, but since the model supports up to ten service lanes, there can be up to ten instances
of each type of the rest of the service stations, as described here.
ABS_Station is a super-agent that represents service stations in the model. Each station has
several properties including parameters that connect it to PointNodes in the physical layout, variables
that allow the station to know the car being served at the time, as well as resource units that it will
utilize at the runtime. Four subagent types are created from this abstract agent type, as follows:
(1) St_Screen represents screening station, and the model has only one instance of it. This agent
contains the population (instances) of the Staff_S agents (up to four, as stated above); (2) St_Register
represents registration stations. The model populates one registration station instance per active service
lane. Thus, there can be up to ten registration service stations in the model. The St_Register agent
type contains a statechart that keeps track of the state of its instances, and toggles between the “idle”
and “serving” modes accordingly. This agent also contains the population (instances) of the Staff_R
agents (up to four, as stated above, per station); (3) St_Vaccine represents vaccination delivery stations.
The model populates one vaccination station instance per active service lane. Thus, there can be up to
ten vaccination service stations in the model. The St_Vaccine agent type contains a statechart that keeps
track of the state of its instances, and toggles between the “idle” and “serving” modes accordingly.
This agent also contains the population (instances) of the Staff_V agents (up to four, as stated above,
per station). St_Recovery represents recovery stations. The model populates one recovery station
instance per active service lane. Thus, there can be up to ten recovery service stations in the model
This agent contains the population (instances) of the Staff_RE agents (up to four per station).
Besides the human and non-human agents listed above, there are other agents defined in the
model, as described here. ServiceLane is a less tangible agent type. In fact, the redundant nature of
service lanes calls for designing this agent type to allow replication of one logic for all service lanes.
As explained before, each service lane contains its specific registration station, vaccination station,
and recovery station. The logic of how an incoming car enters the service lane, moves from a station to
the next station, and finally leaves the service lane, is defined by a flowchart in the ServiceLane agent
type (Figure 2).model, as described here. ServiceLane is a less tangible agent type. In fact, the redundant nature of
service lanes calls for designing this agent type to allow replication of one logic for all service lanes.
As explained before, each service lane contains its specific registration station, vaccination station,
and recovery station. The logic of how an incoming car enters the service lane, moves from a station
to the next
Healthcare 2020,station,
8, 469 and finally leaves the service lane, is defined by a flowchart in the ServiceLane
9 of 21
agent type (Figure 2).
Figure 2. The service lanes flowchart of the drive-through mass vaccination
vaccination simulation
simulation tool.
tool.
The
The number
numberofofservice
servicelanes created
lanes in the
created in model depends
the model on theon
depends user
theinput
userand can and
input varycan
between
vary
one and ten.
between Car agent
one and represents
ten. Car incoming incoming
agent represents cars, entering
cars, the drive-through
entering clinic for receiving
the drive-through clinic for
vaccination services. The
receiving vaccination incoming
services. The cars are generated
incoming at a user-defined
cars are generated rate, and asrate,
at a user-defined soonand
as they leave
as soon as
the
theyrecovery area,
leave the they are
recovery deleted
area, theyfrom the model.
are deleted fromThere are separate
the model. Theremodel variablesmodel
are separate that record the
variables
total count of cars that enter the clinic. The car agent type contains variables to keep a calculated delay
time per service station based on a number of given variables, explained in the Model Logic. The car
agent has a statechart through which the service station of the car is maintained. Each instance of the
car contains a specific population of the Passenger agent.
Passenger agent is the most granular agent type in the model, which represents a car passenger.
Each car can have between one and five passengers, and each passenger is either an adult or a child
(non-adult). The difference between the two is in the registration phase, as the non-adult should give
consent through one of his/her accompanying adults, which assumedly takes less registration time.
3.3. Simulation Inputs and Outputs
To allow user control over the simulation, several parameters are set by user input before the
simulation run begins. Below is a list of all user inputs and their default values, as well as their
acceptable range (if any). The user input panel is also shown in Figure 3.
• Open service lanes (minimum: 1; maximum: 10; default: 10).
• Number of staff serving in each open service lane (minimum: 2; maximum: 4; default: 4).
• Choice to dedicate lanes to High Occupancy Vehicles (HOVs) to allocate specific lanes to them or
not. This policy requires and enforces that all ten service lanes be in operation.
• Number of lanes assigned to the HOVs (minimum: 1; maximum: 9; default: 5).
• Choice to automatically optimize the number of HOV lanes according to the last hour
queue patterns.
• Choice to parallelize service where possible (if enough staff are available at the LOV station) to
Low Occupancy Vehicles (LOVs). This policy choice is only available if the HOV choice is selected.
• Choice to allow pre-registration of clients (default: false), as well as the fraction of clients (at car
level) that preregister (default if pre-registration is chosen: 75%), and the timesaving factor that
becomes effective for the pre-registered clients (default if pre-registration is chosen: 25%);
• Average registration and vaccination times per person (default: 6.44 and 5.36 min respectively).
• Average recovery time per car (default: 5 min).
• Minimum and maximum passengers in a car (default: 1 and 5, respectively).
• Fraction of dependent children (except the driver) on average (default: 20%).
• Number of incoming cars per minute (default: 5).
• Fraction of cars rejected from the screening booth (default: 1%).
• Number of shifts per day.
• Working hours per shift.
• Number of days (for the whole simulation run).Healthcare 2020, 8, 469 10 of 21
Healthcare
Healthcare 2020,
2020, 8,
8, xx 10
10 of
of 23
23
Figure
Figure 3.
3. Simulation
Figure 3. Simulation setup
setup panel.
setup panel.
panel.
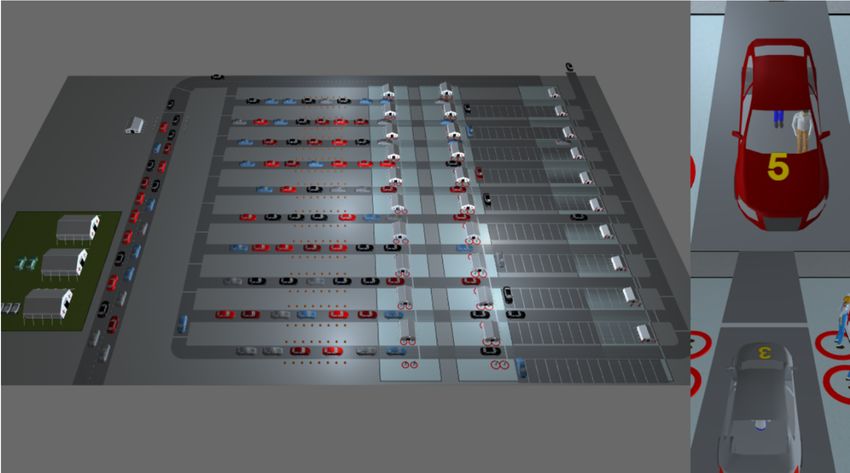
Model outputs can
Model outputs can be
be viewed
viewed as
as 2D
2D and
and 3D
3D models
models (Figure
(Figure4),
4),charts,
charts,and
anddashboard.
and dashboard.
dashboard.
Figure
Figure 4.
4. 3D
3D view
view of
of the
the drive-through
drive-through mass
mass vaccination
vaccination simulation
simulation tool.
tool.
Figure 4. 3D view of the drive-through mass vaccination simulation tool.
4.
4. Results
Results
Results
In
In this section we
this section we present
present the
the results
results of
of several
several experiments
experiments including
including parameter
parameter variation
variation and
and
sensitivity
sensitivity analysis of the proposed simulation model. The base experiment is one realization of
sensitivity analysis
analysis of
ofthe
theproposed
proposed simulation
simulation model.
model.The base
The experiment
base is
experiment one
is realization
one of the
realization of
the
simulation.
the simulation.
simulation.Healthcare 2020, 8, 469 11 of 21
4.1. Base Experiment
We ran the simulation with all lanes open in full capacity (four staff in each station). This runs the
model for 1 day with three shifts under a fixed rate of 5 incoming cars per minute. Parameter settings
for this experiment are shown in Table 1. The user can change all the parameters from the user control
panel before running the simulation.
Table 1. Parameter values for the base experiment.
Parameters Value
Greeting and screening time per car (minute) Uniform (0.25, 0.5)
Average registration time (minute) per passenger 4.24 *
Average vaccination/dispensing time per passenger (minute) 3.36 *
Minimum number of passengers 1
Maximum number of passengers 5
Fraction of non-adult passengers 0.2
Number of incoming cars per minute 5
Fraction of cars rejected at the screening 0.01
Number of shifts per day 3
Hours of operations in each shift 8
Number of days 1
Lanes open 1, 2, 3, 4, 5, 6, 7, 8, 9, 10
Staff in each station 4
Pre-registration No
High occupancy vehicle lane No
*. Based on Wiggers et al. [9].
The cumulative and non-cumulative number of cars and passengers that entered and exited the
drive-through are presented in Figure 5. In this model setting, a total of 1771 cars and 5330 passengers
used the drive-through, while around 120 cars and around 290 to 380 passengers were in the
drive-through
Healthcare 2020, 8, after
x reaching its full capacity. 12 of 23
Figure Cumulative
Figure 5.5.Cumulative and non-cumulative
and non-cumulative number number of passengers
of cars and cars and using
passengers using the
the drive-through
drive-through
facility. facility.
Figure
Figure 66shows
showsthethe
total number
total of passengers
number servedserved
of passengers in eachinlane.
eachSome
lane.differences are observed
Some differences are
among the total number of cars and passengers for each lane.
observed among the total number of cars and passengers for each lane.
As illustrated in Figure 7, most cars spend between 80 to 90 min in the drive-through on average.
Early users spend less time in the drive-through, however as more cars enter the drive-through
and queues are formed, the wait time and thus the total time spent in the drive-through increases.
The maximum time spent in the drive-through in this run is 96 min.Figure 5. Cumulative and non-cumulative number of cars and passengers using the drive-through
facility.
Figure
Healthcare 2020,68, shows
469 the total number of passengers served in each lane. Some differences are
12 of 21
observed among the total number of cars and passengers for each lane.
Healthcare 2020, 8, x 13 of 23
Figure 6.
Figure Number of
6. Number of passengers
passengers using
using the
the drive-through
drive-through facility
facility by
by lanes.
lanes.
As illustrated in Figure 7, most cars spend between 80 to 90 min in the drive-through on average.
Early users spend less time in the drive-through, however as more cars enter the drive-through and
queues are formed, the wait time and thus the total time spent in the drive-through increases. The
maximum time spent in the drive-through in this run is 96 min.
Figure 7. Average waiting time in the drive-through.
Figure 7. Average waiting time in the drive-through.
4.2. Parameter Variations and Sensitivity Analyses
4.2. Parameter Variations and Sensitivity Analyses
In this section we present the simulation results by varying different parameters and options
including In this section
number we present
of lanes, number theofsimulation
staff in eachresults byand
station, varying different parameters and options
pre-registration.
including number of lanes, number of staff in each station, and pre-registration.
4.2.1. Number of Lanes
4.2.1. Number of Lanes
The simulation tool allows for running the drive-through with different lanes and configurations
(all firstThe
fivesimulation tool allows
lanes, alternate lanes,for running
etc.). Figurethe drive-through
8 presents with different
the simulation resultslanes and configurations
for different numbers
of open lanes. In these experiments, we opened consecutive lanes starting from lane 1. As numbers
(all first five lanes, alternate lanes, etc.). Figure 8 presents the simulation results for different shown
inof open 8,
Figure lanes. In number
as the these experiments,
of open lanes we opened
increases,consecutive lanes starting
the total number of carsfrom
and lane 1. As shown
passengers in thein
Figure 8, as the
drive-through number
also of open
increase. As lanes increases,
expected, the totalmore
by opening number of cars
lanes and passengers
the average in the
time spent indrive-
the
through also increase. As expected, by opening more lanes the average time
drive-through facility decreases. For example, when one lane is operating, the average time spent in spent in the drive-
through
the facility for
drive-through decreases.
each carFor example,
is very when
high and one lane
reaches closeisto
operating,
180 min. the average
However, time10spent
when lanesinare
the
drive-through
opened, for each
the average time car
spentis in
very high and reaches
drive-through closetoto
decreases 180 min.
around However, when 10 lanes are
75 min.
opened, the average time spent in drive-through decreases to around 75 min.of open lanes. In these experiments, we opened consecutive lanes starting from lane 1. As shown in
Figure 8, as the number of open lanes increases, the total number of cars and passengers in the drive-
through also increase. As expected, by opening more lanes the average time spent in the drive-
through facility decreases. For example, when one lane is operating, the average time spent in the
drive-through
Healthcare 2020, 8, for
469 each car is very high and reaches close to 180 min. However, when 10 lanes are
13 of 21
opened, the average time spent in drive-through decreases to around 75 min.
Healthcare 2020, 8, x 14 of 23
Figure Number of
Figure8.8. Number ofpassengers
passengers(top
(topleft)
left) and
and carscars (top
(top andand
right)
right) average
average timetime
spentspent
in theindrive-
the
drive-through (below) using different numbers of
through (below) using different numbers of lanes. lanes.
4.2.2. Number of Staff in Each Station
4.2.2. Number of Staff in Each Station
The simulation currently considers a minimum of one and a maximum of four staff in each station,
The simulation currently considers a minimum of one and a maximum of four staff in each
however, the staff number can be adjusted to include more if needed. It is assumed that each staff
station, however, the staff number can be adjusted to include more if needed. It is assumed that each
provides service to one passenger at a time and thus additional staff can provide additional service if
staff provides service to one passenger at a time and thus additional staff can provide additional
the incoming cars in the lanes have more than one passenger. In other words, if the number of staff in
service if the incoming cars in the lanes have more than one passenger. In other words, if the number
each station is four, all four staff can provide service concurrently in cases that incoming cars have four
of staff in each station is four, all four staff can provide service concurrently in cases that incoming
or more passengers. Because in this model, the incoming cars choose the lane with minimum cars in
cars have four or more passengers. Because in this model, the incoming cars choose the lane with
the queue, there are a considerable number of occasions where this situation can occur. Figure 9 shows
minimum cars in the queue, there are a considerable number of occasions where this situation can
the cumulative number of passengers, cars, and the average time spent in the drive-through under
occur. Figure 9 shows the cumulative number of passengers, cars, and the average time spent in the
various numbers of staff in each station: 1, 2, 3, and 4 staff respectively. As illustrated in this figure,
drive-through under various numbers of staff in each station: 1, 2, 3, and 4 staff respectively. As
increasing the number of staff increases the number of cars using the drive-through and passengers
illustrated in this figure, increasing the number of staff increases the number of cars using the drive-
receiving the service. Furthermore, as a result of this increase in staff, the average time spent per car in
through and passengers receiving the service. Furthermore, as a result of this increase in staff, the
the drive-through decreases.
average time spent per car in the drive-through decreases.
4.2.3. Pre-Registration
Pre-registration is one way to increase the efficiency of the drive-through vaccination by reducing
the registration time, which is the lengthiest stage in the vaccination process. Pre-registration can be
done through an online registration portal. In this experiment we allow the simulation to run with
a pre-registration option but with different percentages of pre-registration. We assumed that 100%,4.2.2. Number of Staff in Each Station
The simulation currently considers a minimum of one and a maximum of four staff in each
station, however, the staff number can be adjusted to include more if needed. It is assumed that each
staff provides
Healthcare service to one passenger at a time and thus additional staff can provide additional
2020, 8, 469 14 of 21
service if the incoming cars in the lanes have more than one passenger. In other words, if the number
of staff in each station is four, all four staff can provide service concurrently in cases that incoming
75%,have
cars 50%,four
25%,orand 0% passengers.
more of passengers have pre-registered
Because in this model, for thevaccination
incoming carsin respective
choose thesimulation
lane with
runs. By doing so, the registration time is reduced by 50%. Although
minimum cars in the queue, there are a considerable number of occasions where this not currently included
situationin this
can
simulation,2020, it
8, is
x possible to allocate special lanes to pre-registered visitors that significantly
occur. Figure 9 shows the cumulative number of passengers, cars, and the average time spent in the
Healthcare reduces
15 of 23
their waiting times, to encourage more pre-registration. Figure 10 shows the
drive-through under various numbers of staff in each station: 1, 2, 3, and 4 staff respectively. Ascumulative (a) and
non-cumulative
illustrated in this(b)figure,
number of passengers
increasing and cars
the number ofinstaff
the increases
drive-through when allowing
the number pre-registration.
of cars using the drive-
As expected, pre-registration yields higher throughput in terms of the total number
through and passengers receiving the service. Furthermore, as a result of this increase in staff, of passengers using
the
the service and decreases the average time spent
average time spent per car in the drive-through decreases. on the drive-through in some cases (but not always).
Healthcare 2020, 8, x 15 of 23
Figure 9. Simulation results (passengers, top left; cars, top right; average waiting time, bottom) under
different numbers of staff in each station.
4.2.3. Pre-registration
Pre-registration is one way to increase the efficiency of the drive-through vaccination by
reducing the registration time, which is the lengthiest stage in the vaccination process. Pre-
registration can be done through an online registration portal. In this experiment we allow the
simulation to run with a pre-registration option but with different percentages of pre-registration.
We assumed that 100%, 75%, 50%, 25%, and 0% of passengers have pre-registered for vaccination in
respective simulation runs. By doing so, the registration time is reduced by 50%. Although not
currently included in this simulation, it is possible to allocate special lanes to pre-registered visitors
that significantly reduces their waiting times, to encourage more pre-registration. Figure 10 shows
the cumulative (a) and non-cumulative (b) number of passengers and cars in the drive-through when
allowing pre-registration. As expected, pre-registration yields higher throughput in terms of the total
number of passengers
Figure using
Simulation
9. Simulation the
results service and
(passengers, topdecreases
left; cars, theright;
cars, top
top average time
average spenttime,
waiting on the drive-through
bottom) under
Figure 9. results (passengers, top left; right; average waiting time, bottom) under
in some cases (but not always).
different numbers of staff in each station.
different numbers of staff in each station.
4.2.3. Pre-registration
Pre-registration is one way to increase the efficiency of the drive-through vaccination by
reducing the registration time, which is the lengthiest stage in the vaccination process. Pre-
registration can be done through an online registration portal. In this experiment we allow the
simulation to run with a pre-registration option but with different percentages of pre-registration.
We assumed that 100%, 75%, 50%, 25%, and 0% of passengers have pre-registered for vaccination in
respective simulation runs. By doing so, the registration time is reduced by 50%. Although not
currently included in this simulation, it is possible to allocate special lanes to pre-registered visitors
that significantly reduces their waiting times, to encourage more pre-registration. Figure 10 shows
the cumulative (a) and non-cumulative (b) number of passengers and cars in the drive-through when
Figure 10. Cont.
allowing pre-registration. As expected, pre-registration yields higher throughput in terms of the total
number of passengers using the service and decreases the average time spent on the drive-through
in some cases (but not always).Healthcare 2020, 8, 469 15 of 21
Healthcare 2020, 8, x 16 of 23
Healthcare 2020, 8, x 16 of 23
Figure 10. Total
Figure 10. Total number
number ofof passengers
passengers and
and cars
cars in
in drive-through
drive-through when
when allowing
allowing for
for pre-registration
pre-registration
and
and assuming
assuming that
that pre-registration
pre-registrationreduces
reducesthe
theregistration
registrationtime
timeby
by50%.
50%.
4.2.4. Arrival Rate and Schedule
4.2.4. Arrival Rate and Schedule
Arrival rate can be defined in a number of ways including fixed rates, arrival schedule, arrival
Arrival rate can be defined in a number of ways including fixed rates, arrival schedule, arrival
timetable, etc. In this experiment we run different experiments with different arrival rates ranging
timetable, etc. In this experiment we run different experiments with different arrival rates ranging
from 0.5 cars per minute to 5 cars per minute (Figure 11). The results show that an increase in the
from 0.5 cars per minute to 5 cars per minute (Figure 11). The results show that an increase in the
arrival rate increases the number of people receiving service and also increases the average time spent
arrival rate increases the number of people receiving service and also increases the average time spent
in the drive-through.
Figure 10. Total However,
number of these values
passengers remain
and cars inunchanged
drive-throughwith higher
when values
allowing forofpre-registration
arrival rates due
in the drive-through. However, these values remain unchanged with higher values of arrival rates
and assuming that pre-registration reduces the registration
to the unchanged (and limited) capacity of the drive-through facility. time by 50%.
due to the unchanged (and limited) capacity of the drive-through facility.
Because a fixed arrival rate, particularly when the drive-through is running for 24 h, may not be
4.2.4. Arrival
realistic, we ranRate and Schedule
an experiment in which car arrival rate changes during different hours of the day.
Figure
Arrival12rate
shows
can the numberinof
be defined passengers,
a number of wayscarsincluding
and averagefixedtime
rates,spent in schedule,
arrival the simulated
arrival
drive-through under various arrival rates using the rate schedule option in the
timetable, etc. In this experiment we run different experiments with different arrival rates AnyLogic simulation
ranging
software.
from 0.5Incars
thisper
example
minute a lower arrival
to 5 cars per rate has (Figure
minute been considered
11). The for the night
results showhours
that an (12increase
a.m.–6 a.m.)
in the
and higher values have been assigned to daytime (6 a.m.–12 p.m. and 12 p.m.–6 p.m.)
arrival rate increases the number of people receiving service and also increases the average time spent and evening
hours (6 drive-through.
in the p.m.–12 a.m.). The results these
However, show values
that arrival
remain rates yield lower
unchanged number
with higherofvalues
cars and of passengers
arrival rates
and significant variations of average processing time throughout
due to the unchanged (and limited) capacity of the drive-through facility. the day.
Figure 11. Cont.You can also read