Medical Workforce Census Report 2020 - The Royal College of Anaesthetists
←
→
Page content transcription
If your browser does not render page correctly, please read the page content below

Medical Workforce
Census Report 2020

                     | 1
2 |
Medical Workforce Census Report 2020

Medical Workforce
Census Report 2020

© 2020 Royal College of Anaesthetists

No part of this publication may be reproduced, stored in a retrieval system, or transmitted in any form or by any
other means,electronic, mechanical, photocopying, recording, or otherwise, without prior permission, in writing, of
the copyright holders.

Whilst the Royal College of Anaesthetists has endeavoured to ensure that this document is as accurate as possible
at the time it was published, it can take no responsibility for matters arising from circumstances which may have
changed, or information which may become available subsequently.

All enquiries in regard to this report should be addressed to:
The Training Department
Royal College of Anaesthetists
Churchill House
35 Red Lion Square
London WC1R 4SG

020 7092 1500
workforce@rcoa.ac.uk
rcoa.ac.uk/workforce

Design and layout by the Royal College of Anaesthetists.

                                                                                                                 | 1
Medical Workforce Census Report 2020

Contents
Acknowledgements                                3    On call gaps in trainee/SAS rotas            28
Foreword                                        4    Locums                                       31
Summary of main findings                        5    Job plan content                             33
Background                                      6    Starting number of supporting professional
                                                     activity programmed activities               33
Method                                          8
                                                     Three session days                           33
Consultant workforce                            9    Flexible sessions                            33
Number of consultants                           9    Evening sessions                             33
Consultant workforce growth                   10     Weekend sessions                             35
Gender                                        10
Participation rates                             11   Additional clinical work                     42
Age distribution                               12    On call                                      45
Number of consultants with programmed activities     On call frequency                            45
in specialty areas                            14
                                                     Senior anaesthetists                         46
Specialty and associate specialist doctors           Retirement                                   47
(SAS) and trust doctor workforce               15
                                                     Retire and return                            48
Number of SAS and trust doctors                15
Gender                                         16    Impact of change in pension tax rules        49
Number of SAS doctors with programmed                Recruitment                                  51
activities in specialty areas                   17   Future requirements                          53
Workforce gaps                                 18    Hospital and department data                 54
Gaps due to leave                              18
                                                     Conclusion                                   57
Unfilled posts                                 18
                                                     Key areas to explore in the future           58
Aspirational gap                               22
                                                     References                                   59
Anaesthesia associate workforce                23
Anaesthetists in training and
non-consultant, non-training roles            24
Numbers of anaesthetists in training and
non-consultant, non-training roles             25
Gender of anaesthetists in training and
non-consultant, non-training roles             25
Relationship between trainee numbers and
local workforce gap                            26
Anaesthetists in training gaps                 26
Additional trainee capacity                    27

2 |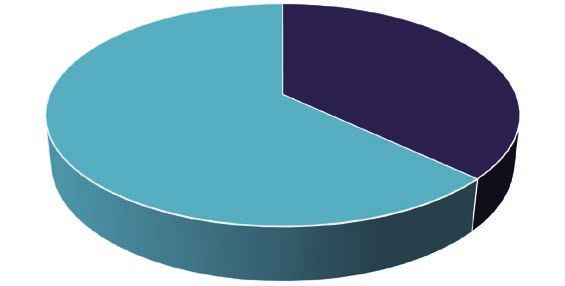
Medical Workforce Census Report 2020

Acknowledgements
The Royal College of Anaesthetists (RCoA) would like to express their thanks to the people that were
closely involved in preparing the Medical Workforce Census Report 2020.

Dr Hamish McLure, main author, RCoA Council Member, Chair of Clinical Director Executive, Member
of the RCoA Workforce and Strategy Committee; Leeds Teaching Hospitals NHS Trust
Dr Phil Antill, Co-author, Advanced Trainee in Anaesthesia and Intensive Care Medicine, York Teaching
Hospital NHS Foundation Trust
Afsana Choudhury, Co-author, Workforce Planning and Recruitment Coordinator
Russell Ampofo, Director of Education, Training and Examinations
Claudia Moran, Head of Training
Chris Bampton-Clare, Quality Data Coordinator
Neil Wiseman, Training Manager
The RCoA Training Department
Elena Fabbrani, Policy and Patient Information Manager
Anamika Trivedi, Website and Publications Officer

The Medical Workforce Census Report would not have been possible without clinical directors and
College tutors freely giving their valuable time to complete the survey. They are to be congratulated for
helping to provide an invaluable snapshot of the anaesthesia workforce in the UK.

We would also like to extend our thanks to the regional advisers anaesthesia, heads of schools,
training programme directors and the administrative staff based at the trusts and boards who helped
gather the data.

                                                                                                       | 3
Medical Workforce Census Report 2020

Foreword
We will all remember 2020 as a very difficult year. The COVID-19 pandemic
dramatically changed our personal and professional lives. Almost every
doctor experienced new pressures and challenges working in an environment
that posed a very real risk to their own health and caring for patients with a
new and unfamiliar illness for which there were limited treatment options. The
rapid influx of critically ill patients with COVID-19 threatened to overwhelm critical care
units, requiring conversion of operating theatres and post-anaesthesia care units into surge capacity
critical care unit beds. Anaesthetists were redeployed to provide round-the-clock care looking after
critically ill patients and providing support for intensive care colleagues. Beyond the critical care units,
anaesthetists trained and guided ward doctors in the management of acutely ill patients. Some returned
from retirement and others volunteered to cover newly set up Nightingale hospitals. As the initial wave
settled, departments of anaesthesia faced new challenges providing additional anaesthetists for elective
sessions in ‘clean’ independent sector hospitals as well as in their own base hospitals. During this busy
time, some anaesthetists were shielding, others were sick and some were isolating due to illness in
household members.

These pressures are continuing. At the time of writing, numbers of COVID-19 positive tests are rising
again across Europe and the profession is bracing itself for another surge. The skills, knowledge and
dedication evident in the specialty of anaesthesia have never been more necessary, and the impact
of workforce shortages have never been more acutely felt by those on the frontline. The additional
pressure of covering unfilled posts and absent colleagues leads to stress and burnout. Patient care
suffers and colleagues leave the profession.

The 2020 census data collection was completed just before the pandemic struck. A repeat
exercise now would probably show a worse position. Whether there will be an effective vaccine is
unknown and it is likely that we will be working in the shadow of COVID-19 for a prolonged period.
The specialty of anaesthesia will remain at the centre of our response to this virus, so we need to invest
in the workforce, keeping these highly skilled doctors fit, healthy and ready to deal with further surges.
Ensuring that there are enough anaesthetists is a key part of that strategy and to do that we need to
know where we are now.

The 2020 census is a rich source of workforce data, highlighting where workforce pressures across
the UK already exist. I would like to thank the clinical directors, lead clinicians and College tutors who
recognised the importance of this exercise and used their precious time to complete the survey. The
high response rate of 97% from trusts across the UK was a significant testament to the willingness and
professionalism of the respondents and the recognition of the importance attached to this vital aspect
of College activity.

I would like to thank Hamish McLure and Phil Antill for collating and analysing the information, and
I would particularly like to thank Afsana Choudhury for her tireless work in coordinating the data
collection and for her communications work which has been crucial to the success of this census report.

It gives me great pleasure to introduce the census report. This is a report which highlights the current
state of UK anaesthesia workforce in 2020.

Professor Ravi Mahajan
RCoA President

4 |

Medical Workforce Census Report 2020

Summary of main findings
  Consultant workforce                                  Anaesthesia associates
  Results showed that the consultant workforce          There were 173 anaesthesia
  in the UK had reached 7,959, growing at an            associates recorded as part of
  average 2.1% per year since 2007.                     the census. The University of
                                                        Birmingham reported in 2020 that
  Specialty and associate specialist                    205 have qualified.
  doctors (SAS) and trust doctors
  SAS and trust doctor numbers are unchanged            Anaesthetists in training
  compared with the 2015 census, despite an             There were 4,311 trainees of various grades
  increase in service demand, which is likely           (core training years 1-3, acute care common
  to continue to grow, and an increase in               stem anaesthesia, specialty training 3-7,
  workforce gaps.                                       clinical research fellows, Post Certificate of
                                                        Completion of Training fellows) who should
                                                        reach Certificate of Completion of Training
  Gender balance
                                                        (CCT) over the next five to eight years.
  Female consultants make up 38% of the
  workforce in 2020, compared with 28% in
  2007. Similarly, the SAS doctor workforce is          Locums
  now 39% female compared with 35% in 2010.             An additional 349 anaesthetists were on
                                                        various forms of long-term leave. There
                                                        were 380 consultant locums and 100 SAS
  Age
                                                        doctor locums.
  More consultants are now working
  beyond the age of 60 years, up
  from 5% in 2015 to 7% in 2020.                        Senior staff
  The 50 plus age group is now 39%                      34% of departments had a policy for
  of the workforce, compared with 31% in 2007.          senior consultants to come off the
                                                        on call rota compared with only 7%
  Vacancies                                             having a policy for senior SAS doctors.
  Just over 90% of departments had at least one
  consultant vacancy. There were 680 vacant             Pension tax changes
  consultant posts and 243 vacant SAS doctor            1,133 consultants (14% of all consultants –
  posts in the UK.                                      range 4% in London to 19.4% in Scotland)
                                                        reduced their programmed activities as a
  The funded workforce gap in the consultant
                                                        result of the pension tax changes.
  workforce continues to rise from 4.4% in 2015,
  5.4% in 2017, 6.9% in 2018 to 8% in 2020.
                                                        Advertised posts
  Although the overall funded gap was 8%,               Of 198 departments that had advertised
  there was variation between the devolved              a consultant post, 103 (52%) had
  nations: 7.7% in England, 4.8% in Northern            been unable to appoint. Intensive
  Ireland, 7.7% in Scotland and 11.8% in Wales.         care medicine is disproportionately
                                                        represented in the posts where
  The real gap rose to 11.8% for consultants            recruitment failed.
  and 18.4% for SAS doctors (clinical directors
  reported how many additional posts                    Of the 172 departments that had
  [aspirational gap] were required to meet              advertised an SAS doctor post, 67 (39%)
  demand).                                              had been unable to appoint.

                                                                                            | 5
Medical Workforce Census Report 2020

Background
In a time of drastic change it is the learners who inherit the future.
Eric Hoffer, Reflections on the Human Condition (1973)

Anaesthesia has workforce shortages which may be traced back to the economic crisis of 2007/08.
Along with much of the global economy at the time, the NHS had entered an age of austerity and
was experiencing significant financial pressures. In order to fund frontline services, in 2009 the Chief
Executive of the NHS, Sir David Nicholson, challenged the NHS to find £20 billion of efficiency savings
by 2015. Staffing pay represents half of the budget for many parts of the NHS, so workforce numbers
and costs were an obvious area to look for savings. The following year in 2010, the Department of
Health set up the Centre for Workforce Intelligence (CfWI) to review and plan workforce numbers
across the NHS in England.

In 2011, the CfWI published Shape of the Medical Workforce: Informing Medical Training Numbers which
made recommendations about the numbers of trainees required to generate sufficient CCT-holders
for the various medical specialties.1 The process that informed their decisions involved working with
employers, medical specialties and their lead deans to review available evidence, understand professional
views and policy drivers, and then feed that information into an agreed model of participation rates,
attrition rates and retirements. The CfWI recommendations were to be implemented by 2014, with an
expectation that they would have had an impact on the numbers of CCT-holders in 2020. The authors
recommended an expansion of general practitioner (GP) training posts at the expense of hospital-based
specialties, which included anaesthesia. However, they acknowledged that anaesthesia and intensive care
medicine were specialties which required ‘a more focussed piece of work’.

In 2015, four years later, the more focussed piece of work was published. Unfortunately, by this time
some postgraduate medical deans had already started to reduce the numbers of places on anaesthetic
training programmes. The CfWI in-depth review reported that there was an unmet need of 15% for
anaesthesia and 25% for intensive care medicine.2 Complex modelling was used to predict that both
specialties were likely to grow at 4.7% per year and that, without action, demand would outstrip supply.
There are concerns that these numbers may under-represent demands as, since that time, anaesthesia
practice has moved from being largely theatre based and has expanded into other areas as part of the
perioperative care programme. The CfWI functions have since moved into Health Education England.

The College monitors workforce numbers closely, performing census surveys in 2007, 2010 and 2015,
and more focussed recruitment surveys in 2017 and 2018.3,4 These surveys include enquiry about
gaps in departmental workforce across the UK. The gap may be expressed as the number of funded
but unfilled posts as a percentage of the total funded establishment (i.e. filled and unfilled posts). The
gap had risen in previous census surveys from 4.4% in 2015, 5.4% in 2017 and then 6.9% in 2018.
The increasing workforce gap is unsurprising if we look at the pipeline supply of anaesthetists gaining
their CCT each year. There has been a steady decline in the number of newly qualified anaesthesia
specialists from 569 in 2013 to 373 in 2019, a 34% reduction.5 Alongside that reduction in supply,
demand for senior anaesthetists has increased as the elderly sick population grows, new complex
surgical procedures require more experienced senior anaesthetists, additional roles in perioperative
medicine are taken on by anaesthetists, anaesthetists in training work more restricted hours and the
amount of weekend and evening work has increased.

6 |
Medical Workforce Census Report 2020

Anaesthesia is not alone in facing workforce challenges. In 2019, the Royal College of Paediatrics and
Child Health published results of their workforce modelling, estimating that there was a gap of 856
paediatric consultants across the UK.6 A recent census by the Royal College of Psychiatrists showed a
gap of 708 psychiatry consultants (9.3%).7 These shortages in secondary care are reflected in primary
care. General practice has well-publicised shortages and in December 2019 NHS Digital recorded that
the number of full-time equivalent GPs had dropped by 1% in the last year as they leave the profession
or reduce their working hours.8 Workforce shortages are widespread. The solution will lie in planning and
investment. Shifting training numbers from one specialty to another will only expose gaps in other areas.

Over recent years, media interest has gathered momentum and pushed the issue of health worker
shortages up the political agenda. In response, in January 2019, the UK government published the NHS
Long Term Plan which recognised that ‘over the past decade, workforce growth had not kept up with
need’.9 This plan has many laudable aims around improving the working lives of staff and increasing
numbers of medical students, nurses, midwives and GPs, but little mention of addressing the shortages
of hospital specialists. Later in June 2019, NHS England published the Interim NHS People Plan which
described the need to increase numbers of GPs and psychiatrists, but again, other hospital specialties
were not mentioned.10

It is in this context that anaesthesia must have data to demonstrate our changing workforce position
and enable us to lobby national policy makers. Anaesthesia is the single largest hospital specialty.
Anaesthetists provide services for a wide range of surgical services including, pre-assessment,
anaesthesia and analgesia on the labour ward, long-term vascular access, acute and chronic pain
management, participation in multi-disciplinary teams and perioperative care. Provide a major
contribution to intensive care services as well as research, training and supervision of medical students,
anaesthetists in training, anaesthesia associates and paramedics. Unlike many other specialties there is
no potential for cross-cover from doctors in other specialties, as the ability to deliver a safe anaesthetic,
for even the most straightforward of cases, is simply not part of the wider skill set of doctors outside our
specialty. If we have insufficient numbers of anaesthetists, the impact on our patients will be profound,
affecting both their quality of life and how long they live.

                                                                                                          | 7
Medical Workforce Census Report 2020

Method
In May 2019, the College Workforce Strategy Committee set up a census working group to devise
and administer a census to be sent out to all clinical directors in the UK, via a list held by the College.
The questions were derived from the 2015 census and were expanded or updated as necessary. As
preparation for the census, in November 2019, the working group conducted a pilot census to ensure
the questions were clear. The pilot was distributed to 10 clinical directors.

The census was in two parts. Part 1 related to consultants, SAS doctors, anaesthesia associates and
locums, and was directed to the clinical director. Part 2 related to the training grades and was sent to
College tutors.

In some organisations, there are several individuals with clinical management roles which may lead to
confusion if they were all to complete part but not all of the census. In the autumn before the census,
respondents were contacted to confirm which single individual from that organisation would be most
appropriate to collect all their data and complete the census for that organisation.

The online questionnaire went live between 6 January to 6 February, with further email and telephone
reminders to complete the census, and it was closed on 6 March 2020.

Collecting data for the census was a significant undertaking, requiring co-ordination between clinical
directors, clinical leads, College tutors, regional advisers anaesthesia, head of schools and often
departmental administrators.

The analysis of the census returns was interrupted by the COVID-19 pandemic. As the initial surge of the
pandemic settled, we contacted hospitals who had not responded and those that responded to only Part 1
or 2 of the census, to get as complete a dataset as possible.Not all respondents answered every question.
Some data were easier to source than others and interpretation of results must allow for that.

8 |
Medical Workforce Census Report 2020

Consultant workforce
Number of consultants
The census showed that in 2020 there were 7,959 consultant anaesthetists in
England, Northern Ireland, Scotland and Wales (Figure 1). This is an increase in all
nations since 2007.

Figure 1: Total number of consultants

 7000
                           6,471
                      6,019
 6000            5,639
            5,116
 5000

 4000

 3000

 2000

                                                                             776
 1000                                                            594 643 758
                                    204 211 240 279                                      319 356 405 433
    0
               England             Northern Ireland                Scotland                 Wales

                                    2007        2010        2015       2020

The UK consultant growth rate from 2007 to 2020 is an average of 2.1% increase per annum (p.a.).
This is slightly less than the 2.3% p.a. growth rate from 2007 to 2015 noted in the last census. However,
it must be remembered that we had responses from 97% of the UK not the 100% recorded in 2015.
In addition, the growth rate is dependent on many factors and may be limited by the supply of
anaesthetists rather than demand.

The number of consultants in regions varied across England (Figure 2).

Figure 2: Regional variation in consultant numbers in England

   1400
                                                                                             1,218
   1200        1,112
                           1,003        1,023
   1000
                                                                     811
    800                                                                            688
                                                         616
    600

    400

    200

        0
          North East       North      Midlands         East of    South East   South       London
        and Yorkshire      West                       England                  West

                                                                                                                    | 9
Medical Workforce Census Report 2020
Consultant workforce growth
Between 2007 and 2020, the rate of growth in consultant numbers has varied across the devolved
nations, with Scotland, Northern Ireland and Wales increasing at a higher rate of 2.4%, 2.8% and 2.7%
p.a. respectively, whereas England has grown at 2.0% (Table 1).
Table 1 Growth rates from 2007 to 2020
2007 2020 % change
England 5,116 6,471 2.0
Northern Ireland 204 279 2.8
Scotland 594 776 2.4
Wales 319 433 2.7
Totals 6,233 7,959 2.1
Population data available from the Office of National Statistics can be used to compare numbers of
consultants per population size in each of the UK nations.11 Northern Ireland has the highest number
of consultants per 100,000 population (Table 2). This is surprising as the participation rate in Northern
Ireland (number of PAs that each consultant is contracted to work) is also high.
Table 2: Population data and number of consultants
Population in 2019 Number of consultants Number of anaesthetists
per 100,000 population
England 56,286,961 6,471 11.5
Northern Ireland 1,893,667 279 14.7
Scotland 5,463,300 776 14.2
Wales 3,152,879 433 13.7
If we include SAS and trust doctors, then we can see that Wales has a higher number of non-trainee
anaesthetists per 100,000 population (Table 3). This is consistent with the lower participation rates seen
in Wales which would necessitate higher numbers of anaesthetists.
Table 3: Population data and combined number of consultants, SAS and trust doctors
Population in Combined number of Number of anaesthetists per
2019 consultants, SAS and 100,000 population
Trust doctors
England 56,286,961 8,252 14.7
Northern Ireland 1,893,667 327 17.3
Scotland 5,463,300 875 16.0
Wales 3,152,879 603 19.1
Gender
Since 2007 there has been an increase in the proportion of females in the anaesthesia workforce.
This change has been more marked in anaesthesia compared with the group of registered medical
practitioners as a whole. The General Medical Council (GMC) online Data Explorer shows that the
percentage of female doctors has increased from 43% to 46% from 2012 to 2019.12 In a similar time
10 |Medical Workforce Census Report 2020
period, the proportion of female anaesthetists has increased in England from 28% in 2007 to 38% in
2020 (Table 4). Over the past five years the proportion of female anaesthetists has increased across all
four devolved nations.
Table 4: Gender distribution of consultant anaesthetists
England Northern Ireland Scotland Wales
Male Female Male Female Male Female Male Female
(%) (%) (%) (%) (%) (%) (%) (%)
2007 70 28 77 22 69 30 71 29
2010 70 30 73 27 67 33 69 31
2015 68 32 69 31 66 34 66 34
2020 62 38 62 38 61 39 65 35
Participation rates
The consultant contract is time based. A consultant’s working week is divided into programmed activities
(PAs), which include direct clinical care (DCC), supporting professional activities (SPA), additional NHS
duties and external duties. These PAs may be three to four hours in length depending on the time of
day and day of the week. A standard contract is 10 PAs per week. Some consultants work less than full
time and have fewer than 10 PAs in their job plan, whereas others may work up to 12 PAs per week. The
number of PAs in consultant’s job plans is called the participation rate.
The census showed that 62% of consultants are working more than 10 PAs, which is less than the figure
of 74% noted in the 2015 census (Table 5). The proportion of consultants working more than 10 PAs varies
across the UK. In Northern Ireland, the proportion of consultants working more than 10 PAs is high (87%).
Table 5: Gender distribution and participation rates of consultants
Programmed activities Male Female Numbers %
7 or less 240 140 380 5
8 97 178 275 4
9 116 214 330 4
10 1120 897 2017 26
10+ 3275 1565 4840 62
Totals 4,848 2,994 7,842 100
Note: Scottish data on participation rates was incomplete and is based on 659 consultants so the total number of consultants appears to be less.
Census data showed that fewer hospitals in Northern Ireland offer additional clinical activity. The lack of
additional clinical activity may be a result of the high participation rates meaning that consultants cover
the required work. Conversely, in Wales there are proportionately more hospitals offering additional
clinical activity. These sessions are paid at higher rates than if they were done within job planned time,
which incentivises consultants to restrict their contracted PAs to 10, and to perform additional clinical
work at the enhanced extra contractual rates. As a result, only 39% of consultants are contracted to
work more than 10 PAs in Wales.
| 11Medical Workforce Census Report 2020
This difference in approach to additional clinical activity may also explain the difference in workforce
gap. In Wales, where fewer consultants work more than 10 PAs, the workforce gap is 11.8%, whereas in
Northern Ireland, where the majority of consultants work more than 10 PAs, the workforce gap is 4.8%.
Participation rates also vary across England (Table 6). In the East of England, 76% of consultants are
contracted for more than 10 PAs compared with 51% in London. This may be a reflection of increased
opportunities to generate additional income outside of the NHS in London compared with other regions.
Table 6: Consultant participation rates by regions in England and Northern Ireland,
Scotland and Wales (% of consultants)
7 or less 8 9 10 10+
North East and Yorkshire 3 4 5 20 67
North West 5 2 3 24 67
Midlands 4 4 5 24 64
East of England 3 2 5 13 76
South East 6 4 4 23 63
South West 8 4 5 28 55
London 7 4 5 33 51
Northern Ireland 1 2 1 9 87
Scotland 4 3 4 31 57
Wales 4 5 1 51 39
Age distribution
As has been seen with previous censuses, the largest cohort of consultants is aged 40-49 years (Figure 3).
In the 2015 census, only 5% of consultants worked beyond 60 years of age. However, the 2020 census
shows that this figure has increased and around 7% of consultants are now working beyond 60 years of
age. The reason for this change is unclear. It was expected that the pension tax changes would encourage
consultants to retire early, but our results do not support that. The data from the UK nations shows a
slightly younger workforce in Northern Ireland and a slightly older workforce in Wales (Figure 4).
Figure 3: Age distribution of consultants
2500
1,959
2000
1,590
1500
1,257
1000
751 787
670
500 380
126
15 2
0
30-39 40-49 50-59 60-69 70+
Male Female
12 |Medical Workforce Census Report 2020
Figure 4: Workforce age distribution (%) by UK
50
45 43
40 40 39
40
35 33 34
31
29
30
25
25 22
20
20 18
15
10 7 6 7
5
5
0 0 0 1
0
30–39 40–49 50–59 60–69 70+
England Northern Ireland Scotland Wales
The anaesthesia workforce is getting older. If we compare the proportion of consultants in each of
the cohorts, across the censuses from 2007 to 2020, we can see that although there is an increase
in numbers of consultants in the 30-49 years age range, the proportion of the total is falling, whereas
there is an increase in the 50+ years age group (Figure 5). In 2007, the 50+ years age group made up
31% of the consultant workforce, whereas in 2020 it makes up 39% of the workforce (Figure 6).
Figure 5: The difference: 2007, 2010, 2015, 2020 consultant ages
3500
3,216
3,077 3,131
3000 2,907
2500 2,377
2,164
2000
1,695
1,571
1500 1,350 1,421
1,286 1,290
1000
506
500
298 296 348
4 17 4 17
0
30-39 40-49 50-59 60-69 70+
2007 2010 2015 2020
| 13Medical Workforce Census Report 2020
Figure 6: Age distribution (%) with each census
60
50 47 48 45
43
40
31 32
30 26 27
22 20
19 19
20
10 5 5 5 7
0
30-39 40-49 50-59 60-69
2007 2010 2015 2020
Number of consultants with programmed activities in specialty areas
The census asked clinical directors about numbers of colleagues with specific specialty areas in their job
plans (Table 7). Similar to the 2015 census, general interests were the largest group followed by intensive
care, trauma and obstetrics. Respondents also noted new specialty areas with consultants engaged in
perioperative medicine and pre-hospital care.
Table 7: Number of consultants with PAs in specialty areas
Specialty Number %
Cardiac 423 3.0
Chronic pain 568 4.0
General 3382 23.6
Paediatrics 1224 8.5
Paediatric ICU 92 0.6
Adult ICU 1770 12.3
Neurosurgical ICU 209 1.5
Neuroanaesthesia 391 2.7
Obstetrics 1507 10.5
Perioperative medicine 338 2.4
Pre-hospital care 99 0.7
Pre-operative assessment 1386 9.7
Radiology 557 3.9
Trauma 1910 13.3
Vascular 268 1.9
Other 210 1.5
Total 14,334 100
14 |Medical Workforce Census Report 2020
Specialty and associate specialist doctors
(SAS) and trust doctor workforce
SAS doctors make a significant contribution to the running of departments of anaesthesia and delivery
of services. They are a diverse group with a variety of names in recent past, including specialty doctors,
staff grades and associate specialists. They may also be known as hospital practitioners, clinical
assistants, senior clinical medical officers or clinical medical officers. Their contract of employment
varies, with some working on nationally-negotiated terms and conditions, whereas others are on locally
agreed non-standard contracts.
SAS doctors have a minimum of two years of training in anaesthesia, but often far more and many
are senior, skilled and experienced colleagues. Their workload depends on their individual levels of
competence, varying from simple cases under the direct supervision of a consultant to independent
practice providing anaesthesia for complex surgical cases. Their roles are typically service based, but
they also provide teaching and appraisals, act as sub-specialty leads as well as hold other departmental
and trust-wide roles.
Trust doctors are usually employed on different contracts to SAS doctors. They typically work at the
level of a junior trainee (foundation year 1-specialty training year 3) and participate in trainee on call
rotas, but they are not regulated by the deanery. Many are from overseas and use these jobs to get a
foothold in the NHS, taking up a training post later in their career. Some are between training grades for
various reasons including delayed progression due to examination or portfolio requirements, failure to
secure appointment to their desired training scheme, other academic, educational or research interests,
or personal circumstantial factors.
Number of SAS and trust doctors
The data from the 2020 census showed that the total number of SAS and trust doctors had changed
little in five years (Figure 7). In 2015, the SAS and trust doctor made up 21.6% of the anaesthesia
workforce. In 2020, that figure is relatively unchanged at 21.1%, despite an increase in service demand,
which is likely to continue to grow, and an increase in workforce gaps. Some 72% of SAS doctors were
contracted to work more than 10 PAs, compared to 62% of consultants.
Figure 7: Number of SAS and trust doctors
2000
1,785 1,781
1800
1,553
1600
1400
1200
1000
800
600
400
200 99 83 99 105 136 170
27 29 48
0
England Northern Ireland Scotland Wales
2010 2015 2020
| 15Medical Workforce Census Report 2020
Population data from the Office of National Statistics can be used to compare numbers of consultants,
SAS and trust doctors with population size in each of the UK nations (Tables 8 and 9).
Table 8: Numbers of consultants, SAS and trust doctors, 2010, 2015 and 2020
2010 2015 2020
Consultants SAS and TD Consultants SAS and TD Consultants SAS and TD
(%) (%) (%)
England 5,639 1,553 (22) 6,019 1,785 (23) 6,471 1,781 (22)
Northern Ireland 211 27 (11) 240 29 (11) 279 48 (15)
Scotland 643 99 (13) 758 83 (10) 776 99(13)
Wales 356 105 (23) 405 136 (25) 433 170 (28)
6,849 1,784 (21) 7,422 2,033 (22) 7,959 2,098 (21)
Table 9: Number of SAS doctors only in departments (excluding departments without SAS doctors)
Mean number of SAS doctors in departments (range)
England 10 (1–41)
Northern Ireland 6 (3–14)
Scotland 5 (1–11)
Wales 13 (5–23)
Gender
The gender distribution of SAS doctors has followed a similar pattern of change to that of consultants
with an increase in the proportion of women compared with men (Tables 10 and 11).
Table 10: Gender distribution of SAS and trust doctors by percentage (%)
England Northern Ireland Scotland Wales
Male Female Male Female Male Female Male Female
2010 65 35 85 15 46 54 69 31
2015 62 38 52 48 53 47 67 33
2020 59 41 52 48 55 45 65 35
Table 11: Gender distribution of SAS doctors only by PAs
Male Female Totals % of total
7 or less 31 50 81 5
8 15 44 59 4
9 10 32 42 3
10 144 119 263 17
10+ 765 369 1134 72
Totals 965 (61%) 614 (39%) 1,579
16 |Medical Workforce Census Report 2020
Number of SAS doctors with programmed activities in specialty areas
The census asked about specialty areas in SAS job plans (Table 12). As was noted in the 2015 census,
SAS doctors have a high proportion of general duties followed by obstetrics, intensive care and trauma,
presumably reflecting their acute workload.
Table 12: Number of SAS doctors with PAs in specialty areas
Specialty Number %
Cardiac 26 1
Chronic pain 45 2
General 1,098 40
Paediatrics 62 2
Paediatric ICU 0 0
Adult ICU 412 15
Neurosurgical ICU 26 1
Neuroanaesthesia 16 1
Obstetrics 544 20
Perioperative medicine 6 0.2
Pre-hospital care 3 0.1
Pre-operative assessment 40 1
Radiology 21 1
Trauma 368 14
Vascular 16 1
Other 50 2
Total 2,733
| 17Medical Workforce Census Report 2020 Workforce gaps Gaps due to leave Workforce gaps may be temporary, such as when a colleague takes sick, parental or carers leave, a sabbatical or a career break, or if they’re excluded. To quantify this issue, we asked clinical directors about the prevalence and reasons for consultant and SAS doctors’ long-term leave (Table 13). Table 13: Reasons for long term leave for consultants and SAS doctors Reason for leave Number of responses Maternity leave 122 Paternity Leave 7 Long term sick leave 125 Sabbatical/career break 82 Other 13 The doctors in the ‘other’ category included those who had been seconded to non-clinical projects within the trust or were formally excluded awaiting mediation, investigation or a GMC hearing. The total of 349 doctors’ represents 3.7% of the combined consultant and SAS doctor workforce. These temporary gaps can have a significant impact on the department as a locum might not be available or appropriate, and there will be an expectation that their uncovered work will be done by their remaining colleagues. Unfilled posts Other long-term unfilled sessions and posts may have no colleague’s name badged against them. These gaps may occur when a colleague reduces their clinical workload, retires, moves to another hospital, moves into a management or educational role, leaves medicine altogether or, rarely, dies in service. The census shows that 90% of departments of anaesthesia in the UK have at least one unfilled consultant, SAS doctor or anaesthesia associate post. An understanding of the size and nature of the gap is important for workforce planning. The gap can be assessed by simply asking about the number of unfilled posts. However, in isolation, this number can be misleading. To illustrate, colleagues working in a department of 150 anaesthetists will notice relatively little impact if there are 5 unfilled posts. However, colleagues working in a department of 10 anaesthetists will be under significant pressure if 5 of them are unfilled. For this reason, the workforce gap is often quoted as a percentage of the total number of funded posts in the department. Across the UK, there were 680 funded but unfilled consultant posts (Figure 8 and Table 14). 18 |
Medical Workforce Census Report 2020

Figure 8: Comparison of number of unfilled consultant posts in 2015 and 2020

  600
                    543

  500

  400

  300         267

  200

  100                                                       65                  58
                                                      41
                                  2     14                                19
    0
              England        Northern Ireland        Scotland              Wales
                                        2015     2020

% funded gap = number of funded unfilled posts / total number of funded posts (filled and unfilled).

Table 14: Number of funded but unfilled consultant posts

                                   Number of funded        Number of filled posts       Funded gap (%)
                                      but unfilled posts
 North East and Yorkshire                             77                        1,112                6.5
 North West                                          93                        1,003                 8.5
 Midlands                                            94                        1,023                 8.4
 East of England                                     57                         616                  8.5
 South East                                          69                          811                 7.8
 South West                                          62                         688                  8.3
 London                                               91                       1,218                 7.0

 England                                            543                        6,741                 7.7
 Northern Ireland                                     14                        279                  4.8
 Scotland                                            65                         776                  7.7
 Wales                                               58                         433                  11.8

“This is a remote and rural hospital requiring a broad variety of skills: critical care for all ages and anaesthetic
skills for all emergency surgery and a wide variety of elective surgery. It is a 1 in 4 rota. There are no
applicants to vacant posts. We have 3 long term locums. As the single substantive anaesthetist I have reduced
my PAs for pension reasons. The situation appears hopeless.”
Clinical Director

                                                                                                                       | 19
Medical Workforce Census Report 2020
Across the UK, there were 243 funded but unfilled SAS doctor posts (Figure 9 and Table 15).
Figure 9: Comparison of number of unfilled SAS doctor posts in 2015 and 2020
200 189
182
180
160
140
120
100
80
60
40 32
17 19
20 12 12
3
0
England Northern Ireland Scotland Wales
2015 2020
Table 15: Number of funded but unfilled SAS doctor posts
Number of funded Number of Funded gap (%)
but unfilled posts filled posts
North East and Yorkshire 26 184 12.4
North West 38 222 14.6
Midlands 24 242 9.0
East of England 33 140 19.1
South East 13 206 5.9
South West 21 170 11.0
London 27 149 15.3
England 182 1313 12.2
Northern Ireland 17 45 27.4
Scotland 12 88 12.0
Wales 32 133 19.4
The number of unfilled jobs varies from year to year. We asked whether clinical managers thought that
the number of consultant vacancies had changed over the past year (Figure 10). The majority of clinical
directors felt that the number of consultant vacancies had increased in the last year, which is supported
by the increasing workforce gap since 2007 (Figure 11).
20 |Medical Workforce Census Report 2020
Figure 10: Has the number of consultant vacancies changed over the last year?
80 75
70
60
49
50
40
30 27
20
11 11
10 7 6 6
2 3 2
0
0
England Northern Ireland Scotland Wales
Decreased Stayed the same Increased
Figure 11: Trend in consultant workforce gap (%)
10
8
8 6.9
6 5.4
4.4
3.7 3.6
4
2
0
2007 2008 2009 2010 2011 2012 2013 2014 2015 2016 2017 2018 2019 2020
Data taken from RCoA surveys 2007, 2010, 2015, 2017, 2018 and 2020
"Current difficulty in convincing managers that there is a deficiency in the workforce as too good at finding
cover at short notice."
Clinical Director
"Recruitment activity and dealing with shortfall in workforce resource has become dominant theme of my role
as clinical director, at the expense of other activity."
Clinical Director
| 21Medical Workforce Census Report 2020
Aspirational gap
The funded gap statistic is useful, but tells only part of the story. Clinical directors often report that there
is an additional demand on the department, but for which there is no identified funding (e.g. covering
annual leave). Ideally, they would employ an additional member of staff, but their organisation has not
agreed a new job (even though they may already be paying for enhanced rate extra contractual sessions
or expensive locums to do the work). This additional gap is called the ‘aspirational’ gap (Figure 12).
Figure 12: The different types of gaps
Real gap
Funded Aspirational
gap gap
Funded Funded Non funded
filled unfilled posts
posts posts
Funded
establishment
In the census, we asked clinical directors about the aspirational gap. In response, 53% of clinical
directors said their consultant workforce had an aspirational gap, requiring a further 374 additional
colleagues to cover the entire service. Once the aspirational gap is taken into account, the ‘real’
workforce gap across the UK for consultants is 11.8% and for SAS doctors is 18.4% (Tables 16 and 17).
Table 16: Number of unfilled consultant posts, aspirational gap and real gap
Number Funded Aspirational Total Funded and Real gap
gap gap aspirational gap (%)
England 6,471 543 283 7297 826 11.3
Northern Ireland 279 14 17 310 31 10
Scotland 776 65 38 879 103 11.7
Wales 433 58 36 527 94 17.8
Totals 7,959 680 374 9,013 1,054 11.8
Table 17: Number of unfilled SAS posts, aspirational gap and real gap
Number Funded Aspirational Total Funded and Real gap
gap gap aspirational gap (%)
England 1,313 182 67 1,562 249 15.9
Northern Ireland 45 17 16 78 33 42.3
Scotland 88 12 8 108 20 18.5
Wales 133 32 22 187 54 28.9
Totals 1,579 243 113 1,935 356 18.4
22 |Medical Workforce Census Report 2020
Anaesthesia associate workforce
The 2015 census was the first to consider non-medically qualified anaesthesia practitioners. The role was
introduced in the UK in 2004 and they were known as Physicians Assistants in Anaesthesia PA(A)s. The
2015 census reported that there were 323 PA(A)s across the UK. However, data from the Association
of Physicians’ Assistants in Anaesthesia and the University of Birmingham, showed that there were 165
trained PA(A)s. The overestimate was probably a result of a lack of familiarity with the role and title, and
clinical directors may have included advanced critical care practitioners and nurse practitioners.
In 2019, PA(A)s formally changed their title to anaesthesia associates (AAs), recognising their role
within the anaesthesia team and also within medical associate professions. In the same year, statutory
regulation for AAs was approved and will be the responsibility of the GMC to regulate from 2021.
The 2020 census showed that there were 173 anaesthesia associates in the UK (Figure 13). This is fewer
than the 205 who have qualified through the University of Birmingham.13
Figure 13: Total number of Full Time (FT) and Less Than Full Time (LTFT) AA’s across the four nations
80
70
70
60
50 45
40
30
20
13
10
10 6 6 6 6
4 3 3
0 0 0 1 0
0
FT; Male FT; Female LTFT; Male LTFT; Female
England Northern Ireland Scotland Wales
| 23Medical Workforce Census Report 2020
Anaesthetists in training and
non-consultant, non-training roles
None of the previous census reports have captured detailed data on training grade doctors. These are
a heterogeneous group including specialty trainee (ST), Acute Care Common Stem (ACCS) and Core
Trainees (CT) doctors who are on a defined training programme with recognised educational content
and assessments in a prescribed timeframe. There are also non-consultant and non training grades,
which includes Medical Training Initiative (MTI) doctors, locums and clinical fellows whose roles have
varying supervision, educational exposure and often open-ended contracts. The contribution that this
latter group of doctors will make in the future is variable. Some may go onto become consultants or
SAS doctors, whereas others may leave the UK and return home overseas. To understand the numbers
who were likely to contribute to the permanent UK anaesthesia workforce, we asked clinical directors
and College tutors about numbers of each role.
The majority (79%) of training grade doctors were in nationally recognised training posts (ACCS, CT,
ST, locum appointment training [LAT]). However, a significant proportion (21%) were in non–consultant,
non-training roles (Locum Appointment for Service [LAS], MTI, trust doctor, clinical/research fellow,
post CCT fellow) where there is less oversight in terms of supervision and educational content.
In 2015, there were 172 post-CCT fellows whereas the 2020 census recorded 81 post-CCT fellows. This
may suggest a lower requirement for additional experience to secure a consultant post because of the
availability of unfilled consultant posts.
Obtaining accurate trainee data is difficult. The RCoA Training Department records in June 2020
showed that there were 4,804 anaesthetists in training (CT1-3, ACCS anaesthesia and ST 3-7), whereas
data from the GMC trainee survey shows that number to be 4,462.14 Using broadly comparable grades,
the census data show’s 4,311 trainees. Some of this discrepancy may be because the College relies on
the information given to them by trainees and if a trainee steps out of programme but does not tell
the College, then there is no way to check. Similarly, the GMC survey has inaccuracies, as it relies on
trainees to select the appropriate box when declaring their grade. If they inadvertently make a mistake,
then the data will be wrong. The census figure is possibly an underestimate as we did not have data
from every department in the UK. Despite these differences, the number of trainees who are likely to
progress to consultant or SAS doctor roles is between 4,200 and 4,500. Numbers of ST3 appointed
posts have changed relatively little over the years (Figure 14).
Figure 14: Annual ST3 recruitment numbers (Data from the Anaesthetics National Recruitment Office)
600
517
499
500 480 472 474
457
400
350 350
309
300
200
100
0
2011 2012 2013 2014 2015 2016 2017 2018 2019
Note: There may be missing data for years 2011–2013 which can explain the lower numbers in those years.
24 |Medical Workforce Census Report 2020
Numbers of anaesthetists in training and non-consultant, non-training roles
Of those employed in training posts across the whole of the UK (Table 18), 14% currently work less than full
time, with a higher proportion during the ST3-7 posts as compared with the other junior roles (Table 19).
Table 18: Numbers of anaesthetists in training and non-consultant, non-training roles by country
England Northern Ireland Scotland Wales
ACCS (anaesthesia only) 328 3 26 18
ACCS (non-anaesthesia) 272 12 27 12
CT1-3 737 39 99 97
ST3-7 2,064 97 257 144
LATs 9 0 12 1
MTI 130 0 4 12
Trust Doctor 468 3 11 37
Clinical/Research Fellow 274 8 14 25
Post CCT Fellow 76 0 5 0
Fixed Term LAS 32 3 2 2
Totals 4,390 165 457 348
Note: Although College tutors reported in the census, 9 LATs in England and 1 LAT in Wales. The grade is only recruited in Scotland.
Gender of anaesthetists in training and non-consultant, non-training roles
Overall, these grades of doctors are 47% female compared with 38% of female consultants, reflecting
wider change in the medical community. Within the less than full time cohort, there is a greater
proportion of females, presumably due to maternity leave and the continued tendency for more women
to work less than full time to provide childcare. 27% of all female trainees and 7% of all male trainees
are working on a less than full-time basis. This may have a significant impact on workforce planning and
resident rota design.
Table 19: Gender and employment contract of anaesthetists in training and non-consultant, non-training roles
Full time Less than full time
Male Female Male Female
ACCS (anaesthesia only) 220 126 9 20
ACCS (non-anaesthesia) 175 134 3 11
CT1-3 486 419 18 49
ST3-7 1,178 871 120 393
LATs 12 9 1 0
MTI 79 66 1 0
Trust Doctor 258 195 20 46
Clinical/Research Fellow 184 109 13 15
Post CCT Fellow 36 39 1 5
Fixed Term LAS 17 19 1 2
Totals 2,645 1,987 187 541
| 25Medical Workforce Census Report 2020
Relationship between trainee numbers and local workforce gap
Trainees often take up permanent posts in the region where they have trained. If this were the only
factor guiding where they took up consultant posts, then areas that had a high trainee to consultant
ratio should have fewer problems filling consultant vacancies and a smaller consultant gap (Table 20).
However, the census found no relationship between trainee numbers and consultant gap. Indeed, Wales
has the highest ratio of trainees to consultants, but also has the highest levels of consultant vacancies.
This may reflect a longstanding workforce gap, but the census did not explore this further (Table 21).
Table 20: Anaesthetists in training by English region (includes ACCS anaesthesia, CT1-3, ST3-7, LATs
Clinical/Research Fellow and post CCT Fellow)
Consultants Total training Trainee/ Consultant gap %
grades consultant ratio
NE and Y 1,112 596 0.54 6.5
NW 1,003 499 0.50 8.5
Midlands 1,023 512 0.50 8.4
East of England 616 253 0.41 8.5
SE 811 452 0.56 7.8
SW 688 491 0.71 8.3
London 1,218 693 0.57 7
Table 21: Ratio of consultants to trainees by country (includes ACCS anaesthesia, CT1-3, ST3-7, LATs
Clinical/Research Fellow and post CCT Fellow)
Consultants Total training Trainee/ Consultant gap %
grades consultant ratio
England 6,471 3,488 0.54 7.7
Northern Ireland 279 147 0.53 4.8
Scotland 776 413 0.53 7.7
Wales 433 285 0.66 11.8
Anaesthetists in training gaps
The 2020 census reported 284 empty training posts compared with 424 in the 2015 census. Across
the UK, 6% of training posts are unfilled, varying from 2% in Northern Ireland to 7% in England. Within
England, the regions reporting the most unoccupied trainee posts are East of England (12%), Midlands
(8%) and London (8%).
Despite the improvement in trainee gaps since 2015, 39% of respondents across the UK report an
increase in trainee/SAS rota gaps over the last 12 months. Only 16% of respondents report a reduction
in trainee/SAS rota gaps, while 41% report an unchanged frequency; 52% of hospitals in England
reported an unchanged frequency of rota gaps but they also had both the largest increase in frequency
(43%) and largest decrease in frequency (20%). In 2020, the number of posts that are unfilled because
the incumbent was on parental leave, sick leave or an out of Programme is similar to the number in 2015
(12% vs 15%).
26 |Medical Workforce Census Report 2020
Additional trainee capacity
Trusts were asked if they had additional capacity and funding to accommodate more trainees.
Respondents reported that they could accommodate additional trainees at the level of 20% for CT1,
31% for CT2, 48% for ST3/4, 45% for ST5/6, 43% for ST7 and in 43% of departments for intensive
care medicine trainees. Respondents from institutions in England and Wales were more likely to
have additional capacity for trainees than their counterparts in Scotland and Northern Ireland, and
particularly for those at more senior levels for ST3 and above, as well as for intensive care medicine
trainees. This suggests that there is capacity within the system to accommodate individuals with a more
advanced skillset, possibly as a result of the failure to significantly expand SAS grade posts in line with
rising demand.
| 27Medical Workforce Census Report 2020
On call gaps in trainee/SAS rotas
Compared with the 2015 census there is a small reduction in the number of occasions in which there is a
gap on a trainee/SAS on call rota, suggesting that trainee numbers may be improving (Figures 15, 16 and 17).
“All trainees are either directly supervised or have a named supervisor on the rota. SAS doctors
work under the provision that there is always a consultant available/on-call”
Clinical Director
Figure 15: How often does your department cover gaps in the trainee/SAS overnight and weekend rotas?
120 108
100
81
80
57
60
42
37
40
20
16 14 16
20 12
6
0
Everyday Once a Once a Less than Rarely Never
week month once a
month
2015 2020
Figure 16: Gaps covered in the trainee/SAS overnight and weekend rotas by devolved nation
70
63
60
48
50
40
30
20 14
12 11
10 7 6 6
5 5
1 1 2 1 2 1 2 3
0 0
0
Every day Once a week Once a month Less than Rarely
once a month
England Northern Ireland Scotland Wales
28 |Medical Workforce Census Report 2020
Figure 17: How does your department cover gaps in the trainee/SAS overnight and weekend rotas?
250
206
200 185
157
150
116 112
102
100
50
22
12
0
Internal locums External locum Consultants Other (please specify)
‘acting down’
2015 2020
The ‘Other’ group included Anaesthesia associates and a mixture of all options.
The impression that there are fewer gaps in trainee/SAS rotas may be a consequence of increased
numbers on trainees in the system, or increased numbers of locally employed doctors (Figure 18 and
Table 22). In 2015 it was reported that 70% of departments cover SAS/trainee gaps more frequently
than once a week, with 19% having to cover a gap every day. Also in 2015 the proportions having to fill
gaps more frequently than once a week was 35% in Scotland, 89% in England, 92% in Wales, and 100%
in Northern Ireland.
Figure 18: Trends in trainee/SAS rota gaps in the past 12 months
140
123
120
100
82
77
80
67
60
40 31
19
20
4 7
0
Decreased Stayed the same Increased Don't know
2015 2020
| 29Medical Workforce Census Report 2020
Table 22: Trends in trainee/SAS rota gaps in the past 12 months (%)
2015 (%) 2020 (%)
Decreased 19 (9) 31 (16)
Stayed the same 67 (31) 82 (42)
Increased 123 (58) 77 (40)
Don’t know 4 (2) 7 (2)
Table 23: How often is a first on call trainee/SAS doctor covering two rotas?
Time period Number of Responses
Everyday 7
Once a week 9
Once a month 3
Less than once a month 3
Rarely 28
Never 145
In 2020, it was reported that the proportion of respondents having to cover SAS/trainee gaps more
frequently than once a week has reduced from 70% in 2015 to below 50% in 2020, with only 8% of
respondents having to fill SAS/trainee gaps everyday – down from 19% in 2015. Further in 2020, 7% of
respondents report having to leave gaps in the trainee/SAS rotas without cover once a month or more,
with 2% reporting that this happens a few nights a week, and 3% reporting that this happens once a
week (Table 24). The majority of those leaving uncovered gaps are in England, with 88% of respondents
in Scotland never leaving rotas without cover, 78% in Northern Ireland, and 64% in each of England and
Wales, bringing the UK average to 68% of respondents never leaving rota gaps uncovered.
Table 24: How often are overnight gaps in the trainee/SAS rotas left without cover?
Time period Number of Responses
Once a week 6
Few nights a week 3
Once a month 4
Less than once a month 8
Rarely 41
Never 132
30 |Medical Workforce Census Report 2020
Locums
The 2020 census shows that there are 380 consultant locums, 146 trainee
locums and 100 SAS doctor locums (Figure 19). In comparison, in 2015 there
were 310 consultant locums, 145 trainee locums and 84 ‘other’ locums,
showing our dependence on locums has increased by 16% in the past five
years (Table 25).
Figure 19: Distribution of locums across the UK
350
315
300
250
200
150 121
100 79
50 29 26
10 13
3 5 2 8 15 1 0 0 0
0
Consultant SAS doctor Trainee AA
England Northern Ireland Scotland Wales
Table 25: Number of locums as a proportion of the consultant workforce, by country
Consultant Locum Locum Funded gap
number number % (%)
England 6,471 315 4.9 7.7
Northern Ireland 279 10 3.6 4.8
Scotland 776 29 3.6 7.7
Wales 433 26 6.0 11.8
Total 7,959 380 4.8
As a group, locums are variable in terms of experience, skill set and personal circumstances. This
variability prevents us from predicting how much of a contribution they will make to future workforce
capacity. However, it is likely that some will take up currently unfilled consultant and SAS doctor posts.
With respect to the UK nations, the use of locums is broadly proportional to the magnitude of the
workforce gap, although this relationship is less obvious in the Health Education England regions and in
Scotland (Tables 26 and 27).
| 31Medical Workforce Census Report 2020
Table 26: Regional variation in number of locums as a proportion of the consultant workforce
Consultant Locum Locum Funded cons
number number % gap (%)
North East and York’s 1,112 43 4 7
North West 1,003 39 4 9
Midlands 1,023 50 5 8
East of England 616 45 7 9
South East 811 48 6 8
South West 688 24 4 8
London 1,218 66 5 7
Table 27: Number of locums as a proportion of the SAS doctor workforce
SAS doctor number Locum number Locum
%
England 1,313 79 6
Northern Ireland 45 13 29
Scotland 88 3 3
Wales 133 5 4
Total 1,579 100 6
32 |Medical Workforce Census Report 2020
Job plan content
Starting number of supporting professional activity programmed activities
When introduced in 2003, the consultant contract stated that the typical consultant 10 PA job plan
would include 7.5 PAs for direct clinical care and 2.5 PAs for supporting professional activities.15 Since
then, pressure to contain costs and maximise use of the medical workforce has led to a reduction in the
number of SPAs for new consultants with the presumption that these consultants will have fewer non-
clinical duties at the start of their career. The census showed that only 10% of hospitals offered 2.5 or
more SPAs to new consultants, and 64% offered 1.5 or less (Table 28). A starting job plan with 9 DCC
PA and 1 SPA is relatively common in Scotland, whereas in Wales new consultants are offered more than
2.5 SPAs. It has been suggested that offering more SPAs to new consultants may encourage mobile
candidates to apply to those hospitals. However, it is interesting to note that nearly all of the hospitals
offering more than 2.5 SPAs were in Wales which has the highest workforce gap (11.8%) in the UK. Of
course, that gap might worsen if they attempted to maximise the clinical workload of consultants by
adopting the ‘9 plus 1’ policy seen more often in Scotland.
Table 28: Starting SPAs offered to new consultants
1 SPA 1.5 SPA 2 SPA 2.5 SPA >2.5 SPA
England 4 104 33 11 1
Northern Ireland 0 6 2 1 0
Scotland 10 3 13 0 0
Wales 0 0 4 0 7
Three session days
Several difficult organisational topics were discussed by the national clinical director executive in the period
preceding the census. This included how departments covered three session days, defined as starting at
8am and routinely finishing after 8pm. The census showed that 735 consultants (9% of all consultants) had
three-session days in their job plan. In 102 hospitals, three session days were routinely covered by a single
anaesthetist, whereas in 23 hospitals, more than one anaesthetist was timetabled to provide cover and in 6
hospitals the later part of the day was covered by the on call anaesthetic consultant.
Flexible sessions
A total of 4,244 (54%) consultants have flexible sessions in their job plan.
Evening sessions
Figure 20: Does your trust/board have weekday evening theatre sessions covered by consultant
anaesthetists for emergency work (eg acutes or trauma)?
Yes 90 out of 188 responses
52.1% 47.9%
Yes No
| 33You can also read