Differential Effects of Combined ATR/WEE1 Inhibition in Cancer Cells
←
→
Page content transcription
If your browser does not render page correctly, please read the page content below
cancers
Article
Differential Effects of Combined ATR/WEE1 Inhibition in
Cancer Cells
Gro Elise Rødland, Sissel Hauge, Grete Hasvold, Lilli T. E. Bay, Tine T. H. Raabe, Mrinal Joel
and Randi G. Syljuåsen *

                                          Department of Radiation Biology, Institute for Cancer Research, Norwegian Radium Hospital, Oslo University
                                          Hospital, N-0379 Oslo, Norway; grroed@rr-research.no (G.E.R.); hausis@rr-research.no (S.H.);
                                          grete.hasvold@farmasi.uio.no (G.H.); lilbay@rr-research.no (L.T.E.B.); tinraa@rr-research.no (T.T.H.R.);
                                          mrinaljoel@gmail.com (M.J.)
                                          * Correspondence: randi.syljuasen@rr-research.no

                                          Simple Summary: Cancer cells often show elevated replication stress and loss of cell cycle check-
                                          points. The ataxia telangiectasia and Rad3-related (ATR) and WEE1 kinases play roles in protecting
                                          cancer cells from high replication stress and in regulating the remaining cell cycle checkpoints. In-
                                          hibitors of ATR or WEE1 therefore have the potential to selectively kill cancer cells and are currently
                                          being tested in clinical trials. However, more studies are needed to understand how these inhibitors
                                          work in various types of cancer and to find the most effective ways of using them. Here, we have
                                          explored whether simultaneous treatment with ATR and WEE1 inhibitors is a promising approach.
                                          Effects were investigated in cell lines from osteosarcoma and lung cancer. We expect our results to be
                                          of importance for future treatment strategies with these inhibitors.


                                          Abstract: Inhibitors of WEE1 and ATR kinases are considered promising for cancer treatment, either
Citation: Rødland, G.E.; Hauge, S.;
                                          as monotherapy or in combination with chemo- or radiotherapy. Here, we addressed whether
Hasvold, G.; Bay, L.T.E.; Raabe,
                                          simultaneous inhibition of WEE1 and ATR might be advantageous. Effects of the WEE1 inhibitor
T.T.H.; Joel, M.; Syljuåsen, R.G.
                                          MK1775 and ATR inhibitor VE822 were investigated in U2OS osteosarcoma cells and in four lung
Differential Effects of Combined
ATR/WEE1 Inhibition in Cancer
                                          cancer cell lines, H460, A549, H1975, and SW900, with different sensitivities to the WEE1 inhibitor.
Cells. Cancers 2021, 13, 3790.            Despite the differences in cytotoxic effects, the WEE1 inhibitor reduced the inhibitory phosphorylation
https://doi.org/10.3390/                  of CDK, leading to increased CDK activity accompanied by ATR activation in all cell lines. However,
cancers13153790                           combining ATR inhibition with WEE1 inhibition could not fully compensate for cell resistance to
                                          the WEE1 inhibitor and reduced cell viability to a variable extent. The decreased cell viability upon
Academic Editor: Roberta Visconti         the combined treatment correlated with a synergistic induction of DNA damage in S-phase in U2OS
                                          cells but not in the lung cancer cells. Moreover, less synergy was found between ATR and WEE1
Received: 3 July 2021                     inhibitors upon co-treatment with radiation, suggesting that single inhibitors may be preferable
Accepted: 13 July 2021
                                          together with radiotherapy. Altogether, our results support that combining WEE1 and ATR inhibitors
Published: 28 July 2021
                                          may be beneficial for cancer treatment in some cases, but also highlight that the effects vary between
                                          cancer cell lines.
Publisher’s Note: MDPI stays neutral
with regard to jurisdictional claims in
                                          Keywords: WEE1 kinase; ATR kinase; replication stress; synergy; combination therapy; lung cancer;
published maps and institutional affil-
                                          radiosensitization; CDK activity
iations.

                                          1. Introduction
Copyright: © 2021 by the authors.
Licensee MDPI, Basel, Switzerland.
                                               The ataxia telangiectasia and Rad3-related (ATR) and WEE1 kinases are two key
This article is an open access article
                                          players in DNA damage and replication stress response, and both kinases are considered
distributed under the terms and           promising targets for cancer treatment [1]. When activated, ATR leads to cell cycle check-
conditions of the Creative Commons        point arrest in S- and G2-phases, DNA damage repair, replication fork protection, and
Attribution (CC BY) license (https://     reduced origin firing [2]. Thus, cells with reduced ATR function will have compromised
creativecommons.org/licenses/by/          checkpoints and increased sensitivity to DNA damage and replication stress [3,4]. WEE1
4.0/).                                    is an important cell cycle regulator and is required for cell cycle checkpoint arrest in S-

Cancers 2021, 13, 3790. https://doi.org/10.3390/cancers13153790                                             https://www.mdpi.com/journal/cancers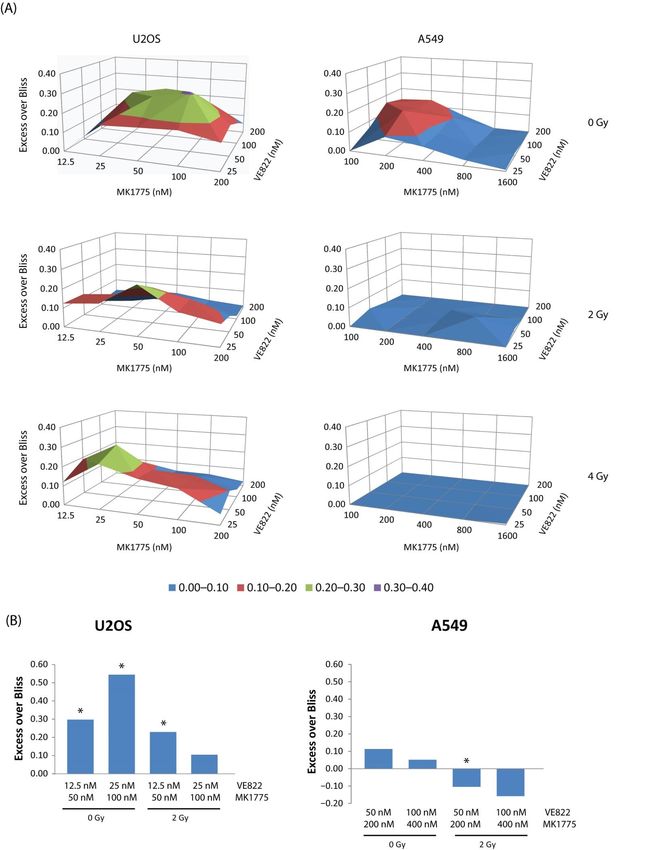
Cancers 2021, 13, 3790                                                                                          2 of 22

                         and G2-phases [5,6]. WEE1 suppresses the activity of cyclin-dependent kinases 1 and 2
                         (CDK1/2) by mediating the inhibitory phosphorylation on tyrosine 15 [7,8]. WEE1 inhibi-
                         tion therefore causes premature mitotic entry and abrogation of the DNA-damage-induced
                         G2 checkpoint, often resulting in mitotic catastrophe [9]. Furthermore, S-phase WEE1 inhi-
                         bition causes unscheduled firing of replication origins and activates endonucleases such as
                         MUS81, which can lead to massive DNA damage and replication catastrophe [5,10–12].
                               Inhibitors of ATR and WEE1 are promising as new treatment agents, and recent
                         studies suggest that simultaneous inhibition of ATR and WEE1 might be more beneficial
                         than either single treatment. Firstly, pointing toward a likely synergy between WEE1
                         and ATR inhibitors, several previous studies have shown synergistic effects on cancer
                         cell killing when the WEE1 inhibitor MK1775 is combined with inhibitors of CHK1, a
                         major downstream effector of ATR [13–17]. We recently found that this synergy can be
                         explained by a synergistic induction of S-phase DNA damage, likely due to WEE1 and
                         CHK1 regulating two different steps in replication initiation, namely CDK activity and
                         CDC45 loading onto chromatin [12]. In another study, focusing on the triple combination of
                         WEE1 and CHK1 inhibitors with gemcitabine, WEE1 inhibition was found to show distinct
                         effects on mitosis not shared by CHK1 inhibition [18]. Furthermore, a few recent studies
                         have also reported synergistic effects upon combining ATR and WEE1 inhibitors [19–22].
                         More specifically, WEE1 and ATR inhibitors caused the synergistic killing of acute myeloid
                         leukemia (AML), biliary tract, and breast cancer cells, likely due to problems arising in
                         S-phase and G2/M [19–21,23]. Notably, this combination appears to be well tolerated
                         in mouse models, as it showed little toxicity in normal tissue [19]. However, the effects
                         of combined WEE1 and ATR inhibition in other cancer cell types and the mechanisms
                         underlying the synergistic killing remain poorly understood.
                               Here, we report the effects of the WEE1 inhibitor MK1775 (AZD1775/Adavosertib)
                         and the ATR inhibitor VE882 (VX-970/M6620/Berzosertib), alone and in combination, on
                         the osteosarcoma cell line U2OS and on a panel of four different lung cancer cell lines with
                         different sensitivities to the WEE1 inhibitor. We found a large synergistic reduction in cell
                         viability upon the combined treatment in U2OS and in two of the lung cancer cell lines.
                         However, the combined treatment could not fully compensate for cell resistance to the
                         WEE1 inhibitor. Our findings support that combining WEE1 and ATR inhibitors may be a
                         promising treatment strategy, but more studies will be needed to be able to predict which
                         patients will benefit from such a treatment.

                         2. Results
                         2.1. Combined Inhibition of WEE1 and ATR Gives Synergistic Induction of DNA Damage in
                         S-Phase Accompanied by Synergistic Cell Killing in U2OS Cells
                              In a previous screen identifying drugs that synergized with the WEE1 inhibitor
                         MK1775 to cause DNA damage in S-phase, we found two CHK1 inhibitors (AZD7762 and
                         LY2603618) to be among the top hits [12]. Since CHK1 is a downstream target of ATR, and
                         ATR is the apical kinase in the replication stress response, we hypothesized that combining
                         MK1775 with an inhibitor of ATR would give a response similar to, or even better than,
                         the combined WEE1/CHK1 inhibition. First, we investigated DNA damage signaling via
                         immunoblotting of U2OS cells, as this cell line was used in our previous experiments on
                         WEE1/CHK1 inhibition [12]. The ATR or WEE1 inhibitors alone (200 nM VE822 or 200 nM
                         MK1775) showed no phosphorylation of DNA damage markers ATM S1981, DNA-PK
                         S2056, or RPA S4/S8 at 1–6 h after treatment, but some phosphorylation occurred at 24 h
                         and was most pronounced with the WEE1 inhibitor (Figure 1A). However, combined
                         treatment with ATR and WEE1 inhibitors caused phosphorylation of these targets already
                         at 6 h and a further increase at later time points, consistent with increased DNA damage
                         (Figure 1A). Similar results were obtained with a different ATR inhibitor (AZD6738) and
                         with siRNA-mediated depletion of WEE1 (Figure S1A,B). Phosphorylation of CHK1 S317,
                         a downstream target of ATR, was induced at all times after treatment with the WEE1
                         inhibitor alone (Figure 1A). This finding is consistent with previous reports [5,20], and
                         activated ATR likely contributes to suppress induction of DNA damage after WEE1 inhibi-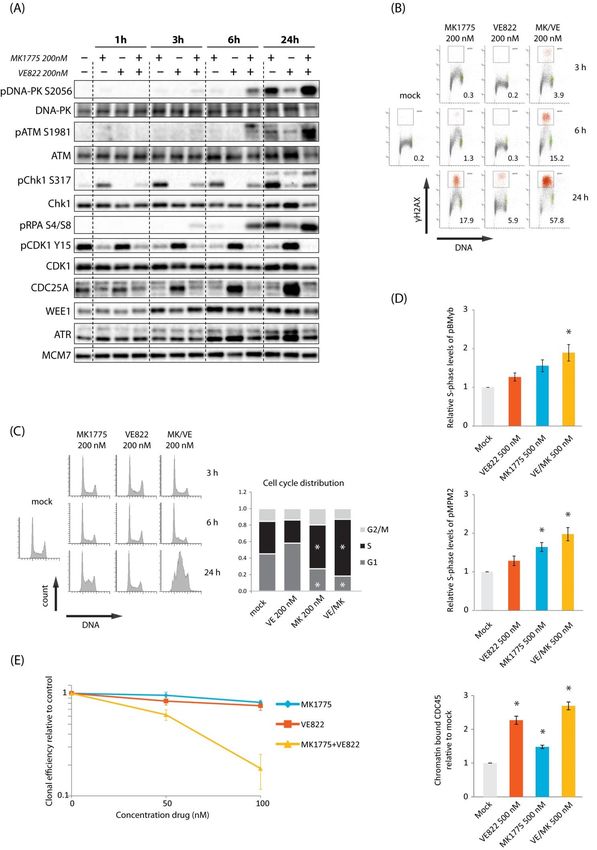
Cancers 2021, 13, 3790                                                                                                3 of 22

                           tion. Furthermore, as expected, the WEE1 inhibitor caused reduced levels of CDK1-Y15
                           inhibitory phosphorylation (Figure 1A), and the ATR inhibitor caused elevated levels of
                           CDC25A in agreement with lack of CDC25A degradation when the ATR/CHK1 pathway
                         Cancers 2021, 13, x                                                                     4 of 23
                           is inhibited [24,25].

                          Figure 1. Synergistic induction of S-phase DNA damage and cell killing in U2OS cells upon combined
                          WEE1/ATR inhibition. (A) Immunoblotting of extracts from U2OS cells treated with MK1775 (200 nM)
                          and VE822 (200 nM) as indicated. (B) Flow cytometry analysis of U2OS cells treated with MK1775
                          (200 nM) and/or VE822 (200 nM) for 3, 6, and 24 h or left untreated (mock). Scatter plots of γH2AX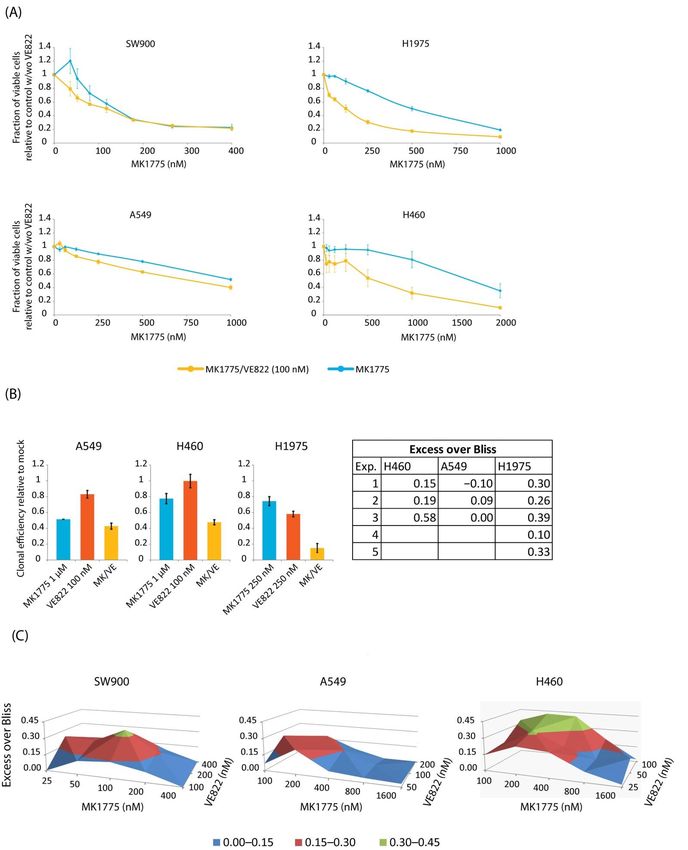
Cancers 2021, 13, 3790                                                                                                   4 of 22

                         versus DNA content (Hoechst) are shown. Numbers indicate percentage of cells with strong γH2AX
                         levels (indicated in red color). (C) Left: Histograms showing cell cycle profiles (counts versus DNA
                         content) from the same experiment as in (B). Right: Quantification of cell cycle distribution from
                         three independent experiments treated as in (B) for 24 h. All other results in (A–C) are representative
                         of three or more independent similar experiments. (D) Flow cytometry analysis of phospho-B-MYB,
                         phospho-MPM2, and chromatin-bound CDC45 in U2OS treated with MK1775 (500 nM) and/or
                         VE822 (500 nM) for 1 h. Median levels were measured within a region of cells with S-phase DNA
                         content as indicated in Figures S1D and S3. (E) Clonogenic survival of U2OS cells treated with
                         MK1775 and/or VE822 at the indicated concentrations for 24 h. Clonal efficiency relative to that of
                         untreated cells (control) is shown. Error bars: SEM (n = 3). In (C), p values were determined by the
                         two-tailed two-sample Student’s t test (test criterion: treated sample 6= mock), and in (D), p values
                         were determined by the two-tailed Student’s one-sample t test (test criterion: fold change 6= 1),
                         * p ≤ 0.05.

                               To study the damage response in individual cells and correlate it with cell cycle effects,
                         we performed flow cytometry analysis of the DNA damage marker γH2AX and cell cycle
                         distribution. In cells treated with the WEE1 inhibitor alone, the whole S-phase population
                         showed a small elevation in γH2AX signals at 3 h and a fraction of cells (~18%) showed
                         strong γH2AX signals at 24 h (Figure 1B). This was accompanied by an accumulation
                         of cells in S-phase at 24 h (Figure 1C, bottom left histogram), indicating high replication
                         stress and problems with S-phase progression. In contrast, no S-phase accumulation was
                         observed in ATR inhibition alone, and only a low fraction of cells (~6%) showed strong
                         γH2AX signals at 24 h (Figure 1B,C). The combined treatment clearly induced synergistic
                         effects, with markedly more cells (~58%) showing strong γH2AX signals at 24 h (Figure 1B),
                         together with a strong S-phase accumulation (Figure 1C). The percentage of cells positive
                         for the mitotic marker phospho-H3, however, was not higher than 5% or 6% at any of the
                         time points after the combined treatment (Figures S1C and S2C, left (U2OS)), indicating no
                         major synergistic effects of the combination of these inhibitors on premature mitotic entry.
                               A likely cause for DNA damage in S-phase in response to WEE1 and ATR inhibition is
                         increased replication initiation. Consistent with this, we observed elevated CDK activity,
                         as measured via flow cytometry analysis of phospho-B-MYB and phospho-MPM2, and
                         more loading of the replication initiation factor CDC45 in individual S-phase cells 1 h
                         after combined treatment (Figure 1D and Figure S1D). Moreover, the ATR inhibitor alone
                         showed a bigger effect on CDC45 loading than the WEE1 inhibitor alone, while the WEE1
                         inhibitor showed bigger effects on CDK activity (Figure 1D). This finding is analogous to
                         our previous result with CHK1 and WEE1 inhibitors [12]. We next investigated effects
                         on cell survival. U2OS cells were treated with inhibitors alone or in combination for
                         24 h, and colony formation was assessed 12–14 days later. A clear synergistic reduction
                         in clonogenic survival was observed after the combined treatment with 100 nM of each
                         inhibitor (Figure 1E). We conclude that combined inhibition of WEE1 and ATR leads to a
                         synergistic increase in S-phase DNA damage and reduction in clonogenic survival in U2OS
                         cells. These results are largely similar to our previous findings obtained with combined
                         inhibition of WEE1 and CHK1 [12].

                         2.2. Lung Cancer Cell Lines H460, A549, H1975, and SW900 Show Large Differences in
                         Sensitivity to the WEE1 Inhibitor Despite a Similar Induction of CDK Activity
                              To explore the potential of combined ATR and WEE1 inhibition for lung cancer
                         treatment, we used a panel of four lung cancer cell lines with previously identified large
                         differences in sensitivity to the WEE1 inhibitor MK1775 (sensitive SW900 > H1975 > A549
                         > H460 resistant) [26]. To better characterize the differences between these cell lines,
                         we first addressed effects of the WEE1 inhibitor alone. Consistent with the previously
                         published results, the four cell lines showed different sensitivities to MK1775, H460 being
                         most resistant and SW900 most sensitive, as measured by CellTiter-Glo viability assays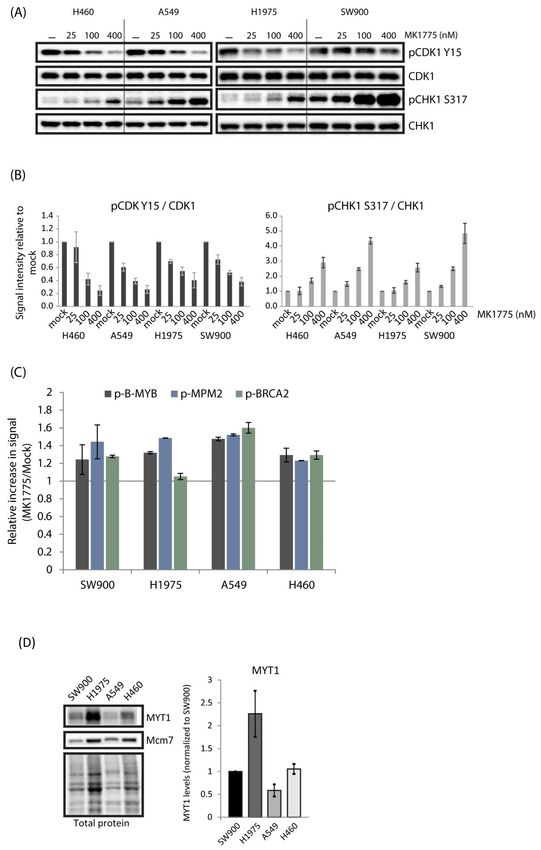
Cancers 2021, 13, 3790                                                                                                                             5 of 22

                                      (Figure 2A and Table S1). Furthermore, MK1775-induced S-phase accumulation and
                                      phosphorylation of DNA damage markers ATM, DNA-PK, and RPA were highest in
                                      SW900 and lower in the more resistant cell lines (Figures 2B,C and S4A), suggesting that
                                      induction of S-phase DNA damage parallels the loss of cell viability. Measurement of
                                      replication fork speed after treatment with the WEE1 inhibitor in the most resistant cell
                                      line H460 compared to U2OS cells confirmed that replication was unperturbed in H460
                                      (Figure S4B–D). This is in agreement with high WEE1 inhibitor resistance and shows that
        Cancers 2021, 13, x                                                                                          6 of 23
                                      the lack of S-phase accumulation in H460 was not due to the cells not cycling.

              Figure 2. Lung cancer cell lines show large differences in sensitivity to the WEE1 inhibitor MK1775. (A) CellTiter-Glo
      Figure 2. Lung cancer cell lines show large differences in sensitivity to the WEE1 inhibitor MK1775. (A) CellTiter-Glo
              viability assays of SW900, H1975, A549, and H460 cells treated with the indicated concentrations of MK1775 for 24 h and
      viability  assaysatof
              assayed       SW900,
                          5 days afterH1975,   A549, and
                                       drug removal       H460
                                                      (4 days for cells treated
                                                                  H1975).  Errorwith
                                                                                 bars: the
                                                                                       SEMindicated
                                                                                            (n = 3). (B)concentrations   of MK1775
                                                                                                          Histograms showing          forpro-
                                                                                                                              cell cycle  24 h and
      assayed    at (counts
              files 5 days versus
                            after drug
                                   DNA removal      (4 days
                                          content) from      for H1975,
                                                         SW900,   H1975).A540,
                                                                             Error
                                                                                andbars:
                                                                                     H460SEM
                                                                                           cells (n = 3).with
                                                                                                 treated    (B) 200
                                                                                                                Histograms
                                                                                                                    nM MK1775showing
                                                                                                                                for 24 h.cell
                                                                                                                                           (C) cycle
      profilesImmunoblotting
                (counts versusofDNAextracts from H460,
                                         content)   fromA549,  H1975,
                                                          SW900,        and SW900
                                                                    H1975,   A540,cells
                                                                                    andtreated
                                                                                          H460 with
                                                                                                 cells0,treated
                                                                                                          200, and 1000200
                                                                                                                 with   nMnMMK1775
                                                                                                                               MK1775for 24for
                                                                                                                                            h. 24 h.
              The results in (B,C) are representative of two independent experiments.
      (C) Immunoblotting      of extracts from H460, A549, H1975, and SW900 cells treated with 0, 200, and 1000 nM MK1775 for
      24 h. The results in (B,C) are representative of two independent experiments.

                                           To address whether these differences might simply be a result of poor drug uptake
                                      in the most resistant cells, we examined, by immunoblotting, the phosphorylation of
                                      CDK1-Y15 and CHK1 S317 at 1h after treatment with a range of concentrations of MK1775
                                      (25–400 nM). The results show that the inhibitor had about similar effects in all four
                                      lung cancer cell lines (Figure 3A,B). Furthermore, phosphorylation of the CDK targets
                                      B-MYB, MPM2, and BRCA2 was induced in all cell lines in response to WEE1 inhibition
                                      (Figures 3C and S3). The levels of induction were comparable to that found in U2OS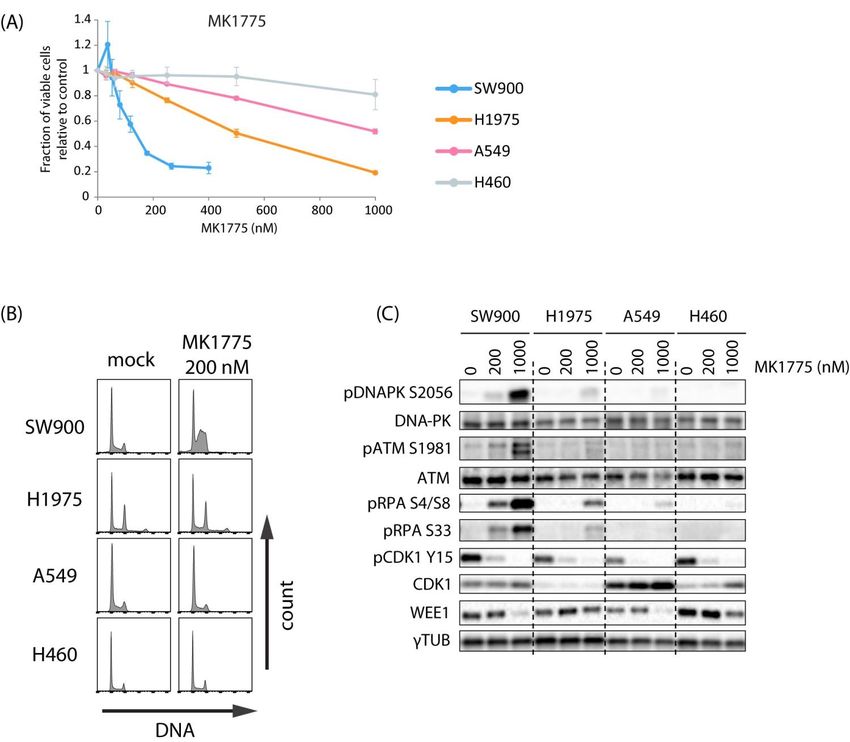
Cancers 2021, 13, 3790                                                                                                                                6 of 22

                                      (Figure 1D), and even though slight differences were observed they did not correlate with
                                      MK1775 sensitivity (Figure 3C compared to Figure 2A). Thus, MK1775 appears to cause
                                      increased CDK activity and ATR activity in a similar manner in all the cell lines, excluding
                                      that variations in drug uptake could be a main reason for the differences in sensitivity.
                                      Interestingly, high levels of MYT1 kinase may limit MK1775-induced CDK activity, thereby
                                      causing resistance to WEE1 inhibition [27]. However, as A549 cells showed the lowest
                                      levels of MYT1 and were highly resistant to MK1775, MYT1 levels did not correlate well
                                      with WEE1 inhibitor resistance across our cell panel (Figure 3D). This further supports our
                         Cancers 2021,finding
                                       13, x   that MK1775-induced CDK activity was similar in these cell lines.            7 of 23

                             Figure 3. MK1775 increases CDK activity and CHK1 phosphorylation in lung cancer cell lines. (A) Immunoblotting of
                                   Figure
                             extracts       3. MK1775
                                      from H460,          increases
                                                 A549, H1975, and SW900CDK     activity
                                                                         cells treated    and
                                                                                       with     CHK1
                                                                                            0, 25,        phosphorylation
                                                                                                   100, and 400 nM MK1775 for in1 h.lung  cancer cell lines.
                                                                                                                                     (B) Quantification
                                   (A) from
                             of results  Immunoblotting
                                            experiments as of
                                                            in extracts fromSEM
                                                               A. Error bars:   H460,
                                                                                    (n =A549,
                                                                                         3). (C)H1975,    and SW900
                                                                                                 Flow cytometry        cells
                                                                                                                  analysis of treated   with 0, 25,
                                                                                                                              phospho-B-MYB,     phos-100, and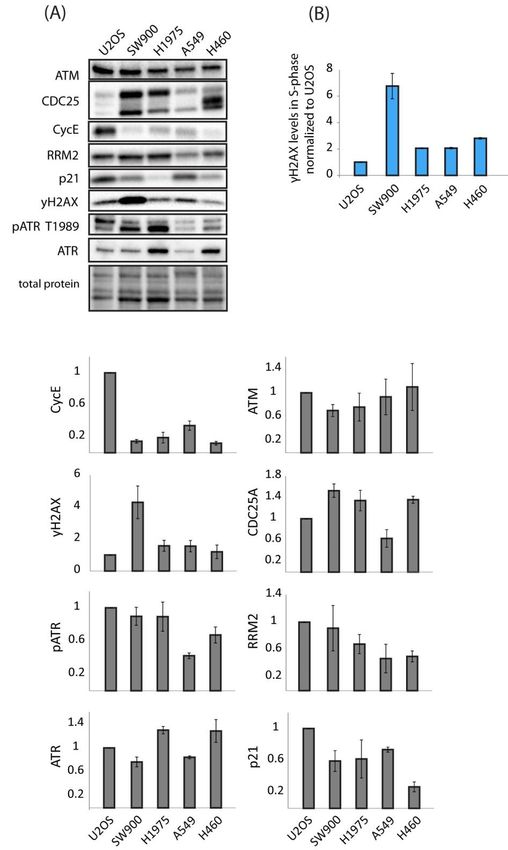
Cancers 2021, 13, 3790                                                                                                   7 of 22

                         400 nM MK1775 for 1 h. (B) Quantification of results from experiments as in A. Error bars: SEM (n = 3).
                         (C) Flow cytometry analysis of phospho-B-MYB, phospho-MPM2, and phospho-BRCA2 in cells
                         treated with 500 nM of MK1775 for 1 h, showing relative signal intensity (MK1775/mock) measured
                         within a region of cells with S-phase DNA content, as indicated in Figure S3. (D) Immunoblotting of
                         extracts from SW900, H1975, A549, and H460 showing MYT1 levels. Bar chart shows quantification of
                         MYT1 levels relative to total protein and normalized to the value in SW900. Error bars: SEM (n = 3).

                         2.3. Combined Inhibition of WEE1 and ATR Gives Variable Effects in the Lung Cancer Cell Lines
                              Our finding that MK1775-induced increase in CDK activity was accompanied by
                         phosphorylation of CHK1 S317 in all lung cancer cell lines suggests that ATR might have
                         a protective role after WEE1 inhibition similar to that seen in U2OS. We therefore asked
                         whether combined inhibition of ATR and WEE1 in the lung cancer cells would give a
                         synergistic reduction in cell viability associated with induction of DNA damage in S-phase,
                         such as was observed for U2OS cells (Figure 1). However, combined inhibition of WEE1 and
                         ATR appeared to reduce cell viability to a different extent in the four lung cancer cell lines,
                         showing more than additive effects in H460, H1975, and SW900, but little synergy in A549
                         (Figures 4A and S5A and Table S1). We noted that in SW900 synergistic effects were only
                         obtained for very low concentrations of MK1775 at which the drug had no or little effect
                         alone. Moreover, addition of the ATR inhibitor could not fully compensate for cell resistance
                         to the WEE1 inhibitor. (The cell lines being most resistant to the WEE1 inhibitor alone,
                         H460 and A549, showed IC50 values for MK1775 of about 600–750 nM after the combined
                         treatment compared to about 100 nM for H1975 and SW900). In these experiments the
                         inhibitor treatment lasted 24 h and we applied a concentration of the ATR inhibitor (100 nM
                         VE822) yielding 10–20% reduction in viability in all cell lines except in H460, which showed
                         about 40% reduction in viability. Similar synergistic effects were obtained in H460 cells if
                         the WEE1 inhibitor was combined with 50 nM VE822 (data not shown). To validate our
                         findings, we performed colony formation assays with concentrations of the drugs expected
                         to give synergistic effects. (A549, for which little synergy was observed, was treated with
                         the same concentrations as H460). SW900 cells did not form colonies when cultured at
                         low densities and could therefore not be used for this assay (unpublished observations).
                         The effects on long-term survival were similar to those seen by the viability assay, with
                         strong synergy observed only in H1975 and H460 cells, but not in A549 cells (Figure 4B).
                         Of note, statistical analysis of Bliss scores indicate that the synergistic effects observed in
                         H460 and SW900 were not significant (Figure S5A). However, the effect of the combined
                         treatment in H460 was more than additive in all replicates of the experiments performed.
                         Nonetheless, we wanted to more thoroughly explore the large synergistic effect in H460
                         and to test whether better synergy could be obtained in SW900 and A549 using other
                         concentrations of the ATR inhibitor. To this end, we performed viability experiments with
                         a matrix of concentrations of VE822 and the WEE1 inhibitor, with the inhibitor treatment
                         lasting for 48 h. ATR inhibitor concentrations were chosen based on sensitivity to VE822
                         single treatment (Figure S5B). Combined treatment with MK1775 and VE822 gave a more
                         than additive (excess over Bliss) reduction in viability in all cell lines (Figure 4C). However,
                         the reduction in viability was significantly higher than the expected additive effect for more
                         combinations in H460 than in the other two cells lines, and overall the synergy was also
                         stronger (higher Bliss score) (Figures 4C and S5C), thus confirming the results above (in
                         Figure 4A,B). We concluded that combined treatment with WEE1 and ATR inhibitors gives
                         a large synergistic reduction in cell viability in some, but not all, lung cancer cell lines.
Cancers 2021, 13, 3790 8 of 22
Cancers 2021, 13, x 9 of 23
Figure 4. Cytotoxic effects of combined WEE1/ATR inhibition vary between lung cancer cells. (A) CellTiter-Glo viability
Figure 4. Cytotoxic effects of combined WEE1/ATR inhibition vary between lung cancer cells. (A) CellTiter-Glo viability assays
assays of SW900, H1975, A549, and H460 cells from the same experiments as in Figure 2A, treated with MK1775 together
of SW900, with
H1975,
100A549, and H460
nM VE822 cells
(yellow) from the
compared to same experiments
the results asalone
of MK1775 in Figure
(blue)2A, treated
shown with 2A.
in Figure MK1775 together
Cell viability is with
nor- 100 nM
VE822 (yellow) compared to the results of MK1775 alone (blue) shown in Figure 2A. Cell viability is normalized to mock for
MK1775 alone and to VE822 alone for the combination. The fraction of viable cells after treatment with 100 nM VE822 alone
was approximately 80% for A549 and H1975, 90% for SW900, and 60% for H460 cells. Error bars: SEM (n = 3). (B) Clonogenic
survival assays of A549, H460, and H1975 cells treated with MK1775 and/or VE822 at the indicated concentrations for 24 h.
Clonal efficiency relative to untreated cells is shown. Table to the right shows the difference between the measured effect and the
expected additive effect (excess over Bliss) for the combined treatment in each experiment (p < 0.05 for H1975 cells). Error bars:
SEM (n ≥ 3). (C) Excess over Bliss from CellTiter-Glo viability assays performed on SW900, A549, and H460 with a matrix of
combinations of MK1775 and VE822. Cells were treated for 48h with inhibitors and assayed three days after drug removal.Cancers 2021, 13, 3790 9 of 22
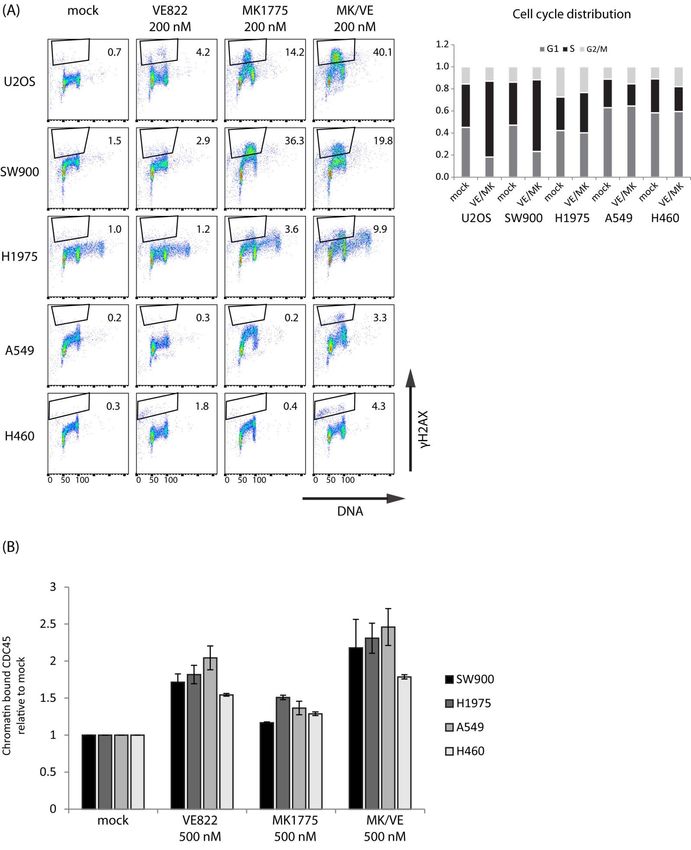
To investigate whether the reduction in cell viability in lung cancer cells after the
combined WEE1/ATR inhibitor treatment was associated with increased S-phase DNA
damage, we performed flow cytometry analysis of γH2AX induction. First, we wanted
to compare the effect to that observed in U2OS and treated cells for 24 h with 200 nM
of MK1775 and VE822 alone and in combination. In U2OS cells the combined treatment
with MK1775 and VE822 gave a large synergistic increase of DNA damage in S-phase,
but no or only small increases were observed in the lung cancer cell lines (Figure 5A).
Furthermore, an accumulation of cells in S-phase was only observed in U2OS and SW900
upon combined treatment, however, in SW900 the effect was only marginally larger than
that seen for single treatment with MK1775 (compare Figure 5A to Figure S4A). To rule
out the possibility that combination treatment with a higher concentration of MK1775
would give a large synergistic induction of DNA damage in the most resistant lung cancer
cell lines, we repeated the flow cytometry analysis of γH2AX in H460, A549, and H1975
cells treated with a dose of MK1775 that gave ~50% loss in viability and combined it with
100 nM of VE822. Again, a large synergistic effect was not obtained (Figure S2A). In both
experiments above, we also examined the drug’s effect on mitotic entry by staining for
phospho-H3 but found no large synergistic increase in mitotic fraction that could explain
the synergy observed in the viability experiments (Figure S2B,C). To investigate potential
mechanisms behind why lung cancer cell lines lacked a synergistic induction of S-phase
DNA damage, we asked whether drug-induced loading of CDC45 might be defective.
However, as seen in U2OS (Figure 1D), CDC45 loading at 1 h after treatment with 500 nM
of both MK1775 and VE822 was increased in all cell lines and was larger than for treatment
with each inhibitor alone (Figure 5B). This suggests that the combined treatment similarly
increases replication initiation in U2OS and lung cancer cell lines, although to a slightly
lesser extent in H460 than in the other cell lines. Together, these results suggest that despite
elevated replication initiation, the reduction in viability upon combined treatment with
WEE1 and ATR inhibitors cannot simply be explained by an increased induction of S-phase
DNA damage in the lung cancer cells.Cancers 2021, 13, 3790 10 of 22
Cancers 2021, 13, x 11 of 23
Figure 5. WEE1/ATR inhibition does not cause a large synergistic induction of γH2AX in lung cancer cells despite in-
Figure 5. WEE1/ATR inhibition does not cause a large synergistic induction of γH2AX in lung cancer cells despite increased
creased chromatin loading of CDC45. (A) Flow cytometry analysis of U2OS, SW900, H1975, A549, and H460 cells treated
chromatin loading (200
with MK1775 of CDC45. (A)VE822
nM) and/or Flow (200
cytometry
nM) for analysis
24 h or leftofuntreated
U2OS, SW900, H1975,
(mock). Left: A549,
Scatter and
plots H460 cells
of γH2AX versustreated
DNA with
MK1775 (200 (Hoechst).
content nM) and/or VE822indicate
Numbers (200 nM) for 24 hofor
percentage leftwith
cells untreated (mock).
strong γH2AX Left:(within
levels Scattertheplots of γH2AX
marked regions). versus
Results DNA
content (Hoechst). Numbers indicate percentage of cells with strong γH2AX levels (within the marked regions). Results are
representative of three similar independent experiments. Right: cell cycle analysis from mock and combination (MK/VE)
samples showing the average fraction of cells in G1, S, and G2/M from three experiments. (B) Flow cytometry analysis of
chromatin-bound CDC45 in lung cancer cell lines, treated as in Figure 1D and analyzed as in Figure S1D.Cancers 2021, 13, 3790 11 of 22
2.4. Less Synergy Is Observed between WEE1/ATR Inhibitors When Cells Are Co-Treated
with Radiation
Both WEE1 and ATR inhibitors have been shown to radiosensitize cancer cells [28–34],
and are in clinical testing together with ionizing radiation (IR). Radiosensitization is thought
to occur through cell cycle checkpoint abrogation, inhibition of DNA repair, and induction
of DNA damage in S-phase [32]. To better evaluate the clinical potential of combined
WEE1/ATR inhibition, we therefore addressed whether the observed synergy was main-
tained or possibly enhanced in the presence of additional radiation treatment. Furthermore,
we wanted to compare a cell line that showed large synergistic effects to one showing
weak synergy. Thus, to explore this, we performed cell viability assays of U2OS and A549
cells treated with X-ray radiation (2 and 4 Gy) and a matrix of different concentrations
of MK1775 and VE822 alone and in combination. Since both checkpoint induction and
DNA damage repair occurs within the first 48 h after irradiation, we added the inhibitors
before irradiation, kept them in the cell medium for 48 h, and measured viability via
CellTiter-Glo assay 5 days after irradiation. As expected, the combined treatment gave
stronger synergy in U2OS than in A549 in non-irradiated cells (Figure 6A, top panel).
Strikingly, the synergy was overall weakened in both cell lines upon exposure to radiation
(Figure 6A, mid and bottom panels). In U2OS cells there was still some synergy detected
in the irradiated samples, but interestingly the inhibitor concentrations that gave synergy
were lower compared to that seen in the 0 Gy samples (Figure 6A, compare areas of green
color in the U2OS plots). Cell cycle analysis of U2OS showed a transient accumulation in S-
and G2-phase after IR as expected due to checkpoint activation and as measured at 6 h after
treatment (Figure S6B, left). Of note, no further increase in the S-phase population was
observed in inhibitor-treated irradiated cells at this time point, which might help explain
why effects are different in irradiated versus non-irradiated cells. On the other hand, the
highest inhibitor concentrations caused a strong S-phase accumulation regardless of IR at
24 h after treatment (Figure S6B, second left chart). In A549, no accumulation of cells in
S-phase was observed in irradiated cells at 6 h (likely because of a stronger G1 checkpoint
in this cell line), and after 24 h the irradiated samples with and without inhibitors had very
few cells in S-phase (Figure S6B, right). The cell cycle effects after combined inhibitor and
IR treatment are complex, likely because the inhibitors cause checkpoint abrogation and
inhibition of DNA repair in addition to inducing S-phase damage. To explore whether
the above findings on cell viability were reflected when studying long-term survival, we
performed clonogenic assays of U2OS and A549 cells treated with two concentrations
of MK1775 and VE822 alone and in combination and compared non-irradiated cells to
cells exposed to X-rays at a dose of 2 Gy. The results were similar to those obtained in the
viability assays, showing larger synergistic effects in U2OS than in A549 both in the absence
and presence of IR, and a weakened synergy, or even antagonism (A549), in cells exposed
to X-rays as compared to non-irradiated cells (Figure 6B). Of note, the ATR inhibitor alone
showed a bigger radiosensitizing effect than the WEE1 inhibitor alone in both cell lines,
with the highest effect in U2OS (Figure S6A,C). Bliss independence analysis of synergy
between IR and VE822, MK1775, or combined VE822/MK1775 also showed the overall
biggest effects for the ATR inhibitor alone (Figure S6D). In these cell lines, the ATR inhibitor
thus appears most promising to use for radiosensitization. Altogether, these results suggest
that no major benefit can be obtained from combining dual WEE1/ATR inhibition with
radiotherapy, but again the magnitude of the effects varies between cell lines.Cancers 2021, 13, 3790 12 of 22
Cancers 2021, 13, x 13 of 23
Figure 6. Synergy between MK1775 and VE822 is weakened when combined with radiation. (A) U2OS and A549 cells
were seeded in 96-well plates pre-printed with a matrix of different concentrations of VE822 and MK1775 alone and in
combination and exposed to X-ray radiation at doses of 2 and 4 Gy or left unexposed. Drugs were washed out 48 h afterCancers 2021, 13, 3790 13 of 22
treatment and viability measured 3 days after drug removal using CellTiter-Glo assays. Average synergy scores (excess
over Bliss) for each dose pair are presented in surface plots (n = 4). The average fraction of viable cells after 2 and 4 Gy
were 0.4 and 0.2 (U2OS) and 0.6 and 0.4 (A549). (Data for 0 Gy in A549 are from the same experiment as in Figure 4C).
(B) Clonogenic assays of U2OS and A549 treated with two different concentrations of VE822 and MK1775 alone and in
combination and exposed to X-ray radiation at a dose of 2 Gy or left unexposed. Cells were left with drug on for 24 h and
incubated further without drug until colonies were formed (12–14 days). Average synergy score (excess over Bliss) for
combined treatment is plotted in bar graphs (n = 3). The average fraction of viable cells after 2 Gy were 0.4 (U2OS) and 0.6
(A549). p values were determined by the two-tailed Student’s one-sample t test, * p < 0.05.
2.5. No Correlation Is Found between Expression Levels of Biomarkers Associated with WEE1 and
ATR Inhibitor Sensitivity and Observed Differences in Sensitivity in Lung Cancer and U2OS Cells
The panel of cell lines tested in our experiments showed widely different sensitivities
and responses to treatment with ATR and WEE1 inhibitors both alone and in combination.
A number of sensitivity/resistance markers have been proposed for WEE1 and ATR in-
hibitors. We set out to test whether some of these markers could account for the differences
in sensitivity observed in our cell lines. First, it should be pointed out that no positive
correlation between WEE1 inhibitor sensitivity and ATR inhibitor sensitivity was observed
in our lung cancer cell lines (compare Figure 2A to Figure S5B). The protein expression
levels of Cyclin E, cdc25A, ATM, p21, RRM2, γH2AX, and ATR/pATR were assessed via
immunoblotting on samples from exponentially growing, untreated U2OS and lung cancer
cells (Figure 7A). In addition, we measured S-phase levels of γH2AX by flow cytometry
(Figure 7B). We found no clear correlation between WEE1 or ATR inhibitor sensitivity and
the markers investigated. For instance, H460 and U2OS were most sensitive to the ATR
inhibitor (Figures S5B and S6A), but none of the markers were outstanding for these two
cell lines (Figure 7A,B). Furthermore, U2OS and SW900 were most sensitive to the WEE1
inhibitor (Figures 2A and S6A), and these two cell lines did not have a common marker
(Figure 7A,B). However, cyclin E levels were comparatively very high in U2OS cells and
γH2AX levels very high in SW900 cells. In addition, they both had relatively high levels
of phosphorylated ATR. Together, this could indicate elevated endogenous replication
stress in these cell lines, which might be consistent with their high sensitivity to the WEE1
inhibitor. On the other hand, high γH2AX levels would be expected also in U2OS if they
were suffering from replication stress. Finally, U2OS, H1975, and H460 showed the biggest
synergist effects upon the combined treatment (Figures 1, 4 and 6A), but no marker showed
a distinct expression pattern in these cell lines. We concluded that no single biomarker,
among the ones tested, could likely account for the differences in sensitivity observed in
our panel of cell lines exposed to WEE1 and/or ATR inhibitors.Cancers 2021, 13, 3790 14 of 22
Cancers 2021, 13, x 15 of 23
Figure7.7.Expression
Figure Expressionlevels
levelsofofproposed
proposedbiomarkers
biomarkersofofWEE1
WEE1andandATR
ATRinhibitor
inhibitorsensitivity
sensitivityininlung
lung
cancer and U2OS cell lines. (A) Immunoblot of lysates from exponentially growing cells. Bar
cancer and U2OS cell lines. (A) Immunoblot of lysates from exponentially growing cells. Bar charts charts
(grey) show quantifications of protein levels relative to total protein and normalized to the levels in
(grey) show quantifications of protein levels relative to total protein and normalized to the levels
U2OS. Error bars: SEM (n ≥ 3). (B) Flow cytometry analysis of γH2AX levels in S-phase of expo-
in U2OS. Error bars: SEM (n ≥ 3). (B) Flow cytometry analysis of γH2AX levels in S-phase of
nentially growing cells normalized to U2OS. Error bars: SEM (n = 2).
exponentially growing cells normalized to U2OS. Error bars: SEM (n = 2).
3.3.Discussion
Discussion
Duetototheir
Due theirprotective
protectiveroles
rolesininthe
thereplication
replicationstress
stressresponse
responseand
andininG2
G2checkpoint
checkpoint
control, ATR and WEE1 are attractive therapeutic targets. Cancer
control, ATR and WEE1 are attractive therapeutic targets. Cancer cells often showcells often showele-ele-
vated replication stress due to, for example, oncogene expression or tumor
vated replication stress due to, for example, oncogene expression or tumor hypoxia [35,36], hypoxia
[35,36],
which which
likely likely provides
provides sensitivity
sensitivity to ATR ortoWEE1ATR or WEE1 inhibitors.
inhibitors. Furthermore,
Furthermore, loss
loss of the G1of
the G1 checkpoint
checkpoint is frequentis in
frequent
tumorsin tumors
[37] [37] and potentially
and potentially providesreliance
provides increased increased
on reliance
the G2
on the G2 checkpoint, thereby selectively sensitizing cancer cells to checkpoint inhibitorsCancers 2021, 13, 3790 15 of 22
checkpoint, thereby selectively sensitizing cancer cells to checkpoint inhibitors [4,34,38].
The ATR downstream factor CHK1 shows similar roles in replication stress and the G2
checkpoint as ATR, but ATR inhibitors may be better suited for the clinic since CHK1
inhibitors have shown problems with normal tissue toxicity [39]. The approach of simul-
taneous inhibition of WEE1 and ATR has emerged very recently and appears promising
based on preclinical studies of breast cancer and AML [19–21]. To further evaluate this new
exciting approach, we investigated the effects of combined ATR/WEE1 inhibition in U2OS
osteosarcoma and four lung cancer cell lines. Our study shows, for the first time, effects of
this combination in lung cancer. Furthermore, as opposed to focusing only on the most
sensitive cell lines, we particularly included cell lines that are resistant to WEE1 inhibition.
Moreover, we explored the effects of simultaneous ATR/WEE1 inhibition together with
radiation, which is important since radiotherapy is a standard treatment highly relevant to
combine with such inhibitors.
The combined treatment with ATR and WEE1 inhibitors caused a large synergistic
reduction in cell viability in U2OS, H460, and H1975 cells, while the effects were weaker
in SW900 and close to additive in A549 cells. Furthermore, a large synergistic induction
of DNA damage and accumulation of cells in S-phase accompanied the reduction in
cell viability upon the combined treatment in U2OS cells, but not in H1975 or H460
cells. These results demonstrate that combined ATR/WEE1 inhibition can cause very
different effects in different cancer cell lines. These differences are likely related to the fact
that both of these inhibitors cause multiple cellular effects, affecting, for example, DNA
replication, homologous recombination repair, G2 checkpoint control, as well as mitotic
events [2,3,5,10,40–44]. It is possible that S-phase DNA damage is highly important in U2OS
cells upon treatment with the inhibitors, while the other effects, or specific combinations of
them, may be more important in other cell lines. Notably, such differences may have huge
implications for biomarker development. Biomarkers are highly needed for prediction of
responses to these inhibitors in cancer patients and several biomarkers have been suggested,
such as p53 mutation, replication stress associated markers (γH2AX, oncogene expression
and low levels of ribonucleotide reductase subunit RRM2) [3,22,45,46], and multiple other
regulators of DNA damage and cell cycle, such as ATM, CDC25A, MYT1, p21, or ATR
signaling [27,47–50]. We have analyzed and compared protein levels across our cell lines
of several of these markers but have not been able to find one unifying mechanism that
can explain all the different effects observed. Oncogene-associated cyclin E levels were
comparatively high in U2OS cells, indicating elevated endogenous replication stress, but
did not correlate with high expression of the replication stress marker γH2AX. By contrast,
SW900 showed high levels of γH2AX in line with WEE1 inhibitor sensitivity, but on the
other hand it was not particularly sensitive to ATR inhibition, also for which γH2AX is a
proposed sensitivity marker. Furthermore, even though p53 mutation status correlated
with WEE1 inhibitor sensitivity in our panel of lung cancer cells (the two most resistant
cell lines, H460 and A549, have wt-p53 and the two most sensitive cell lines, H1975 and
SW900, have mut-p53), it did not correlate with sensitivity to ATR inhibition (H460 is
most sensitive). Moreover, U2OS, which was highly sensitive to WEE1 inhibition, also has
wt-p53, indicating that no strict correlation between p53 status and sensitivity to WEE1
inhibition exists. This is further corroborated by a previous study where a large panel of
lung cancer cell lines was examined [26]. We concluded that WEE1 and ATR inhibitors
affect multiple mechanisms in the cells, and it might therefore be difficult to find one
universal biomarker for the treatment response to these inhibitors. More likely, a panel of
several biomarkers will be useful.
Interestingly, after WEE1 inhibition alone, the cell lines included in our study showed
similar induction of CDK activity despite very different reductions in cell viability. This
could indicate that the resistant cell lines better tolerate high CDK activity during DNA
replication, avoiding deleterious S-phase DNA damage. High CDK activity after WEE1
inhibition can cause unscheduled replication initiation, replication stalling, and activation
of endonucleases such as MUS81 in S-phase [5,10,11]. One might speculate that MK1775-Cancers 2021, 13, 3790 16 of 22
induced activation of MUS81 endonuclease is defective in the resistant cell lines. In
line with this, we observed that MUS81 chromatin binding assessed via flow cytometry
was increased in U2OS but not in H460 cells upon treatment with MK1775 (Figure S7).
This result may indicate that activation of MUS81 is defective in H460 cells, or that less
substrate for MUS81 is available after WEE1 inhibition in H460 compared to U2OS. Another
possibility is that the most resistant cell lines, H460 and A549, better tolerate replication
stress due to mechanisms related to, for example, translesion synthesis. A recent study
showed that cancer cells can display different sensitivities to an inhibitor of translesion
synthesis, suggesting that this type of replication is more important in some cancer cell
lines than others [51]. Interestingly, A549 cells were sensitive and U2OS cells very resistant
to this inhibitor [51], indicating that A549 uses more translesion synthesis than U2OS. This
could potentially be an underlying reason why A549 better tolerates MK1775- induced
CDK activity than U2OS cells.
We noted that the ATR inhibitor alone showed a bigger effect on CDC45 loading
than the WEE1 inhibitor alone, while the WEE1 inhibitor showed a bigger effect on CDK
activity (Figures 1D and 5B). While WEE1 mainly regulates CDC45 loading due to its role
in suppressing CDK activity, ATR also appears to regulate CDC45 loading in a manner
independent of CDK, similar to our previous finding for CHK1 [12]. However, although
CDC45 loading was higher, the ATR inhibitor induced less phosphorylation of DNA dam-
age markers and less accumulation of cells in S-phase than the WEE1 inhibitor, consistent
with less S-phase DNA damage (Figures 1A–C and 5A). The largest increase in CDC45
loading was seen for the combined treatment, but even if this increase was similar in all
cell lines very little DNA damage induction was observed in three of the lung cancer cell
lines. Thus, in contrast to our previous results with CHK1/WEE1 inhibition [12], there is
no strict correlation between CDC45 loading and induction of S-phase DNA damage when
considering ATR/WEE1 inhibition.
Our measurements of cell viability in irradiated cells showed less synergy between
ATR and WEE1 inhibition compared to the effect seen in the absence of IR. We also noted
that ATR inhibition had a bigger radiosensitizing effect than WEE1 inhibition (Figure S6).
Together, these measurements in U2OS and A549 cells suggest that simultaneous inhibition
of WEE1 and ATR may not be particularly advantageous in combination with radiotherapy.
However, we cannot exclude that other advantageous effects not studied here might
occur in vivo. Interestingly, both WEE1 and ATR inhibitors were shown to affect anti-
tumor immune responses after radiation [52–55], and simultaneous ATR/WEE1 inhibition
together with radiotherapy could potentially be more beneficial in this aspect.
4. Materials and Methods
4.1. Cell Culture and Drug Treatments
Human NCI-H460 and A549 lung cancer (ATCC) and U2OS osteosarcoma cells (all
p53 wt) were cultured in Dulbecco’s modified Eagle’s medium (DMEM), and SW900 and
H1975 lung cancer cells (p53 mutated) in Roswell Park Memorial Institute (RPMI) medium
(both media from Gibco, Grand Island, NE, USA), at 37 ◦ C in a humidified atmosphere with
5% CO2 . The media were supplemented with 10% fetal bovine serum (Biowest, Nuaillé,
France) and 1% penicillin/streptomycin (Gibco, Grand Island, NE, USA). All cell lines were
verified via short tandem repeat (STR) technology, as described previously [12]. The WEE1
inhibitor MK1775 (AZD1775) was from Merck Calbiochem. The ATR inhibitors VE822 and
AZD6738 were from Selleck Chemicals.
4.2. Flow Cytometry Analysis of CDK Targets, Chromatin-Bound CDC45 and MUS81, DNA
Damage, and Cell Cycle Distribution
For analysis of protein phosphorylation, cells were fixed with 70% ethanol and stained
with antibodies, as described previously [12]. The primary antibodies were mouse anti-
phospho-γH2AX(S139) (05-636, Millipore, Darmstadt, Germany), rabbit anti-phospho-
H3(S10) (06-570, Millipore), and three antibodies to CDK targets: rabbit anti-phospho-Cancers 2021, 13, 3790 17 of 22
B-MYB(T487) (ab76009, Abcam, Cambridge, UK), rabbit anti-phospho-BRCA2(S3291)
(AB9986, Millipore), and mouse anti-phospho-S/T-P MPM-2 (05-368, Millipore). Sec-
ondary antibodies were Alexa Fluor 488 and 647 (Molecular Probes, Eugene, OR, USA)
and Cy3 (Jackson ImmunoResearch, Cambridgeshire, UK) anti-mouse and anti-rabbit IgG.
For analysis of chromatin-bound proteins, cells were pre-extracted and fixed, as described
previously [12], but with the following modifications for CDC45 in SW900 and H1975 and
MUS81: cell pellets were treated with 100 µL extraction buffer (20 mM HEPES, pH 7.9;
1.5 mM MgCl2 ; 50–140 mM NaCl; 300 mM sucrose; and 0.5% Triton TX-100) for 5 min on ice.
The cells were then fixed by adding 900 µL of 10% formalin solution (HT501128 SIGMA)
and undergoing incubation for 10 min at room temperature. Cells were stained with
anti-CDC45 (sc-55569, Santa Cruz) or anti-MUS81 (ab14387, Abcam), followed by Alexa
Fluor 488 anti-mouse IgG. In experiments where median values were measured, barcoding
of sets of up to four samples with Pacific Blue was used as before [12] or as described
in Figure S3 to eliminate variation in antibody staining between the individual samples.
The DNA stain FxCycleTM Far Red (200 nM FxCycle and 0.1 mg/mL RNase A) (Thermo
Fisher Scientific) was used in barcoding experiments and Hoechst 33258 (1.5 µg/mL) in
other experiments. Median values were measured within a region corresponding to cells
with an S-phase DNA content. Flow cytometry analyses were performed on an LSRII flow
cytometer (BD Biosciences, Franklin Lakes, USA) using Diva and FlowJo software. For cell
cycle analysis the built-in Watson Pragmatic algorithm in FlowJo was used.
4.3. Viability Assay (CellTiter-Glo)
Cells were seeded in 96-well microplates (Nunc™, VWR) at a density of 500 (H460,
A549, U2OS), 800 (H1975), or 1000 (SW900) cells/well. Six to twenty-four hours after
seeding, cells were treated with MK1775 in a seven-step gradient (36, 52, 80, 118, 178, 266,
and 400 nM for SW900 and 31.25, 62.5, 125, 250, 500, and 1000 nM for H460, A549, and
H1975 (plus 2000 nM for H460) alone or in combination with 100 nM of ATR inhibitor
VE822. After 24 h, inhibitors were removed, cells washed once with PBS, and fresh medium
without inhibitors was added. Four to five days after inhibitor removal, the CellTiter-
Glo assay (Promega, Madison, WI, USA) was used to measure metabolic activity as a
readout for viable cells. Of note, we previously compared measurements at 4, 5, and 6 days
after drug removal in analogous experiments and obtained similar results at all three
days [56]. In short, an equal volume to culture volume of diluted CellTiter-Glo reagent
was added to each well, plates incubated while shaking for 10 min at room temperature,
and luminescence read in a Tecan Spark multimode microplate reader with integration
time set to 1 sec. Average values from triplicate wells were obtained in three independent
experiments. For experiments done with a matrix of different concentrations of WEE1 and
ATR inhibitors with or without combined radiation treatment, cells were seeded at densities
of 500/1000/1500 cells/well (U2OS 0 Gy/2 Gy/4 Gy), 800/1200/1800 cells/well (A549
0 Gy/2 Gy/4 Gy), 800 cells/well (H460), and 1000 cells/well (H1975 and SW900) in plates
pre-printed with drugs. Immediately after seeding, cells were irradiated in a Faxitron X-ray
machine (160 kV, 6.3 mA, 1 Gy/min) at doses of 2 and 4 Gy or left unexposed. Drugs were
washed out 48 h after treatment and viability measured 3 days after drug removal (5 days
after irradiation). This time point was selected based on a previous study showing a robust
correlation between the radiosensitizing effects of drugs measured using clonogenic assays
and cell growth/viability assays performed at 4–6 days after irradiation [57]. Average
values from duplicate wells were obtained in four independent experiments. Synergy was
determined via Bliss independence using the fraction affected (Fa) of treated cells relative
to no-drug samples. The expected effect of the combination will then be: (Fa(MK1775) +
Fa(VE822) − Fa(MK1775) × Fa(VE822) ). Excess over Bliss, calculated as the difference between
the measured effect and the expected effect, was plotted on surface charts using Excel.
Statistical significance (p < 0.05) was determined via one-sample two-tailed Student t test
(test criterion: excess over Bliss 6= 0).Cancers 2021, 13, 3790 18 of 22
4.4. Clonogenic Survival Assays
One hundred fifty to three hundred cells were seeded in 6 cm culture dishes (BD
Biosciences) in triplicate with medium containing various concentrations of WEE1 and/or
ATR inhibitors (MK1775 and VE822). After 24 h, the medium was replaced by 4 mL fresh
medium without inhibitors. Cells were then cultured for an additional 12-14 days, fixed in
70% ethanol, and stained with methylene blue. Colonies of 50 or more cells were counted as
survivors. For assays in which inhibitor treatment was combined with radiation exposure,
150–300 cells (0 Gy) and 450–2000 cells (2Gy) were seeded 24 h prior to treatment. Cells
were irradiated immediately after adding inhibitors, then cultured for 24 h with inhibitors
and processed further, as described above. Survival fractions were calculated in each
experiment as the average cloning efficiency (from 3 parallel dishes) after treatment with
the inhibitors divided by the average cloning efficiency for non-treated cells.
4.5. Immunoblotting
Cells were lysed in ice-cold TX-100 buffer (100 mM NaCl, 50 mM Tris pH 7.5, 2 mM
MgCl2 , 0.5% TX-100) containing 100 U/mL Benzonase (Sigma-Aldrich, St. Louis, MO,
USA). After 1 h incubation on ice, Lane Marker Reducing Sample Buffer (Pierce Biotech-
nologies, Waltham, MA, USA) was added and samples were boiled (95 ◦ C, 5 min). Cri-
terion TGX gels (BioRad, Hercules, CA, USA) and nitrocellulose membranes (BioRad)
were used for separation and transfer, respectively. The following antibodies were used
for blotting: mouse anti-CDK1 (9112, Cell Signaling, Danvers, MA, USA), rabbit anti-
phospho-CDK1(Y15) (9111, Cell Signaling), mouse anti-γ-Tubulin (T6557, Sigma-Aldrich),
mouse anti-DNA-PK (MA5-13238, Thermo Fisher Scientific, Waltham, MA, USA) rabbit
anti-phospho-DNA-PK (S2056) (ab18192, Abcam), mouse anti-ATM (clone AM9, Upstate),
mouse anti-phospho-ATM (S1981) (4526, Cell Signaling), rabbit anti-ATR (2790, Cell Sig-
naling), rabbit anti-phospho-ATR (T1989) (GTX128145, GeneTex, Irvine, CA, USA), rabbit
anti-phospho-RPA (S4/S8) (A300-245, Nordic Biosite, Täby, Sweden), rabbit anti-phospho-
RPA (S33) (A300-246A, Nordic Biosite), mouse anti-Cdc25A (DCS-120) (sc-56264, Santa
Cruz, Dallas, TX, USA), rabbit anti-phospho-CHK1 (S317) (2344, Cell Signaling), mouse
anti-CHK1 (DCS310.1, Santa Cruz), mouse anti-MCM7 (sc-65469, Santa Cruz), mouse
anti-phospho-γH2AX(S139) (05-636, Millipore), rabbit anti-MYT1 (4282, Cell Signaling),
rabbit anti-CyclinE (C-19, sc-198, Santa Cruz), goat anti-RRM2 (sc-10846, Santa Cruz),
rabbit anti-p21 (H-164, SC-756, Santa Cruz), and rabbit anti-WEE1 (4936, Cell Signaling).
Peroxidase-conjugated secondary antibodies were from Jackson Immunoresearch and Su-
perSignal HRP chemoluminescent substrate from Thermo Fisher Scientific was used for
detection. In Figure 1A, Figure 2C and Figure S1B samples were run on multiple gels and a
representative blot of loading controls; MCM7 and γ-Tubulin are shown.
4.6. siRNA Transfection
U2OS cells were transfected using RNAimax (Thermo Fisher), according to the manu-
facturer’s protocol. Oligonucleotides used were: Wee1-1, GGAAAAAGGGAAUUUGAUG
(Sigma-Aldrich) and Scr, GGUUUCUGUCAAAUGCAAACGGCUU (Thermo Fisher).
4.7. DNA Fiber Assay
The DNA fiber assay was performed similarly as we did in a previous study [58].
Briefly, U2OS and H460 cells were pulse labelled with 25 µM CldU, followed by 250 µM
IdU for 20 min each. After labelling, cells were harvested in ice-cold PBS. DNA fiber
spreads were prepared by spotting 2 µL of cells (1 × 10⁵ cells/mL in PBS) onto microscope
slides, followed by lysis with 7 µL of spreading buffer (0.5% SDS, 200 mM Tris-HCl pH
7.4, and 50 mM EDTA) for 5 min. For spreading, slides were tilted and further fixated in
methanol/acetic acid (3:1). Prior to immunodetection, slides were treated with 2.5 M HCl
for 1 h and 15 min. The slides were further stained for 1 h with rat anti-bromodeoxyuridine
(Clone BU1/75, Abcam) to detect CldU and mouse anti-bromodeoxyuridine (Clone B44,
BD Biosciences) to detect IdU. Subsequently, slides were fixed in formalin solution forCancers 2021, 13, 3790 19 of 22
10 min and further incubated with anti-rat IgG Alexa Fluor 568 and anti-mouse IgG Alexa
Fluor 488 (Molecular Probes) for 2 h. Slides were mounted with Fluoroshield. Images
were acquired with an AxioImager Z1 ApoTome microscope system (Carl Zeiss, Jena,
Germany) using a 63× (1.4 numerical aperture) oil lens equipped with an AxioCam
Mrm camera and the Axiovision 4.8.2 (Carl Zeiss) software. Images were analyzed using
ImageJ (https://imagej.nih.gov/ij/index.html, accessed on 1 February 2019), where at
least 200 fibers were measured per condition in each experiment. Replication track lengths
were calculated using the conversion factor 1 µM = 2.59 kb. Replication structures were
quantified using the multi-point tool.
5. Conclusions
In conclusion, we investigated the effects of WEE1 and ATR inhibitors, alone and in
combination, on U2OS osteosarcoma cells and on a panel of four lung cancer cell lines with
different sensitivities to the WEE1 inhibitor. WEE1 was equally well-inhibited in all cell
lines, indicating that resistance to WEE1 inhibitory treatment is not a result of poor efficacy
of the inhibitor in general but is likely due to an effect downstream of CDK activation. We
observed large synergistic effects in some, but not all, of these cell lines when combining
ATR and WEE1 inhibitors, and the mechanism(s) of synergy seemed to vary between cells
lines. Moreover, the combined treatment could not fully compensate for cell resistance to
the WEE1 inhibitor. Thus, one should critically consider which patients would potentially
benefit from combined ATR/WEE1 inhibition, being careful not to generalize based on
individual biomarkers and to take into account sensitivity to single treatments.
Supplementary Materials: The following are available online at https://www.mdpi.com/article/
10.3390/cancers13153790/s1, Figure S1: WEE1 and ATR dependency of synergy is verified by a
second ATR inhibitor and siRNA-mediated depletion of WEE1, Figure S2: In lung cancer cell lines
synergistic reduction in survival does not correlate with DNA damage induction in S-phase or
with premature mitosis, Figure S3: CDK activity measurements in lung cancer cell lines, Figure S4:
Resistant cell lines show no accumulation of cells in S-phase and continue replication in the presence
of WEE1 inhibitor, Figure S5: Synergy scores and ATR inhibitor sensitivity in lung cancer cell
lines, Figure S6: Radiosensitizing effect of WEE1 and ATR inhibitors in U2OS and A549, Figure S7:
Chromatin loading of MUS81 is more increased in U2OS than in H460 in response to WEE1 inhibition,
Table S1: Approximate IC50 values (MK1775 and VE822) in lung cancer cell lines based on Cell-Titer-
Glo experiments.
Author Contributions: Conceptualization, R.G.S., G.E.R., S.H. and G.H.; methodology, R.G.S., G.E.R.,
S.H. and G.H.; validation, all authors.; formal analysis, all authors.; investigation, G.E.R., S.H., G.H.,
L.T.E.B., T.T.H.R. and M.J.; resources, R.G.S.; writing—original draft preparation, R.G.S. and G.E.R.;
writing—review and editing, all authors; visualization, G.E.R., S.H. and L.T.E.B.; supervision, R.G.S.;
project administration, R.G.S., G.E.R. and S.H.; funding acquisition, R.G.S. All authors have read and
agreed to the published version of the manuscript.
Funding: We are grateful for funds from Kreftforeningen (198018, 206390), Helse Sør-Øst RHF
(2016114, 2012028), the Norwegian Research Council (275918), and EEA Norway Romania grants
(EEA-RO-NO-2019-0510, nr 41/2021).
Institutional Review Board Statement: Not applicable.
Informed Consent Statement: Not applicable.
Data Availability Statement: The data presented in this study are available on request from the
corresponding author.
Acknowledgments: We thank the Flow Cytometry Core Facility at the Oslo University Hospital for
helpful assistance.
Conflicts of Interest: The authors declare no conflict of interest.You can also read