SARS-COV-2 T-CELL EPITOPES DENE HETEROLOGOUS AND COVID-19-INDUCED T-CELL RECOGNITION
←
→
Page content transcription
If your browser does not render page correctly, please read the page content below
SARS-CoV-2 T-cell epitopes de ne heterologous and
COVID-19-induced T-cell recognition
Annika Nelde
 Clinical Collaboration Unit Translational Immunology, German Cancer Consortium (DKTK), Department
of Internal Medicine, University Hospital Tübingen, Tübingen, Germany https://orcid.org/0000-0001-
8504-8481
Tatjana Bilich
 Clinical Collaboration Unit Translational Immunology, German Cancer Consortium (DKTK), Department
of Internal Medicine, University Hospital Tübingen, Tübingen, Germany https://orcid.org/0000-0002-
8107-0419
Jonas S. Heitmann
 Clinical Collaboration Unit Translational Immunology, German Cancer Consortium (DKTK), Department
of Internal Medicine, University Hospital Tübingen, Tübingen, Germany https://orcid.org/0000-0002-
7305-8620
Yacine Maringer
 Clinical Collaboration Unit Translational Immunology, German Cancer Consortium (DKTK), Department
of Internal Medicine, University Hospital Tübingen, Tübingen, Germany https://orcid.org/0000-0002-
2197-8740
Helmut R. Salih
 Clinical Collaboration Unit Translational Immunology, German Cancer Consortium (DKTK), Department
of Internal Medicine, University Hospital Tübingen, Tübingen, Germany https://orcid.org/0000-0002-
6719-1847
Malte Roerden
 Institute for Cell Biology, Department of Immunology, University of Tübingen, Tübingen, Germany
 https://orcid.org/0000-0001-7283-9778
Maren Lübke
 Institute for Cell Biology, Department of Immunology, University of Tübingen, Tübingen, Germany
 https://orcid.org/0000-0002-2181-3911
Jens Bauer
 Clinical Collaboration Unit Translational Immunology, German Cancer Consortium (DKTK), Department
of Internal Medicine, University Hospital Tübingen, Tübingen, Germany https://orcid.org/0000-0003-
3731-2385
Jonas Rieth
 Clinical Collaboration Unit Translational Immunology, German Cancer Consortium (DKTK), Department
of Internal Medicine, University Hospital Tübingen, Tübingen, Germany

                                               Page 1/26
Marcel Wacker
 Clinical Collaboration Unit Translational Immunology, German Cancer Consortium (DKTK), Department
of Internal Medicine, University Hospital Tübingen, Tübingen, Germany
Andreas Peter
 Institute for Clinical Chemistry and Pathobiochemistry, Department for Diagnostic Laboratory Medicine,
University Hospital Tübingen, Tübingen, Germany
Sebastian Hörber
 Institute for Clinical Chemistry and Pathobiochemistry, Department for Diagnostic Laboratory Medicine,
University Hospital Tübingen, Tübingen, Germany
Bjoern Traenkle
 NMI, Natural and Medical Sciences Institute at the University of Tübingen, Reutlingen, Germany
Philipp D. Kaiser
 NMI, Natural and Medical Sciences Institute at the University of Tübingen, Reutlingen, Germany
Ulrich Rothbauer
 NMI, Natural and Medical Sciences Institute at the University of Tübingen, Reutlingen, Germany
Matthias Becker
 NMI, Natural and Medical Sciences Institute at the University of Tübingen, Reutlingen, Germany
Daniel Junker
 NMI, Natural and Medical Sciences Institute at the University of Tübingen, Reutlingen, Germany
Gérard Krause
 Department of Epidemiology, Helmholtz Centre for Infection Research, Braunschweig, Germany
Monika Strengert
 Department of Epidemiology, Helmholtz Centre for Infection Research, Braunschweig, Germany
Nicole Schneiderhan-Marra
 NMI, Natural and Medical Sciences Institute at the University of Tübingen, Reutlingen, Germany
Markus F. Templin
 NMI, Natural and Medical Sciences Institute at the University of Tübingen, Reutlingen, Germany
Thomas O. Joos
 NMI, Natural and Medical Sciences Institute at the University of Tübingen, Reutlingen, Germany
Daniel J. Kowalewski
 Immatics Biotechnologies GmbH, Tübingen, Germany
Vlatka Stos-Zweifel
 Immatics Biotechnologies GmbH, Tübingen, Germany
Michael Fehr
 Institute for Cell Biology, Department of Immunology, University of Tübingen, Tübingen, Germany
Michael Graf
 Applied Bioinformatics, Center for Bioinformatics and Department of Computer Science, University of
Tübingen, Tübingen, Germany
Lena-Christin Gruber

                                                Page 2/26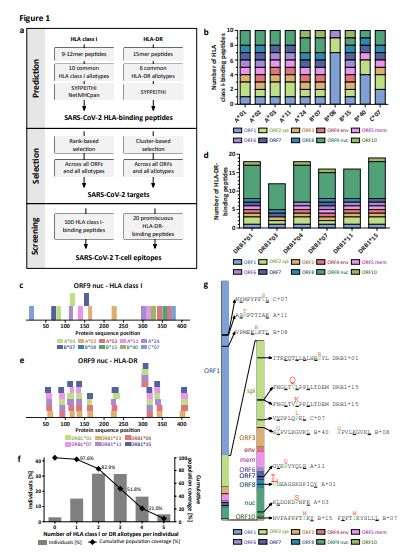
Clinical Collaboration Unit Translational Immunology, German Cancer Consortium (DKTK), Department
of Internal Medicine, University Hospital Tübingen, Tübingen, Germany
David Rachfalski
Clinical Collaboration Unit Translational Immunology, German Cancer Consortium (DKTK), Department
of Internal Medicine, University Hospital Tübingen, Tübingen, Germany
Beate Preuß
Department of Hematology, Oncology, Clinical Immunology and Rheumatology, University Hospital
Tübingen, Tübingen, Germany
Ilona Hagelstein
Clinical Collaboration Unit Translational Immunology, German Cancer Consortium (DKTK), Department
of Internal Medicine, University Hospital Tübingen, Tübingen, Germany
Melanie Märklin
Clinical Collaboration Unit Translational Immunology, German Cancer Consortium (DKTK), Department
of Internal Medicine, University Hospital Tübingen, Tübingen, Germany
Tamam Bakchoul
Institute for Clinical and Experimental Transfusion Medicine, University Hospital Tübingen, Tübingen,
Germany
Cécile Gouttefangeas
Institute for Cell Biology, Department of Immunology, University of Tübingen, Tübingen, Germany
Oliver Kohlbacher
Applied Bioinformatics, Center for Bioinformatics and Department of Computer Science, University of
Tübingen, Tübingen, Germany
Reinhild Klein
Department of Hematology, Oncology, Clinical Immunology and Rheumatology, University Hospital
Tübingen, Tübingen, Germany
Stefan Stevanović
Institute for Cell Biology, Department of Immunology, University of Tübingen, Tübingen, Germany
Hans-Georg Rammensee
Institute for Cell Biology, Department of Immunology, University of Tübingen, Tübingen, Germany
Juliane S. Walz ( Juliane.Walz@med.uni-tuebingen.de )
Clinical Collaboration Unit Translational Immunology, German Cancer Consortium (DKTK), Department
of Internal Medicine, University Hospital Tübingen, Tübingen, Germany https://orcid.org/0000-0001-
6404-7391
Research Article
Keywords: SARS-CoV-2, COVID-19, T-cell epitopes, HLA peptides, vaccine design, T-cells, immunity
DOI: https://doi.org/10.21203/rs.3.rs-35331/v1
Page 3/26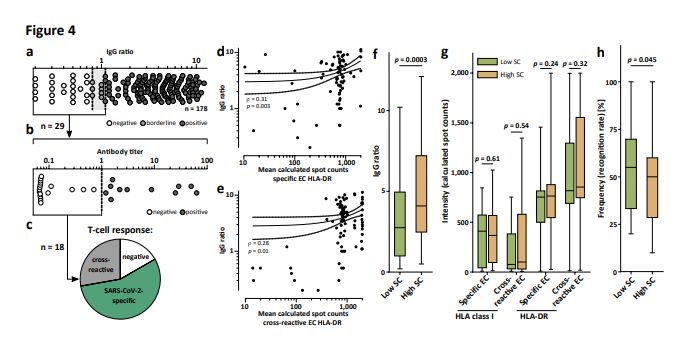
License: This work is licensed under a Creative Commons Attribution 4.0 International License.
Read Full License
Page 4/26Abstract
The SARS-CoV-2 pandemic calls for the rapid development of diagnostic, preventive, and therapeutic
approaches. CD4+ and CD8+ T cell-mediated immunity is central for control of and protection from viral
infections[1-3]. A prerequisite to characterize T-cell immunity, but also for the development of vaccines and
immunotherapies, is the identi cation of the exact viral T-cell epitopes presented on human leukocyte
antigens (HLA)[2-8]. This is the rst work identifying and characterizing SARS-CoV-2-speci c and cross-
reactive HLA class I and HLA-DR T-cell epitopes in SARS-CoV-2 convalescents (n = 180) as well as
unexposed individuals (n = 185) and con rming their relevance for immunity and COVID-19 disease
course. SARS-CoV-2-speci c T-cell epitopes enabled detection of post-infectious T-cell immunity, even
in seronegative convalescents. Cross-reactive SARS-CoV-2 T-cell epitopes revealed preexisting T-cell
responses in 81% of unexposed individuals, and validation of similarity to common cold human
coronaviruses provided a functional basis for postulated heterologous immunity[9] in SARS-CoV-2
infection[10,11]. Intensity of T-cell responses and recognition rate of T-cell epitopes was signi cantly higher
in the convalescent donors compared to unexposed individuals, suggesting that not only expansion, but
also diversity spread of SARS-CoV-2 T-cell responses occur upon active infection. Whereas anti-SARS-
CoV-2 antibody levels were associated with severity of symptoms in our SARS-CoV-2 donors, intensity of
T-cell responses did not negatively affect COVID-19 severity. Rather, diversity of SARS-CoV-2 T-cell
responses was increased in case of mild symptoms of COVID-19, providing evidence that development of
immunity requires recognition of multiple SARS-CoV-2 epitopes. Together, the speci c and cross-reactive
SARS-CoV-2 T-cell epitopes identi ed in this work enable the identi cation of heterologous and post-
infectious T-cell immunity and facilitate the development of diagnostic, preventive, and therapeutic
measures for COVID-19.
Background
T cells control viral infections and provide immunological memory that enables long-lasting protection1-
3. Whereas CD4+ T helper cells orchestrate the immune response and enable B cells to produce
antibodies, CD8+ cytotoxic T cells eliminate virus-infected cells. For both, recognition of viral antigens in
the form of short peptides presented on human leukocyte antigens (HLA) is fundamental. In
consequence, characterization of such viral T-cell epitopes4,5,8 is crucial for the understanding of
immune defense mechanisms, but also a prerequisite for the development of vaccines and
immunotherapies2,6,7,12.
The SARS-CoV-2 coronavirus causes COVID-19, which has become a worldwide pandemic with dramatic
socioeconomic consequences13,14. Available treatment options are limited, and despite intensive efforts
a vaccine is so far not available. Knowledge obtained from the two other zoonotic coronaviruses SARS-
CoV-1 and MERS-CoV indicates that coronavirus (CoV)-speci c T-cell immunity is an important
determinant for recovery and long-term protection15-18. This is even more important since studies on
humoral immunity to SARS-CoV-1 provided evidence that antibody responses are short-lived and can
Page 5/26even cause or aggravate virus-associated lung pathology19,20. With regard to SARS-CoV-2, two very
recent studies10,11 described CD4+ and CD8+ T-cell responses to viral peptide megapools in donors that
had recovered from COVID-19 and individuals not exposed to SARS-CoV-2, the latter being indicative of
potential T-cell cross-reactivity9,21. The exact viral epitopes that mediate these T-cell responses against
SARS-CoV-2, however, were not identi ed in these studies, but are prerequisite (i) to delineate the role of
post-infectious and heterologous T- cell immunity in COVID-19, (ii) for establishing diagnostic tools to
identify SARS-CoV-2 immunity, and, most importantly, (iii) to de ne target structures for the development
of SARS-CoV-2-speci c vaccines and immunotherapies. In this study, we de ne SARS-CoV-2-speci c and
cross-reactive CD4+ and CD8+ T-cell epitopes in a large collection of SARS-CoV-2 convalescents as well
as non-exposed individuals and their relevance for immunity and the course of COVID-19 disease.
Results
Identi cation of SARS-CoV-2-derived HLA class I- and HLA-DR-
binding peptides
A novel prediction and selection work ow, based on the integration of the algorithms SYFPEITHI and
NetMHCpan, identi ed 1,739 and 1,591 auspicious SARS-CoV-2-derived HLA class I- and HLA-DR-binding
peptides across all 10 viral open-reading frames (ORFs, Fig. 1a, Extended Data Fig. 1a, b). Predictions
were performed for the 10 and 6 most common HLA class I (HLA-A*01:01, -A*02:01, -A*03:01, -A*11:01, -
A*24:02, -B*07:02, -B*08:01, -B*15:01,-B*40:01, and -C*07:02) and HLA-DR (HLA-DRB1*01:01, -
DRB1*03:01, -DRB1*04:01,-DRB1*07:01, -DRB1*11:01, and -DRB1*15:01) allotypes covering 91.7% and
70.6% of the world population with at least one allotype, respectively22,23 (Extended Data Fig. 1c and
2a). To identify broadly applicable SARS-CoV-2-derived T-cell epitopes, we selected 100 SARS-CoV-2-
derived HLA class I-binding peptides comprising 10 peptides per HLA class I allotype across all 10 viral
ORFs for immunogenicity screening (range 3 - 20 peptides per ORF, mean 10, Fig. 1b, c, Extended Data
Fig. 1d-m, Supplementary Table 1). In addition, 20 SARS-CoV-2-derived promiscuous HLA-DR-binding
peptides across all ORFs from peptide clusters of various HLA-DR allotype restrictions representing 99
different peptide-allotype combinations were included (Fig. 1d, e, Extended Data Fig. 2b-k, Supplementary
Tables 2 and 3). Of these HLA-DR-binding peptides, 14/20 (70%) contained embedded SARS-CoV-2-
derived HLA class I-binding peptides for 7/10 HLA class I allotypes. The complete panel of 120 SARS-
CoV-2-derived peptides comprised 10% of the total SARS-CoV-2 proteome (57%and 12% of nucleocapsid
and spike protein, respectively; Extended Data Fig. 2l) and showed an equally distributed origin of
structural ORF proteins (61/120 (51%)) encompassing spike, envelope, membrane and nucleocapsid
proteins as well as non-structural or accessory ORFs (59/120 (49%)). The broad HLA class I and HLA-DR
allotype-restriction of the selected SARS-CoV-2-derived peptides allowed for a total coverage of at least
one HLA allotype in 97.6% of the world population (Fig. 1f). Recurrent mutations of SARS-CoV-224,25
affected only a minority of selected SARS-CoV-2-derived peptides with 14/120 (12%) sequences (1.7% at
anchor position) including reported mutation sites (Fig. 1g, Supplementary Tables 4 and 5).
Page 6/26Validation and characterization of SARS-CoV-2-derived CD8+ and
CD4+ T-cell epitopes
IFNγ ELISPOT screening of SARS-CoV-2 convalescents (SARS, group 1, n = 116, Extended Data Table 1,
Supplementary Table 6) and donors never exposed to SARS-CoV-2 (PRE, group A, n = 104, samples
collected prior to SARS-CoV-2 pandemic, Extended Data Table 1, Supplementary Table 7) validated
29/100 (29%) SARS-CoV-2-derived HLA class I- (3/10 HLA- A*01, 2/10 HLA-A*02, 3/10 HLA-A*03, 2/10
HLA-A*11, 5/10 HLA-A*24, 2/10 HLA-B*07, 4/10 HLA-B*08, 0/10 HLA-B*15, 5/10 HLA-B*40, 3/10 HLA-
C*07) and 20/20 (100%) HLA-DR-binding peptides as naturally occurring T-cell epitopes (Fig. 2a-f,
Extended Data Tables 2 and 3, Supplementary Fig. 1 and 2, Supplementary Table 8). Flow cytometry
revealed that T-cell responses directed against HLA class I-binding peptides were mainly driven by
IFNγ+CD8+ T cells, whereas HLA-DR-binding peptides were recognized by multifunctional
(IFNγ+TNF+CD107a+) CD4+ T cells and in single donors additionally by CD8+ T cells (Fig. 2b, d). 12/29
(41%) and 11/20 (55%) SARS-CoV-2-derived CD8+ and CD4+ T-cell epitopes were dominant epitopes
(recognized by ≥ 50% of SARS donors) with recognition frequencies up to 83% (A01_P01) and 95%
(DR_P16), respectively (Fig. 2e, f, Extended Data Tables 2 and 3).
T-cell responses showed high inter-individual as well as inter-peptide intensity
variation(Supplementary Fig. 3). Overall, the intensity of HLA-DR-speci c T-cell responses in the SARS
group was signi cantly more pronounced compared to those directed against HLA class I T-cell epitopes
(median 414 versus 56 calculated spot counts, Fig. 2g). All SARS- CoV-2-derived HLA-DR-binding peptides
were found to be immunogenic, independently of the source ORF. SARS-CoV-2-derived HLA class I T-cell
epitopes showed an equally distributed origin from structural (13/29 (45%)) and non-structural or
accessory (16/29 (55%)) ORFs (Extended Data Table 2). However, ORF-speci c differences regarding the
proportion of validated HLA class I T-cell epitopes were observed, revealing the highest frequencies for
ORF9 (50%, nucleocapsid protein), ORF1 (45%), and ORF3 (38%, Fig. 2h). The highest recognition rate in
SARS donors was observed for HLA class I T-cell epitopes derived from ORF2 (55%, spike protein), ORF5
(52%, membrane protein), and ORF3 (45%), as well as for HLA-DR T-cell epitopes derived from ORF5 (95%,
membrane protein), ORF8 (68%), and ORF4 (55%, envelope protein, Fig. 2i).
Cross-reactive T-cell responses to SARS-CoV-2-derived HLA class I
and HLA-DR T-cell epitopes in unexposed individuals
Upon screening PRE group A, cross-reactive T-cell responses to 9/29 (31%) of the validated HLA class I
and to 14/20 (70%) HLA-DR T-cell epitopes were detected. Recognition frequencies of single SARS-CoV-2
HLA class I and HLA-DR T-cell epitopes in PRE donors were lower compared to that of SARS group 1 (up
to 27% for B08_P05 and 44% for DR_P01, Fig. 2e, f, Extended Data Tables 2 and 3). Recognition
frequencies of HLA class I and HLA-DR T-cell epitopes in individual donors differed profoundly between
the PRE and the SARS group within the different ORFs. ORF1-derived HLA class I (9%) and ORF8-derived
HLA-DR (25%) T-cell epitopes showed the highest recognition frequencies in the PRE group, whereas
Page 7/26noneof the T-cell epitopes from ORF5 (membrane protein) and ORF10 that were
frequentlyrecognized in SARS donors were detected by T cells in PRE donors (Fig. 2i). In line with the
lower recognition frequencies of single SARS-CoV-2 T-cell epitopes (Fig. 2e, f), donor-speci c recognition
rates of HLA class I and HLA-DR SARS-CoV-2 T-cell epitopes were signi cantly lower in the PRE group
(HLA class I, mean 26 ± 9; HLA-DR, mean 10 ± 5) than in the SARS group (HLA class I, mean 52 ± 23;
HLA-DR, mean 52 ± 23, Fig. 3a). Alignments of the SARS- CoV-2 T-cell epitopes recognized by unexposed
individuals revealed similarities to the four seasonal common cold human coronaviruses (HCoV-OC43,
HCoV-229E, HCoV-NL63, HCoV- HKU1) with regard to amino acid sequences, physiochemical and/or HLA-
binding properties for 14/20 (70%) of the epitopes, thereby providing clear evidence for SARS-CoV-2 T-cell
cross-reactivity (Fig. 3b, Supplementary Tables 9 and 10, Supplementary Data 1).
Frequency of SARS-CoV-2 T-cell responses in COVID-19
convalescents and unexposed individuals
Epitope screening in SARS and PRE donors enabled the identi cation of SARS-CoV-2-speci c T-cell
epitopes recognized exclusively in convalescents after SARS-CoV-2 infection and of cross-reactive T-cell
epitopes recognized by both, convalescents and SARS-CoV-2 unexposed individuals (Fig. 2e, f). To allow
for standardized evaluation and determination of T-cell response frequencies to SARS-CoV-2, we
designed broadly applicable HLA class I and HLA-DR SARS-CoV-2-speci c and cross-reactive T-cell
epitope compositions (EC, Fig. 3c, Extended Data Table 4). These EC were utilized for IFNγ ELISPOT
assays in groups of convalescents (SARS group 2, n = 86, Extended Data Table 1, Supplementary Table
6) and unexposed donors (PRE group B, n = 94, Extended Data Table 1, Supplementary Table 7). Of the
SARS donors, 100% showed T-cell responses to cross-reactive and/or speci c EC (Fig. 3d, e), whereas
81% of PRE donors showed HLA class I (16%) and/or HLA-DR (77%) T-cell responsesto cross-reactive EC
(Fig. 3d). In line with the ndings obtained with the screening group(SARS group 1), the intensity of
HLA class I T-cell responses was signi cantly lower compared to HLA-DR T-cell responses, both for
speci c (median calculated spot count HLA class I 379, HLA-DR 760) and cross-reactive EC (median
calculated spot count HLA class I 86, HLA-DR 846, Fig. 3f, g). In line with the differences in recognition
rates observed between SARS group 1 and PRE group A, the intensity of T-cell responses to cross-reactive
EC was signi cantly lower in the PRE group (median calculated spot count HLA class I 14, HLA-DR346)
compared to the SARS group (Fig. 3g).
Relationship of SARS-CoV-2 T-cell and antibody responses
Anti-SARS-CoV-2 IgG antibody responses in SARS donors were analyzed in two independent assays. The
S1 IgG ELISA assay revealed 149/178 (84%), 7/178 (4%), and 22/178 (12%) donors with positive,
borderline, and no anti S1 antibody response, respectively (Fig. 4a). Of the borderline/none responders,
18/29 (62%) were also negative in a second, independent anti-nucleocapsid immunoassay (Fig. 4b).
However, SARS-CoV-2-speci c CD8+ and/or CD4+ T- cell responses were detected in 10/18 (56%) of these
“antibody double-negative” donors (Fig. 4c). The intensity of SARS-CoV-2-speci c and cross-reactive HLA-
Page 8/26DR T-cell responses correlated with antibody levels (Fig. 4d, e), whereas no correlation was observed with
HLA class I T-cell responses (Extended Data Fig. 3a, b). No correlation between antibody titers directed
against the nucleocapsid of human common cold coronaviruses (HCoV-229E, HCoV- NL63, HCoV-OC43),
as determined by bead-based serological multiplex assays and the intensity of cross-reactive CD4+ and
CD8+ T-cell responses in the SARS group, was detected (Extended Data Fig. 3c-h).
Association of SARS-CoV-2-directed antibody and T-cell responses
with clinical characteristics in COVID-19
Finally, the association of anti-SARS-CoV-2 antibody and T-cell responses with disease severity as
assessed by a combinatorial symptom score (SC) of objective (fever ≥ 38.0°C) and patient-subjective
disease symptoms was determined (Extended Data Table 1). Alike in critically ill patients26,
independently of age high antibody ratios signi cantly associated with disease severity in our collection
of convalescent SARS donors (n = 180), which in general were in good health condition and had not been
hospitalized (Fig. 4f, Extended Data Fig. 4a). Neither the intensity of SARS-CoV-2-speci c nor of cross-
reactive T-cell responses to HLA class I or HLA-DR EC correlated with disease severity (Fig. 4g). Rather,
diversity of T-cell responses in terms of recognition rate of SARS-CoV-2 T-cell epitopes was decreased in
patients with more severe COVID-19 symptoms (Fig. 4h, Extended Data Fig. 4b), providing evidence that
development of protective immunity requires recognition of multiple SARS- CoV-2 epitopes.
Discussion
This study reports the rst characterization of broadly applicable SARS-CoV-2-speci c and cross-reactive
T-cell epitopes of various HLA allotype restrictions across all viral ORFs identi ed in two large collections
of donors recovered from SARS-CoV-2 infection as well as unexposed individuals. Our ndings aid SARS-
CoV-2 research with regard to the understanding of SARS-CoV-2 post-infectious and heterologous T-cell
responses, but also regarding the development of prophylactic and therapeutic measures.
Cross-reactivity of T cells for different virus species or even amongst different pathogens is a well-known
phenomenon27,28 postulated to enable heterologous immunity to a pathogenafter exposure to
a non-identical pathogen9,21,29. Using predicted or randomSARS-CoV-2--derived peptide
pools, two very recent studies reported preexisting SARS-CoV-2-directed T-cell responses in small groups
of unexposed as well as SARS-CoV-2 seronegative individuals, thereby suggesting cross-reactivity
between human common cold coronaviruses and SARS-CoV-210,11. In our study we identi ed and
characterized the exact T-cell epitopes that govern SARS-CoV-2 cross-reactivity and proved similarity to
human common cold coronaviruses regarding individual peptide sequences, physiochemical and HLA-
binding properties30,31. Notably, we detected SARS-CoV-2 cross-reactive T cells in 81% of unexposed
individuals. To determine if these T-cells indeed mediate heterologous immunity and whether this
explains the relatively small proportion of severely ill or, even in general, infected patients during this
pandemic32,33, a dedicated study using e.g. a matched case control, or retrospective cohort design
Page 9/26applying our cross-reactive SARS-CoV-2 T-cell epitopes would be required. Our observation that intensity
of T-cell responses and recognition rate of T-cell epitopes was signi cantly higher in convalescents
compared to unexposed individuals suggests that not only expansion, but also a spread of SARS-CoV-2
T-cell response diversity occurs upon active infection.
At present, determination of immunity to SARS-CoV-2 relies on the detection of SARS-CoV-2 antibody
responses. However, despite the high sensitivity reported for several assays there is still a substantial
percentage of patients with negative or borderline antibody responses and thus unclear immunity status
after SARS-CoV-2 infection34. Our SARS-CoV-2-speci c T- cell epitopes, which are not recognized by T
cells of unexposed donors, allowed for detection of speci c T-cell responses even in donors without
antibody responses, thereby providing evidence for T-cell immunity upon infection.
In line with previous data on acute and chronic viral infection35,36, our data indicate an important role of
SARS-CoV-2 CD4+ T-cell responses in the natural course of infection, with the identi cation of multiple
dominant HLA class-DR T-cell epitopes that elicit more frequent and intense immune response in SARS
donors compared to the HLA class I T-cell epitopes. This guides selection of T-cell epitopes for vaccine
design, also in light of the dependency of protective antibody responses on CD4+ T cell help.
The pathophysiological involvement of the immune response in the course of COVID-19 is a matter of
intense debate. Our nding that also in mainly non-hospitalized patients with a mild disease course high
level antibody responses are associated with more severe symptoms of COVID-19 is in line with recent
data on the correlation of antibody titers with disease severity in hospitalized patients26. Our data
provide the rst evidence that, on the contrary, the intensity of T-cell responses does not correlate with
disease severity. This is of high relevance for the design of vaccines, as it provides evidence that disease
aggravating effects might not hamper the development of prophylactic and therapeutic vaccination
approaches aiming to induce SARS-CoV-2-speci c T-cell responses. In contrast to the intensity of the T-
cell response, recognition rates of SARS-CoV-2 T-cell epitopes by individual donors were lower in
individuals with more severe COVID-19 symptoms. This observation, together with our data on increased
T-cell epitope recognition rates after SARS-CoV-2 infection compared to preexisting T-cell responses in
unexposed individuals and reports from other active or chronic viral infections associating diversity of T-
cell response with anti- viral defense37-39, provide evidence that natural development and vaccine-based
induction of immunity to SARS-CoV-2 requires recognition of multiple SARS-CoV-2 epitopes. Con rmation
of this observation in a larger SARS cohort including hospitalized patients is warranted andrequires
single epitope-based methods to determine T-cell epitope recognition rates asenabled by our SARS-
CoV-2 T-cell epitopes. Moreover, our data underline the high importance of the identi ed T-cell epitopes for
further studies of SARS-CoV-2 immunity, but also for the development of preventive and therapeutic
COVID-19 measures. Using the SARS-CoV-2 T-cell epitopes we are currently preparing two clinical rst-in-
man studies (EudraCT 2020-002502-75; EudraCT 2020-002519-23) to evaluate a multi-peptide vaccine
for induction of broad T-cell immunity to SARS-CoV-2 to combat COVID-19.
Methods
Page 10/26Patients and blood samples
Blood and serum samples as well as questionnaire-based assessment of donor characteristics and
disease symptoms from convalescent volunteers after SARS-CoV-2 infection were collected at the
University Hospital Tübingen, Germany from 4/2020 - 5/2020 (SARS collection n = 180). SARS-CoV-2
infection was con rmed by PCR test after nasopharyngeal swab. SARS donor recruitment was performed
by online and paper-based calls. Sample collection for each SARS donor was performed approximately
three to eight weeks after the end of symptoms and/or negative virus smear. Peripheral blood
mononuclear cells (PBMCs) asserted from blood donations of healthy individuals prior to the SARS-CoV-
2 pandemic (06/2007 - 11/2019) at the Department of Immunology, University of Tübingen were used
to assess preexisting SARS-CoV-2 T-cell responses (PRE collection, n = 185). Informed consent was
obtained in accordance with the Declaration of Helsinki protocol. The study was approved by and
performed according to the guidelines of the local ethics committees (179/2020/BO2). PBMCs were
isolated by density gradient centrifugation and stored at -80°C until further use. Serum was separated by
centrifugation for 10 min and the supernatant was stored at -80°C. HLA typing was carried out by
Immatics Biotechnology GmbH and the Department of Hematology and Oncology at the University
Hospital Tübingen. Symptom score (SC) was determined by combining objective (fever ≥ 38.0°C) and
subjective disease symptoms of individual donors. SARS and PRE collections were split into two groups
for T-cell epitope screening and standardized immunity evaluation. Detailed SARS and PRE donor
characteristics as well as information on allocation of the donors to the experimental groups are provided
in Extended Data Table 1 and Supplementary Tables 6and 7.
Data retrieval
The complete highly conserved and representative annotated proteome sequence of SARS-CoV-2 isolate
Wuhan-Hu-1 containing ten different open-reading frames (ORFs) was retrieved from the NCBI database
with the accession number MN90894740. The amino acid sequence is identical to the reference
sequence (EPI_ISL_412026) de ned by Wang et al. conducting multiple sequence alignments and
phylogenetic analyses of 95 full-length genomic sequences24.
Prediction of SARS-CoV-2-derived HLA class I-binding peptides
The protein sequences of all ten ORFs were split into 9 - 12 amino acid long peptides covering the
complete proteome of the virus. The prediction algorithms NetMHCpan 4.041-43 and SYFPEITHI 1.044
were used to predict the binding of peptides to HLA-A*01:01, -A*02:01,-A*03:01, -A*11:01, -A*24:02, -
B*07:02, -B*08:01, -B*15:01, -B*40:01, and -C*07:02. Onlypeptides predicted as HLA-binding peptides by
both algorithms (SYFPEITHI score ≥ 60%, NetMHCpan rank ≤ 2) for the respective allotype were further
examined. Peptides containing cysteines were excluded to avoid dimerization in a potential subsequent
vaccine production process. Peptides derived from the ORF1 polyprotein spanning the cleavage sites of
the comprised different protein chains were excluded. An averaged rank combining NetMHCpan- and
Page 11/26SYFPEITHI-derived prediction scores was calculated and peptides were ranked for each allotype and ORF
separately. Through rank-based selection one peptide for each ORF and each allotype, respectively was
selected. For peptides with equal averaged ranks, peptides with higher SYFPEITHI scores were
nominated. For some HLA allotypes not every ORF gave rise to an appropriate HLA-binding peptide. To
receive 10 peptides per HLA allotype and ORF, remaining slots were lled with additional peptides
from the ORF9nucleocapsid protein, the ORF2 spike protein, and ORF1.
Prediction of SARS-CoV-2-derived HLA-DR-binding peptides
For HLA-DR predictions all ten ORFs were split into peptides of 15 amino acids, resulting in a total of
9,561 peptides. The prediction algorithm SYFPEITHI 1.0 was used to predict the binding to HLA-
DRB1*01:01, -DRB1*03:01, -DRB1*04:01, -DRB1*07:01, -DRB1*11:01, and
-DRB1*15:01. The 5% (2% for ORF1) top-scoring peptides of each ORF (based on the total length of each
ORF) and each HLA-DR allotype were selected. Position-based sorting of peptides within each ORF
revealed peptide clusters of promiscuous peptides binding to several HLA-DR allotypes. Through cluster-
based selection, peptide clusters of promiscuous peptides with a common core sequence of 9 amino
acids were selected. Thereby, 10 and 2 clusters were selected for the ORF9 nucleocapsid and the ORF2
spike protein as well as one cluster for each of the remaining ORFs. Of each selected cluster one
representative peptide was selected for immunogenicity analysis excluding cysteine containing peptides.
Sequence and physiochemical property alignments to common cold
human coronaviruses
\Sequence and physiochemical property alignments of the SARS-CoV-2-derived peptide sequences with
the four seasonal common cold human coronaviruses (HCoV-OC43, HCoV-229E, HCoV-NL63, HCoV-
HKU1) were performed by NCBI BLAST45,46 and PepCalc (https://pepcalc.com/).
IFNγ ELISPOT assay following 12-day in vitro stimulation
Synthetic peptides were provided by EMC Microcollections GmbH and INTAVIS Bioanalytical Instruments
AG. PBMCs were pulsed with HLA class I or HLA-DR peptide pools (1 µg/mL per peptide for class I or 5
µg/mL for HLA-DR) and cultured for 12 days adding 20 U/mL IL-2 (Novartis) on days 3, 5, and 7. Peptide-
stimulated PBMCs were analyzed by enzyme-linked immunospot (ELISPOT) assay in duplicates (if not
mentioned otherwise). 200.000 - 800.000cells per well were incubated with 1 µg/mL (class I) or 2.5
µg/mL (HLA-DR) of single peptides in 96-well plates coated with anti-IFNγ antibody (clone 1-D1K, 2
µg/mL, MabTech). PHA (Sigma-Aldrich) served as positive control. After 22 - 24 h incubation, spots were
revealed with anti-IFNγ biotinylated detection antibody (clone 7-B6-1, 0.3 µg/mL, MabTech),
Extraavidin−Alkaline Phosphatase (1:1,000 dilution, Sigma-Aldrich) and BCIP/NBT (5-bromo-4-chloro-3-
indolyl-phosphate/nitro-blue tetrazolium chloride, Sigma-Aldrich). Spots were counted using an
Page 12/26ImmunoSpot S5 analyzer (CTL) and T-cell responses were considered positive when mean spot count
was at least three-fold higher than the mean spot count of the negative control. Calculated spot counts
indicate the mean spot count of duplicates normalized to 5 x 10⁵ cells minus the normalized mean spot
count of the respective negative control. For negative control peptides see Supplementary Table 11. For
HLA-C*07-restricted peptides, screening in PRE donors was performed using samples of HLA-B*07+
samples due to unavailable HLA-C typing and the known linkage disequilibrium of HLA-B*07 and -
C*0747,48.
Intracellular cytokine and cell surface marker staining
Peptide-speci c T cells were further characterized by intracellular cytokine and cell surface marker
staining. PBMCs were incubated with 10 µg/mL of peptide, 10µg/mL Brefeldin A (Sigma-Aldrich), and a
1:500 dilution of GolgiStop (BD) for 12 - 16 h. Staining was performed using Cyto x/Cytoperm solution
(BD), APC/Cy7 anti-human CD4 (BD), PE/Cy7 anti-human CD8 (Beckman Coulter), Paci c Blue anti-
human TNF, FITC anti-human CD107a, and PE anti-human IFNγ monoclonal antibodies (BioLegend).
PMA (5 µg/ml) and ionomycin (1 µM, Sigma-Aldrich) served as positive control. Viable cells were
determined using Aqua live/dead (Invitrogen). All samples were analyzed on a FACS Canto II cytometer
(BD) and evaluatedusing FlowJo software version 10.0.7 (BD).
SARS-CoV-2 IgG ELISA (EUROIMMUN)
The 96-well SARS-CoV-2 IgG ELISA assay (EUROIMMUN) was performed on an automated BEP 2000
Advance® system (Siemens Healthcare Diagnostics GmbH) according to the manufacturer’s instructions.
The ELISA assay detects anti-SARS-CoV-2 IgG directed against the S1 domain of the viral spike protein
and relies on an assay-speci c calibrator to report a ratio of specimen absorbance to calibrator
absorbance. The nal interpretation of positivity is determined by ratio above a threshold value given by
the manufacturer: positive (ratio≥ 1.1), borderline (ratio 0.8 - 1.0) or negative (ratio < 0.8). Quality control
was performed following the manufacturer’s instructions on each day of testing.
Elecsys® anti-SARS-CoV-2 immunoassay (Roche Diagnostics GmbH)
The Elecsys® anti-SARS-CoV-2 assay is an ECLIA (electrogenerated chemiluminescence immunoassay)
assay designed by Roche Diagnostics GmbH and was used according to manufacturer’s instructions. It is
intended for the detection of high a nity antibodies (including IgG) directed against the nucleocapsid
protein of SARS-CoV-2 in human serum. Readout was performed on the Cobas ae411 analyzer. Negative
results were de ned by a cut-off index (COI) of < 1.0. Quality control was performed following the
manufacturer’s instructions on each day of testing.
Page 13/26Generation of expression constructs for the production of viral
antigens
The cDNAs encoding the nucleocapsid proteins of HCoV-OC43, HCoV-NL63, and HCoV-229E (gene bank
accession numbers YP_009555245.1; YP_003771.1; NP_073556.1) were produced with a N-terminal
hexahistidine (His6)-tag by gene synthesis (ThermoFisher Scienti c) and cloned using standard
techniques into NdeI/HindIII sites of the bacterial expression vector pRSET2b (ThermoFisher Scienti c).
Protein expression and puri cation
To express the viral nucleocapsid proteins the respective expression constructs were transformed in
E.coli BL21(DE3) cells. Protein expression was induced in 1 L TB medium at an optical density (OD 600 of
2.5 - 3) by addition of 0.2 mM isopropyl-β-D-thiogalactopyranoside (IPTG) for 16 h at 20°C. Cells were
harvested by centrifugation (10 min, 6000 x g) and the pellets were suspended in binding buffer
(1x PBS, 0.5 M NaCl, 50 mM imidazole, 2 mM PMSF, 2 mM MgCl2, 150 µg/mL lysozyme (Merck) and
625 µg/mL DNAse I (Applichem)). The cell suspensions were soni ed for 15 min (Bandelin Sonopuls
HD70 - power MS72/D, cycle 50%) on ice, incubated for 1 h at 4°C in a rotary shaker and soni ed again.
After centrifugation (30 min at 20,000 x g) urea was added to a nal concentration of 6 M to the soluble
protein extract. The extract was ltered through a 0.45 µm lter and loaded on a pre-equilibrated 1-ml
HisTrapFF column (GE Healthcare). The bound His-tagged nucleocapsid proteins were eluted by a linear
gradient (30 mL) ranging from 50 to 500 mM imidazole in elution buffer (1x PBS, pH 7.4, 0.5 M NaCl, 6 M
Urea). Elution fractions (0.5 mL) containing the His-tagged nucleocapsid proteins were pooled and
dialyzed (D-Tube Dialyzer Mega, Novagen) into PBS. All puri ed proteins were analyzed via standard
SDS-PAGE followed by staining with InstantBlue (Expedeon) and immunoblotting using an anti-His
antibody (Penta-His Antibody, #34660, Qiagen) in combination with a donkey-anti-mouse antibody
labeled with AlexaFluor647 (Invitrogen) on a Typhoon Trio (GE Healthcare, excitation 633 nM, emission
lter settings 670 nM BP 30) to con rm protein integrity.
Preparation of beads for the serological multiplex assay
Antigens were covalently immobilized on spectrally distinct populations of carboxylated paramagnetic
beads (MagPlex Microspheres, Luminex Corporation, Austin, TX) using 1-Ethyl-3-(3-dimethylaminopropyl)
carbodiimide (EDC) / sulfo-N-hydroxysuccinimide (sNHS)chemistry. For immobilization, a magnetic
particle processor (KingFisher 96, ThermoFischer Scienti c) was used. Bead stocks were vortexed
thoroughly and soni cated for 15 seconds. A 96-deep-well plate and tip comb was blocked with 1.1
mL 0.5% (v/v) Triton X-100 for 10 minutes. Afterwards, 83 µL of 0.065% (v/v) Triton X-100 and 1 mL
bead stock were added to each well. Finally, each well contained 0.005% (v/v) Triton X-100 and 12.5 x
107 beads of one single bead population. The beads were washed twice with 500 µL activation buffer
(100 mM Na2HPO4, pH 6.2, 0.005% (v/v) Triton X-100) and beads were activated for 20 min in 300 µL
Page 14/26activation mix containing 5 mg/mL EDC and 5 mg/mL sNHS in activation buffer. Following activation,
the beads were washed twice with 500 µL coupling buffer (500 mM MES, pH 5.0 + 0.005% (v/v) Triton X-
100). Antigens were diluted to 39 µg/mL in coupling buffer and incubated with the activated beads for 2
h at 21°C to immobilize the antigens on the surface. Antigen-coupled beads were washed twice with 800
µL wash buffer (1x PBS + 0.005% (v/v) Triton X-100) and were nally resuspended in 1 mL storage buffer
(1x PBS + 1% (w/v) BSA + 0.05% (v/v) ProClin). The beads were stored at 4°C until further use.
Bead-based serological multiplex assay
To detect human IgG directed against nucleocapsid proteins from three different coronavirus species
(HCoV-229E, HCoV-NL63, HCoV-OC43), a bead-based multiplex assay was performed. All antigens were
immobilized on different bead populations as described above. The individual bead populations were
combined to a bead mix. 25 µL of diluted serum sample were added to 25 µL of the bead mix resulting in
a nal sample dilution of 1:400 and incubated for 2 h at 21°C. Unbound antibodies were removed by
washing the beads three times with 100 µL wash buffer (1x PBS + 0.05% (v/v) Tween20) per well using a
microplate washer (Biotek 405TS, Biotek Instruments GmbH). Bound antibodies weredetected by
incubating the beads with PE-labeled goat-anti-human IgG detection antibodiesfor 45 min at 21°C.
Measurements were performed using a Luminex FlexMap 3D instrument using Luminex xPONENT
Software (sample size: 80 µL, 100 events; gate: 7,500 - 15,000; reporter gain: Standard PMT). Data
analysis was performed on Mean Fluorescence Intensity (MFI).
Software and statistical analysis
The population coverage of HLA allotypes was calculated by the IEDB population coverage tool
(www.iedb.org). Flow cytometric data was analyzed using FlowJo 10.0.8 (Treestar). Data are displayed
as mean with standard deviation, box plot as median with 25% or 75% quantiles and min/max whiskers.
Continuous data were tested for distribution and individual groups were tested by use of unpaired
students-t test, Mann-Whitney-U test or Kruskal- Wallis-test and corrected for multiple comparison as
indicated. Spearman rho (r) was calculated for correlation between continuous data. A logistic regression
model was used to calculate odds ratios and 95% con dence interval (CI). Factors before the outcome
and measured continuous variables were included in the model. Missing data were included in tables and
in descriptive analysis. Graphs were plotted using GraphPad Prism 8.4.0. Statistical analyses were
conducted using GraphPad Prism 8.4.0 and JMP® Pro (SAS Institute Inc., version 14.2) software. P
values of < 0.05 were considered statistically signi cant.
Declarations
Acknowledgements
Page 15/26We thank all SARS and PRE donors for their support of our research. We thank Ulrike Schmidt, Christine
Bauer, Antje Petz, Martina Storz, Isolde Riedlinger, Sabrina Sauter, Sabrina Augstein, Celine Reiß, Valentina
Agrusa, Santhana Dethling, Michael Beller and Claudia Falkenburger for technical support and project
coordination. This work was supported by the Bundesministerium für Bildung und Forschung (BMBF,
FKZ:01KI20130), the Deutsche Forschungsgemeinschaft (DFG, German Research Foundation, Grant WA
4608/1-2), the Deutsche Forschungsgemeinschaft under Germany’s Excellence Strategy (Grant EXC2180-
390900677), the German Cancer Consortium (DKTK), the Wilhelm Sander Stiftung (Grant 2016.177.2),
the José Carreras Leukämie-Stiftung (Grant DJCLS 05 R/2017), and the Fortüne Program of the
University of Tübingen (Fortüne number 2451-0-0 and 2581-0-0). Multiplex antibody detection against
common cold coronaviruses is part of a project that has received funding from the European Union’s
Horizon 2020 research and innovation program under grant agreement No 101003480 - CORESMA.
Authorship Contributions
A.N., H.-G.R., S.S., C.G., J.S.W. designed the study; A.N., S.S., and J.S.W. performed in silicoprediction and
selection of candidate peptides; T.Bi., Y.M., M.L, J.B., J.R., M.W., M.F., I.H.,M.M. conducted in vitro T-cell
experiments; B.P., R.K., D.J.K. and V.S-Z. conducted HLA allotype analysis; B.T., P.D.K., and U.R. generated
expression plasmids, puri ed proteins for multiplex serological Luminex assay which was developed and
conducted by M.B., D.J., G.K., M.S., N.S-M., M.F.T., T.O.J; SARS-CoV-2 IgG were detected by S.H., A.P.;
J.S.H., M.R., T.Ba., L.- C.G., D.R., H.R.S., J.S.W. conducted patient data and sample collection as well as
medical evaluation and analysis; A.N., T.Bi., J.S.H., M.G., O.K., J.S.W. analyzed data and
performedstatistical analyses; A.N., T.Bi., J.S.H., H.R.S., J.S.W. drafted the manuscript; H.-G.R., S.S.,J.S.W.
supervised the study.
Data availability statement
All data that support the ndings of this study are provided with the manuscript. Further source data are
available from the corresponding author upon request.
Disclosure of Con icts of Interest
Daniel Kowalewski and Vlatka Stos-Zweifel are employees of the Immatics Biotechnologies GmbH. Hans-
Georg Rammensee is shareholder of Immatics Biotechnologies GmbH and Curevac AG. The other authors
declare no competing nancial interests.
References
1. Swain, L., McKinstry, K. K. & Strutt, T. M. Expanding roles for CD4(+) T cells in immunity to viruses.
Nat Rev Immunol12, 136-148, doi:10.1038/nri3152 (2012).
Page 16/262. Rosendahl Huber, S., van Beek, J., de Jonge, J., Luytjes, W. & van Baarle, T cell responses to viral
infections - opportunities for Peptide vaccination. Front Immunol 5, 171,
doi:10.3389/ mmu.2014.00171 (2014).
3. Seder, A., Darrah, P. A. & Roederer, M. T-cell quality in memory and protection: implications for vaccine
design. Nat Rev Immunol 8, 247-258, doi:10.1038/nri2274 (2008).
4. Khan, N. et al. T cell recognition patterns of immunodominant cytomegalovirus antigens in primary
and persistent infection. J Immunol 178, 4455-4465, doi:10.4049/jimmunol.178.7.4455 (2007).
5. Falk, et al. Analysis of a naturally occurring HLA class I-restricted viral epitope. Immunology 82, 337-
342 (1994).
6. Einsele, et al. Infusion of cytomegalovirus (CMV)-speci c T cells for the treatment of CMV infection
not responding to antiviral chemotherapy. Blood 99, 3916-3922, doi:10.1182/blood.v99.11.3916
(2002).
7. Tan, A. et al. The design and proof of concept for a CD8(+) T cell-based vaccine inducing cross-
subtype protection against in uenza A virus. Immunol Cell Biol 91, 96-104, doi:10.1038/icb.2012.54
(2013).
8. Lubke, M. et al. Identi cation of HCMV-derived T cell epitopes in seropositive individuals through
viral deletion models. J Exp Med 217, doi:10.1084/jem.20191164 (2020).
9. Petrova, , Ferrante, A. & Gorski, J. Cross-reactivity of T cells and its role in the immune system. Crit
Rev Immunol 32, 349-372, doi:10.1615/critrevimmunol.v32.i4.50 (2012).
10. Grifoni, A. et al. Targets of T Cell Responses to SARS-CoV-2 Coronavirus in Humans with COVID-19
Disease and Unexposed Individuals. Cell, doi:10.1016/j.cell.2020.05.015 (2020).
11. Braun, J. et Presence of SARS-CoV-2 reactive T cells in COVID-19 patients and healthy donors.
medRxiv, 2020.2004.2017.20061440, doi:10.1101/2020.04.17.20061440 (2020).
12. Mudd, P. et al. Vaccine-induced CD8+ T cells control AIDS virus replication. Nature 491, 129-133,
doi:10.1038/nature11443 (2012).
13. Mo, P. et al. Clinical characteristics of refractory COVID-19 pneumonia in Wuhan, China. Clin Infect
Dis, doi:10.1093/cid/ciaa270 (2020).
14. Khan, S. et al. The emergence of a novel coronavirus (SARS-CoV-2), their biology and therapeutic
options. J Clin Microbiol, doi:10.1128/JCM.00187-20 (2020).
15. Zhao, J. et Airway Memory CD4(+) T Cells Mediate Protective Immunity against Emerging
Respiratory Coronaviruses. Immunity 44, 1379-1391, doi:10.1016/j.immuni.2016.05.006 (2016).
16. Zhao, , Zhao, J. & Perlman, S. T cell responses are required for protection from clinical disease and
for virus clearance in severe acute respiratory syndrome coronavirus-infected mice. J Virol 84, 9318-
9325, doi:10.1128/JVI.01049-10 (2010).
17. Channappanavar, R., Fett, C., Zhao, , Meyerholz, D. K. & Perlman, S. Virus-speci c memory CD8 T cells
provide substantial protection from lethal severe acute respiratory syndrome coronavirus infection. J
Virol 88, 11034-11044, doi:10.1128/JVI.01505-14 (2014).
Page 17/2618. Ng, W. et al. Memory T cell responses targeting the SARS coronavirus persist up to 11 years post-
infection. Vaccine34, 2008-2014, doi:10.1016/j.vaccine.2016.02.063 (2016).
19. Liu, et al. Anti-spike IgG causes severe acute lung injury by skewing macrophage responses during
acute SARS-CoV infection. JCI Insight 4, doi:10.1172/jci.insight.123158 (2019).
20. Tang, F. et al. Lack of peripheral memory B cell responses in recovered patients with severe acute
respiratory syndrome: a six-year follow-up J Immunol 186, 7264-7268,
doi:10.4049/jimmunol.0903490 (2011).
21. Su, F., Kidd, B. A., Han, A., Kotzin, J. J. & Davis, M. M. Virus-speci c CD4(+) memory-phenotype T cells
are abundant in unexposed adults. Immunity 38, 373-383, doi:10.1016/j.immuni.2012.10.021 (2013).
22. Bui, H. et al. Predicting population coverage of T-cell epitope-based diagnostics and vaccines. BMC
Bioinformatics 7, 153, doi:10.1186/1471-2105-7-153 (2006).
23. Vita, et al. The immune epitope database (IEDB) 3.0. Nucleic Acids Res 43, D405-412,
doi:10.1093/nar/gku938 (2014 Oct 9).
24. Wang, C. et The establishment of reference sequence for SARS-CoV-2 and variation analysis. Journal
of Medical Virology, doi:10.1002/jmv.25762 (2020).
25. Phan, T. Genetic diversity and evolution of SARS-CoV-2. Infect Genet Evol 81, 104260,
doi:10.1016/j.meegid.2020.104260 (2020).
26. Long, Q. X. et Antibody responses to SARS-CoV-2 in patients with COVID-19. Nat Med,
doi:10.1038/s41591-020- 0897-1 (2020).
27. Vali, et al. Characterization of cross-reactive CD8+ T-cell recognition of HLA-A2-restricted HIV-Gag
(SLYNTVATL) and HCV-NS5b (ALYDVVSKL) epitopes in individuals infected with human
immunode ciency and hepatitis C viruses. J Virol 85, 254-263, doi:10.1128/JVI.01743-10 (2011).
28. Acierno, P. M. et Cross-reactivity between HLA-A2-restricted FLU-M1:58-66 and HIV p17 GAG:77-85
epitopes in HIV-infected and uninfected individuals. J Transl Med 1, 3, doi:10.1186/1479-5876-1-3
(2003).
29. Friberg, et al. Memory CD8+ T cells from naturally acquired primary dengue virus infection are highly
cross-reactive. Immunol Cell Biol 89, 122-129, doi:10.1038/icb.2010.61 (2011).
30. Yin, Y. & Mariuzza, R. The multiple mechanisms of T cell receptor cross-reactivity. Immunity 31, 849-
851, doi:10.1016/j.immuni.2009.12.002 (2009).
31. Borbulevych, O. Y. et al. T cell receptor cross-reactivity directed by antigen-dependent tuning of
peptide-MHC molecular exibility. Immunity 31, 885-896, doi:10.1016/j.immuni.2009.11.003 (2009).
32. COVID-19 Situation Report 29/04/2020,
(2020).
33. Dong, , Du, H. & Gardner, L. An interactive web-based dashboard to track COVID-19 in real time.
Lancet Infect Dis 20, 533-534, doi:10.1016/S1473-3099(20)30120-1 (2020).
Page 18/2634. Kruttgen, et al. Comparison of four new commercial serologic assays for determination of SARS-
CoV-2 IgG. J Clin Virol 128, 104394, doi:10.1016/j.jcv.2020.104394 (2020).
35. Wilkinson, T. M. et al. Preexisting in uenza-speci c CD4+ T cells correlate with disease protection
against in uenza challenge in Nat Med 18, 274-280, doi:10.1038/nm.2612 (2012).
36. Soghoian, Z. et al. HIV-speci c cytolytic CD4 T cell responses during acute HIV infection predict
disease outcome. Sci Transl Med 4, 123ra125, doi:10.1126/scitranslmed.3003165 (2012).
37. Messaoudi, , Guevara Patino, J. A., Dyall, R., LeMaoult, J. & Nikolich-Zugich, J. Direct link between
mhc polymorphism, T cell avidity, and diversity in immune defense. Science 298, 1797-1800,
doi:10.1126/science.1076064 (2002).
38. Tan, C., La Gruta, N. L., Zeng, W. & Jackson, D. C. Precursor frequency and competition dictate the
HLA-A2-restricted CD8+ T cell responses to in uenza A infection and vaccination in HLA-A2.1
transgenic mice. J Immunol 187, 1895-1902, doi:10.4049/jimmunol.1100664 (2011).
39. Kiepiela, et al. CD8+ T-cell responses to different HIV proteins have discordant associations with viral
load. Nat Med 13, 46-53, doi:10.1038/nm1520 (2007).
40. Wu, et al. A new coronavirus associated with human respiratory disease in China. Nature 579, 265-
269, doi:10.1038/s41586-020-2008-3 (2020).
41. Hoof, I. et al. NetMHCpan, a method for MHC class I binding prediction beyond humans.
Immunogenetics 61, 1-13, doi:10.1007/s00251-008-0341-z (2009).
42. Nielsen, M. & Andreatta, M. NetMHCpan-3.0; improved prediction of binding to MHC class I molecules
integrating information from multiple receptor and peptide length Genome Med 8, 33,
doi:10.1186/s13073-016-0288-x (2016).
43. Jurtz, et al. NetMHCpan-4.0: Improved Peptide-MHC Class I Interaction Predictions Integrating Eluted
Ligand and Peptide Binding A nity Data. J Immunol 199, 3360-3368,
doi:10.4049/jimmunol.1700893 (2017).
44. Rammensee, H., Bachmann, J., Emmerich, N. P., Bachor, A. & Stevanovic, S. SYFPEITHI: database for
MHC ligands and peptide motifs. Immunogenetics 50, 213-219, doi:10.1007/s002510050595 (1999).
45. Altschul, F., Gish, W., Miller, W., Myers, E. W. & Lipman, D. J. Basic local alignment search tool. J Mol
Biol 215, 403- 410, doi:10.1016/S0022-2836(05)80360-2 (1990).
46. Johnson, et al. NCBI BLAST: a better web interface. Nucleic Acids Res 36, W5-9,
doi:10.1093/nar/gkn201 (2008).
47. Schlott, et al. Characterization and clinical enrichment of HLA-C*07:02-restricted Cytomegalovirus-
speci c CD8+ T cells. PLoS One 13, e0193554, doi:10.1371/journal.pone.0193554 (2018).
48. Schmidt, H. et al. Estimation of high-resolution HLA-A, -B, -C, -DRB1 allele and haplotype frequencies
based on 8862 German stem cell donors and implications for strategic donor registry planning. Hum
Immunol 70, 895-902, doi:10.1016/j.humimm.2009.08.006 (2009).
Figures
Page 19/26Figure 1
Identi cation and selection of SARS-CoV-2-derived HLA class I- and HLA-DR- binding peptides. (a)
Schematic overview of our prediction and selection approach to identify and nally select 120 broadly
applicable SARS-CoV-2 HLA class I- and HLA-DR-binding peptides for further screening and validation as
T-cell epitopes. (b, d) Selected (b) HLA class I- and (d) HLA-DR-binding peptides for the 10 and 6 most
common HLA class I and HLA- DR allotypes, respectively. Each color represents a distinct ORF. spi, spike
protein; env, envelope protein; mem, membrane protein; nuc, nucleocapsid protein. (c) HLA class I peptide
and (e) HLA-DR peptide cluster distribution within the ORF9 nucleocapsid protein (for ORF1 - ORF8 and
ORF10 refer to Extended Data Fig. 1e-m and Extended Data Fig. 2c-k). Each color represents a distinct
HLA class I and HLA-DR allotype, respectively. (f) HLA allotype population coverage achieved with the
selection of HLA class I and HLA-DR allotypes for SARS-CoV-2 T-cell epitope screening compared to the
world population. The frequencies of individuals within the world population carrying up to ve HLA class
I or HLA-DR allotypes (x-axis) are indicated as grey bars on the left y-axis. The cumulative percentage of
population coverage is depicted as black dots on the right y-axis. (g) Recurrent mutations24,25 of SARS-
CoV-2 ORFs within the selected peptide sequences. Wild-type and mutated amino acids are marked in
Page 20/26green and red, respectively. Reported mutation frequencies (1 - 5%) are re ected by the size of the
mutated amino acid. Anchor amino acids for HLA-binding are highlighted by underlining.
Page 21/26Figure 2
Validation and characterization of SARS-CoV-2-derived HLA class I and HLA-DR T-cell epitopes. (a-d) IFNγ
ELISPOT assay and ow cytometry-based characterization of peptide-speci c T cells from donors
recovered from SARS-CoV-2 infection after in vitro stimulation with SARS-CoV-2-derived (a, b) HLA class I-
and (c, d) HLA-DR-binding peptides. Flow cytometry data of indicated cytokines and surface markers are
shown for (b) CD8+ and (d) CD4+ T cells. (e, f) Recognition frequency- and allotype-sorted pie charts of
SARS-CoV-2- derived (e) HLA class I and (f) HLA-DR T-cell epitopes. Recognition frequency of T-cell
epitopes in groups of HLA class I-matched convalescent donors of SARS-CoV-2 infection (SARS group 1,
total n = 116, left pie chart, red) and donors never exposed to SARS-CoV-2 (PRE group A, total n = 104,
right pie chart, blue) were assessed by ELISPOT assays. Dominant (immune responses in ≥ 50% of SARS
donors) and subdominant T-cell epitopes are marked with dark grey and light grey background,
respectively. SARS-CoV-2-speci c T-cell epitopes with responses detected exclusively in the SARS group
are marked with a red frame, cross- reactive epitopes with immune responses detected in the PRE group
are marked with a blue frame. (g) Calculated spot counts were assessed by ELISPOT assays of SARS-
Page 22/26CoV-2-derived HLA class I (n = 121) and HLA-DR T-cell epitopes (n = 214) in the SARS group (min/max
box plots, Mann-Whitney U test). (h) Frequency of validated HLA class I T-cell epitopes for structural (dark
grey) and non-structural/accessory (light grey) ORFs. spi, spike protein; env, envelope protein; mem,
membrane protein; nuc, nucleocapsid protein. (i) Mean recognition frequency of HLA class I and HLA-DR
T-cell epitopes by SARS (red) and PRE donors (blue) within the different ORFs.
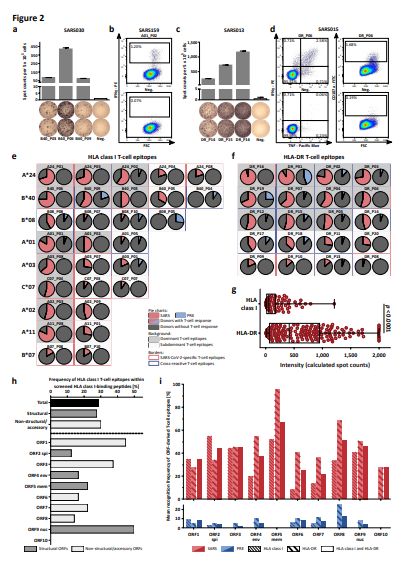
Page 23/26Figure 3
Detection and characterization of T-cell responses to SARS-CoV-2-derived HLA class I and HLA-DR T-cell
epitopes in unexposed individuals. (a) Recognition rate of HLA class I and HLA-DR SARS-CoV-2 T-cell
epitopes in SARS group 1 (n = 116) and PRE group A (n = 104), respectively (data shown for donors with
T-cell responses, Mann-Whitney U test). (b) Representative sequence and physiochemical property
alignments of the cross-reactive SARS-CoV-2 T-cell epitope A24_P02 with the four seasonal common cold
human coronaviruses (HCoV-OC43, HCoV-229E, HCoV-NL63, HCoV-HKU1, for other cross-reactive
peptides refer to Supplementary Tables 9 and 10, Supplementary Data 1). Physiochemical properties
were calculated by the PepCalc software. Column directions (up vs. down) indicate hydrophilicity
according to the Hopp-Woods scale. (c) Schematic overview of the de nition of SARS-CoV-2-speci c and
cross-reactive epitope compositions (EC) for standardized evaluation of SARS-CoV-2 T-cell responses in a
group of convalescents from SARS-CoV-2 infection (SARS group 2, n = 86) and a group of unexposed
individuals (PRE group B, n = 94). (d, e) Recognition frequency of (d) cross-reactive and (e) SARS-CoV-2-
speci c EC by T cells in the SARS group 2 and PRE group B. (f, g) Calculated spot counts for (f) SARS-
CoV-2-speci c (HLA class I: n = 68; HLA-DR: n = 78) and (g) cross-reactive EC in the SARS group 2 (HLA
class I: n = 51; HLA-DR: n = 86) and PRE group B (HLA class I: n = 15; HLA-DR: n = 73) (min/max box
plots, Mann-Whitney U test).
Page 24/26You can also read