Not all cicadas increase thermal tolerance in response to a temperature gradient in metropolitan Seoul - Nature
←
→
Page content transcription
If your browser does not render page correctly, please read the page content below
www.nature.com/scientificreports

            OPEN           Not all cicadas increase
                           thermal tolerance in response
                           to a temperature gradient in
                           metropolitan Seoul
                           Hoa Quynh Nguyen1, Hortense Serret2, Yoonhyuk Bae3, Seongmin Ji4, Soyeon Chae1,
                           Ye Inn Kim1, Jeongjoo Ha1 & Yikweon Jang1,2*
                           Rapid anthropogenic alterations caused by urbanization are increasing temperatures in urban cores,
                           a phenomenon known as the urban heat island (UHI) effect. Two cicada species, Cryptotympana
                           atrata and Hyalessa fuscata (Hemiptera: Cicadidae), are abundant in metropolitan Seoul where their
                           population densities correlate strongly with UHI intensities. Such a positive correlation between cicada
                           density and UHI intensity may be possible if cicada abundance is linked to a certain thermal tolerance.
                           We tested this hypothesis by investigating variation in morphology and thermal responses of two
                           cicada species along a thermal gradient in Seoul and surrounding areas. The morphological responses
                           were measured by metrics such as length, thorax width and depth, and mass. The thermal responses
                           were measured in terms of minimum flight temperature, maximum voluntary temperature and heat
                           torpor temperature. First, we observed a species-specific variation in thermal responses, in which C.
                           atrata displayed a higher thermal threshold for maximum voluntary and heat torpor temperatures
                           than H. fuscata. Second, a positive association between temperature conditions and body sizes were
                           displayed in females H. fuscata, but not in either conspecific males or C. atrata individuals. Third, C.
                           atrata exhibited similar thermal responses regardless of habitat temperature, while H. fuscata in
                           warmer areas showed an increase in heat tolerance. In addition, H. fuscata individuals with bigger
                           thorax sizes were more heat-tolerant than those with smaller thoraxes. Overall, our research is the first
                           to detect a variation in thermal responses and body size of H. fuscata individuals at a local scale. More
                           investigations would be needed to better understand the adaptation mechanisms of insects linked to
                           UHI effects.

                           Temperature is one of the most important abiotic factors affecting daily activities and the life history of cicadas1–6.
                           As temperature directly dictates chemical rates and metabolic processes in vivo, a habitat with fluctuating temper-
                           atures could drive insects to manage the high energy costs of maintaining body temperature, Tb, within a certain
                           range to coordinate reproductive activity4. The surrounding conditions may also have an effect on reproductive
                           success and mortality7–10. If so, cicadas should select favorable thermal conditions to obtain optimal body tem-
                           peratures via behavioral- or physiological mechanisms4,11.
                               The urban heat island (UHI) effect, in which increased temperatures are associated with urban areas, is a
                           ubiquitous consequence of microclimatic perturbation12 due to human activities and energy consumption,
                           along with modification of landscapes and urban geometry13–17. Elevated temperatures in urban environ-
                           ments are regarded as detrimental as they reduce plant photosynthesis capability18 and biological diversity19,20.
                           Nevertheless, for urban herbivorous insects such as cicadas, such warm habitats may prove advantageous. First,
                           post-morphogenesis development of cicada eggs require a large degree of thermal accumulation2. Second, growth
                           rates of cicada nymphs demonstrate a positive association with climate: those inhabiting warmer regions are more

                           1
                            Interdisciplinary Program of EcoCreative, Ewha Womans University, Ewhayeodaegil-52, Seoul, 03760, Republic of
                           Korea. 2Department of Life Science and Division of EcoScience, Ewha Womans University, Ewhayeodaegil-52, Seoul,
                           03760, Republic of Korea. 3Department of Life Science, Hallym University, Hallimdaehakgil-1, Chuncheon, 24252,
                           Republic of Korea. 4Division of Life Sciences, Korea University, Anamro-145, Seoul, 02841, Republic of Korea. *email:
                           jangy@ewha.ac.kr

Scientific Reports |   (2020) 10:1343 | https://doi.org/10.1038/s41598-020-58276-0                                                              1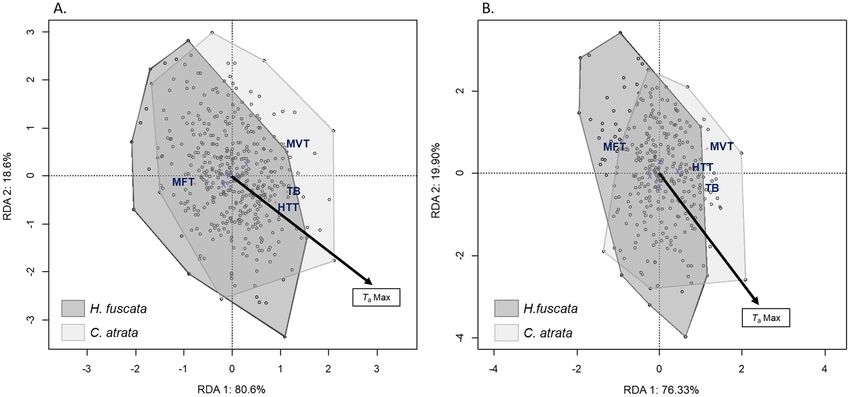
www.nature.com/scientificreports/                                                               www.nature.com/scientificreports

                           likely to grow faster than counterparts in cooler regions21. This may facilitate the development of larger body size
                           in cicadas in the former group22, which in turn directly promotes greater fecundity of females23 and indirectly
                           contributes to higher mating success in males24. Third, the emergence of final instars is stimulated by soil tem-
                           perature, with warmer conditions triggering an earlier phenology of those instars25. Such earlier eclosion of male
                           over female cicadas6 works advantageously for males as it maximizes mating success in those multiple copulating
                           individuals26.
                               Recent studies have shown that some urban insect species adapt rapidly to warm city cores by increasing ther-
                           mal tolerance. Herbivorous insects with high thermal tolerance capacity are better able to adapt to urban envi-
                           ronments27. Specific physiological tolerances and thermoregulating behaviors of insects vary with their physical
                           habitat conditions28. Accumulating evidence of an ability to track localized thermal profile clines in cities suggests
                           that urban insects can evolve adaptive traits in response to such rapid environmental changes and become over-
                           represented in cities29,30. In several forest ant species in North America, higher critical thermal maxima correlate
                           positively with population abundances in warm urban plots31,32. Additionally, urban ants possess higher heat
                           tolerance than do rural ants33,34, which indicates adaptive plasticity or local thermal adaptation to microclimatic
                           change in urban organisms.
                               Two cicada species, Cryptotympana atrata and Hyalessa fuscata (Hemiptera: Cicadidae), are widely distributed
                           on the Korean Peninsula. These cicadas emerge annually from June to early October for key life history events,
                           such as mate attraction, pair formation, and oviposition. The distribution of C. atrata ranges from East Asia to
                           the northern part of Indo-China, whereas that of H. fuscata overlaps East Asia and encompasses the Far East of
                           Russia35. An enumeration survey of cicada exuviae depicts more prevalent population densities in urban and sub-
                           urban habitats relative to countryside habitats36. In particular, they constitute a major portion of cicada species in
                           metropolitan Seoul, where their population densities correlate highly with UHI intensities37. C. facialis, a closely
                           related species to C. atrata, has shown rapid population expansion in urbanized areas in Japan, owing to superior
                           thermal adaptation to urban conditions2. Provided that the prevalence of C. atrata and H. fuscata populations in
                           urban area is due to greater thermal tolerance to urban conditions, their thermal responses can be expected to be
                           associated with the localized clines of habitat temperatures intensities.
                               Our aim was to investigate variations in morphology and thermal responses of two cicada species, C. atrata
                           and H. fuscata, in accordance with the temperature of their habitats. We collected cicadas along a thermal gra-
                           dient and assessed their morphometry and thermal responses. Given that a positive correlation already exists
                           between cicada population densities and ambient temperatures, we predicted positive associations between UHI
                           intensities and (1) morphological characteristics and (2) thermal responses of those cicadas.

                           Methodology
                           Sample collection.          We sampled populations of C. atrata and H. fuscata from July 15 to August 5, 2016, in
                           metropolitan Seoul and the vicinity in the Republic of Korea. Metropolitan Seoul covers more than 600 km2 with
                           diverse landscape features, generating a mosaic of heterogeneous UHI intensities for cicadas. Approximately 10
                           million people live within city limits, with another 10 million in the surrounding suburban areas.
                               The sampling method and selection of study areas followed 12 sampling areas by Nguyen, et al.37. From there,
                           three areas were excluded due to low sampling densities and difficulty in collecting cicadas. In order to verify our
                           sampling design and its suitability to our research question, we compared those nine areas in terms of the abiotic
                           factors related to urbanization such as greenness, wetness, imperviousness and isothermal. Greenness is a meas-
                           ure of photosynthetically active vegetation, wetness represents soil and vegetation moisture38, and imperviousness
                           measures building footprints, pavements and asphalt. Isothermal is mean diurnal range divided by temperature
                           annual range, extracted from worldclim 1.439. A one-way analysis of variance in which greenness, wetness, imper-
                           viousness, and isothermal were response variables was conducted. As expected, isothermal was the only variable
                           that was significantly different among the nine areas (Supplementary Material 1). We concluded that temperature
                           was the critical factor that differentiated among those nine area, thus verifying our sampling scheme (Fig. 1).
                               Weather data were compiled from Korea Meteorological Administration records. We calculated average max-
                           imum ambient temperature (TaMax) of each area during summer periods from June 1, 2010, to August 31, 2015.
                           Given that mean, minimum, and maximum ambient temperatures are employed in UHI studies40, we relied on
                           maximum ambient temperature, as it better represents the actual high ambient temperature that the cicadas
                           encounter in their environment than the mean or minimum ambient temperature. Nine areas were randomly
                           sampled and each area was sampled twice. Cicadas were collected from 8:00 a.m. to 12:00 p.m. at residential com-
                           plexes in each area, and were subjected to thermal-response experiments within the day of capture. Information
                           regarding sampling areas and the number of each species collected at each area are provided in Supplementary
                           Material 2.

                           Measurement of thermal responses. Minimum flight temperature (MFT), maximum voluntary temper-
                           ature (MVT), and heat torpor temperature (HTT) are conservative measures of thermal adaptation of cicadas to
                           a habitat4,41,42 (see43 for a summary of thermal responses in 118 taxa of North American cicadas). MFT represents
                           the lowest body temperature with fully coordinated activity. MVT is the upper thermoregulatory point at which
                           thermoregulation takes precedence over other behaviors. HTT is the upper limit beyond which cicadas sink into
                           a state of torpor. MVT increases as a habitat becomes warmer in some cases, whereas HTT is strictly related to the
                           thermal condition of a habitat4,41–44. The MFT-to-HTT range indicates the fully active thermal breadth (TbRange)
                           of each species in relation to a certain habitat condition.
                               Thermal responses of each individual were assessed in a single assay with no rest time between treatments
                           under laboratory conditions. First, each cicada was cooled to a torpid state by keeping it at −20 °C. We checked
                           each individual’s Tb every three minutes to ensure they did not freeze, as this might affect HTT42. As soon as the
                           individual was torpid, we assessed MFT by dropping the insect from a height of 2.5 m. If the insect could not

Scientific Reports |   (2020) 10:1343 | https://doi.org/10.1038/s41598-020-58276-0                                                             2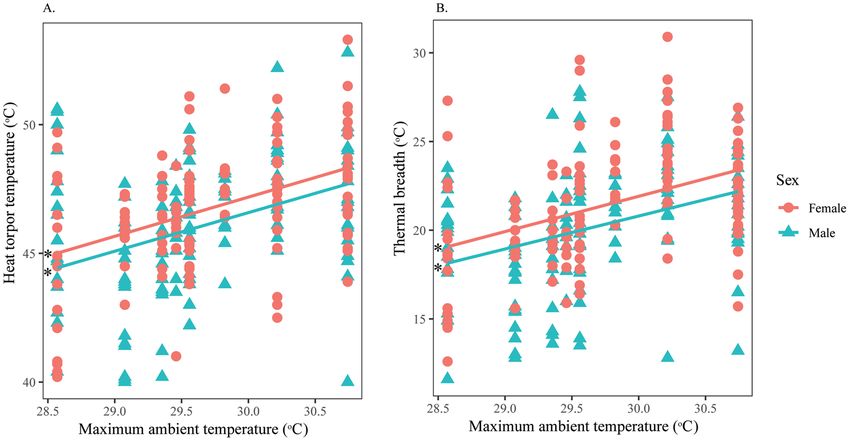
www.nature.com/scientificreports/ www.nature.com/scientificreports
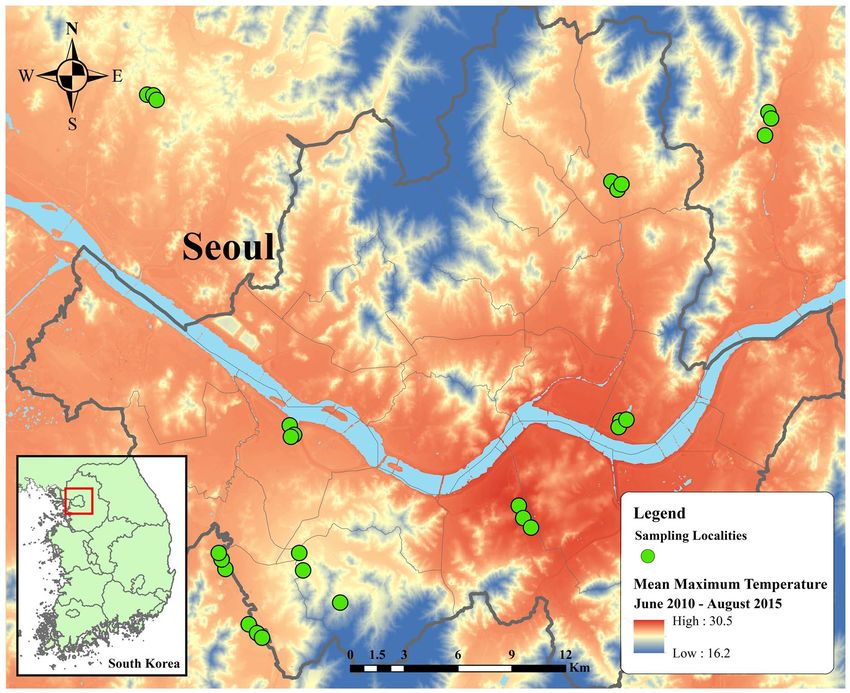
Figure 1. Distribution of sampling areas within and surrounding metropolitan Seoul. Thermal map of average
maximum temperature from June 1, 2010, to August 31, 2015, in metropolitan Seoul constructed by ArcMap
10.5. Temperature ranges from 16.2 to 30.5 °C, indicated by dark blue to red regions. Green circles designate
sampling localities. Inset map in the left bottom corner illustrates the regional location of metropolitan Seoul in
the Republic of Korea.
perform the expected behavior, it was allowed to gradually warm up at ambient temperature for one minute
before being reexamined. After that, the insect was placed under a heat lamp to obtain MVT. The Tb at which the
individual moved away from the heat source and started to seek shade was determined to be its MVT. The cicada
was continuously heated under the heat lamp until no movement was observed, at which point its Tb indicated
HTT. The procedure was not lethal, as individuals could recover to normal active conditions after several minutes.
We acknowledged that this assay may have induced stress to some extent in cicadas. However, such measurement
of thermal responses have been performed over several decades43, and further investigation is necessary to assess
tentative influences of this assay on the thermal performance of cicadas.
The evaluation of Tb in cicadas is commonly conducted inside the mesothorax43. Here, we chose to assess Tb
from both the mesothorax and the pronotum. Indeed, pronotom may represent an evaporative cooling site45.
Evaporative cooling is a key physiological thermoregulation mechanism in cicadas, as it provides a major cooling
effect by dissipating excess heat45–47 and facilitates the cicadas’ endurance of high ambient temperatures4. The
temperature of the pronotum therefore may signal a critical thermal threshold for the individual to regulate Tb
within its functionally active range and adopt necessary thermoregulation strategies to prevent excessive increase
in Tb.
All temperature measurements were performed using a digital thermometer with a k-type thermocouple
(Omega; model #: 450–AKT; Norwalk, Connecticut, USA) sensitive to ± 0.25 °C. The total live body mass of
each individual was determined using an Adventurer Pro Analytical (Ohaus; New York, USA) scale sensitive
to ± 0.0001 g. We also measured body length, mesothorax width, and mesothorax depth using Digital Calipers
(Insize Co., Ltd.; Georgia, USA) sensitive to ± 0.02 mm.
Statistical analysis. Comparative thermal responses of C. atratra and H. fuscata. A first constrained multi-
variate analysis, i.e., redundancy analysis48 (RDA), was performed to compare thermal responses of MFT, MVT,
HTT and TbRange between C. atrata and H. fuscata. Analyses were conducted separately for temperature meas-
urements from the pronotum and mesonotum. C. atrata and H. fuscata responded differently to heat experi-
ments. Therefore, we conducted hereafter analyses separately for each species.
Scientific Reports | (2020) 10:1343 | https://doi.org/10.1038/s41598-020-58276-0 3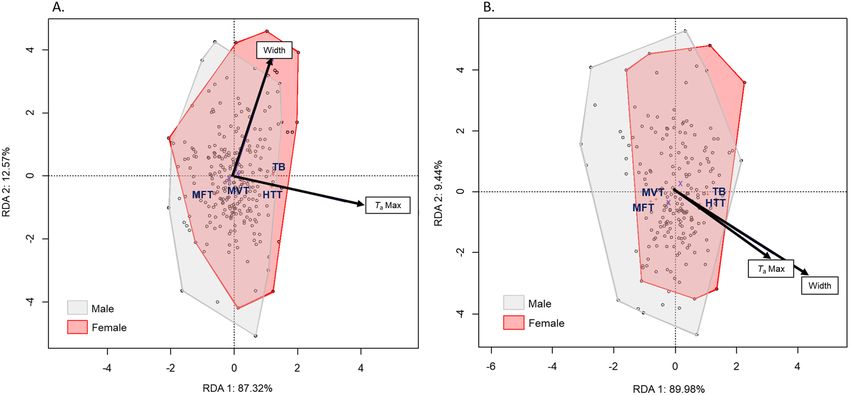
www.nature.com/scientificreports/                                                               www.nature.com/scientificreports

                                                Pronotum              Mesonotum
                                                % inertia   p-value   % inertia   p-value
                            Full model                      0.001                 0.001
                            Constrained         11.77                 13.17
                            Unconstrained       88.23                 86.83
                            Variables effects
                            TaMax                           0.001                 0.005
                            Sex                             0.252                 0.002
                            Species                         0.001                 0.001

                           Table 1. Results of the RDA for comparative thermal responses measured from the pronotum and mesonotum
                           of two cicada species. Percentage of inertia and p-values were calculated for each variable. The statistical
                           significance of the entire model for each variable (marginal tests) was evaluated using Monte-Carlo permutation
                           tests (n = 999).

                           Variation in morphological characters of each cicada species. First, we applied an RDA to evaluate the responses
                           of the morphological characteristics measured by total mass (mass), body length (length), mesothorax width
                           (width), and mesothorax depth (depth) to sex and TaMax. Second, intersexual morphological differences were
                           assessed by performing t-tests for normally distributed data of mass and Kruskal-Wallis tests for non-normally
                           distributed data of length, width and depth. Furthermore, we also conducted linear regressions to examine the
                           effect of temperature on each of the morphological characteristics, separating analysis for males and females. We
                           examined the assumption of homogeneity of variance of residuals of each linear regression model via a diagnostic
                           plot of predicted values versus standardized residuals.

                           Variation in thermal responses of each cicada species. A third RDA was used to assess the thermal responses
                           of MFT, MVT, HTT, and TbRange by sex, TaMax and width. We performed independent RDAs for temperature
                           measurement from the pronotum and mesonotum. Again, we compared intersexual differences in terms of ther-
                           mal responses, employing t-tests for normally distributed data (MVT, HTT and TB) and Kruskal-Wallis tests for
                           non-normally distributed data (MFT). Linear regressions tested how both male and female thermal responses,
                           measured from pronotum and mesonotum, were influenced by TaMax and width. Diagnostic plots of predicted
                           values versus standardized residuals were visualized to assess the assumption of homoscedasticity of residuals for
                           each linear regression model. RDA results showed no significant thermal responses of C. atrata in the measure-
                           ment from the pronotum or mesonotum, and it was exempted from follow-up intersexual variation tests.

                           Intersexual variation in thermal responses of H. fuscata. Finally, an RDA was performed to quantify intersex-
                           ual differences in thermal responses according to TaMax and width. The Vegan package49 on R Studio (Version
                           1.0.143) was used for all multivariate analyses, and the statistical significance of the entire model for each variable
                           (marginal test) was evaluated using Monte-Carlo permutation tests (n = 999). Linear regressions were performed
                           with SPSS 22 (IBM Corp.; New York, USA). Results are presented as the mean ± standard deviation.

                           Ethics declaration. Cicadas are common species in Republic of Korea. Neither C. atrata nor H. fuscata was
                           listed as protected or endangered species in the “List of wildlife species prohibited for collection” issued by the
                           Ministry of Environment, Republic of Korea and in the IUCN Red List. Therefore, no field permit was required
                           for this study.

                           Results
                           Comparative thermal responses of C. atratra and H. fuscata. Thermal responses measured
                           at the pronotum (n = 158) showed that C. atrata became fully coordinated at an MFT of 24.81 ± 1.72 °C,
                           reaching the thermoregulation level at an MVT of 37.58 ± 2.01 °C, and becoming heat torpid at an HTT of
                           46.92 ± 2.71 °C. Body temperatures measured inside the mesonotum (n = 114) indicated that MFT was achieved
                           at 23.88 ± 1.80 °C, MVT at 38.13 ± 1.99 °C, and HTT at 49.56 ± 1.87 °C.
                               H. fuscata thermal responses assessed from the pronotum (n = 258) showed that the species had an MFT
                           at 25.66 ± 2.06 °C, elevated its thermoregulation level to an MVT of 36.10 ± 1.46 °C, and became heat torpid
                           at an HTT of 46.41 ± 2.58 °C. The responses to heat determined at the mesonotum (n = 197) exhibited MFT at
                           24.80 ± 1.89 °C, MVT at 36.39 ± 1.70 °C, and HTT at 48.56 ± 2.09 °C.
                               In general, C. atrata tolerated heat better than H. fuscata in terms of MVT and HTT. The RDA models
                           explained 11.77% and 13.17% of the total variation in temperature measurement from the pronotum and the
                           mesonotum, respectively (Table 1). Both showed that thermal responses were significantly different between C.
                           atrata and H. fuscata. Indeed, for both the pronotum and mesonotum temperature measurements, the species
                           factor was the most significant (p = 0.001), representing the first axis for both ordination diagrams (Fig. 2A,B)
                           and accounting for 80.6% and 76.33% of the inertia, respectively. Among four thermal responses, only MFT was
                           greater for H. fuscata, whereas the others tended to be higher for C. atrata (Fig. 2A,B).

                           Variation in morphological characters of each cicada species.                  Morphological measurements of
                           158 C. atrata individuals produced a total mass of 2.90 ± 0.47 g, a body length of 41.63 ± 1.62 cm, a mesothorax

Scientific Reports |   (2020) 10:1343 | https://doi.org/10.1038/s41598-020-58276-0                                                              4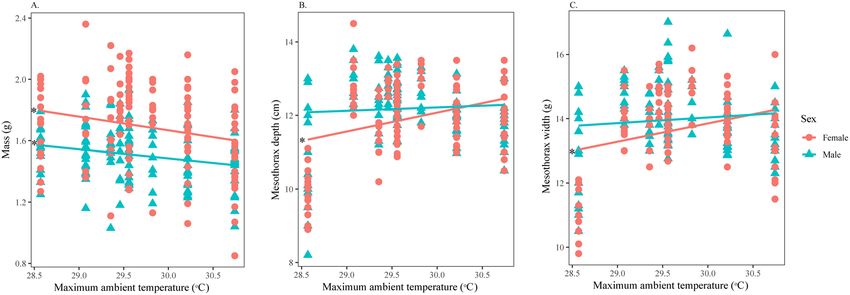
www.nature.com/scientificreports/                                                             www.nature.com/scientificreports

                           Figure 2. Ordination diagram of the two first axes of the RDA for comparative thermal responses for C.
                           atrata and H. fuscata for the (A) pronotom and (B) mesonotum. MFT: minimum flighte temperature; MVT:
                           maximum voluntary temperature; HTT: heat torpor temperature; TbRange: thermal breadth. This figure was
                           generated using Vegan package on R Studio version 1.0.143.

                                                C. atrata             H. fuscata
                                                % inertia   p-value   % inertia    p-value
                            Full model                      ns                     0.001
                            Constrained                               11.5
                            Unconstrained                             88.5
                            Variables effects
                            TaMax                           ns                     0.002
                            Sex                             ns                     0.001

                           Table 2. Results of the RDA conducted on morphological characteristics for C. atrata and H. fuscata.
                           Percentage of inertia and p-values were calculated for each variable. The statistical significance of the entire
                           model for each variable (marginal tests) was evaluated using Monte-Carlo permutation tests (n = 999). ns: not
                           significant.

                           depth of 14.61 ± 0.63 cm, and a mesothorax width of 16.59 ± 0.75 cm. The result of the RDA showed that the effect
                           of TaMax and sex did not significantly explain the morphological measurement matrix (Table 2).
                               H. fuscata (n = 258) was characterized by a total live mass of 1.60 ± 0.25 g, with a body length of
                           32.54 ± 1.80 cm, a mesothorax depth of 12.06 ± 1.05 cm, and a mesothorax width of 13.84 ± 1.24 cm. The RDA
                           model explained 11.5% of the recorded variation, in which sex was the principal factor (p = 0.001), repre-
                           sented along the first axis and accounting for 88.72% of the variance (Table 2, Fig. 3). TaMax was also significant
                           (p = 0.002) and was represented along the second axis, accounting for 11.28% of the variance. Females were sig-
                           nificantly heavier than males, but shorter in total body length (Supplementary Material 3). H. fuscata individuals
                           exhibited a decrease in mass (Fig. 4A) but an increase in mesothorax size relative to TaMax (Fig. 4B,C). Linear
                           regressions showed that TaMax influenced male and female morphological characteristics differently (Table 3);
                           TaMax was significant for only the mass of males but not for other characteristics; on the contrary, TaMax was
                           significant for almost all characteristics of females, except length.

                           Variation in thermal responses of each cicada species. Although C. atrata individuals exhibited some
                           changes in their thermal responses, the species responded similarly to heat regardless of habitat conditions. The
                           results of the RDA showed that both sex and TaMax had no significant effect on thermal responses obtained from
                           the pronotum (p > 0.05, Table 4). For the mesonotum, sex was the only significant factor explaining the thermal
                           responses (p = 0.029).
                              The RDA model showed that thermal responses from the pronotum were mostly influenced by TaMax
                           (p = 0.001), followed by sex (p = 0.011) and width (p = 0.011) (Table 4). The model explained 11.76% of the total
                           inertia, of which 87.32% was explained by axis 1 and 12.57% by axis 2 (Fig. 5A). Regarding the mesonotum, the
                           thermal responses were mostly significantly influenced by sex (p = 0.001) and width (p = 0.001), followed by
                           TaMax (p = 0.04) (Table 4, Fig. 5B). The thermal responses measured at the mesonotum were driven primarily by
                           width rather than other factors (Supplementary Material 4).

Scientific Reports |   (2020) 10:1343 | https://doi.org/10.1038/s41598-020-58276-0                                                            5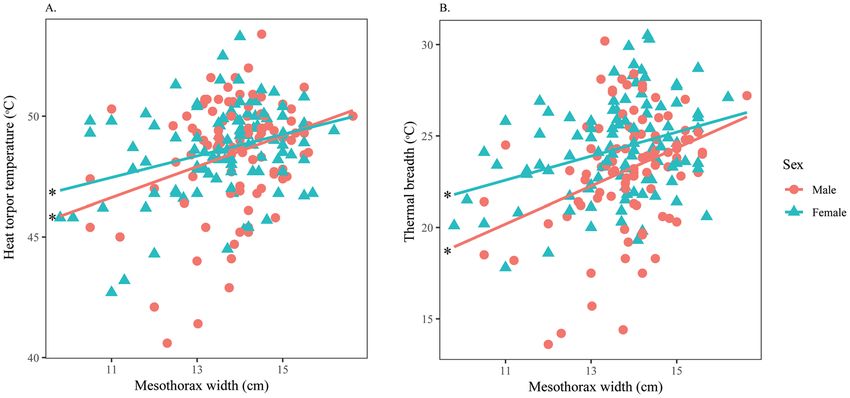
www.nature.com/scientificreports/                                                              www.nature.com/scientificreports

                           Figure 3. Ordination diagram of the two first axes of the RDA for morphologic characteristics of H. fuscata.
                           The position of the variables are represented with convex hull based on sex. The part of the inertia explained by
                           each axis is given. This figure was generated using Vegan package on R Studio version 1.0.143.

                           Intersexual variation in thermal responses of H. fuscata.                 For measurement from the pronotum,
                           males and females had similar MFT and MVT. However, females tolerated heat significantly better (Fig. 6A)
                           and had wider thermal ranges than males (Fig. 6B). Both sexes significantly increased their HTT and TbRange as
                           TaMax increased (Supplementary Material 5), but no relationships were found between TaMax with either MFT or
                           MVT (Table 5). Width displayed a significant negative effect on MFT of both sexes (Supplementary Material 6),
                           while this factor was significantly positively correlated with HTT and TbRange of both males and females (Fig. 7).

                           Discussion
                           In sum, our analyses suggest a local adaptation of thermal responses and thorax sizes in H. fuscata populations
                           distributed along a thermal gradient in metropolitan Seoul, but not for the other cicada species. Although the
                           results of our redundancy analysis showed high values of unconstrained variance (>85% in all of them), signif-
                           icant differences in thermal responses between two cicadas and within H. fuscata were determined. Specifically,
                           thermal responses of C. atrata measured by MFT, MVT, HTT and TbRange indicated a better tolerance to heat
                           stimuli than H. fuscata. Furthermore, no relationship was observed between the ambient temperature of the
                           habitat and either morphology or thermal physiology of C. atrata. On the contrary, H. fuscata from habitats with
                           higher ambient temperature had substantially enlarged thoraxes, endured heat better, and held wider fully active
                           thermal ranges.
                               Although ambient temperature was significant for the pronotum’s HTTs and TBs of both sexes (Table 5), it
                           was marginally significant for the mesonotum’s TB of males and HTT of females (Supplementary Material 3).
                           To justify the effect of ambient temperature on thermal responses of H. fuscata, we conducted the RDA and
                           linear regression again, using Mass instead of Width as a covariate (results not shown). RDA result shows that
                           TaMax was significant for thermal responses of H. fuscata regardless of pronotum or mesonotum temperature.
                           Furthermore, the result of linear regression analysis displays a consistent result between pronotum and mesono-
                           tum temperatures. We therefore conclude that overall H. fuscata increased their thermal tolerance in accordance
                           to the increase in ambient temperature.
                               The increase in heat tolerance of H. fuscata resembles other research on urban-adapted insects, which indi-
                           cates a close association between thermal tolerance and localized thermal clines29,30,33. Research on thermal
                           responses of cicadas across a wide geographic range provides evidence that cicadas are more tolerant of warmer
                           environments41–43. Cicadas of 38 species inhabiting Mediterranean habitats display an elevated HTT in accord-
                           ance with the local thermal characteristics, regardless of taxonomic position or the diversity of particular plant
                           species50. Our results further imply a localized thermal acclimatization of H. fuscata.
                               Here, we observed interspecific differences in thermal responses between C. atrata and H. fuscata, in which
                           the warmer the habitat, the greater thermal responses C. atrata exhibited compared to the other species. This
                           disparity can be explained by variation in species geographical origins: C. atrata originated in subtropical regions,
                           whereas H. fuscata originated in tundra regions35. Additionally, segregation in microhabitat niches may contrib-
                           ute to how each species utilizes its habitat for thermoregulation. C. atrata perches mainly on top of the canopy,
                           where it is exposed to solar radiation, whereas H. fuscata is found mainly on tree trunks in shaded environ-
                           ments51. As a result, adaptation to individual thermal regimes has led to variation in thermal responses between
                           these species, a pattern that is well-discerned in other cicadas inhabiting tropical habitats52.

Scientific Reports |   (2020) 10:1343 | https://doi.org/10.1038/s41598-020-58276-0                                                             6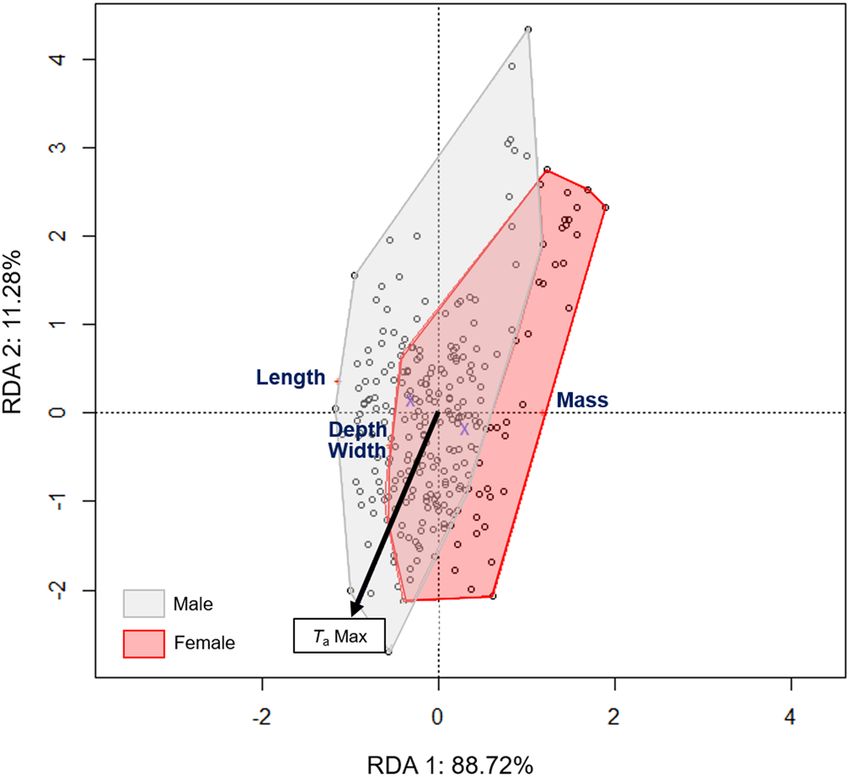
www.nature.com/scientificreports/                                                                                 www.nature.com/scientificreports

                           Figure 4. Variation in morphological characters of H. fuscata in response to TaMax divided by sex. Correlation
                           between (A) Mass and TaMax, (B) Depth and TaMax, and (C) Width and TaMax. Asterisks denote significant
                           linear regressions. This figure was generated using SPSS 22.

                            Dependent       Independent
                            variable        variable           B        SE     t           P
                            Male
                                            Intercept          3.34     0.72   4.58
www.nature.com/scientificreports/ www.nature.com/scientificreports
Figure 5. Ordination diagram of the two first axes of the RDA performed on MFT, MVT, HTT and TbRange
measured at the (A) pronotum and (B) mesonotum separately for H. fuscata. The positions of the variables are
represented with convex hulls based on sex. The part of the inertia explained by each axis is given. This figure
was generated using Vegan package on R Studio version 1.0.143.
Figure 6. Intersexual variation in thermal responses of H. fuscata obtained from the pronotum according
to TaMax. Correlation between (A) Heat torpor temperature and TaMax, (B) Thermal breadth and TaMax.
Asterisks denote significant linear regressions. This figure was generated using SPSS 22.
In line with other studies on thermal responses of cicadas, we found HTT depends strongly on the maximum
environmental thermal regime43,44,53. This positive relationship was observed in H. fuscata, but not in C. atrata,
regardless of habitat conditions. Such difference may be partially due to the origins of the two species. C. atrata is,
therefore, more prone to experiencing higher thermal regimes and is adapted to high thermal conditions in met-
ropolitan Seoul, thus exhibiting no difference in thermal tolerance across heterogeneous ambient temperatures.
Environmental constraints applied to populations of the acorn ant, Temnothorax curvispinosus, are greater in
lower latitudes, causing a reduction in evolutionary thermal responses relative to populations at higher latitudes29.
In contrast to C. atrata, distributions of H. fuscata at higher latitudes expose this species to colder environ-
ments, and the warmer conditions of metropolitan Seoul may induce a thermal acclimatization to warmer tem-
peratures. Not only does urban warming seem to select for thermophilic species, but it also extends thermal
tolerance ranges by elevating heat tolerance30. Here, as a function of ambient temperature, the thermal range of
H. fuscata was extended toward warmer habitats. Better heat tolerance and wider thermal active ranges promote
colonization of microhabitat niches generated by urbanization.
Besides thermal responses, our study suggest contrast relationships between thermal conditions and morpho-
logical characters of H. fuscata females, while thorax sizes increased as ambient temperature increased, total mass
Scientific Reports | (2020) 10:1343 | https://doi.org/10.1038/s41598-020-58276-0 8www.nature.com/scientificreports/ www.nature.com/scientificreports
Dependent Independent
variable variable B SE t P
Male
Intercept 40.45 8.25 4.90www.nature.com/scientificreports/ www.nature.com/scientificreports
study. Accordingly, only female flies developed at higher temperature were heavier in terms of dry mass whereas
male flies were insensitive to their developmental temperature. However, the underlying mechanism is unclear.
In our study, we observe such an inverse effect of temperature on thorax size and mass of females H. fuscata.
The evolutionary explanation for this phenomenon remains elusive, thus we aim to elucidate it in further study.
Besides, more investigations are needed to better understand this phenomenon and to clarify if these first results
are linked to an exceptional population of small individuals in the coolest areas or if this could be a general trend.
Insect metabolic activity is accelerated under exposure to higher temperatures, which triggers an increase in
body size56. Furthermore, warming climates have been proposed as causes of escalating growth rates of cicada
nymphs underground, resulting in larger body sizes within a fixed development period22. Females of the scale
insect Melanasimpis tenebricosa inhabiting warmer tree canopies exhibit larger body size than those living in
cooler tree canopies57. An increase of 2.5 °C in rearing temperature promotes the development of larger females
in the southern green stink bug, Nezara viridula58. There is also evidence that larger body size may be driven by
local adaptation to warmer habitats. In periodical cicadas, for instance, the more southerly diverged M. tredecim
experiences higher temperatures as adults possess larger bodies22. Larger bodies provide multiple ecological and
evolutionary advantages by contributing positively to survival, fecundity, and mating success59. As a result, a
larger size could result from selection for greater fecundity in female cicadas23.
The relationship between body size and thermal tolerance has been explored in various terrestrial insects.
Although there are cases where superior heat tolerance is found in smaller60,61 or intermediate-sized insects62,
larger species tend to tolerate higher temperatures better than smaller species do57,58,62,63. In our study, larger H.
fuscata individuals had higher heat tolerance. Consequently, better thermal tolerance capacity is suggested to
provide higher fitness to female cicadas3. Although body size of male H. fuscata was not correlated with ambient
temperature, it was found to be associated with acoustic properties of cicada songs64–66, which act as premating
signals to attract conspecific mates. Furthermore, songs of warmer males are higher in intensity and are able to
travel further in the air67, increasing the transmission of their mating signals to prospective mates.
Conclusion
Our thermal tolerance experiments indicate a local adaptation of thermal responses and thorax sizes along a
thermal gradient of H. fuscata in metropolitan Seoul. Whether such variation in heat tolerance is caused by phe-
notypic plasticity or evolutionary adaptation to environmental conditions is unclear. However, acclimatization to
anthropogenic perturbation as a consequence of urbanization may be partially responsible. This is the first study
to notice variation in thermal tolerance of cicadas at the local urban scale. Our research highlights the importance
of taking localized thermal regimes into consideration when examining species-specific responses to escalating
urban warming caused by urbanization.
Data availability
The datasets analysed during the current study are available in the Mendeley Data repository, DOI: http://dx.doi.
org/10.17632/4z4n7p5gxt.2#file-ae6d6c15-bf0a-4fde-8f32-4f62ebf8f96c.
Received: 24 July 2019; Accepted: 12 November 2019;
Published: xx xx xxxx
References
1. Fonseca, P. & Revez, M. A. Temperature dependence of cicada songs (Homoptera, Cicadoidea). Journal of comparative Physiology A
187, 971–976 (2002).
2. Moriyama, M. & Numata, H. Diapause and prolonged development in the embryo and their ecological significance in two cicadas,
Cryptotympana facialis and Graptopsaltria nigrofuscata. Journal of insect physiology 54, 1487–1494 (2008).
3. Toolson, E. C. Comparative thermal physiological ecology of syntopic populations of Cacama valvata and Tibicen bifidus
(Homoptera: Cicadidae): modeling fitness consequences of temperature variation. American Zoologist 38, 568–582 (1998).
4. Sanborn, A. Cicada thermoregulation (Hemiptera, Cicadoidea). (na, 2002).
5. Sanborn, A. F. & Maté, S. Thermoregulation and the effect of body temperature on call temporal parameters in the cicada
Diceroprocta olympusa (Homoptera: Cicadidae). Comparative Biochemistry and Physiology Part A: Molecular & Integrative
Physiology 125, 141–148 (2000).
6. Sato, Y. & Sato, S. Spring temperature predicts the long-term molting phenology of two cicadas, Cryptotympana facialis and
Graptopsaltria nigrofuscata (Hemiptera: Cicadidae). Annals of the Entomological Society of America 108, 494–500, https://doi.
org/10.1093/aesa/sav036 (2015).
7. Battisti, A. et al. Expansion of geographic range in the pine processionary moth caused by increased winter temperatures. Ecological
applications 15, 2084–2096 (2005).
8. Dale, A. G. & Frank, S. D. The effects of urban warming on herbivore abundance and street tree condition. PloS one 9, e102996
(2014).
9. Laws, A. N. & Belovsky, G. E. How will species respond to climate change? Examining the effects of temperature and population
density on an herbivorous insect. Environmental Entomology 39, 312–319 (2010).
10. Rueda, L., Patel, K., Axtell, R. & Stinner, R. Temperature-dependent development and survival rates of Culex quinquefasciatus and
Aedes aegypti (Diptera: Culicidae). Journal of medical entomology 27, 892–898 (1990).
11. Heath, J. E. Temperature responses of the periodical “17-year” cicada, Magicicada cassini (Homoptera, Cicadidae). American
Midland Naturalist, 64–76 (1967).
12. Oke, T. R. City size and the urban heat island. Atmospheric Environment (1967) 7, 769–779 (1973).
13. Nowak, D. J. & Dwyer, J. F. In Handbook of urban and community forestry in the Northeast 11–25 (Springer, 2000).
14. Oke, T. In Wind climate in cities (eds. Cermark, J. E., Davenport, A. G., Plate, E. J. & Viegas, D. X.) 81–107 (Springer, 1995).
15. Hart, M. A. & Sailor, D. J. Quantifying the influence of land-use and surface characteristics on spatial variability in the urban heat
island. Theoretical and applied climatology 95, 397–406 (2009).
16. Santamouris, M. Heat island research in Europe: the state of the art. Advances in building energy research 1, 123–150 (2007).
17. Ryu, Y.-H. & Baik, J.-J. Quantitative analysis of factors contributing to urban heat island intensity. Journal of Applied Meteorology and
Climatology 51, 842–854 (2012).
18. Agrawal, M. In Urban Ecology 603–607 (Springer, 1998).
Scientific Reports | (2020) 10:1343 | https://doi.org/10.1038/s41598-020-58276-0 10www.nature.com/scientificreports/ www.nature.com/scientificreports
19. Stringer, L. D., Stephens, A. E., Suckling, D. M. & Charles, J. G. Ant dominance in urban areas. Urban Ecosystems 12, 503–514 (2009).
20. Willigalla, C. & Fartmann, T. Patterns in the diversity of dragonflies (Odonata) in cities across Central Europe. European Journal of
Entomology 109, 235–245 (2012).
21. White, J. A. & Lloyd, M. Growth rates of 17 and 13-year periodical cicadas. American Midland Naturalist, 127–143 (1975).
22. Koyama, T. et al. Geographic body size variation in the periodical cicadas Magicicada: implications for life cycle divergence and local
adaptation. Journal of evolutionary biology 28, 1270–1277 (2015).
23. Karban, R. Evolution of prolonged development: a life table analysis for periodical cicadas. The American Naturalist 150, 446–461
(1997).
24. Karban, R. Sexual selection, body size and sex-related mortality in the cicada Magicicada cassini. American Midland Naturalist,
324–330 (1983).
25. Smith, D. M., Kelly, J. F. & Finch, D. M. Cicada emergence in southwestern riparian forest: influences of wildfire and vegetation
composition. Ecological Applications 16, 1608–1618 (2006).
26. Saisho, Y. Mathematical observations on the relation between eclosion periods and the copulation rate of cicadas. Mathematical
biosciences and engineering: MBE 7, 443–453 (2010).
27. Hamblin, A. L., Youngsteadt, E., López-Uribe, M. M. & Frank, S. D. Physiological thermal limits predict differential responses of
bees to urban heat-island effects. Biology letters 13, 20170125 (2017).
28. Schowalter, T. D. Insect ecology: an ecosystem approach. (Academic Press, 2016).
29. Diamond, S. E., Chick, L. D., Perez, A., Strickler, S. A. & Martin, R. A. Evolution of thermal tolerance and its fitness consequences:
parallel and non-parallel responses to urban heat islands across three cities. Proc. R. Soc. B 285, 20180036 (2018).
30. Piano, E. et al. Urbanization drives community shifts towards thermophilic and dispersive species at local and landscape scales.
Global change biology (2017).
31. Diamond, S. E. et al. A physiological trait-based approach to predicting the responses of species to experimental climate warming.
Ecology 93, 2305–2312 (2012).
32. Stuble, K. L. et al. Foraging by forest ants under experimental climatic warming: a test at two sites. Ecology and evolution 3, 482–491
(2013).
33. Angilletta, M. J. et al. Urban physiology: city ants possess high heat tolerance. PLoS One 2, e258 (2007).
34. Diamond, S. E., Chick, L., Perez, A., Strickler, S. A. & Martin, R. A. Rapid evolution of ant thermal tolerance across an urban-rural
temperature cline. Biological Journal of the Linnean Society 121, 248–257 (2017).
35. Lee, Y. J. Revised synonymic list of Cicadidae (Insecta: Hemiptera) from the Korean Peninsula, with the description of a new species
and some taxonomic remarks. Proceedings of the Biological Society of Washington 121, 445–467 (2008).
36. Kim, T. E., Oh, S.-Y., Chang, E. & Jang, Y. Host availability hypothesis: complex interactions with abiotic factors and predators may
best explain population densities of cicada species. Animal Cells and Systems 18, 143–153 (2014).
37. Nguyen, H. Q., Andersen, D. K., Kim, Y. & Jang, Y. Urban heat island effect on cicada densities in metropolitan Seoul. PeerJ 6, e4238
(2018).
38. Lobser, S. & Cohen, W. MODIS tasselled cap: land cover characteristics expressed through transformed MODIS data. International
Journal of Remote Sensing 28, 5079–5101 (2007).
39. Hijmans, R. J., Cameron, S. E., Parra, J. L., Jones, P. G. & Jarvis, A. Very high resolution interpolated climate surfaces for global land
areas. International Journal of Climatology: A Journal of the Royal Meteorological Society 25, 1965–1978 (2005).
40. Tzavali, A., Paravantis, J. P., Mihalakakou, G., Fotiadi, A. & Stigka, E. Urban heat island intensity: a literature review. Fresenius
Environmental Bulletin 24, 4535–4554 (2015).
41. Sanborn, A. F. & Phillips, P. K. Thermal responses of the Diceroprocta cinctifera species group (Homoptera: Cicadidae). The
Southwestern Naturalist, 136–139 (1996).
42. Sanborn, A. F. & Heath, J. Thermal responses of periodical cicadas: within and between brood parity (Hemiptera: Cicadidae:
Magicicada spp.). Open Access Insect Physiol 1, 13–20 (2009).
43. Sanborn, A. F., Heath, J. E., Heath, M. S. & Phillips, P. K. Thermal adaptation in North American cicadas (Hemiptera: Cicadidae).
Journal of thermal biology 69, v–xviii (2017).
44. Sanborn, A. F., Phillips, P. K., Heath, J. E. & Heath, M. S. Influence of altitude, habitat and microhabitat on thermal adaptation of
cicadas from Southwest Texas (Hemiptera: Cicadidae). Journal of Thermal Biology 36, 386–389 (2011).
45. Sanborn, A. F., Heath, J. E. & Heath, M. S. Thermoregulation and evaporative cooling in the cicada Okanagodes gracilis (Homoptera:
Cicadidae). Comparative biochemistry and physiology. Comparative physiology 102, 751–757 (1992).
46. Harrison, J. F., Woods, H. A. & Roberts, S. P. Ecological and environmental physiology of insects. Vol. 3 (Oxford University Press,
2012).
47. Toolson, E. C. Water profligacy as an adaptation to hot deserts: water loss rates and evaporative cooling in the Sonoran Desert
cicada, Diceroprocta apache (Homoptera: Cicadidae). Physiological Zoology 60, 379–385 (1987).
48. Rao, C. R. The use and interpretation of principal component analysis in applied research. Sankhyā: The Indian Journal of Statistics,
Series A, 329–358 (1964).
49. Oksanen, J. Multivariate analysis of ecological communities in R: vegan tutorial. R Doc 43, 11–12 (2015).
50. Sanborn, A. F., Phillips, P. K., Heath, J. E. & Heath, M. S. Comparative thermal adaptation in cicadas (Hemiptera: Cicadidae)
inhabiting Mediterranean ecosystems. Journal of Thermal Biology 36, 150–155 (2011).
51. Lee, Y. A list of Cicadidae (Homoptera) in Korea. Cicada 15, 1–16 (1999).
52. Sanborn, A. F., Heath, J. E., Phillips, P. K., Heath, M. S. & Noriega, F. G. Thermal adaptation and diversity in tropical ecosystems:
evidence from cicadas (Hemiptera, Cicadidae). PLoS One 6, e29368 (2011).
53. Sanborn, A. Comparative thermoregulation of sympatric endothermic and ectothermic cicadas (Homoptera: Cicadidae: Tibicen
winnemanna and Tibicen chloromerus). Journal of Comparative Physiology A 186, 551–556 (2000).
54. Van Voorhies, W. A. On the adaptive nature of Bergmann size clines: a reply to Mousseau, Partridge and Coyne. Evolution 51,
635–640 (1997).
55. Crill, W. D., Huey, R. B. & Gilchrist, G. W. Within-and between‐generation effects of temperature on the morphology and physiology
of Drosophila melanogaster. Evolution 50, 1205–1218 (1996).
56. Ray, C. The application of Bergmann’s and Allen’s rules to the poikilotherms. Journal of morphology 106, 85–108 (1960).
57. Dale, A. G. & Frank, S. D. Warming and drought combine to increase pest insect fitness on urban trees. PloS one 12, e0173844
(2017).
58. Musolin, D. L., Tougou, D. & Fujisaki, K. Too hot to handle? Phenological and life-history responses to simulated climate change of
the southern green stink bug Nezara viridula (Heteroptera: Pentatomidae). Global Change Biology 16, 73–87 (2010).
59. Kingsolver, J. G. & Huey, R. B. Size, temperature, and fitness: three rules. Evolutionary Ecology Research 10, 251–268 (2008).
60. Brans, K. I. et al. The heat is on: Genetic adaptation to urbanization mediated by thermal tolerance and body size. Global change
biology 23, 5218–5227 (2017).
61. Geerts, A. et al. Rapid evolution of thermal tolerance in the water flea Daphnia. Nature Climate Change 5, 665 (2015).
62. Oberg, E., Del Toro, I. & Pelini, S. Characterization of the thermal tolerances of forest ants of New England. Insectes sociaux 59,
167–174 (2012).
63. Baudier, K. M., Mudd, A. E., Erickson, S. C. & O’donnell, S. Microhabitat and body size effects on heat tolerance: implications for
responses to climate change (army ants: Formicidae, Ecitoninae). Journal of Animal Ecology 84, 1322–1330 (2015).
Scientific Reports | (2020) 10:1343 | https://doi.org/10.1038/s41598-020-58276-0 11www.nature.com/scientificreports/ www.nature.com/scientificreports
64. Bennet-Clark, H. & Young, D. The scaling of song frequency in cicadas. Journal of Experimental Biology 191, 291–294 (1994).
65. Sueur, J. & Aubin, T. Specificity of cicada calling songs in the genus Tibicina (Hemiptera: Cicadidae). Systematic Entomology 28,
481–492 (2003).
66. Shieh, B.-S., Liang, S.-H., Liao, C.-Y. & Chiu, Y.-W. Song frequency correlates with latitude and individual body size in the cicada
Mogannia formosana Matsumura (Hemiptera: Cicadidae). acta ethologica 20, 147–155 (2017).
67. Sanborn, A. F. Body temperature and the acoustic behavior of the cicada Tibicen winnemanna (Homoptera: Cicadidae). Journal of
insect behavior 10, 257–264 (1997).
Acknowledgements
We thank Jeong Hyunsuu for her assistance in sample collection and the experiments, and Desiree Anderson
for the heat map construction. This work was supported by the National Research Foundation of Korea (Grant
Number: 2015R1A4A1041997). H.S. was funded by the Korea Research Fellowship Program through the
National Research Foundation of Korea (NRF) funded by the Ministry of Science and ICT (KRF project grant
number: 2016H1D3A1938095).
Author contributions
H.Q.N. designed the study; H.Q.N., Y.B., S.J., S.C., I.Y.K. and J.H. collected samples and conducted experiments;
H.Q.N. and H.S. performed statistical analyses and drafted the initial manuscript; H.Q.N., H.S. and Y.J. critically
reviewed and revised the manuscript. All authors have seen and approved the final version of this manuscript.
Competing interests
The authors declare no competing interests.
Additional information
Supplementary information is available for this paper at https://doi.org/10.1038/s41598-020-58276-0.
Correspondence and requests for materials should be addressed to Y.J.
Reprints and permissions information is available at www.nature.com/reprints.
Publisher’s note Springer Nature remains neutral with regard to jurisdictional claims in published maps and
institutional affiliations.
Open Access This article is licensed under a Creative Commons Attribution 4.0 International
License, which permits use, sharing, adaptation, distribution and reproduction in any medium or
format, as long as you give appropriate credit to the original author(s) and the source, provide a link to the Cre-
ative Commons license, and indicate if changes were made. The images or other third party material in this
article are included in the article’s Creative Commons license, unless indicated otherwise in a credit line to the
material. If material is not included in the article’s Creative Commons license and your intended use is not per-
mitted by statutory regulation or exceeds the permitted use, you will need to obtain permission directly from the
copyright holder. To view a copy of this license, visit http://creativecommons.org/licenses/by/4.0/.
© The Author(s) 2020
Scientific Reports | (2020) 10:1343 | https://doi.org/10.1038/s41598-020-58276-0 12You can also read