Newly Hatched Stage I American Lobster (Homarus americanus) Survival Following Exposure to Physically and Chemically Dispersed Crude Oil ...
←
→
Page content transcription
If your browser does not render page correctly, please read the page content below
Newly Hatched Stage I American Lobster (Homarus
americanus) Survival Following Exposure to
Physically and Chemically Dispersed Crude Oil
Benjamin de Jourdan ( Benjamin.deJourdan@huntsmanmarine.ca )
Huntsman Marine Science Centre https://orcid.org/0000-0002-5551-7037
Tahereh Boloori
Huntsman Marine Science Centre
Les Burridge
Huntsman Marine Science Centre
Research Article
Keywords: American lobster, species sensitivity distribution, total petroleum hydrocarbons, bioassay
DOI: https://doi.org/10.21203/rs.3.rs-781438/v1
License: This work is licensed under a Creative Commons Attribution 4.0 International License.
Read Full License
Page 1/24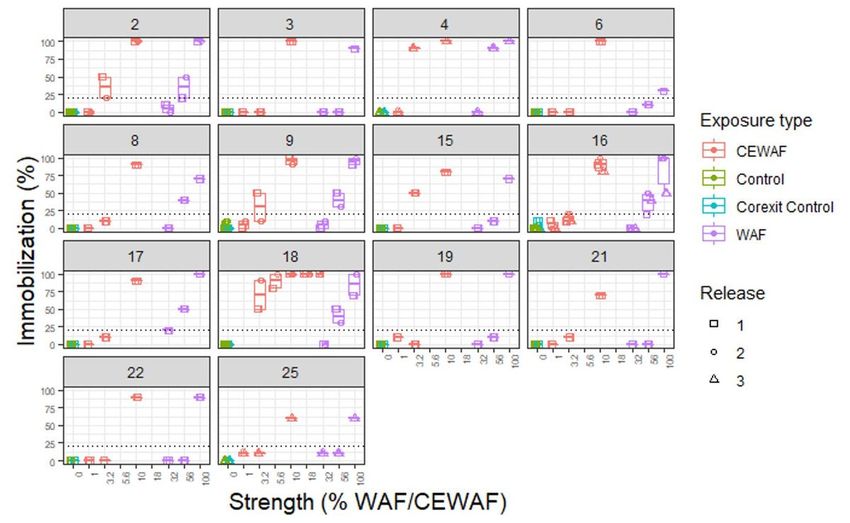
Abstract
Standard model species are commonly used in toxicity tests due to their biological and technical
advantages but studying native species increases the specificity and relevance of results generated for
the potential risk assessment to an ecosystem. Accounting for intraspecies variability and other factors,
such as chemical and physical characterization of test medium, is necessary to develop a reproducible
bioassay for toxicity testing with native species. In this study, larval stage I American lobster (Homarus
americanus) was selected as the test species, which is native to Atlantic Canada. Toxicity tests were first
conducted exposing lobster larvae to a reference toxicant of copper sulfate (CuSO4) and then to
physically and chemically dispersed oil. The effect on larval survival was estimated by calculating the
median effect concentration (EC50) as 2.54-9.73 mg TPH/L when all trials are considered together. The
HC5 or PNEC value was 2.52 mg TPH/L and therefore a narrow difference from the EC50 value. The inter-
trial variability (coefficient of variability = 17%) was lower than the US Environmental Protection Agency
standard test species of mysid shrimp (Americamysis bahia) and inland silversides (Menidia bervillina).
Our results indicate that the described larval lobster bioassay is reliable to produce repeatable results for
this commercially important and native species of Atlantic Canada.

Introduction
Species sensitivity in response to a stressor may be variable due to experimental and natural parameters
that need to be considered when investigating the impact of hazardous compounds to aquatic species.
This data variability from laboratory-based toxicity tests introduces uncertainty when extrapolating for
environmental risk assessment purposes. Thus, it is crucial to properly characterize the experimental and
natural variabilities that may influence toxicity test results (Simmons et al. 2015). Mayer and Ellersieck
(1986) demonstrated that physical conditions of the test environment, such as pH and temperature, and
chemical properties of the test compound, such as solubility, can significantly influence toxicity test
results. Biological variability proves more challenging to address as there are multiple contributing
sources, including seasonal and temporal variation, genetic variation amongst individuals, and choice
and life stage of test species (Hrovat et al. 2009; Simmons et al. 2015).

A common approach to minimize the impact of biological variability in measured sensitivity of a species
is to rely on laboratory cultures of standard test species, where a reduction, or exclusion, of genetic
diversity serves to reduce experimental variability. The standard model species (e.g., Daphnia magna,
Oncorhynchus mykiss, Danio rerio, Americamysis bahia, Menidia beryllina) generally meet certain
technical criteria, such as easy and inexpensive maintenance in the laboratory, genetic tractability, and
availability of a broad spectrum of experimental and methodological tools (Segner and Baumann 2015).
These species also meet some biological criteria, such as fast growth, high reproductive potential,
sensitivity to pollutants, abundance, replenishment ability, and/or captive rearing capabilities (Hughes et
al. 2005). These practical and regulatory testing requirements of tests species has focused more research
on testing a limited number of species to provide data from which comparison of relative toxicity of
chemicals can be made. Extrapolations are also often made to predict the toxicological and ecological
                                                  Page 2/24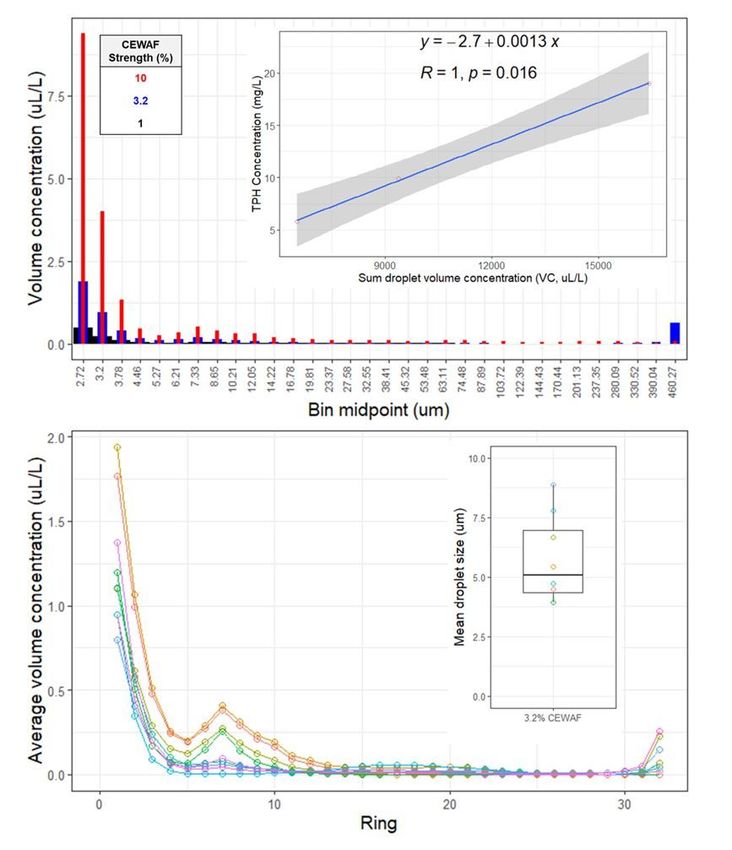
responses of other related species in the ecosystem. These extrapolations are typically based on
descriptive or statistical relationships, such as uncertainty, safety, or assessment factors or interspecies
correlation estimates (Bejarano & Barron 2014). The use of indigenous or native species, rather than a
limited number of standard species, will increase the specificity and relevance of the data generated.
However, there are often inherent problems working with these species, such as limited availability, lack of
requisite information necessary for their acclimation and maintenance under laboratory conditions, and
insufficient background information on their sensitivity and the reproducibility in toxicity testing (Echols
et al. 2015). Regardless, as part of a Natural Resource Damage Assessment (NRDA) it is necessary to try
and determine the effects of exposure on local, native species (Echols et al 2015). This may be achieved
by an aquatic toxicity program that uses field collected and non-standard test organisms of local
relevance and importance. However, it is necessary to validate that the results gained from bioassays are
precise and reproducible for these species to be successful in a toxicity program. A possible significant
factor contributing to the reproducibility may be the intraspecific variation that could contribute to either
over- or underestimating toxicity. Understanding the intraspecies variability and test precision of a
proposed bioassay with a native species will allow the data to be properly interpreted and used for risk
and damage assessments.

American lobster (Homarus americanus) is not a standard test species, however due to its economic and
ecological importance in eastern North America it is prudent to try and understand its risk from exposure
to environmental contaminants, such as those associated with an oil spill. The toxicological responses of
American lobster exposed to petroleum hydrocarbons are less well understood compared to other
crustaceans, such as the mysid shrimp (Americamysis bahia) as the generally accepted standard marine
test organism. The sensitivity of pelagic lobster larvae (i.e., stages I-III) to crude oil has been previously
demonstrated in laboratory studies (Wells and Sprague 1976) and as a result of accidental spills in the
field (Reddy and Quinn 2001). The 1996 grounding of the North Cape barge off the southwestern coast of
Rhode Island (USA) resulted in an estimated 2700 metric tons of fuel oil entering into the shallow near
shore waters, killing approximately 9 million lobsters (French-McCay 2003). The first larval stages (I–III)
of the American lobster are truly pelagic and considered to be more sensitive to contaminants and other
stressors than the later benthic and adult stages (Burridge and Haya 1997). These pelagic stages also
represent the greatest potential for exposure to hydrocarbons associated with an oil spill and spill
response measures (e.g., application of chemical dispersants), which tend to be more concentrated in
surface waters. Variability in response may be a result of genetic variability, different sensitivity of
individuals to natural environmental parameters, and the physiological status (i.e., effect of size and age
of the individuals) on their sensitivity to perturbation (Devin et al. 2014). Assessing the inter-individual
sensitivity variability of American lobster larvae is crucial for understanding its utility as a model test
organism and understanding the risks to the population. Having more complete knowledge about the
sensitivity of lobster larvae to petroleum hydrocarbons will also allow for a comparison with standard
test species’ to better understand the relative sensitivity of this non-standard, commercially important
species.

                                                    Page 3/24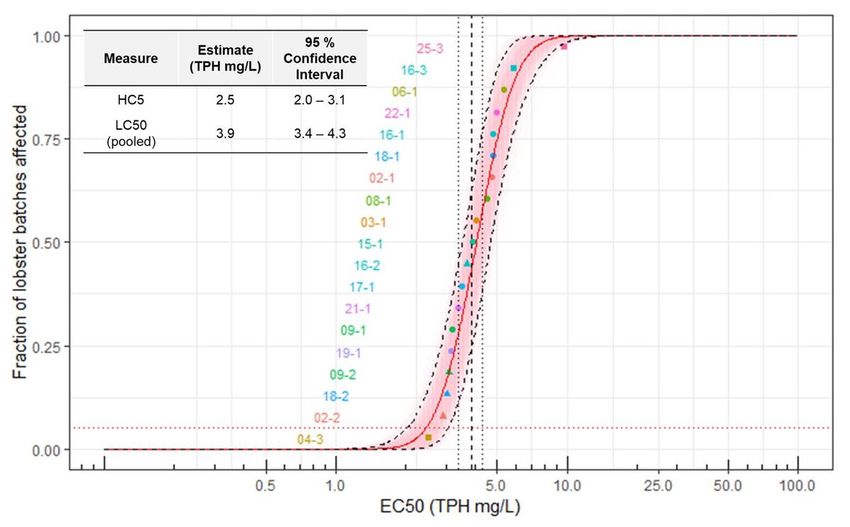
In the present study, we investigated the utility of American lobster larvae as a native test species in
aquatic toxicology studies. Following method development and reference toxicant testing, the bioassay
was used to assess the toxicity of petroleum hydrocarbons and the variability in response amongst
different batches of larvae from the same lobster and between different lobsters. A series of 19 acute
toxicity trials were conducted to accomplish this with less than 24-hr old stage I larvae from 14 different
lobsters. The sensitivity of the lobster larvae to hydrocarbons and its application as a model test
organism for evaluating the impacts of contaminants is discussed within the context of lobster
population implications and comparison to standard test species.
Methods
Test Organism: American lobster (Homarus americanus)
This study was undertaken using the first planktonic life stage (i.e., stage I) of the American lobster
(Homarus americanus) (Factor 1995). Adult commercial size (0.5 - 2.0 kg) ovigerous (egg carrying or
‘berried’) females were obtained from local fishers following acquisition of a special permit from
Fisheries and Oceans Canada and captured in the Bay of Fundy Lobster Fishing Area 36. The collected
berried female lobsters were transferred to the Huntsman Marine Science Center (St. Andrews, NB) where
they were held under controlled environmental conditions to promote egg mass development. Berried
female lobsters were transferred to an individual holding tank that received seawater of 18ºC ± 2ºC when
visual inspection of embryo development indicated that larval release was imminent. Larval lobsters
released from each overnight hatch (termed a batch) were separately collected and held for single batch
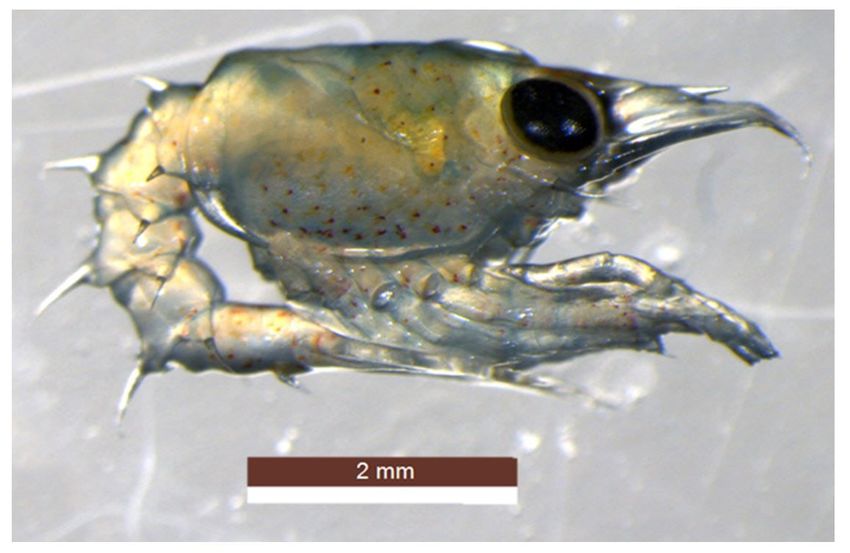
toxicity tests. Twenty lobster larvae were collected from each batch then imaged as reference organisms
using a Leica Wild M420 microscope and Leica MD190 camera at 12.5x magnification. Carapace length
(length from the rear of the orbital socket to the rear edge of the carapace) of reference lobster larvae was
measured using the LAS software version 4.8. Weight and carapace length of berried female lobsters
were also recorded to examine the role of maternal, morphological traits in explaining variability in
response.
Reference Toxicant Testing and Exposure Methodology
For American lobster, a classic breeding colony is not maintained as contributing adults are collected
annually from new wild stock. The availability of the larval lobster is seasonally limited (later summer
early fall), and as such there is only a short window of opportunity for toxicity testing, and a year-round
reference toxicant testing program is not feasible. Despite this limitation, the same reference toxicity
testing principles were applied to the lobster larvae during their seasonal availability. Copper sulfate was
selected as the reference toxicant given its desirable traits (e.g., established toxicity database, readily
available, water soluble, stable, easily analyzed) and efficacy in providing a consistent and measurable
effect in larval lobsters. The bioassay methodology was modified from previous internal studies
performed at the Huntsman. Briefly, larval lobsters were collected from a single 24-hr release from a
Page 4/24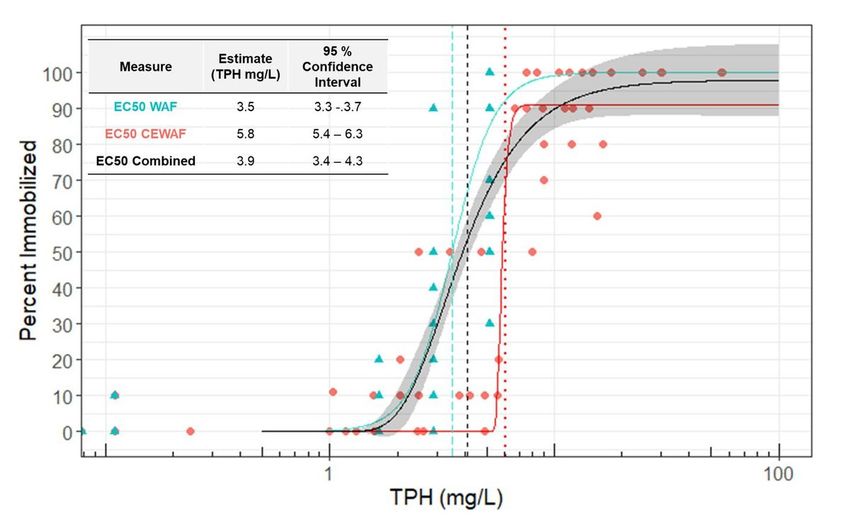
single female lobster and transferred into an environmental chamber (temperature maintained at 15ºC ±
2ºC and a photoperiod of 16h light and 8h dark). The transfer bucket was vigorously aerated to minimize
cannibalism within the population. From the transfer bucket, a subsample of larvae was collected in a
600-mL beaker and placed on a light table (A4 LED Light Box, FOME). An individual larva that was
actively swimming in the water column was retrieved from the beaker using a transfer pipette that was
modified to have a large, smooth opening and dispensed onto the corner of a folded KimWipe to remove
excess water then visually confirmed to be stage I larvae as characterized by the absence of pleopods
(Figure 1).

The larva was gently transferred into a 25-mL scintillation vial filled with 20 mL of test media (allowing
20% headspace for surface oxygen exchange) using a metal scoopula and observed for 30 seconds to
ensure larval viability and health before capping the vial (screwed tight, then loosened by a ¼ turn). The
larvae were exposed with 1 individual per experimental unit to prevent cannibalism, with 10 replicate units
per concentration. The larvae were observed during and after the exposure for 30 seconds and scored
using the numeric categories described in Table 1.

Larvae were considered immobilized if they had a score of 2 or greater. Effect concentrations were
calculated based on immobilization (EC50) and lethality (LC50). Validity criteria for the toxicity tests
included standard water quality based measures (i.e., greater than 60% dissolved oxygen saturation and
less than 1.5ºC variation of temperature amongst treatment vials) as well as a species specific control
survival criterion of less than 20% mortality, based on background studies and relatively high mortality
rates for the species in an aquaculture environment (Sprague and McLeese 1968).

Preparation of WAF and CEWAF Stock Solutions
Exposure waters were prepared in an environmental chamber (15ºC ± 2ºC) following a benchtop mixing
method that modified the baffled flask method for dispersant effectiveness used by Environment Canada
and the United States Environmental Protection Agency. Briefly, 1.6 L of 0.22 µm filtered seawater from
the Bay of Fundy was poured into a clean 2-L baffled flask. Water accommodated fraction (WAF) was
prepared by dispensing crude oil (artificially weathered by nitrogen stripping until 10% loss by mass) from
offshore Newfoundland and Labrador onto the central surface of the water in the flask at a loading of 1 g
oil/L of water. Chemically enhanced water accommodated fraction (CEWAF) was prepared by adding
Corexit 9500A to the centre of the surface oil slick at a dispersant to oil ratio of 1:20. The mixing flask
was then sealed with DuraSeal, secured on an orbital shaker (MaxQ SHKE2000 digital shaker, Thermo
Scientific), and shaken at 150 rpm for 1-hour before allowed to settle for 1-hour. This mixing method was
calibrated to mimic droplet size and distribution results obtained from a wave tank study conducted by
SL Ross (Ottawa, ON) that served as a proxy for offshore Newfoundland and Labrador conditions. These
stock solutions where then diluted to generate exposure media. A dispersant only control was prepared at
a concentration that was equal to the volume of dispersant in the highest tested CEWAF concentration

                                                   Page 5/24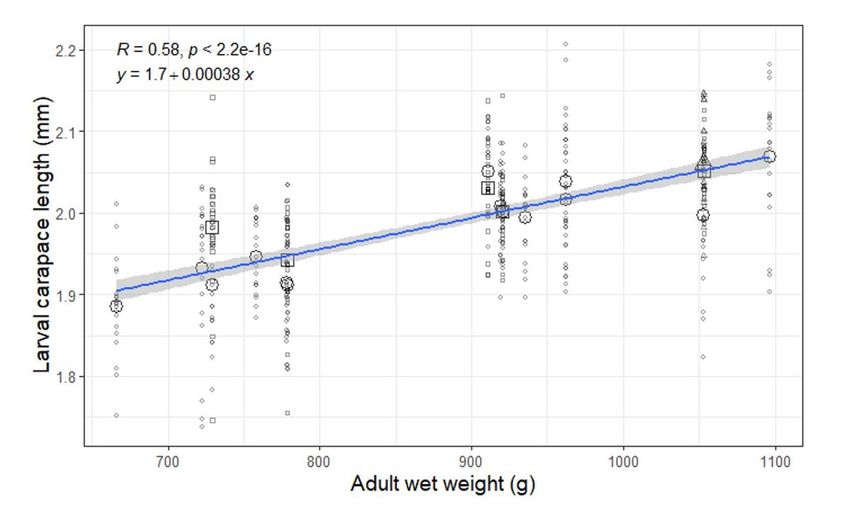
and was nominally 15.8 mg/L in the range finding test (equal to the highest CEWAF concentration tested,
32%) and 4.75 mg/L in the definitive tests (equal to the highest CEWAF concentration test, 10%).

Acute Toxicity Test with WAF and CEWAF
A total of 19 toxicity tests were conducted between June to September 2018 using 14 female lobsters.
The toxicity tests were conducted in the same manner as described for the reference toxicant testing. The
dilution water for toxicity tests was the same filtered seawater that was used to prepare WAF and CEWAF
stock solutions. The preliminary range finding trials included test solutions of 100%, 56%, 32%, 18%, and
10% of WAF stock solution and 32%, 18%, 10%, 5.6%, and 3.2% of CEWAF stock solution, as well as a
dispersant only control (15.8 mg/L) and a seawater control. The definitive toxicity tests followed with
nominal concentrations of 100%, 56% and 32% WAF and 10%, 3.2% and 1% CEWAF stock solutions,
along with the dispersant only control (4.75 mg/L) and seawater control. A randomized experimental
setup was employed and treatments were blinded to assessors to eliminate potential bias.

Exposure Media Characterization
Water quality parameters were measured in three replicates per test solution at pre- and post-exposure.
Dissolved oxygen (DO%) and temperature (oC) were measured using a YSI model ProSolo Digital Water
Quality Meter (Yellow Springs Instruments, Yellow Springs, OH, USA). Salinity (psu) and pH were
measured using the YSI model MultiLab 4010-2 (Yellow Springs Instruments, Yellow Springs, OH, USA)
calibrated with standard pH buffer solutions.

Samples of each test solution from a single trial were collected at the beginning of the trial and sent to a
contract laboratory (RPC, Fredericton, New Brunswick) for characterization of total petroleum
hydrocarbons (TPH), polycyclic aromatic hydrocarbons (PAHs) and alkyl-PAHs by GC-MS based on the
method described in the USEPA 3510C/8270C document (Edgell and Wesselman 1989).

A LISST-100X particle size analyzer (Sequoia Scientific, Inc) was used to characterize the mean droplet
concentration value per bin class (VC, μL/L), the particle size distribution, and the mean droplet size
calculated from 60 independent measurements of each test solution of every WAF and CEWAF
preparation.

The concentrations of TPH for the CEWAF were estimated in the rest of the experimental trials based on
the regression relationship between VC and TPH. The measured and estimated concentrations were used
to model immobilization response and determine the effect concentration to 50% of the population (i.e.,
EC50).

Statistical Design and Data Analysis
                                                  Page 6/24
Water quality parameters, carapace length of reference lobsters, and the wet weight of female lobsters
were all tested for normality and homogeneity of variance using Shapiro-Wilk and Levene’s tests,
respectively. Analysis of variance (ANOVA) using R program was performed to investigate any significant
differences within and between datasets. The significance criterion was set at p < 0.05. In cases with
significant differences, the post-hoc Tukey test was performed to find the trial(s) with significantly
different effect concentration(s). If normality and homogeneity of variance were not met then the non-
parametric test of Mann-Whitney U (also called Wilcoxon Rank Sum Test) was performed.

The drc package (v 3.0-1; Ritz et al. 2015) in R (v 3.6.1; R Core Team 2019) was used to fit the appropriate
model to the acute toxicity results. The best fitted model with the smallest Akaike information criterion
(AIC) value was selected to represent the concentration-response curve for each experimental trial and
used to calculate the 24-hr EC50. The variability in sensitivity of toxic responses of lobster larvae was
assessed within female lobsters with more than one released batch used in toxicity tests, as well as
between female lobsters across trials. The precision of acute toxicity results for both within and amongst
females was evaluated using the coefficient of variation (CV) and standard deviation (Burton et al. 1996).

A species sensitivity distribution (SSD) type approach was used with the cumulative distribution of EC50
values to assess the potential risk to the lobster larvae population. A log-normal distribution function and
resampled randomly 1000 times were used to generate the SSD mean value and the 5th percentile hazard
concentration (HC5) with corresponding 95% confidence interval (95% CI). The concentration of HC5 at
the lower limit was considered to provide the maximum protection of lobster larvae in a given oil
contaminated aquatic ecosystem, essentially the predicted no-effect concentration (PNEC).

Results
Reference Toxicant Testing
A total of four reference toxicant tests were completed with concentrations of 3.3, 10, 33, 100, 330, and
1000 µg Cu/mL. The 48-hr LC50 values ranged from 105.4 to 151.1 µg/L, with a CV of 15.9%. The 48-hr
LC50 values align with those from the literature (100 – 330 µg/L, Connor 1972) and the resulting high
degree of precision supports the use of this bioassay to study the effects of other contaminants.

Exposure Media Characterization

Water Quality
No significant differences were observed for temperature, salinity, or pH between experimental trials at
both pre- and post-toxicity measurements. The DO (% saturation) in control seawater was significantly
different from the 1 (p = 0.04) and 3.2% (p = 0.01) CEWAF treatments across all trials in the post-
exposure measurements. The mean value of DO declined from 93.9% (± 2.3%) to 83.3% (± 8.5%) across

                                                  Page 7/24
all trials between pre- and post-exposure but never dropped below 60% saturation. pH ranged between
7.33 – 7.90 (mean = 7.76) in the pre-exposure solutions and 6.78 – 7.94 (mean = 7.75) in the post-
exposure solutions. The variability of temperature in the test solutions was not significantly different
between the two measurements with an average temperature of 14.4 oC (± 0.6 oC) and 14.5 oC (±
0.5 oC) at the pre- and post-exposure measurements, respectively. The mean, standard deviation and the
coefficient of variation (CV; measure of inter-trial variability) of the water quality parameters across all
trials (n=19) is shown in Table 1, Supplementary Information.
Chemical Characterization
The chemical characterization of the TPH analytes for the WAF and CEWAF treatments are shown in
Table 2.
Physical Characterization
The concentrations of each analyte increased as the nominal concentration of the chemically dispersed
oil elevated (i.e., 1%, 3.2% and 10%). The measured concentrations of TPH analytes were below the
method detection limit (MDL) of the GC-MS in the control seawater and dispersant only control.
In the WAF samples, the LISST transmissivity was too great (>85%) resulting in an unreliable reading and
an instrument warning that the sample was “too clear”. As such only the results from the CEWAF
solutions are presented. The volume concentration (VC) in each bin increased with increasing strength of
test solution and was linearly correlated with increase in TPH concentration. There was very good
consistency between preparations in terms of droplet profile and concentrations. The mean droplet size
from the nine different preparations of 3.2% CEWAF ranged from 3.9 to 10.8 µm with a mean value of 6.3
(standard deviation = 2.4) (Figure 2).
Bioassay
A total of 19 bioassays were performed with 14 different berried female adult American lobsters
contributing larvae. There were significant differences observed between carapace length (mm) of lobster
larvae released from different batches and/or different females (p < 0.05). The carapace length of
reference larvae ranged from 1.74 – 2.21 mm with the average length of 1.99 mm (± 0.087 mm) and
increased linearly with increasing adult lobster wet weight (Figure 3).
Immobilization and mortality were assessed in each individual following the 24-hr exposure and
summarized based on each adult lobster in Figure 4.
The performance of lobster larvae in the control seawater and the dispersant only control met the validity
criteria of less than 20% mortality/immobilization in all the trials. The control and dispersant only control
Page 8/24treatments each showed a very consistent lack of immobilization response across all trials.
The immobilization data was separately fitted against the TPH concentration for each the WAF and
CEWAF exposures, as well as combining the responses for each exposure type. Comparing the best fitted
model for the TPH-based effective concentration for different experimental trials supported the
Weibull1.3 model as the best fitted model in most cases (Table 3). The best fitted model was then used to
calculate the EC50 values and 95% confidence intervals.
The TPH-based 24h EC50 values ranged from 2.30 - 4.77 mg/L for the WAF exposures, 2.15 - 12.8 mg/L
for the CEWAF exposures, and 2.54 - 9.73 mg/L when the exposures were considered together. In each
case, the least sensitive batch was the third release from female 25. The most sensitive batch was the
first release from female 15 when considering the CEWAF-only exposure but the third release from female
4 when considering the WAF only and the combined data. There were few differences between the EC50
estimates from a given batch regardless of the method of calculating the effect concentration. This was
also seen when the data from all trials were pooled and analyzed based on WAF and CEWAF exposures
alone and combined (Figure 5).
The EC50 values calculated from the combined responses (Table 3) were used to generate a cumulative
distribution from which the HC5 and PNEC could be calculated for exposure to hydrocarbons for larval
lobsters (Figure 6).
The HC5 based on the 24-hr EC50 values for immobilization was equal to 2.52 mg/L and would be
considered as a PNEC for this population of larval lobsters. The difference between the LC50 and the
PNEC is quite narrow and reflects that an increase in concentration above the HC5 will quickly translate
into significant effects. When considering these values for risk assessment, application factors (e.g., 10)
could be applied to the PNEC estimate to add a larger degree of conservatism.
Variability
The inter-trial variability between the immobilization response of lobster larvae to the total petroleum
hydrocarbons was assessed using EC50 values from the combined responses. The coefficient of
variation (CV) was 17.1%, demonstrating low variability in toxic response of lobster larvae exposed to
petroleum hydrocarbons. There was no significant difference in response between successive larval
batches from the same female (lobster 16, three batches, p > 0.05). The within female batch CV was
estimated to be 23.3%, demonstrating a slightly higher variability than amongst batches from different
females (17.1%).
The inter-trial variability of the 24-hr EC50 values derived from acute toxicity tests of lobster larvae was
compared with the acute toxicity of standard test species of mysid shrimp (Americamysis bahia) and
inland silversides (Menidia beryllina). A total of 91 data points were obtained from the United States
Environmental Protection Agency (US EPA) National Contingency Plan (NCP) Product Schedule (US EPA
Page 9/242019) showing the toxicity of No. 2 Fuel oil as 48-hr EC50 (mysid shrimp) and 96-hr LC50 (inland
silverside) on a TPH basis (Figure 7).
The lobster data generated in this study is comparable to the effect levels observed with mysid shrimp.
The dispersion of toxicity data points from the mean value of these species was calculated using the
variance of toxicity results to account for the variability in sensitivity of toxic responses of American
lobster. The coefficient of variation was 37.8, 216.7 and 198.9% for American lobster larvae, mysid
shrimp, and inland silverside, respectively.
Discussion
The use of reference toxicants allows researchers to provide a measure of precision and proficiency. The
use of larval lobsters presents a challenge for a standard reference toxicant quality monitoring program
due to their seasonal availability. However, it is still possible to include reference toxicant testing within a
toxicology program, even if only for a limited season. Our results demonstrated that the bioassay was
sensitive, repeatable, and precise, as the achieved LC50 values for copper sulfate align well with what has
previously been observed. The results from the reference toxicant testing highlight that the data
generated under these testing conditions are reflective of legitimate sensitivity and not an artefact of poor
testing conditions, organism health, or handling stress. Based on a curated dataset from the USEPA
Ecotox database, the 48-hr LC50 derived in this study places the lobster from this bioassay in the lower
35th percentile of larval marine crustaceans for copper sensitivity (Supplemental Information, Table 3).
The variability of toxic responses in laboratory-based experiments should be determined to assess the
potential hazard of chemicals to species in the natural ecosystem, which also yields the precision of
toxicity estimates. Two aspects should be identified to account for the variability of species sensitivity in
ecotoxicology: first, the potential causes that can result in variable toxic responses, such as inherent
natural variability between different batches of a test species or temporal and spatial variabilities; and
second, the significance of those variabilities that may mirror the observed toxic responses (Calow 1996).
In this study, a well-detailed and consistent methodology was followed to conduct the toxicity tests to
limit the number of variables that may lead to significantly different toxic responses. For example, the
water quality parameters in the test solutions or the preparation of exposure medium are considered as
the interfering causes of experimental variabilities (Hrovat et al. 2009). The inter-trial variability amongst
water quality parameters had a narrow range in both pre- and post-toxicity test measurements
demonstrating precision of data points.
The procedure to prepare the exposure medium for toxicity tests can alter the sensitivity of test species to
the oil/dispersed oil, irrespective of type of dispersant or oil product. Therefore, determining the
concentration of oil constituents is required to account for the subsequent variability in the observed toxic
responses. In the current study, combining the WAF and CEWAF exposures along the measured
concentration continuum exhibited nearly equal precision when estimating the oil toxicity to lobster
larvae than when the WAF and CEWAF were considered alone. The CV of the EC50 values calculated from
Page 10/24the combined WAF and CEWAF was equal to 17% as compared with the WAF and CEWAF alone with CVs
of 20% and 43%, respectively. Previous studies have set acceptable ranges for intra- and inter-laboratory
variability based on the CV, corresponding to excellent (CV 86%) (Echols et al. 2015). The precision in this study puts the larval lobster bioassay in the ‘excellent’ to
‘good’ categories and strengthens the reliability of the results. The 24-hr LC50 values from this study are
in the low mg/L TPH range, which is consistent with other marine crustaceans (Figure 7). The exposure
conditions of the current study were static non-renewal and thus the derived toxicity values (LC50 = 3.9,
HC5 or PNEC = 2.5 mg/L TPH) likely overestimate the real-world exposure scenario of oil/dispersed oil to
lobster larvae, which is expected to be dynamic.
Lack of variation in sensitivity of early life stages of lobster to acute exposure of oil may be attributed to
narcotic mechanism of action of oil products that is not taxa specific (Barron et al. 2004; Russom et al.
1997). The less variability in the toxic response of lobster larvae might be due to less variation in the
ability of crustacea to metabolize xenobiotics. There is no consensus on the presence and inducibility of
cytochrome 1A (CYP1A) enzymes in invertebrates (Koening et al. 2012). James and Boyle
(1998) reviewed cytochrome P450 in crustacea and found evidence that lobsters (Panulirus argus and
Homarus americanus) do not perform biotransformation of benzo-a-pyrene (B[a]P) in a CYP1 manner.
Most remaining B[a]P was untransformed accumulating in the muscle and hepatopancreas of the
American lobster. The authors also noted that the aryl hydrocarbon receptor (Ah-receptor) is absent in
American lobster. Altogether, it suggests that the lobster does not have the same ability to metabolize and
ameliorate exposure to petroleum hydrocarbons as do fish or mammals. The absence, or reduced
capacity, for xenobiotic metabolism is compounded by the potentially relatively low level of genetic
variability in lobsters, which limits the ability for selection and adaptation. Tracey et al. (1975) employed
starch-gel electrophoresis followed by a selective enzyme assay to quantify the amount of genetic
variation in geographically distinct (three offshore and five nearshore) natural populations of the
American lobster. They found there to be rather low levels of genetic variability within the 300 animals
surveyed, with the average proportion of heterozygous loci per individual being 3.8%. The small and
nearly constant variance in EC50 values observed for lobsters in this study may be indicative of low
phenotypic variability, which can be associated with lower genetic variability (Devin et al. 2014), and may
be a reflection of the fact that these wild lobsters all had been caught within the same area (Lobster
Fishing Area 36) and are of unknown relatedness. The significance of low variability in terms of
sensitivity to hydrocarbons observed in this study may speak to a reduced resilience within this
population and a reduced pool of survivors to repatriate following an oil spill.
These results demonstrate that the larval lobster bioassay is sensitive, reliable and may be successfully
implemented to assess the hazard from marine contaminants. Application of this bioassay to test the
hazard of physically and chemically dispersed crude oil revealed that lobster larvae are sensitive to
petroleum hydrocarbon exposure and as a population they exhibit limited variability in response. These
observations may place them at greater risk of extirpation should a severe oil spill occur during the same
seasonal window when stage I lobster larvae are present.
Page 11/24Declarations
Acknowledgements
The co-authors would like to thank the Huntsman Marine Science Centre staff for their dedicated work in
supporting and conducting the experiments reported in this study including E. Dowling, R. Eldridge, E.
Fanning, D. Goodwin, E. Harvey, T. Hurley and A. McCarthy. Additional funding was provided by the
Government of Canada’s Department of Fisheries and Oceans Multi-Partner Research Initiative.
Funding
Funding for this work was provided through The Environmental Studies Research Fund, ESRF 2014-04S.
Conflicts of interest/Competing interests (include appropriate disclosures):
The authors report no conflicts of interest or competing interests
Availability of data and material (data transparency):
Upon request
Code availability (software application or custom code):
Upon request
Additional declarations for articles in life science journals that report the results of studies involving
humans and/or animals
Ethics approval (include appropriate approvals or waivers):
NA
Consent to participate (include appropriate statements):
NA
Consent for publication (include appropriate statements):
NA
References
Barron, M.G., Carls, M.G., Heintz, R., Rice, S.D., 2004. Evaluation of fish early life-stage toxicity models of
chronic embryonic exposures to complex polycyclic aromatic hydrocarbon mixtures. Toxicol. Sci. 78, 60–
67. https://doi.org/10.1093/toxsci/kfh051
Page 12/24Bejarano, A.C., Barron, M.G., 2014. Development and practical application of petroleum and dispersant
interspecies correlation models for aquatic species. Environ. Sci. Technol. 48, 4564–4572.
https://doi.org/10.1021/es500649v
Burridge, L.E., Haya, K., 1997. Lethality of pyrethrins to larvae and postlarvae of the American lobster
(Homarus americanus). Ecotoxicol. Environ. Saf. 38, 150–154. https://doi.org/10.1006/eesa.1997.1571
Calow, P., 1996. Variability: Noise or information in ecotoxicology? Environ. Toxicol. Pharmacol. 2, 121–
123. https://doi.org/10.1016/S1382-6689(96)00041-5
Connor, P.M., 1972. Acute Toxicity of Heavy Metals to Some Marine Larvae. Mar. Pollut. Bull. 3, 190–192.
Devin, S., Giamberini, L., Pain-Devin, S., 2014. Variation in variance means more than mean variations:
What does variability tell us about population health status? Environ. Int. 73, 282–287.
https://doi.org/10.1016/j.envint.2014.08.002
Echols, B.S., Smith, A.J., Rand, G.M., Seda, B.C., 2015. Factors Affecting Toxicity Test Endpoints in
Sensitive Life Stages of Native Gulf of Mexico Species. Arch. Environ. Contam. Toxicol. 68, 655–662.
https://doi.org/10.1007/s00244-014-0122-7
French-McCay, D., 2003. Development and application of damage assessment modeling : example
assessment for the North Cape oil spill. Mar. Pollut. Bull. 47, 341–359. https://doi.org/10.1016/S0025-
326X(03)00208-X
Hrovat, M., Segner, H., Jeram, S., 2009. Variability of in vivo fish acute toxicity data. Regul. Toxicol.
Pharmacol. 54, 294–300. https://doi.org/10.1016/j.yrtph.2009.05.013
Hughes, R., Reichelt-Brushett, A.J., Newman, L., 2005. Identifying suitable invertebrate species from a
unique habitat for ecotoxicological testing. Australas. J. Ecotoxicol. 11, 85–92.
James, M.O., Boyle, S.M., 1998. Cytochromes P450 in crustacea. Comp. Biochem. Physiol. - C Pharmacol.
Toxicol. Endocrinol. 121, 157–172. https://doi.org/10.1016/S0742-8413(98)10036-1
Koening, S., Fernández, P., Solé, M., 2012. Differences in cytochrome P450 enzyme activities between fish
and crustacea: Relationship with the bioaccumulation patterns of polychlorobiphenyls (PCBs). Aquat.
Toxicol. 108, 11–17. https://doi.org/10.1016/j.aquatox.2011.10.016
Mayer, F.L.L., Ellersieck, M.R.M.R., 1986. Manual of acute toxicity: interpretation and data base for 410
chemicals and 66 species of freshwater animals.
Reddy, C.M., Quinn, J.G., 2001. The North Cape oil spill : hydrocarbons in Rhode Island coastal waters and
Point Judith Pond 52, 445–461.
Page 13/24Russom, C.L., Bradbury, S.P., Broderius, S.J., Hammermeister, D.E., Drummond, R.A., 1997. Predicting
modes of toxic action from chemical structure: Acute toxicity in the fathead minnow (Pimephales
promelas) . Environ. Toxicol. Chem. 16, 948–967. https://doi.org/10.1002/etc.5620160514
Segner, H., Baumann, L., 2015. What Constitutes A Model Organism in Ecotoxicology? Integr. Environ.
Assess. Manag. 12, 199–200. https://doi.org/10.1002/ieam.1734
Simmons, D.B.D., Benskin, J.P., Cosgrove, J.R., Duncker, B.P., Ekman, D.R., Martyniuk, C.J., Sherry, J.P.,
2015. Omics for aquatic ecotoxicology : Control of extraneous variability to enhance the analysis of
environmental effects. Environ. Toxicol. Chem. 34, 1693–1704. https://doi.org/10.1002/etc.3002
Sprague, J.B., McLeese, D.W., 1968. Toxicity of kraft pulp mill effluent for larval and adult lobsters, and
juvenile salmon. Water Res. 2, 753–760.
Tracey, M., Nelson, K., Hedgecock, D., Shleser, R., Pressick, M., 1975. Biochemical Genetics of Lobsters:
Genetic Variation and the Structure of American Lobster (Homarus americanus) Populations. J. Fish
2091–2101.
USEPA, 2019. The National Contingency Plan (NCP) Product Schedule [https://www.epa.gov/emergency-
response/national-contingency-plan-subpart-j.
Wells, P.G., Sprague, J.B., 1976. Effects of crude oil on American lobster (Homarus americanus) larvae in
the laboratory. J. Fish. Res. Board Canada33, 1604–1614.
Tables
Table 1: Assessment endpoint scoring criteria for lobster larvae.
Score Description
0 No observed effect: vigorously swimming, active internal organ movement
1 Affected: passive swimming, erratic swimming, positioned on side or back, rigid body
position, exopodites/pereiopod beating in coordinated motion
2 Moribund (mortally affected): no swimming activity, twitching,
sporadic movement of mouthparts and exopodites/pereiopod, positioned on side or back,
faint heartbeat, slight internal organ movement
3 Dead: no swimming, no visible heartbeat, change in coloration towards brown/opaqueness,
absence of movement after gentle prodding
Table 2: Concentration (mg/L) of the total petroleum hydrocarbon (TPH) of nominal concentrations of
physically dispersed oil (32% WAF) and chemically enhanced fraction of oil (1%, 3.2% and 10% CEWAF)
dispersed using Corexit 9500A.
Page 14/24Analytes MDL Control Corexit 9500A 32% 1.0% 3.2% 10%
Seawater Control (nominal WAF CEWAF CEWAF CEWAF
4.75 mg/L)
Benzene 0.001 < MDL < MDL 0.015 0.0005 0.001 0.004
Toluene 0.001 < MDL < MDL 0.31 0.01 0.03 0.12
Ethylbenzene 0.001 < MDL < MDL 0.06 0.003 0.009 0.034
Xylenes 0.001 < MDL < MDL 0.3 0.015 0.049 0.18
VPH C6-C10 0.01 < MDL < MDL 0.52 0.05 0.14 0.45
(Less BTEX)
EPH >C10 - 0.05 < MDL < MDL 0.33 0.49 1.6 5.1
C16
EPH >C16 - 0.05 < MDL < MDL 0.07 0.4 1.3 3.8
C21
EPH >C21- 0.1 < MDL < MDL < 0.06 1.8 5.8
C32 MDL
Modified TPH 0.1 < MDL < MDL 0.9 1.5 4.8 15.0
Tier 1
TPH 0.00 0.00 1.61 1.57 4.93 15.49
*MDL: Method Detection Limit
Values ≤ MDL were replaced with 1/2 MDL for calculating sums.
Table 3: The best fitted model based on the AIC criterion and calculated 24h EC50 values (mg/L) with
lower and upper limits (95% confidence limits) calculated on the basis of WAF and CEWAF alone and
combined. The lowest EC50 value in each column is bolded and the highest values are bold and
italicized.
Page 15/24Lobster Batch WAF CEWAF Combined
Model 24h EC50 Model 24h EC50 Model 24h EC50
(95% CI) (95% CI) (95% CI)
(TPH mg/L) (TPH mg/L) (TPH mg/L)
2 1 W2.3 3.60 W1.3 4.71 LL.4 4.72
(2.60-4.61) (4.71-4.71) (4.49-4.95)
2 W1.3 2.93 W1.3 2.28 W1.3 2.91
(2.91-2.94) (2.26-2.31) (2.56-3.26)
3 1 W1.4 4.07 W1.3 3.24 W1.3 4.08
(3.87-4.27) (3.15-3.33) (4.07-4.10)
4 3 W1.3 2.30 W1.3 5.46 W1.3 2.54
(2.21-2.40) (4.98-5.94) (-6.47-11.56)
6 1 W1.3 3.35 W1.3 3.10 W1.3 5.35
(3.07-3.64) (3.02-3.19) (1.90-8.79)
8 1 W1.3 2.81 W1.3 5.33 W1.3 4.54
(2.80-2.81) (5.33-5.33) (2.94-6.13)
9 1 W1.3 2.83 W1.3 3.44 W1.3 3.19
(2.82-2.84) (3.44-3.44) (2.68-3.70)
2 LL.4 3.15 LL.4 4.53 LL.4 3.10
(2.89-3.41) (0.30-8.75) (1.36-4.85)
15 1 W1.3 3.93 W1.4 2.15 W1.3 3.90
(3.93-3.94) (2.15-2.15) (2.30-5.50)
16 1 W1.3 4.09 W2.3 8.98 W1.3 4.79
(3.05-5.12) (6.10-11.86) (1.20-8.39)
2 W1.3 2.93 W1.3 6.07 W1.3 3.69
(2.91-2.94) (6.02-6.12) (1.02-6.37)
3 W1.3 2.46 W1.3 7.84 W1.3 5.93
(2.37-2.54) (7.84-7.85) (3.02-8.84)
17 1 W2.4 2.84 W1.3 5.33 W1.3 3.52
(0.33-5.36) (5.33-5.33) (1.38-5.66)
18 1 W1.3 2.58 W1.3 8.06 W1.3 4.77
Page 16/24(2.52-2.62) (6.91-9.20) (-1.09-10.63)
2 W1.3 3.45 W1.3 7.33 W1.3 3.03
(3.17-3.73) (7.15-7.51) (1.60-4.46)
19 1 LL.4 3.04 LL.4 4.37 W1.3 3.15
(2.99-3.08) (4.37-4.37) (-3.25-9.55)
21 1 LL.4 3.86 W1.3 5.41 W1.3 3.38
(3.23-4.50) (3.51-5.31) (-21.29-28.05)
22 1 W1.4 4.07 W1.4 9.54** W1.3 4.99
(3.87-4.27) (9.50-9.58) (4.99-5.00)
25 3 W2.3 4.77* LL.4 12.85 LL.4 9.73
(3.80-5.73) (6.46-19.25) (-1.16-20.62)
*Significant difference between 24h EC50 value of WAF with CEWAF and Combined (p < 0.05).
**Significant difference between 24h EC50 value of CEWAF with WAF and Combined (p < 0.05).
Figures
Page 17/24Figure 1
Stage I larval lobster (Homarus americanus) at 24-hrs post hatching
Page 18/24Figure 2
(Top) Volume concentration profile by LISST ring midpoint (µm) from a representative 1 (black bars), 3.2
(blue bars), and 10% (red bars) strength CEWAF, with the sum concentration regressed against measured
TPH (mg/L) in the insert. (Bottom) Droplet concentration profiles by LISST ring number from nine
different preparations of 3.2% strength CEWAF solution, with the mean droplet size (µm) from each
preparation in the insert.
Page 19/24Figure 3
The average (larger points) carapace length (mm) of reference lobster larvae (n = 20, smaller points) for
each female and release (circle is first release, square is second release, and triangle is third) and the wet
weight (g) of each adult lobster.
Page 20/24Figure 4 Visual summary of the 24-hr immobilization results for larvae from each lobster (individual panels) exposed to dilutions of WAF (purple) and CEWAF (red). The dotted horizontal line is the validity criteria of
Figure 5

Concentration immobilization response models considering the WAF (blue triangles), CEWAF (red circles),
and combined (black line) data. The dashed vertical lines are the EC50 values, which are reported in the
inset.

                                                Page 22/24
Figure 6
Distribution of lobster toxicity values where each point is an individual batch. The horizontal, dotted, red
line is the HC5 estimate of 2.5 mg/L and the vertical dashed black line is the pooled LC50 estimate of 3.9
mg/L.
Page 23/24Figure 7
Comparing the variability of 24 hr EC50 of American lobster larvae (Homarus americanus) (n = 19)
exposed to offshore crude oil with the 48-hr EC50 of mysid shrimp (Americamysis bahia) (n = 91) and 96-
hr LC50 of inland silversides (Menidia beryllina) (n = 91) exposed to No. 2 Fuel Oil (data collected from
USEPA NCP Schedule J listings).
Supplementary Files
This is a list of supplementary files associated with this preprint. Click to download.
deJourdanetal2021ArchEnvirContamToxicolSI.docx
Page 24/24You can also read