Evaluation of the aquatic habitat and fish assemblage in an urban reach of the historic Rideau Canal, Ottawa, Canada: Implications for management ...
←
→
Page content transcription
If your browser does not render page correctly, please read the page content below
Urban Ecosyst (2010) 13:563–582
DOI 10.1007/s11252-010-0135-6

Evaluation of the aquatic habitat and fish assemblage
in an urban reach of the historic Rideau Canal, Ottawa,
Canada: Implications for management
in an engineered system

Robyn P. Walker & Amanda C. O’Toole & Zach Whynot &
Kyle C. Hanson & Steven J. Cooke

Published online: 29 July 2010
# Springer Science+Business Media, LLC 2010

Abstract The historic Rideau Canal (built in the 1800s) in eastern Ontario, Canada is a
heavily managed and engineered ecosystem, popular for recreational boating and sport
fishing in the summer and ice skating in the winter. However, little is actually know about
the fish and aquatic macrophyte communities, particularly in the urban reach in Ottawa
between Hartwell’s Lock and the outflow of Dows Lake. The objective of this study was to
examine the extent to which fish and macrophytes varied among different natural and
engineered habitat/substrate types across the period when the canal is at navigational water
levels. Five gross habitat types were identified, consisting of gravel, silt/sand, rip-rap/
gabion basket, boulder and concrete wall habitats. Replicate transects were established in
the littoral zone, representing the different habitat types. Snorkel surveys were conducted
on a biweekly basis, where fish species and aquatic macrophytes within the transects were
quantified. Supplementary data on fish populations was obtained through seine net
sampling as well as angler interviews and visual observations. The fish community was
characterized as a reasonably simple warmwater assemblage, dominated by centrarchids
(e.g., pumpkinseed [Lepomis gibbosus], bluegill [L. macrochirus], and largemouth bass
[Micropterus salmoides]). In fact, more than 90% of all fish encountered (snorkel surveys
and seine netting) belonged to the centrarchid family. None of the 17 fish species
encountered in the reach were considered “at risk” in Canada, although the system supports
one of the few urban muskellunge (Esox masquinongy) populations in the world and
provides a range of urban recreational fishing opportunities for sportsfish. Fish diversity
metrics (e.g., diversity, richness, evenness) varied little among habitat types, perhaps
reflecting the fact that vegetation communities were reasonably homogeneous, largely

R. P. Walker : A. C. O’Toole : Z. Whynot : K. C. Hanson : S. J. Cooke
Fish Ecology and Conservation Physiology Laboratory, Department of Biology, Carleton University,
1125 Colonel By Drive, Ottawa, ON K1S 5B6, Canada

A. C. O’Toole : S. J. Cooke (*)
Institute of Environmental Science, Carleton University, 1125 Colonel By Drive, Ottawa,
ON K1S 5B6, Canada
e-mail: Steven_Cooke@carleton.ca
564                                                            Urban Ecosyst (2010) 13:563–582

dominated by the exotic Eurasian water milfoil (Myriophyllum spicatum). This research
provides managers with the first detailed information on the aquatic ecology in this
engineered urban ecosystem which will enable relevant government agencies (e.g., Parks
Canada) to better balance the iconic cultural values of national significance with their
mandate to protect the ecological integrity of the canal ecosystem.

Keywords Fish habitat . Aquatic macrophytes . Canal . Natural heritage . Biodiversity .
Environmental management . Urban ecology

Introduction

Since the construction of the first canal in eastern Ontario in the 1800s, Canada has used its
canal systems as alternate routes for trade or as tools in the country’s defense. Before the
construction of extensive railroad lines, canals allowed movement of ships, troops, and
supplies around the country. The Rideau Canal system in particular was an important tool in
commercial shipping and national defense, providing a direct route between Ottawa and
Kingston (Bumsted 2003). Built between 1826 and 1832, the canal spans 202 km and has
47 working locks and 52 dams. Since about 1849, however, the role of the Rideau Canal
has changed dramatically (Parks Canada 2005). Instead of playing a role in commercial and
military endeavors, it now plays a more social role and has been designated as a National
Historic Site, managed by Parks Canada. The Rideau Canal is a popular waterway for
recreational boat traffic and angling during the summer. In the winter months, one segment
(in downtown Ottawa) is used as the Rideau Canal Skateway (one of the World’s longest
skating rinks). Although the canal is one of the most prominent tourist attractions in Ottawa
and indeed the entirety of eastern Ontario, little is known about the ecology of the system.
Parks Canada’s stated goal is to “preserve the cultural and natural values of the Canal and
its setting while allowing for sustainable development on lands bordering the Canal and
recreational use of the Canal itself” (Parks Canada 2005). To realize this goal, it is
necessary to have an understanding of the ecology of the Canal.
    To date, there have been few attempts to understand the ecology of the Rideau Canal
system (Levin 2006), particularly in the urban reach between Hartwell’s Lock and the
outflow of Dows Lake in Ottawa (Wachelka et al. 2000). Dows Lake is a large man-made
lake (excavated wetland) that is essentially a lentic section of the Rideau Canal, located
near downtown Ottawa. Perturbations from upstream (e.g., agricultural impacts, nutrient
enrichment, and associated dense macrophyte beds and mats), shoreline alterations, urban
stormwater runoff, boating, fishing, and the seasonal water-level management (i.e., fall
draining and spring flooding to accommodate the skateway and protect canal infrastructure)
all represent unknown risks to the canal’s habitats and organisms. The water levels in this
urban reach are lowered annually by ~1.2 m in mid October where they stay until spring
when water levels are raised by ~1.2 m to reach summer levels that enable navigation.
Parks Canada has a strong interest in the preservation of diversity and is actively
inventorying the natural heritage features in all the systems in which they have jurisdiction.
Several earlier studies have examined the fish community present in the Rideau Canal
system as a whole (Phelps et al. 1999; Coad 2001). However, none have examined how the
fish community changes on a seasonal basis, nor examined the relationship between fish
species and habitat structure, particularly in urban areas of the canal. With potential
redevelopment of some lands adjacent to the canal as well as ongoing maintenance and
operation of the canal itself, it is becoming increasingly important to understand the state
Urban Ecosyst (2010) 13:563–582 565 and dynamics of this urban ecosystem. Such information is essential to enable the development of management strategies that balance the desire to maintain or enhance diversity with the human uses of this engineered environment. This study is the first comprehensive analysis of the fish community in the reach of the Rideau Canal between Hartwell’s Lock and the outflow of Dows Lake. Specifically, we examined habitat type and water quality and their impacts on the fish and aquatic plant communities. Five different habitat types were monitored over the course of the 5 months during which the canal was filled to navigational water levels. At the outset of the study, we predicted that areas with more complex substrate, like boulder habitats, would contain more diverse and complex fish and macrophyte communities, whereas less complex habitats like those along the canal wall and silt/sand substrates would not encourage diverse assemblages. Although canal wall habitats are of little relevance to other systems, Parks Canada is mandated to protect ecosystem features in the Rideau Canal that relate directly to the construction of the canal because of their historic and natural value (Parks Canada 2005). Thus, information obtained from this study will enable Parks Canada to better manage this urban reach of the Rideau Canal and balance cultural, recreational, navigational, heritage, and ecosystem needs. Material and methods Study site and habitat assessment For the purpose of this study, research efforts focused on the reach of the Rideau Canal between Hartwell’s Lock (beginning immediately downstream of the lock) and extending downstream roughly 1 km to the outflow of Dows Lake (at the Bronson St. Bridge, Ottawa; a linear distance of approx. 1 km). Included in this analysis are all connected habitats including Agriculture Creek in the Agriculture Canada Arboretum, and Dows Lake. Because of safety concerns and the need to maintain open navigation channels, research activity was restricted to the littoral zone. The only littoral regions not surveyed were those within 10 m downstream of the Hartwell’s Lock gates and the area near the marina that is in the northwest corner of Dows Lake. Most sites we sampled were de-watered in the winter months, desiccating and freezing the exposed substrate. In late April 2006, before the water levels in the Rideau Canal were raised (~1.2 m) to summertime levels, the littoral zone of Dows Lake and the canal near Hartwell’s Locks were assessed to determine the shoreline habitat, littoral zone structure, and littoral zone substrate, all gross habitat elements that can influence fish distribution and community structure. The shoreline was divided into 100 m reaches. Throughout each 100 m reach we quantified the number of littoral structural elements (boulders, fixed woody debris, stumps). At the 50 m mark, each substrate type was quantified with a gravelometer and categorized using a modified Wentworth (1922) scale (silt [256 mm]) and expressed as a percentage of total substrate in three 1 m2 quadrats. Based on these initial surveys, we separated the reaches in the littoral zone into five primary habitat categories according to dominant substrate composition and shoreline; boulder, silt, gravel/cobble, riprap/gabion baskets, and canal wall. These initial classifications reflected a combination of natural and engineered habitats and were used to establish transects (1 m×25 m) for snorkel surveys. For each primary habitat type, there were between three and five replicate transects.
566 Urban Ecosyst (2010) 13:563–582
Snorkel surveys
Snorkeling surveys were conducted beginning in early May 2006 and continued throughout
the summer months on a biweekly basis, ending in late September 2006. Twenty-three sites,
each dominated by one of the five primary habitat types (described above) were selected
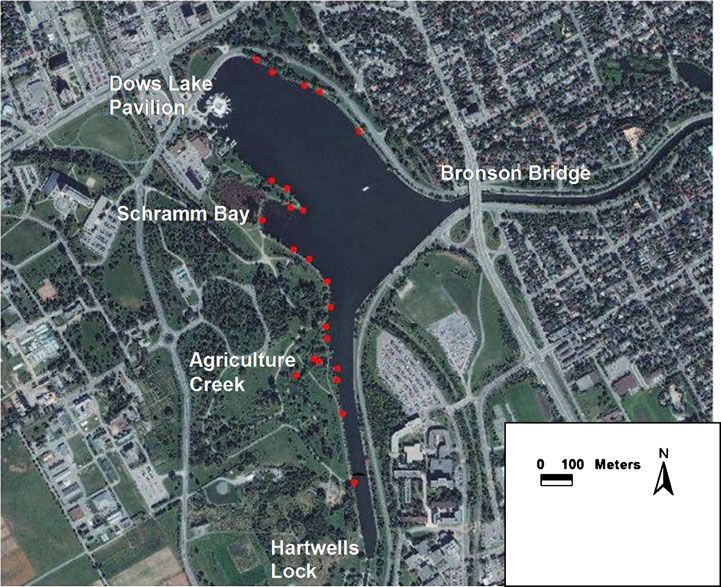
and 1 m×25 m transects were established (Fig. 1). Each transect was marked using
coloured flags, with flags placed every 5 m dividing the transect into five 5 m sections.
Depth of transects ranged from ~50 cm to ~150 cm. The snorkel surveys were conducted to
observe fish spatial ecology and community structure as well as macrophyte dynamics. All
snorkeling was conducted by one of two individuals that were both trained in fish and
macrophyte identification. Snorkellers wore 6 mm wetsuits to provide buoyancy so that the
transects could be swum at a slow but steady pace. All snorkel surveys occurred between
10 am and 3 pm.
Fish snorkeling surveys
Every 2 weeks, snorkeling surveys were conducted. The 23 transects were swum by
snorkellers and the type and abundance of fish in each 5 m section of transect were
Dows
Lake
Transect Sites
Combined Transect
& Seine Net Sites
Fig. 1 Aerial view of Dows Lake study area showing location of transects (open circles) including those that
were also sampled with seine nets (circles filled with black angular lines). Hartwell’s lock is visible in the
canal to the west of the Lake. The bridge (Bronson Street) at the east end of the Lake represents the
downstream extent of the study area. Water flows downstream from Hartwell’s Lock towards Dows Lake and
onwards to the Ottawa Lockstation, some 6 km downstreamUrban Ecosyst (2010) 13:563–582 567 recorded. The time taken to swim each transect was standardized, with each transect taking between 5 and 7 min to complete. Snorkellers carried plastic slates onto which they recorded data into a matrix of species/transect sections. Data was transcribed at the end of a snorkeling session. Two repeated measures (with site as the repeated variable) analyses of variance (ANOVA) followed by multiple comparisons (Tukey’s HSD post hoc test) were employed to determine differences in species diversity indices (see “Diversity metrics” below for information on diversity indices) between the sampling periods (with location as the repeated variable) and between habitat types (with sampling period as the repeated variable) (Day and Quinn 1989). All analyses were performed using JMP v 6.0 (SAS Institute). Aquatic macrophyte assessment Macrophyte snorkel surveys were conducted biweekly at the same times as the fish snorkel surveys (see above) with snorkellers randomly placing a 0.25 square meter quadrat in each 5 m section of each transect. Once the quadrat had been placed, species within the quadrat were identified, as well as the percent of the quadrat covered by each species. Identification was aided by the use of regional field guides including Spicer and Catling (1990). This sampling technique was conducted to determine seasonal patterns in macrophyte growth and assemblage structure. Repeated measures ANOVA were used to determine the differences in plant diversity and abundance between habitat types (with sampling period as the repeated variable) and over time (with location as the repeated variable). These tests focused on diversity indices (see below for calculations) and were completed in the same way as the fish data analyses. Water quality assessment Measurements of water quality were collected biweekly, coinciding with the swimming of the transects. Readings were taken, when possible, at the middle of each transect. For each transect the percent dissolved oxygen (and dissolved oxygen in mg per liter), conductivity and temperature were quantified using a handheld meter (YSI Model 85 Handheld Oxygen, Conductivity, Salinity and Temperature system). Turbidity readings were obtained using a turbidity meter (LaMotte 2020 turbidity meter). Water quality trends were analyzed across the ten snorkel survey periods and in the five primary habitat types. Repeated measures ANOVAs were used to assess differences in water quality between habitat types and over time (same analyses as for the plant and fish data). Seine net sampling and other fish observations Seine netting was used to identify different fish species that may not have been seen during snorkel surveys. A seine net measuring 4′ deep × 40′ long with a 4′ pocket and ¼ inch mesh was used bi-weekly at 10 different sites along the north side of the canal to capture fish (Fig. 1). The seine pulls covered a variety of habitat types so habitat specific analyses were not conducted. Generally the seine pulls were conducted between 8:00 am and noon. However, three seine sets were completed in the evening (starting at 9:00 pm) to ensure that we were not missing nocturnal species. After a seine pull, each fish captured was identified prior to release. Other observations such as reproductive status were also recorded when appropriate. In addition, we interviewed recreational anglers, conducted “research angling”, and conducted visual surveys (i.e., looking through the air-water interface with polarized
568                                                             Urban Ecosyst (2010) 13:563–582

glasses) to supplement snorkeling and seine data, including one assessment in early April
2006 when we observed a winterkill event.

Diversity metrics

Raw data from fish and aquatic macrophytes (abundance of each species in each transect
during each sampling period) was used to calculate diversity metrics. First, species richness,
defined as the total number of different species present, was determined. Next, we
calculated the Shannon-Wiener index of diversity (H) using the methods described by
Krebs (1989). The Shannon-Wiener index incorporates species richness and the proportion
of each species (Peet 1974). Additionally, we calculated evenness (E; Krebs 1989) which is
a measure of the similarity of the abundances of different species (Washington 1984). We
also determined the abundance of fish and macrophytes, which was a summation of the
number of fish or macrophytes observed during a single sampling event. All diversity
metrics were calculated using the MS Excel freeware program Diversity Tools (John Hanks,
Texas, USA).

Results

Habitat assessment

Habitat mapping and assessment during low water periods (i.e., prior to canal filling)
revealed that the littoral zone had 18.7±27.3% overhead cover (range of 0% to 100%). The
majority of the overhead cover was provided by trees in the Agriculture Canada Arboretum.
In-water cover (in the form of large woody debris or boulders) was reasonably sparse. Mean
number of boulders and large woody debris per 100 m stretch of shoreline was 8.7±15.2
pieces (range 0 to 82). Wall habitats tended to have the least amount of in-water cover.
Across all sites, the average percentage of different substrate types was as follows: 32% silt,
14% sand, 24% gravel, 17% cobble/riprap, and 13% boulder fields.

Water quality

The dissolved oxygen saturation and actual concentration of dissolved oxygen (i.e., mg/l)
both varied throughout the study season (% Saturation, df=6, F-ratio=10.68, P
Urban Ecosyst (2010) 13:563–582                                                            569

(F=1.66, P
570

Table 1 Seasonal water quality trends for dissolved oxygen (DO; in% saturation and mg/l), conductivity (cond. in mS), turbidity (turb. NTU), and water temperature (temp. °C) relative
to different habitat types. Habitats were categorized as boulder (B), gravel/cobble (G), silt/sand (S), riprap/gabion baskets (R), and canal wall (W). Data represent means ± 1 SE

Date       Habitat    N     Mean DO       SE DO      N    Mean DO       SE DO      N     Mean Cond       SE Cond      N    Mean Turb      SE Turb     N     Mean Temp       SE Temp
           type             (% Sat)       (%)             (mg/l)        (mg/l)           (mS)            (mS)              (NTU)          (NTU)             (°C)            (°C)

May-11     B          5     118            3         5    11.4          0.1        0     NA              NA           5     2.7           0.3         3     16.0            0.1
May-11     G          6     123            5         6    11.8          0.3        0     NA              NA           6     1.9           0.2         6     15.9            0.1
May-11     R          4     125            1         4    11.8          0.2        0     NA              NA           4     3.3           0.2         1     15.9            NA
May-11     S          4     127            7         4    12.3          0.8        0     NA              NA           4     3.9           0.4         2     16.4            0.3
May-11     W          7     119            3         7    11.6          0.2        0     NA              NA           7     1.9           0.2         4     15.5            0.1
May-24     B          5     131            5         5    12.8          0.4        5     648             35           5     5.1           0.4         5     16.6            0.3
May-24     G          6     136            1         6    12.7          0.3        6     703             10           6     7.0           1.2         6     17.3            0.2
May-24     R          4     122            7         4    12.3          0.9        4     553             56           4     4.5           0.4         4     15.7            0.7
May-24     S          4     133            9         4    13.0          0.7        4     697             65           4     9.5           3.2         4     16.5            0.3
May-24     W          4     140            2         4    13.3          0.1        4     721             39           4     3.4           0.1         4     17.6            0.3
Jun-6      B          5     112            8         5    10.1          0.9        5     613             39           5     3.1           0.4         5     23.3            0.5
Jun-6      G          6     148            8         6    12.1          0.5        6     644             17           6     2.7           0.2         6     24.5            0.3
Jun-6      R          4     116            7         4    10.1          0.4        4     489             36           4     2.9           0.3         4     22.5            0.4
Jun-6      S          3     146           40         3    12.1          3.2        3     603             38           3     2.5           0.0         3     23.3            0.5
Jun-6      W          4     119            8         4    10.1          0.9        4     646             10           4     2.7           0.4         4     25.4            0.2
Jun-19     B          5     115           10         5    10.0          0.8        5     583             28           5     4.1           2.1         5     23.5            0.4
Jun-19     G          6     140            5         6    11.7          0.3        6     570              5           6     2.1           0.5         6     23.6            0.2
Jun-19     R          4     118           12         4    10.0          1.0        4     487             24           4     2.9           0.5         4     23.1            0.3
Jun-19     S          4     118           10         4    10.0          0.9        4     571             23           4     4.9           1.5         4     23.2            0.3
Jun-19     W          4     133            3         4    11.5          0.2        4     575              5           4     1.6           0.1         4     23.2            0.0
Jul-5      B          5     149           16         5    12.2          1.2        5     506             24           5     2.2           0.8         5     24.7            0.6
Jul-5      G          6     152            7         6    12.6          0.5        6     482             15           6     1.1           0.4         6     25.2            0.3
                                                                                                                                                                                         Urban Ecosyst (2010) 13:563–582
Jul-5 R 4 118 13 4 9.9 1.0 4 474 7 4 3.2 0.9 4 24.1 0.2
Jul-5 S 4 131 8 4 11.2 0.5 4 420 63 4 2.5 0.3 4 24.4 0.5
Jul-5 W 4 142 5 4 11.7 0.5 4 520 6 4 0.6 0.1 4 25.1 0.1
Jul-17 B 5 133 8 5 10.4 0.6 5 519 31 5 4.0 1.9 5 28.2 0.3
Jul-17 G 6 162 4 6 12.2 0.4 6 447 37 6 1.2 0.5 6 29.0 0.2
Jul-17 R 4 111 8 4 8.6 0.5 4 471 5 4 10.4 5.6 4 28.3 0.8
Jul-17 S 4 142 11 4 10.6 0.9 4 492 18 4 3.4 0.9 4 28.2 0.3
Jul-17 W 4 147 11 4 11.2 0.8 4 520 6 4 0.9 0.1 4 29.7 0.5
Aug-1 B 5 102 8 5 8.3 0.7 5 436 23 5 5.7 3.2 5 26.2 0.4
Urban Ecosyst (2010) 13:563–582
Aug-1 G 6 107 6 6 8.2 0.4 6 424 12 6 1.4 0.4 6 26.6 0.1
Aug-1 R 4 91 3 4 7.2 0.2 4 391 5 4 2.6 0.3 4 26.0 0.2
Aug-1 S 4 108 10 4 7.8 0.7 4 419 21 4 9.8 4.7 4 25.9 0.4
Aug-1 W 4 120 3 4 9.7 0.4 4 468 2 4 0.7 0.1 4 27.5 0.3
Aug-14 B 5 115 10 5 9.8 0.7 5 403 16 5 1.9 0.2 5 22.8 0.4
Aug-14 G 6 124 9 6 10.5 0.8 6 394 13 6 1.9 0.6 6 23.4 0.2
Aug-14 R 4 114 12 4 9.6 0.8 4 374 8 4 1.0 0.1 4 23.2 0.3
Aug-14 S 4 112 5 4 9.8 0.6 4 386 19 4 1.6 0.5 4 22.7 0.6
Aug-14 W 4 98 3 4 8.3 0.2 4 433 1 4 1.4 0.2 4 22.9 0.1
Aug-31 B 4 143 4 4 12.2 0.5 4 354 17 4 3.3 0.8 4 22.7 0.3
Aug-31 G 4 138 5 4 11.6 0.4 4 349 14 4 4.2 2.1 4 22.5 0.0
Aug-31 R 3 125 5 3 11.4 0.7 3 328 3 3 4.1 2.9 3 22.3 0.5
Aug-31 S 3 129 4 3 11.4 0.7 3 383 30 3 2.0 0.1 3 21.7 0.6
Sep-27 B 4 117 3 4 11.6 0.5 4 323 5 4 1.3 0.2 4 16.6 0.3
Sep-27 G 4 119 3 4 11.3 0.3 4 328 7 4 0.8 0.1 4 16.5 0.1
Sep-27 R 3 119 5 3 11.6 0.5 3 318 1 3 1.1 0.3 3 16.5 0.3
Sep-27 S 3 108 7 3 10.9 0.4 3 323 5 3 1.1 0.2 3 15.8 0.1
571572 Urban Ecosyst (2010) 13:563–582
Table 2 Fish species observed in Dows Lake and the Rideau Canal through a variety of methods. Greyscale
codes as follows; common (black), occasional (dark grey), rare (light grey), never (white)
Name Methods of observation
Verified Angler
Observed from
Observed from
surface (dead)
Angler Catch
surface (live)
Snorkeling
Unverified
Seine Net
Catch
Common Species
Black crappie Pomoxis nigromaculatus
Bluegill Lepomis macrochirus
Bluntnose minnow Pimephales notatus
Brook silverside Labidesthes sicculus
Brown bullhead Ameiurus nebulosus
Common carp Cyprinus carpio
Golden shiner Notemigonus crysoleucas
Largemouth bass Micropterus salmoides
Log perch Percina caprodes
Muskellunge Esox masquinongy
Northern pike Esox lucius
Pumpkinseed Lepomis gibbosus
Rock bass Ambloplites rupestris
Smallmouth bass Micropterus dolomieu
Walleye Sander vitreus
White sucker Catostomus commersoni
Yellow perch Perca flavescens
habitats had the highest levels of diversity (Table 3). Diversity tended to be higher during
the 4th and 6th sampling periods corresponding to mid June and mid July. For evenness,
there was no interaction between date of sampling and habitat (F=1.52, P>0.05), however
there were significant differences for both of these factors independently. Evenness varied
200
Nett
eine N
78
45
117
54
150
es vvia Se
100
Ca
T al C ure
aptu
50
Tota
0
PS
YP
LP
S
S
B
B
BC
H
A
BM
BG
S
B
P
W
BS
R
C
G
LM
SM
O
BB
N
Species
Fig. 2 Fish species encountered during seine net surveys across the study period. Seine net surveys were
conducted at ten sites along the north side of Dows Lake (see Fig. 1). Species observed were bluegill (BG),
pumpkinseed (PS), golden shiner (GS), yellow perch (YP), rock bass (RB), largemouth bass (LMB), log perch
(LP), black crappie (BC), brown bullhead (BBH), white sucker (WS), brook silverside (BSS), smallmouth
bass (SMB), common carp (CA), bluntnose minnow (BM) and northern pike (NOP)Urban Ecosyst (2010) 13:563–582 573 among habitat types (F=3.014, P=0.031) with boulder and silt/sand substrates being the most even. There was also temporal variation in evenness (F=3.04, P=0.005) with evenness being highest early and late during sampling and lowest during the mid summer. There was no interaction between habitat type and time of sampling for total abundance (F=0.967, P>0.05) or a significant effect of time (F=1.72, P=0.102). However, abundance varied by habitat type (F=3.48, P=0.018) with highest fish densities observed in gravel and wall transect habitats. There was a significant interaction for the fish richness between time of sampling and habitat (F=2.30, P
574

Table 3 Diversity metrics for fish populations in Dows Lake and the urban reach of the Rideau Canal in Ottawa across different sampling periods and habitats. Habitats were categorized
as boulder (B), gravel/cobble (G), silt/sand (S), riprap/gabion baskets (R), and canal wall (W). Diversity metrics include Shannon-Wiener diversity index (SW), evenness index (Even.),
total abundance, richness, and% centrarchid fish. Data generated from snorkelling surveys conducted in different habitats. Data presented include means ± 1 SE

Date      Habitat N Mean SW SE SW Mean Even. SE Even. Mean Abund. SE Abund. Mean Richness SE Richness Mean% Centrarchids SE% Centrarchids

May-11 B            5   0.094        0.094     0.886          0.114         2.20             1.46        1.00               0.32            75.0                   25.0
May-11 G            5   0            0         1.000          0             3.40             2.42        0.80               0.20           100.0                     0
May-11 R            4   0.212        0.212     0.973          0.027         2.00             1.35        1.00               0.41           100.0                     0
May-11 S            3   0.604        0.174     0.702          0.083         6.00             0.58        2.33               0.33            93.3                     6.7
May-11 W            4   0            0         1.000          0             3.75             3.09        0.75               0.25           100.0                     0
May-24 B            5   0            0         1.000          0             4.00             2.02        1.00               0              100.0                     0
May-24 G            6   0            0         1.000          0             9.83             8.07        0.67               0.21           100.0                     0
May-24 R            4   NA           NA        NA             NA            0                NA          NA                 NA             NA                      NA
May-24 S            4   0            0         1.000          0             0.50             0.29        0.50               0.29            50.0                   50.0
May-24 W            4   0.187        0.187     0.937          0.063         3.25             1.49        1.00               0.41           100.0                     0
Jun-6     B         5   0.094        0.094     0.886          0.114         6.40             3.41        1.00               0.32           100.0                     0
Jun-6     G         6   0.123        0.081     0.844          0.103         4.33             1.69        1.33               0.21           100.0                     0
Jun-6     R         4   0.159        0.095     0.729          0.161         6.75             2.81        1.50               0.29           100.0                     0
Jun-6     S         4   0.245        0.245     0.890          0.110         3.50             1.85        1.25               0.63            91.7                     8.3
Jun-6     W         4   0            0         1.000          0             4.50             1.50        1.00               0              100.0                     0
Jun-19    B         4   0.625        0.242     0.839          0.060       12.50              5.33        2.50               0.65            93.3                     5.5
Jun-19    G         6   0.549        0.153     0.639          0.103       21.67              5.70        3.00               0.58            91.1                     6.9
Jun-19    R         3   0.273        0.163     0.728          0.186         7.33             3.33        1.67               0.33            97.6                     2.4
Jun-19    S         4   0.078        0.078     0.779          0.221         6.50             3.40        1.00               0.41            97.9                     2.1
Jun-19    W         3   0.892        0.203     0.564          0.078       32.33              2.60        5.00               1.15            89.9                     7.6
Jul-5     B         4   0.430        0.094     0.507          0.144       18.00              7.84        2.50               0.29            86.9                     6.8
Jul-5     G         6   0.348        0.104     0.356          0.080       34.67              9.35        2.67               0.33            93.3                     2.7
                                                                                                                                                                                          Urban Ecosyst (2010) 13:563–582
Jul-5 R 3 0.279 0.279 0.868 0.132 8.33 7.33 2.00 1.00 98.6 1.4
Jul-5 S 4 0 0 1.000 0 4.00 2.12 0.75 0.25 100.0 0
Jul-5 W 4 0.400 0.170 0.418 0.104 24.00 5.46 2.50 0.50 97.0 2.1
Jul-17 B 4 0.460 0.230 0.875 0.125 7.75 3.97 1.50 0.65 78.2 14.8
Jul-17 G 6 0.359 0.116 0.587 0.141 21.83 11.03 2.33 0.42 97.7 2.0
Jul-17 R 2 0.464 0.464 0.922 0.078 9.50 5.50 2.00 1.00 86.7 13.3
Jul-17 S 3 0.689 0.033 0.627 0.030 8.67 4.37 2.00 1.00 89.3 10.7
Jul-17 W 4 0.628 0.155 0.606 0.115 12.50 3.38 2.75 0.25 93.8 4.7
Aug-1 B 3 0 0 1.000 0 6.00 1.73 1.00 0 100.0 0
Urban Ecosyst (2010) 13:563–582
Aug-1 G 5 0.227 0.125 0.656 0.180 21.60 12.54 2.00 0.55 79.2 19.8
Aug-1 R 4 0.116 0.116 0.834 0.166 3.00 2.04 1.00 0.41 100.0 0
Aug-1 S 3 0.347 0.347 1.000 0 4.33 3.38 1.00 0.58 75.0 25.0
Aug-1 W 4 0.537 0.133 0.656 0.183 39.75 23.06 2.50 0.29 91.4 8.3
Aug-14 B 5 0.418 0.148 0.649 0.114 14.00 2.07 2.20 0.37 93.8 3.8
Aug-14 G 6 0.509 0.172 0.858 0.084 10.50 4.32 2.17 0.40 79.9 9.8
Aug-14 R 4 0.610 0.265 0.806 0.168 16.25 7.66 2.50 0.50 99.3 0.7
Aug-14 S 4 0.151 0.151 0.968 0.032 16.75 4.33 1.25 0.25 92.6 7.4
Aug-14 W 4 0 NA 1.000 0 2.75 0.85 1.00 0 100.0 0
Aug-31 B 3 0 NA 1.000 0 6.00 1.73 1.00 0 100.0 0
Aug-31 G 5 0.450 0.169 0.647 0.160 21.60 12.41 2.60 0.51 95.0 3.9
Aug-31 R 4 0.116 0.116 0.834 0.166 3.00 2.04 1.00 0.41 100.0 0
Aug-31 S 3 0.347 0.347 1.000 0 4.33 3.38 1.00 0.58 75.0 25.0
Aug 31 W 4 0.378 0.180 0.676 0.193 39.50 23.19 2.25 0.48 99.8 0.2
Sep-27 B 4 0.254 0.132 0.867 0.173 3.75 2.12 1.50 0.25 97.5 0.6
Sep-27 G 4 0.262 0.202 0.774 0.182 14.75 2.08 1.75 0.43 90.7 7.1
Sep-27 R 3 0 NA 1.000 0 2.60 1.10 1.00 0 100.0 0
Sep 27 S 3 0.316 0.155 0.791 0.169 7.00 1.78 1.66 0.33 73.3 8.4
575576
Table 4 Summary of macrophyte presence (as mean% cover) in during snorkel surveys in Dows Lake and the urban reach of the Rideau Canal in Ottawa across different
sampling periods and habitats. Habitats were categorized as boulder (B), gravel/cobble (G), silt/sand (S), riprap/gabion baskets (R), and canal wall (W)
Date Habitat type N Mean total% cover Mean% cover of primary species*
EM SP TG WS CS BP NS CT Other
May-11 B 5 0.3 0 0 0 0 0 0 0.32 0 0
May-11 G 6 1.3 0 0 0 0 0 0 1.30 0 0
May-11 R 4 0 0 0 0 0 0 0 0 0 0
May-11 S 4 1.7 0 0 0 0 0 0 1.75 0 0
May-11 W 4 0.6 0 0 0 0 0 0 0.65 0 0
May-24 B 5 0 0 0 0 0 0 0 0 0 0
May-24 G 6 0 0 0 0 0 0 0 0 0 0
May-24 R 4 0.1 0 0 0 0 0 0 0.05 0 0
May-24 S 4 0 0 0 0 0 0 0 0 0 0
May-24 W 4 0 0 0 0 0 0 0 0 0 0
Jun-6 B 5 3.6 0 0 0.72 0 0 0.16 2.76 0 0
Jun-6 G 6 3.7 0 0.23 0.07 0 0 0.07 3.37 0 0
Jun-6 R 4 3.6 0.05 0 0.05 0 0 0 3.50 0 0
Jun-6 S 4 15.7 0 14.60 0.80 0 0 0 0.30 0 0
Jun-6 W 4 5.5 0 0.35 0 0 3.75 1.00 0.40 0 0
Jun-19 B 5 10.7 0.24 2.12 1.84 3.92 0.08 2.28 0.08 0 0
Jun-19 G 6 14.5 3.77 5.33 0.23 1.70 0.37 3.17 0 0 0
Jun-19 R 4 2.1 0.2 0.05 0.55 0 0 1.35 0 0 0
Jun-19 S 4 20.9 0.05 16.35 4.45 0 0 0.05 0 0 0
Jun-19 W 4 2.6 0.05 0.20 0 0.05 1.1 1.15 0 0 0
Jul-5 B 4 8.0 2.00 2.25 1.05 0 0 2.60 0.05 0.05 0
Jul-5 G 6 10.3 1.17 1.10 0 0 0 8.13 0 0 0
Urban Ecosyst (2010) 13:563–582
Jul-5 R 4 4.7 0.45 1.10 0.05 0.50 0 2.50 0 0.10 0Jul-5 S 4 25.9 7.75 4.75 12.55 0 0.25 0.10 0 0.25 0
Jul-5 W 4 8.5 0.15 0.10 0 0 0 8.15 0 0.05 0
Jul-17 B 5 7.4 1.72 4.28 1.00 0.08 0 0 0 0.40 0
Jul-17 G 6 7.9 3.60 2.67 0.10 0.27 0 1.27 0 0 0
Jul-17 R 4 4.8 0.40 2.25 1.25 0.40 0 0.50 0 0.05 0
Jul-17 S 4 14.6 0.55 0.25 13.35 0.15 0 0 0 0.30 0
Jul-17 W 4 4.3 0.60 0.70 0 0.25 0 2.65 0 0.10 0
Aug-1 B 5 6.2 0.88 3.76 0.20 1.16 0 0.12 0 0.12 0
Aug-1 G 6 7.6 2.90 1.40 0 1.27 0 1.87 0 0 0.23
Urban Ecosyst (2010) 13:563–582
Aug-1 R 4 8.2 0.40 2.95 0.05 2.15 0 2.25 0 0.45 0
Aug-1 S 4 10.1 0.80 0.05 5.10 2.70 0.05 1.20 0 0.25 0
Aug-1 W 4 4.4 0.70 1.15 0 0.60 0 1.65 0 0.35 0
Aug-14 B 5 10.7 2.68 0.04 4.72 3.28 0 0 0 0.04 0
Aug-14 G 6 4.8 3.67 0.33 0.07 0.70 0 0 0 0.07 0
Aug-14 R 4 1.6 0.60 0.20 0.30 0.20 0 0 0 0.05 0.25
Aug-14 S 4 8.2 0.65 0 6.60 0.75 0 0 0 0.15 0.10
Aug-14 W 3 5.8 1.27 0.20 0 4.00 0 0.27 0 0.07 0
Aug-31 B 4 10.4 2.00 0.20 0.25 8.00 0 0 0 0 0
Aug-31 G 4 15.5 14.75 0 0.25 0.50 0 0 0 0 0
Aug-31 R 2 5.9 0.10 0.30 4.30 0.20 0 0 0 0 1.00
Aug-31 S 3 8.1 1.00 0 3.00 4.10 0 0 0 0 0
Sep-27 B 4 2.0 1.70 0 0.25 0.05 0 0 0 0 0
Sep-27 G 4 8.5 7.35 0 0.60 0.60 0 0 0 0 0
Sep-27 R 3 2.2 0.73 0.07 1.33 0.07 0 0 0 0 0
Sep-27 S 3 4.8 3.47 0.20 1.00 0 0 0 0 0 0.20
EM Eurasian milfoil (Myriophyllum spicatum), SP sago pondweed (Potamogeton pectinatus), TG tape grass (Vallisneria americana), WS water stargrass (Heteranthera dubia),
CS creeping spearwort (Ranunculus flammula), BP bushy pondweed (Najas flexilis), NS needle spikerush (Eleocharis acicularis), CT coontail (Ceratophyllum demersum)
577578 Urban Ecosyst (2010) 13:563–582 obscured five of the transects, and a visible change was observed in the macrophyte populations beneath the mat over the weeks following its appearance. The macrophytes became scarcer and patchier, and the smaller plants seemed to disappear. To assess changes in the plant populations throughout the season, we looked at indices of diversity, richness and evenness. The Shannon-Wiener diversity index shows an increase in species diversity over time (F=7.21, P
Urban Ecosyst (2010) 13:563–582                                                           579

Cooke, unpublished data) which can suspend fine sediments (Bauer 2002), or immediately
following the filling of the canal in the spring or heavy rainfall. The invasive common carp
may have also contributed to turbidity by resuspending fines in localized areas. High
macrophyte density may have further decreased visibility for snorkelers and introduced
some sampling error. It is possible that there were fish species present that were simply not
observed due to the sheer amount of vegetation in some areas in which the fish could avoid
detection. However, on days when turbidity was low across all habitat types, the pattern of
fish diversity tended to mirror those during more turbid periods.
    Water quality did not have a clear influence on fish and macrophyte populations.
Dissolved oxygen levels remained generally high throughout the study season and were
therefore, unlikely to have had a significant effect on fish populations. All fish observed
during our sampling had minimum dissolved oxygen limits that were much lower than the
lowest dissolved oxygen concentrations observed in this study (Davis 1975). Water
temperature increased until mid-summer then decreased as is seasonally expected, and
generally stayed within the known range of preferred temperatures for all species found in
the study area (Wismer and Christie 1987; Coad 2007).
    The fish species found throughout the study area were consistent with the type of fish
usually found throughout this part of Ontario (McAllister and Coad 1975; Coad 2007). The
system was dominated mostly by members of the family Centrarchidae, including bluegill
sunfish (Lepomis macrochirus), pumpkinseed sunfish (Lepomis gibbosus), rock bass
(Ambloplites rupestris), largemouth bass (Micropterus salmoides) and smallmouth bass
(Micropterus dolomieu). The bluegill and pumpkinseed sunfish were the most commonly
seen during snorkel surveys, representing more than 86% of all observations. Collectively,
centrarchids represented 95.5% of all individuals observed during snorkeling, while non-
centrarchids were encountered infrequently. Pumpkinseed sunfish, bluegill sunfish and
largemouth bass were commonly seen spawning during the study period, with many nesting
sites observed within the transects. This centrarchid-dominated community structure is
consistent with the shallow water and heavily vegetated sites observed in our study (Aday
et al. 2009). In general, centrarchids tend to have little preference for substrate except
during the reproductive period (Scott and Crossman 1973). Studies also show that
centrarchids prefer areas where there is little current and relatively clear water (Theiling
et al. 1997), which is also consistent with the Rideau Canal system. Other common fish in
centrarchid-dominated systems are cyprinids (i.e., carp and minnows) and yellow perch
which are all known to be lentic species (Leslie and Timmins 1997; Theiling et al. 1997;
Wang et al. 2003). A study done by Arlinghaus et al. (2002) on fish communities in
European canals indicated that many small fish species or younger individuals prefer
habitats like bays or inlets that are more sheltered from outside disturbance, such as wakes
from large boats or heavy currents flowing through straight portions of canals. These results
are consistent with our observations that many fish species were found in areas of the lake
where shorelines were not generally affected by boat traffic. Also, we observed many
largemouth bass, pumpkinseed and bluegill nesting sites in Agriculture creek and Schramm
Bay, two of the more sheltered areas in Dows Lake. Future studies should also sample fish
in the deeper parts of Dows Lake where larger species like muskellunge (Esox
masquinongy), northern pike (Esox lucius) and walleye (Sander vitreus) might routinely
be found. Indeed, we observed these species on occasion but usually in angler creels
(Table 2). The muskellunge that reside in Dows Lake and the Rideau Canal represent one of
the few urban muskellunge fisheries in the world (Kerr 2007; Gillis et al. 2010). In fact, the
reach that was studied here provides many urban angling opportunities in the City of
Ottawa for a range of species that are appropriate for anglers with different levels of
580 Urban Ecosyst (2010) 13:563–582 specialization and experience. Urban angling opportunities are regarded as providing important societal benefits (Manfredo et al. 1984) and increase the value of the Rideau Canal system. Macrophyte composition did not vary significantly across habitat types, but varied temporally over the summer. The lack of relationship between substrate type and macrophyte community and diversity likely reflects the fact that some organic matter was present in all habitats providing opportunity for plants to root and grow (Aiken and Picard 1980). The dominant plant species changed several times over the study period, a trend previously documented in the adjacent Rideau River (Poulin 2001). In Dows Lake, smaller plant species were dominant throughout the spring and early summer, while larger macrophytes started appearing in early June. This shift in dominance of different sized species (i.e., progression from smaller to larger species) coincided with the appearance of a large weed mat over most of the study area, consisting mainly of uprooted Eurasian water milfoil, sago pondweed, small duckweed and filamentous green algae. The weed mat blocked sunlight from reaching the bottom of the lake, which apparently killed most of the small plant species (Walker, Personal Observation). The high density of aquatic macro- phytes observed in the Rideau Canal may be reflective of the high phosphorus levels in Ottawa reach of the adjacent Rideau River (Poulin 2001) which feeds directly into the canal approx. 1.5 km upstream of our study site. Although we did not measure nutrients in this study, nutrient enrichment has previously been identified as one of the problems facing the Rideau Canal (Wachelka et al. 2000). One of the most abundant species found throughout the entire lake was Eurasian water milfoil. In fact, Eurasian water milfoil has previously been documented as the dominant aquatic macrophyte in a system-wide study in the Rideau in 1987 (Spicer and Catling 1990). Eurasian water milfoil is an invasive species that originated in Europe and Asia and has been in the Rideau system since the mid 1960s (Aiken et al. 1979) and has been known to out-compete local aquatic macrophyte populations (Aiken et al. 1979; Boylen et al. 1999). The dense weed beds and mats in the Rideau Canal can impede navigation and therefore, various agencies have attempted to control aquatic macrophytes in the Rideau Canal. Initially macrophyte control focused on herbicide application (until 1979; RVCA 1979) but more recently management agencies have relied on mechanical harvesting (Spicer and Catling 1990) and broader efforts to reduce nutrient inputs. Overall, the fish community structure in Dows Lake and the urban stretch of the Rideau Canal was found to be relatively simple, and contrary to our prediction, fish diversity was reasonably consistent across all habitat types. Because much of the Rideau Canal in urban environments is characterized by distinct engineered wall habitats and other simple habitats (e.g., rip rap), there is opportunity to enhance structural diversity and potentially enhance biological diversity in the Canal. At present, the annual drainage of the canal, the need to maintain open navigation channels (and associated removal of woody debris), and manicured or urbanized riparian zones are all potentially limiting structural complexity in the littoral zone and represent a somewhat unique series of stressors compared to other centrarchid-dominated systems (Cooke et al. 2009). In addition, there is some evidence of winterkills (one in spring 2006 during this study) which are common phenomena in lentic systems in north temperate regions (Suski and Ridgway 2009). Obviously, any management activities intended to enhance diversity would need to be consistent with other Parks Canada objectives such as those dealing with culture, recreation, navigation, and heritage. Because Parks Canada is mandated to protect ecosystem features in the Rideau Canal that relate directly to the construction of the canal because of their historic and natural value (Parks Canada 2005), there is a need for creative techniques to enhance the complexity of
Urban Ecosyst (2010) 13:563–582                                                                         581

these habitats without altering their historical value or engineering function. Another
pressing issue in this reach of the canal is the dense macrophyte beds that impair navigation
(Parks Canada 2005). The use of mechanical harvesting to control aquatic macrophytes and
maintain open navigation channels is not a long-term solution. As such, there is a need to
reduce nutrient inputs from upstream regions and from urban storm water infrastructure to
reduce the density of aquatic macrophytes. Indeed, reductions of nutrient inputs and
associated decreases in macrophyte biomass could also reduce the frequency and severity of
fish kills (Suski and Ridgway 2009). Regular monitoring of the state of the Rideau Canal
ecosystem, particularly in this urban reach, would be beneficial for evaluating long-term
trends in ecosystem health and diversity. Considering the national significance of this
historic Canal, there is need for more intensive study of the aquatic ecology of the Rideau
Canal in its entirety including evaluations of different operational activities (draining,
filling) and the connectivity of different reaches between the 47 locks.

Acknowledgements Mike Donaldson, Andrew Gingerich, and Samantha Yu assisted with data collection.
Valerie Blazeski of Parks Canada provided valuable logistic support and provided necessary research
permits. Hedrik Wachelka from Muskies Canada provided detailed information on the sportfish in Dows
Lake. Additional information was provided by Brian Bezaire and Lisa Setterington from the City of Ottawa.
Brian Coad of the Canadian Museum of Nature provided historical information on fish records in the Rideau
Canal. Jennifer Doubt from the Museum of Nature helped in the identification of aquatic plant species. Dr.
Nigel Waltho assisted with developing protocols for the underwater visual assessment. The project was
funded primarily by the City of Ottawa. Additional financial support (through the Cooke Laboratory) was
provided by the Campus Work-Study Program.

References

Aday DD, Parkos JJ, Wahl DH (2009) Population and community ecology of Centrarchidae. In: Cooke SJ,
    Philipp DP (eds) Centrarchid fishes: diversity, biology and conservation. Blackwell-Wiley, UK, pp
    134–164
Aiken SG, Picard RR (1980) The influence of substrate on the growth and morphology of Myriophyllum
    exalbescens and Myriophyllum spicatum. Can J Bot 58:1111–1118
Aiken SG, Newroth PR, Wile I (1979) The biology of Canadian weeds—34: Myriophyllum spicatum L. Can
    J Plant Sci 59:201–215
Arlinghaus R, Engelhardt C, Sukhodolov A, Wolter C (2002) Fish recruitment in a canal with intensive
    navigation: implications for ecosystem management. J Fish Biol 61:1386–1402
Bauer BO (2002) Estimating boat-wake-induced levee erosion using sediment suspension measurements. J
    Waterw Port Coast Ocean Eng—ASCE 128:152
Bonaca MO, Lipej L (2005) Factors affecting habitat occupancy of fish assemblage in the Gulf of Trieste
    (Northern Adriatic Sea). Mar Ecol 26:42–53
Borcherding J, Bauerfeld M, Hintzen D, Neumann D (2002) Lateral migrations of fishes between
    floodplain lakes and their drainage channels at the Lower Rhine: diel and seasonal aspects. J Fish
    Biol 61:1154–1170
Boylen CW, Eichler LW, Madsen JD (1999) Loss of native aquatic plant species in a community dominated
    by Eurasian water-milfoil. Hydrobiologia 415:207–211
Brind’Amour A, Boisclair D (2006) Effect of the spatial arrangement of habitat patches on the development
    of fish habitat models in the littoral zone of a Canadian Shield lake. Can J Fish Aquat Sci 63:737–754
Bumsted JM (2003) The peoples of Canada, a pre-confederation history. Oxford University Press, Don Mills
Coad BW (2001) Keys to the fishes of the National Capital Region. Trail Landsc 35:133–166
Coad BW (2007) Fishes of Canada’s National Capital Region. April 9, 2007. Online http://www.briancoad.
    com/NCR/ContentsNCR.htm
Cooke SJ, Hanson KC, Suski CD (2009) Contemporary issues in centrarchid conservation and management.
    In: Cooke SJ, Philipp DP (eds) Centrarchid fishes: diversity, biology and conservation. Blackwell-Wiley,
    UK, pp 340–374
Davis JC (1975) Minimal dissolved oxygen requirements of aquatic life with emphasis on Canadian species:
    a review. J Fish Res Board Can 32:2295–2332
582 Urban Ecosyst (2010) 13:563–582
Day RW, Quinn GP (1989) Comparisons of treatments after an analysis of variance in ecology. Ecol Monogr
59:433–463
Gillis NC, Rapp T, Hasler CT, Wachelka H, Cooke SJ (2010) Spatial ecology of adult muskellunge
(Esox masquinongy) in the urban Ottawa reach of the historic Rideau Canal, Canada. Aquat Liv Res
23:000–000
Kerr SJ (2007) Characteristics of Ontario muskellunge (Esox masquinongy) fisheries based on volunteer
angler diary information. Environ Biol Fishes 79:61–69
Krebs CJ (1989) Ecological methodology. Harper Collins, New York, p 654
Leslie JK, Timmins CA (1997) Early life of fishes in Penetang Harbour, an area of concern in Severn Sound.
Canadian Technical Report of Fisheries and Aquatic Sciences, p 28
Levin M (2006) Life interrupted: the Rideau Canal is an ecological mystery: how does wildlife sustain itself
when its habitat is flushed away year after year? The Ottawa Citizen, Sunday April 30, 2006, p A8
Manfredo MJ, Harris CC, Brown PJ (1984) The social values of an urban recreational fishing experience. In:
Allen LJ (ed) Urban Fishing Symposium Proceedings. American Fisheries Society, Bethesda, pp
156–164
McAllister DE, Coad BW (1975) Fishes of Canada’s National Capital Region/Poissons de la région de la
capital du Canada. Fisheries Research Board of Canada Miscellaneous Special Publication, 24, Ottawa,
Canada
Parks Canada (2005) Rideau Canal National Historic Site of Canada Management Plan. Ottawa, Canada.
R64-257/2005E
Peet RK (1974) The measurement of species diversity. Ann Rev Ecolog Syst 5:285–307
Phelps A, Renaud CB, Chapleau F (1999) Over one hundred years of change within the fish community of
the Rideau River/Canal system, Ontario, Canada. 38th Annual Meeting of the Canadian Society of
Zoologists, University of Ottawa, Ottawa, May 5–8. Abstract
Poulet N, Lek S, Argillier C (2005) Pikeperch habitat use within a canal network in spring. J Fish Biol
67:1460–1474
Poulin M (2001) A multidisciplinary, community-based study of the environmental health of the Rideau
River: final report. Canadian Museum of Nature, Ottawa
RVCA (1979) Rideau valley conservation authority. Report to the Minister, Ministry of Natural Resources
from the Rideau Valley Conservation Authority on the control of aquatic weeds in the Rideau Watershed.
Ottawa, ON
Scott WB, Crossman EJ (1973) Freshwater fishes of Canada. Bulletin 184, Fisheries Research Board of
Canada, Ottawa, p 966
Spicer KW, Catling PM (1990) Vascular aquatic weeds of the Rideau Canal, Southeastern Ontario. Technical
Bulletin 1990-3E. Research Branch, Agriculture Canada, Ottawa
Suski CD, Ridgway MS (2009) Winter biology of centrarchid fishes. In: Cooke SJ, Philipp DP (eds)
Centrarchid fishes: diversity, biology and conservation. Blackwell-Wiley, UK, pp 264–292
Theiling CH, Maher RJ, Sparks RE (1997) Effects of variable annual hydrology on a river regulated for
navigation: Pool 26, upper Mississippi River system. J Freshw Ecol 11:101–114
Wachelka H, Lascelles M, Loewen M (2000) Scoping report on fish and terrestrial habitat and water quality
along the Rideau River. Report prepared for the Rideau River Roundtable and the Canadian Biodiversity
Institute. Ottawa
Wang L, Lyons J, Rasmussen P, Seelbach P, Simon T, Wiley M, Kenehl P, Baker E, Niemela S, Stewart PM
(2003) Watershed, reach and riparian influences on stream fish assemblages in the Northern Lakes and
Forest Ecoregion, USA. Can J Fish Aquat Sci 60:491–505
Washington HG (1984) Diversity, biotic and similarity indices: A review with special relevance to aquatic
ecosystems. Water Res 18:653–694
Wentworth CK (1922) A scale of grade and class terms for clastic sediments. J Geol 30:377–392
Wismer DA, Christie AE (1987) Temperature relationships of Great Lakes fishes: a data compilation. Special
Publication No. 87-3. Great Lakes Fishery Commission, Ann ArborYou can also read


