Biophony in a noisy tropical urban forest fragment
←
→
Page content transcription
If your browser does not render page correctly, please read the page content below
DOI: 10.21068/c2021.v22n01a06                                                                 Gonçalves-Santo et al.

      Biophony in a noisy tropical urban forest
      fragment
      Biofonía en un ruidoso fragmento de bosque urbano tropical
      Sara Gonçalves Santos             , Nadia Pieretti     , Robert John Young          , Marina Duarte

      Abstract

      Anthropogenic noise, which is part of an urban soundscape, can negatively affect the behaviour of wild animals.
      Here we investigated how biophony (animal sounds) was affected by noise in an urban Brazilian forest frag-
      ment. Our hypothesis was that noise and biophony would differ between the border and the centre of the forest
      fragment (i.e., lower biophony predicted in noisy areas). Two passive acoustic monitoring devices were used
      to record soundscapes one week per month, 24 hour per day, from May to July 2012. The Acoustic Complexity
      Index (ACI) was used to quantify biophony and the Power Spectral Density (PSD) to quantify urban noise. PSD
      and ACI were higher on the border than in the centre of the fragment. PSD was lower in July, while the ACI did
      not significantly vary between months. Noise levels were also higher on the border. Conversely, potential spe-
      cies richness was higher in the centre of the forest fragment. Higher biophony at noisy sites can be interpreted
      as behavioural responses of species for communicating in noisy areas. Alternatively, they could be the result of
      species segregation by degree of vocal plasticity or due to differences in composition of communities.

      Keywords. Animal communication. Ecoacoustics. Noise. Soundscapes. Urban environment.

      Resumen
      El ruido antropogénico, que forma parte de un paisaje sonoro urbano, puede afectar negativamente el compor-
      tamiento de los animales En este estudio investigamos cómo la biofonía (sonidos de animales) se vió afectada
      por el ruido antropogénico en un fragmento de bosque urbano brasileño. Nuestra hipótesis es que el ruido y la
      biofonía difiren entre el borde y el centro del fragmento de bosque (es decir, una menor biofonía en áreas ruido-
      sas). Se usaron dos dispositivos de monitoreo acústico pasivo para grabar paisajes sonoros una semana al mes,
      24 horas al día, de mayo a julio de 2012. El índice de complejidad acústica (ACI) se usó para cuantificar la bio-
      fonía y la densidad espectral de potencia (PSD) para cuantificar el ruido urbano. Se obtucieron mayores valores
      de PSD y ACI en el borde que en el centro del fragmento. La PSD fue menor en julio, mientras que el ACI no
      varió significativamente entre meses. Los niveles de ruido también fueron más altos en el borde, mientras que
      la riqueza potencial de especies fue mayor en el centro del fragmento de bosque. Una mayor biofonía en áreas
      ruidosas puede ser interpretada como el efecto de respuestas conductuales de las especies con el fin de establecer
      una comunicación efectiva. Alternativamente, podrían ser el resultado de la segregación de especies por grado
      de plasticidad vocal o debido a diferencias en la composición de las comunidades.

      Palabras clave. Ambienteurbano. Comunicación animal. Ecoacústica. Paisajes sonoros. Ruido.

96   | Biota Colombiana 22 (1) - 2021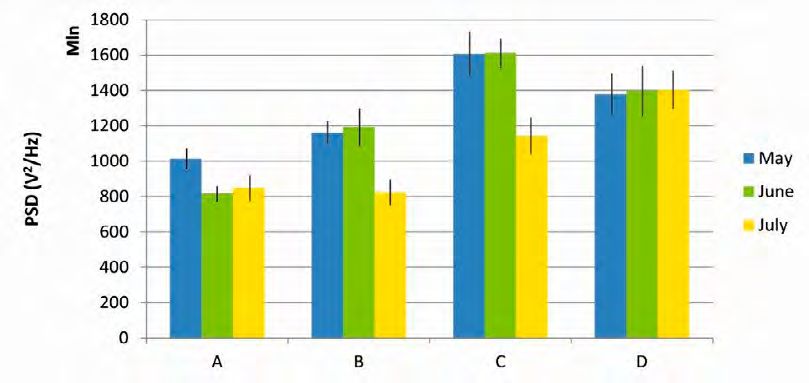
Gonçalves-Santo et al.                                                       Biophony in a noisy tropical urban forest fragment

Introduction                                                     Tolentino et al., 2018). Studies on the impact of noise
                                                                 pollution on animals are important because they can
Several studies have shown that noise pollution can              drive the elaboration of management strategies and
affect the behaviour, reproduction and survival of               conservation of urban forests, which are wildlife re-
wild animals living in cities (Slabbekoorn & Peet, 2003;         fuges (Barber et al., 2009; Duarte et al., 2011; Teixeira
Warren et al., 2006; Bonier et al., 2007; Duarte et al.,         et al., 2015; Santos et al., 2017).
2011; Santos et al., 2017). However, most of these stu-
dies are experimental and made under controlled con-             In the present study, we investigated the soundsca-
ditions, usually with a single species (Berger-Tal et al.,       pe comparing biophony and noise levels (i.e., sound
2019). Few studies have addressed the impact of noise            pressure levels) between the border and the centre of
pollution at a broader ecological level, the communi-            a tropical urban forest fragment. We also identified
ty, by using an ecoacoustics approach. Ecoacoustics              and quantified the number of species calling at both
investigates all the sound sources (the soundscape) as           sites. Our hypothesis was that noise and biophony le-
a means conveying important information about the                vels would differ significantly between the two sites.
ecological status of ecosystems (Sueur & Farina, 2015).          We predicted higher levels of biophony and potential
                                                                 species richness where noise was lower.
According to Schafer (1977), sounds are ecological pro-
perties of landscapes, and soundscapes are the acous-
tic characteristics of an area that reflect natural and          Materials and methods
anthropogenic processes. A soundscape is formed
by three acoustic components: biophony (biological               General considerations on passive acoustic mo-
sounds such as animal vocalizations), geophony (na-              nitoring (PAM).
tural non-biological sounds, such as that produced by
wind, rain, and thunder) and anthropophony (sounds               Passive acoustic monitoring is a method used in the
generated by humans such as traffic noise; Pijanowski et         study of soundscape ecology, both in terrestrial and
al., 2011). The study of soundscapes can provide valuable        aquatic environments. Acoustic sensors can record
information on animal communication dynamics, help               sounds for prolonged periods and produce a massive
the assessment of the environmental status of habitats           amount of data. Several acoustic indexes have been de-
and their spatiotemporal variations, and investigate the         veloped to optimize data analysis and extract relevant
noise effects on different ecosystems (Pieretti et al., 2011).   ecological information from such recordings. Among
                                                                 them, the acoustic complexity index (ACI) has the pur-
All habitats have some level of anthropogenic noise,             pose of quantifying biophony by processing the intensi-
but urban sounds produced by cars, motorcycles, tra-             ties of the vocalizations recorded in audio files, even in
ins, and airplanes, in addition to the sounds produced           the presence of continuous anthropogenic noise (Pieretti
in buildings and industries, are significantly different         et al., 2011). By providing an estimate of the amount of
from most natural sounds because most of their ener-             biophony in an environment, the ACI has proven to be
gy is concentrated in low frequencies (below 2000 Hz)            a useful tool to evaluate behavioural changes and de-
and has longer duration (Warren et al., 2006; Brumm,             fine the composition of an animal community (Pieretti
2006; Slabbekoorn & Ripmeester, 2008). High noise le-            et al., 2011; Farina et al., 2011a).
vels can mask animal acoustic signals, such as sounds
from reproductive partners, alarm calls, parental care           Study area. This study was conducted in an urban tro-
and territorial defense songs (Brumm et al., 2004; San-          pical forest fragment located inside the campus of the
tos et al., 2017). The masking effect can force species to       Pontifical Catholic University (PUC) of Minas Gerais,
use compensatory mechanisms to vocally communi-                  in the Northwest Zone of Belo Horizonte, Minas Ge-
cate or abandon noisy areas (Nemeth & Brumm, 2009;               rais, Brazil (19º55’10 S 43º59’31 W; Figure 1). The ele-
Santos et al., 2017). A common behavioural adaptation            vation of the area ranges from 870 to 930 m above sea
employed to overcome masking consists in increasing              level. The PUC forest is a remnant fragment of Atlantic
the amplitude of calls, a response known as Lombard              forest of 66 755 m², characterized as a semideciduous
Effect (Brumm & Zollinger, 2011). Additionally, many             seasonal secondary forest with many species of insects,
species have been found to change the features of the            anurans, reptiles, birds (approximately 134 species,
calls, such as frequency, duration, number of notes in           see Vasconcelos et al., 2013) and mammals. Current-
noisy places (Warren et al., 2006; Duarte et al., 2017;          ly, this area is surrounded by a densely anthropized

                                                                                                Biota Colombiana 22 (1) - 2021 |   97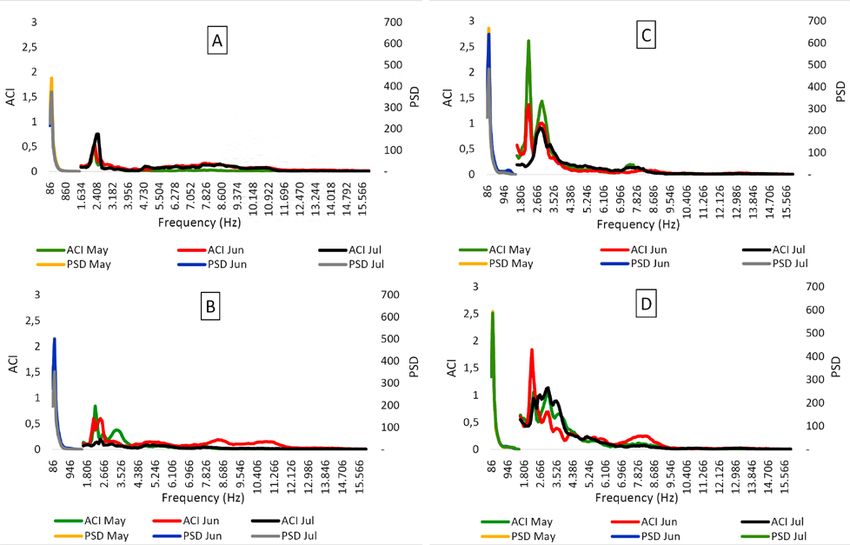
DOI: 10.21068/c2021.v22n01a06                                                                         Gonçalves-Santo et al.

      urban matrix, which hampers or prevents the disper-            flat frequency response of 0.020–20 kHz, sensitivity of
      sal of many species to other fragments. A museum of            -36 ± 4 dB and a signal to noise ratio of >62 dB.
      Natural Sciences, a sport centre and a small airport
      (Aeroporto Carlos Prates in activity since 1944) are           We also conducted two 15-minute measurements of
      located in the area surrounding the forest fragment            the background sound pressure levels once per month
      (i.e. within 2 km radius).                                     at each recording point, using a Z-weighted B&K2270
                                                                     sound level meter. All the animal sounds close to the
      Data collection. The data were collected using two pas-        microphone were excluded from the recordings using
      sive acoustic monitoring sensors (Song Meter Digital           the BZ5503 software (Bruel and Kjaer, Denmark). The
      Field Recorder -SM2- Wildlife Acoustics, Inc., USA) ins-       equivalent sound levels (Leq), which are the standard
      talled at 1.5 m height above ground level in the central       for sound-pollution measurements, were then calcula-
      area (points A and B) and other two on the border of the       ted (Rossing, 2007).
      forest fragment (points C and D; Figure 1). To prevent
      overlap of the sound recorded (i.e., to ensure indepen-        Together with noise, species richness and species abun-
      dence of data sources), the distance between each SM2s         dance could influence acoustic differences between bor-
      in the centre and border stations was 80 meters. The           der and centre of the forest fragment. Unfortunately,
      distance between the stations (centre and border) was          abundance is difficult to evaluate using PAM (Duarte
      approximately 300 meters. The distances between the            et al., 2015). Therefore, potential species richness was
      SM2s and roads were 30 meters for the border station           calculated for each site using aural identification (i.e.,
      and 100 meters for the centre station (Figure 1). Similar      manual) of animal sounds. This analysis was done using
      distances were tested and published in our previous            spectrograms created in Raven Pro 1.5 software. One
      studies in Atlantic forest areas (Duarte et al., 2015). SM2    day (24 hours) per recording session was randomly
      were configured to record 24 hours per day, one week           selected from each sampling point for species’ identi-
      per month, during three consecutive months, from May           fication surveys. Sounds emitted by insects, anurans,
      to July 2012. In May, data were collected between the          birds and mammals were identified by taxon group
      24th and 31st, in June from the 21st to the 28th, and in       specialists who visually and aurally inspected the first
      July from the 24th to the 31st. The devices recorded by        three-minutes of every quarter hour. Where the sounds
      using a sampling rate of 44.1 kHz, 36 dB microphone            could not be associated to a particular species, they were
      gain, wave format files and on stereo channel using            classified as sound types in order to determine the po-
      two omnidirectional waterproof microphones with a              tential number of species at each site.

      Figure 1. Sampling points for biophony at the Pontifical Catholic University forest fragment, Belo Horizonte, Minas Gerais,
      Brazil. A and B represent the centre, and C and D the forest border .

98   | Biota Colombiana 22 (1) - 2021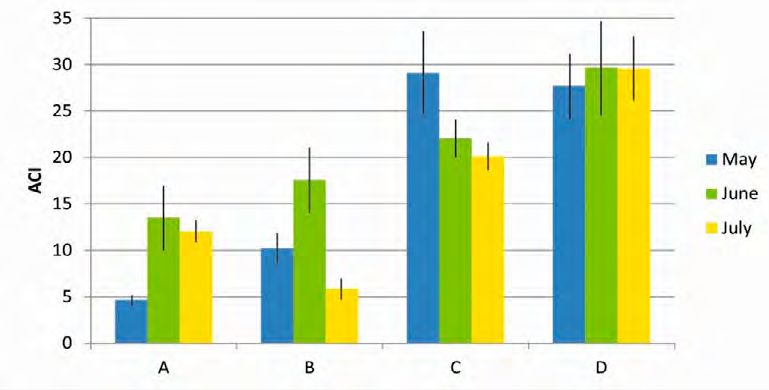
Gonçalves-Santo et al. Biophony in a noisy tropical urban forest fragment
Data analysis. All files were processed via the ACI variables, avoiding negative numbers, normalizing
(Pieretti et al. 2011) to obtain a measure of biophony. the data and increasing the importance of the smaller
Anthropogenic noise was quantified using the power values (Manly, 1997). Subsequently, Pearson’s corre-
spectral density (PSD). ACI and PSD were extracted lations and ANOVA tests (Dunn post hoc test) were
using Wavesurfer software (Sjölander & Beskow, performed.
2000).
The ACI metrics, like other indices created to operate Results
in soundscape analysis, are based on the fact that there
is a strict and direct relationship between the comple- The soundscape of the study area was dominated by
xity of animal communities, and the spectral and tem- biophony and anthropogenic noise. Biophony was emi-
poral complexity of a soundscape. In other words, the tted by 12 potential insect species, 21 of bird taxa, one
acoustic information expressed by the ACI is greater marmoset species (Callithrix penicillata) and three po-
in a location where there are more individuals and/or tential species of bats (Tables 1 and 2). The main noise
more species. (Farina et al., 2011b). The ACI algorithm sources affecting the area came from a small airport, ve-
has already been successfully applied in terrestrial ha- hicular traffic, and from the nearby university (Table 3).
bitats (Pieretti & Farina, 2013; Bobryk et al., 2015), in- Some of the noises identified were: helicopters, airpla-
cluding forest fragments in neotropics (Pieretti et al., nes, sirens, horns, motorcycles, sports games, lawn-
2015; Duarte et al., 2015). mowers and people’s conversations.
The power spectral density is a quantitative measu- Biophony. ACI was significantly higher at the bor-
re of the acoustic energy of the environmental sounds der than at the centre of the forest (F = 83.6, DF = 1,
expressed per unit frequency (Duarte et al., 2015). It is MS = 3.86, P < 0.01; Figure 3). No significant differen-
commonly used to obtain the distribution of the power ce was found between the months sampled (F = 1708,
across the frequency domain. At low frequencies, the DF = 2, MS = 0.145, P = 0.18).
acoustic energies at our study sites were mainly driven
by urban noise pollution. Consequently, the PSD was Biophony vs noise. The border of the forest fragment
used as an indicator of anthropogenic noise. presented both higher noise values (i.e. PSD) and grea-
ter biophony (i.e. ACI) in relation to the centre. The ACI
The sampling points were grouped in central area and PSD values presented a medium strength positi-
(points A and B) and border area (points C and D). ve correlation, demonstrating that the higher the noi-
Recordings were subsampled analyzing three minutes se, the greater the biophony (r = 0.56; N = 96, P< 0.01;
of every fifteen minutes, totalizing 403.2 hours. To cal- Figure 5).
culate the ACI, the Fast Fourier Transform–FFT of 512
points was used (frequency bin: 86Hz; temporal step: Potential species richness. Acoustic diversity of sound
0.01s). A one-second grouping value was used, in or- types was found to be higher at sampling points in the
der to obtain one ACI value at every second for every centre of the forest fragment (Table 2).
frequency bin, successively averaged over the lenght
of the recording (three minutes). Sounds concentrated Noise – Equivalent levels (Leq). As expected, noise
below 1550 Hz were measured by summing PSD values levels were higher on the border (Leq max 70 dB (Z))
in the relative frequency bins (expressed in V2 Hz−1). than in the central area (Leq max 64.1 dB (Z); Table 3).
ACI values (from 1550 to 16 000 Hz) were considered
as biophony, emitted by insects, birds and mammals Noise – Power Spectral Density (PSD). Accordingly,
(Figure 2). Temporal distribution of both PSD and ACI PSD values at the border were significantly higher than
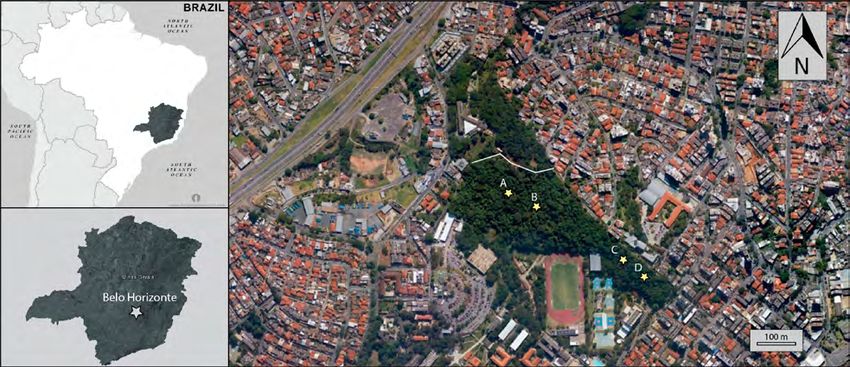
were carried out. in the centre of the forest fragment (F = 85.67, DF = 1,
MS = 0.657, PDOI: 10.21068/c2021.v22n01a06 Gonçalves-Santo et al.
Figure 2. Spectrograms of the soundscape recorded at the border of the Pontifical Catholic University forest fragment, Belo
Horizonte, Minas Gerais, Brazil.. Frequencies below 1550 Hz are filled by noise and biophony (insects, and bird songs) was
concentrated between 1550 to 16000 Hz.
100 | Biota Colombiana 22 (1) - 2021Gonçalves-Santo et al. Biophony in a noisy tropical urban forest fragment
Figure 3. Biophony values (Acoustic Complexity Index–ACI) in the centre (A and B) and in the border (C and D) of the
Pontifical Catholic University forest, Belo Horizonte, Minas Gerais, Brazil.
Figure 4. Biophony (ACI) and noise (PSD) values distributed across frequency bands for the sites in the centre (A and B) and
border (C and D) of the Pontifical Catholic University forest, Belo Horizonte, Minas Gerais, Brazil.
Biota Colombiana 22 (1) - 2021 | 101DOI: 10.21068/c2021.v22n01a06 Gonçalves-Santo et al.
Table 1. Potential number of species at border and centre sites of an urban tropical forest fragment in Belo Horizonte, Minas
Gerais, Southeast Brazil.
Species detected only Species detected
Taxonomic group Border Centre Species in common
at the border only in the centre
Insects 8 12 5 3 7
Birds 14 21 10 4 11
Bats 3 3 3 - -
Primates 1 1 1 - -
Table 2. Bird species recorded by passive acoustic monitoring at an urban forest fragment in Minas Gerais, Southeast Brazil.
NI, unidentifed species.
Bird species Border Centre
Columba livia X X
Elaenia sp. X
Hemithraupis ruficapilla X
Herpsilochmus atricapillus X
Passer domesticus X X
Patagioenas picazuro X
Pitangus sulphuratus X X
Saltator similis X
Sicalis flaveola X X
Tangara cayana X X
Tolmomyias sulphurescens X X
Turdus leucomelas X X
Turdus sp. X X
Thraupidae 1 X X
Thraupidae 2 X X
Thraupidae 3 X
Thraupidae 4 X X
NI 1 X X
NI 2 X X
NI 3 X
NI 4 X X
102 | Biota Colombiana 22 (1) - 2021Gonçalves-Santo et al. Biophony in a noisy tropical urban forest fragment
Table 3. Mean noise (sound pressure) level at the border and the centre of an urban tropical forest fragment in Belo Horizon-
te, Minas Gerais, Southeast Brazil.
Site Leq dB(Z) Leq max dB(Z) Leq min dB(Z)
Border 65.4 70.0 54.7
Centre 59.6 64.1 52.7
Figure 5. Noise values (Power spectral density–PSD) in the centre (A and B) and in the border (C and D) of the Pontifical Ca-
tholic University forest fragment, Belo Horizonte, Minas Gerais, Brazil.
Discussion Since we found a higher number of sound types in the
centre of the forest, which suggests higher species rich-
Our findings can be interpreted as changes in the acous- ness, it is likely that the animal community at the border
tic behaviour of species due to noise, but they could also has changed its vocal behaviour by increasing amplitu-
be the result of species segregation by degree of vocal de, and/or the calling rate and duration of their calls as
plasticity (i.e. ability to adapt) or even of differences in a form of adaptation to compensate for the noise. Studies
composition of communities.Our results showed that with birds and mammals have shown that animals are
background noise is almost 6 dB (Leq) higher at the able to increase the amplitude of their vocalizations in
border points. In acoustics, an increase of 3 dB dou- noisy areas; this is known as the Lombard Effect (Cynx
bles the sound intensity (Rossing, 2007). Higher noise et al., 1998; Brumm et al., 2004; Brumm & Slater, 2006).
levels at the border of the forest were expected due to Our previous study on the effects of mining truck traffic
the vicinity of sound sources, such as streets and buil- on cricket calling activity showed that species in noisy
dings. Other studies have obtained similar results in sites emit calls with higher average power, an indicator
Southeast Brazil, recording higher noise values on the of sound intensity levels (Duarte et al., 2019).
border of an urban park (Duarte et al., 2011) and in an
Atlantic forest fragment (Duarte et al., 2015; 2017). This Since the ACI uses the variation of amplitude in each
result may be due to many factors, for example, higher frequency band to calculate biophony, the increase in
abundance of individuals at the border, or an attempt the amplitude of vocalizations can generate higher
by animals to use compensatory mechanisms to com- values of this index (Zhao et al. 2019). Other types of
municate in noisy areas. noise compensatory mechanisms such as repetition of
Biota Colombiana 22 (1) - 2021 | 103DOI: 10.21068/c2021.v22n01a06 Gonçalves-Santo et al.
notes, syllables, increased call rate might also influen- sound types in the centre of the forest, where biophony
ce the values of the ACI (Brumm et al., 2004; Sun & was lower. Similar results were found close to an open-
Narins, 2005). Other studies have found animals exhi- cast mine in Brazil (Duarte et al., 2015). Studies on the
biting greater acoustic activity in noisier areas. Pieretti edge effect in a community of birds indicate that there
& Farina (2013) showed that both ACI values and noi- is a tendency for lower species richness and density at
se were significantly higher with increasing proximity the edges of forests (Kroodsma, 1982; Laurance, 2004).
to a road, suggesting a more active singing/vocalising Perillo et al., (2017) found lower bird species richness
community in those sites where noise was more inten- in areas with higher noise levels in urban green areas
se. Duarte et al., (2015) also found higher ACI values in Belo Horizonte, Minas Gerais, Brazil. These eviden-
throughout the day in a noisy area, despite having less ces do not support the hypothesis that higher levels of
species compared to a silent area, indicating the possi- biophony in our border sites might be linked to higher
ble use of compensatory mechanisms to communicate species richness or abundance.
in presence of noise.
In our study, we registered lower noise levels in July
The direct energetic cost of vocal behaviour includes compared to other months. Indeed, this month corres-
the energy required to produce the sound as well as ponds to the university’s major vacation period, with
the energy lost by not feeding during the time spent in less students attending the nearby sport centre and,
vocalizations (Deecke et al., 2005). However, the indirect consequently, less noise produced by cars and buses,
costs of acoustic communication include the possibili- whistles, sport noises and people talking. Contrarily,
ty of passing information to unwanted receivers, such biophony values did not vary over the three months
as competitors (Hammond & Bailey 2003), predators of data collection. Since the data were collected during
(Hosken et al., 1994; Mougeot & Bretagnolle, 2000) and three months of the same season (dry), we did not ex-
parasites (Muller & Robert, 2002). A study found that pect variation in acoustic activity of the animals during
an urban bird can vocalize up to 70 dB in response to the months studied.
varying noise levels (Díaz et al., 2011). However, vocal
activity declined sharply above the threshold of 70 dB, Our findings showed that the impact of noise on the fau-
which suggests that this strategy is costly for birds. This na can be acoustically monitored by measuring altered
study further suggests that bird populations in noisy en- biophonic activity. Our results show how the relation
vironments, such as cities, may face a greater challenge between biophony, soniferous species richness, and an-
for survival compared to those in quiet areas, even for thropogenic noise is complex, mainly at a local scale. We
species that can mitigate the interference of urban noise suggest the use of ecoacoustics for future studies since
in their acoustic communication (Díaz et al., 2011). Thus, it can be useful for interpreting anthropogenic distur-
in our study it is possible that animals were spending bances and help the development of adequate urban
excessive energy in their communication. management and conservation strategies.
Pieretti & Farina (2013) consider the possibility of birds
remaining segregated between noisy and silent areas Acknowledgements
based on their vocal plasticity and on the ability to in-
crease their song production. Thus, individuals gene- We are grateful to Marina Scarpelli and Miguel Cança-
tically predisposed to produce intense vocalization do for their help during data acquisition. We thank
behaviour can tolerate anthropogenic noise and live also the anonymous referees for their comments and
in noisy places, while others that are more sensitive to suggestions on this manuscript. The authors would like
noise prefer to live in quieter areas. It might be possi- to thank the Brazilian Council for Scientific and Tech-
ble that the animals that vocalized on the border of our nological Development (CNPq) for their continuing
study site were more noise tolerant and thus continued support. RJY was financially supported by CNPq and
vocalizing, despite high levels of anthropogenic noise. the Minas Gerais Research Foundation (FAPEMIG–
However, it is also possible that the higher biophony at PPM). S.G.S was supported by a FAPEMIG postgra-
the border was related to a difference in animal commu- duate scholarship and M.H.L.D was supported by the
nity compositions between the border and the centre of Brazilian Coordination for the Improvement of Higher
the forest. Greater species richness singing at the border Education Personnel (CAPES–PNPD20131384) during
would also be responsible for a greater acoustic activity this research. This study was funded competitively by
at the border. However, we found higher diversity of FAPEMIG from a financial donation made by VALE.
104 | Biota Colombiana 22 (1) - 2021Gonçalves-Santo et al. Biophony in a noisy tropical urban forest fragment
References Duarte, M. H. L., Vecci, M. A., Hirsch A. & Young R. J.
(2011). Noisy human neighbours affect where urban
Barber, J. R., Crooks, K. R. & Fistrup, K. M. (2009). The monkeys live. Biology Letters, 7, 840-842.
costs of chronic noise exposure for terrestrial orga- https://doi.org/10.1098/rsbl.2011.0529
nisms. Trends in Ecology and Evolution, 25, 180-189. Duarte, M.H.L., Kaizer, M.C., Young, R.J., Rodrigues
https://doi.org/10.1016/j.tree.2009.08.002 M. & Sousa-Lima, R.S. (2017). Mining noise affects
Berger-Tal, O., Wong, B.B.M, Candolin, U. & Barber loud call structures and emission patterns of wild
J. (2019). What evidence exists on the effects of an- black-fronted titi monkeys. Primates, 59, 89-97.
thropogenic noise on acoustic communication in https://doi.org/10.1007/s10329-017-0629-4
animals? A systematic map protocol. Enviromental Duarte, M.H.L., Sousa-Lima, R.S, Young, R.J. Farina,
Evidence, 8, 18-25. A., Vasconcelos, M., Rodrigues, M. & Pieretti, N.
https://doi.org/10.1186/s13750-019-0165-3 (2015). The impact of noise from open-cast mining
Bobryk, W.C., Rega, C.C., Bardhan, S., Farina, A., He, on Atlantic forest biophony. Biological Conservation,
H.S. & Jose, S. (2015). Utility of soundscape assess- 191, 623-631.
ment for understanding conservation benefits of https://doi.org/10.1016/j.biocon.2015.08.006
temperate agroforestry systems. Agroforest Systems, Duarte, M.H.L., Caliari, E.P., Scarpelli, M.D., Lobregat,
6,997-1008. G.O., Young,R.J., & Sousa-Lima, R.S. (2019). Effects
Bonier, F., Martin, P.R. & Sheldon, K.S. (2007). Sex-spe- of mining truck traffic on cricket calling activity. The
cific consequences of life in the city. Behavioral Eco- Journal of the Acoustical Society of America, 146, 656-
logy, 18, 121-129. 664.
https://doi.org/10.1093/beheco/arl050 https://doi.org/10.1121/1.5119125
Brumm, H., Voss, K., Kollmer, I. & Todt, D. (2004). Farina, A., Pieretti, N. & Piccioli, L. (2011a). The sounds-
Acoustic communication in noise: regulation of call cape methodology for long-term bird monitoring: A
characteristics in a New World monkey. Journal of Mediterranean Europe case-study. Ecological Infor-
Experimental Biology, 207, 443-448. matics, 6, 354-363.
https://doi.org/10.1242/jeb.00768 https://doi.org/10.1016/j.ecoinf.2011.07.004
Brumm, H. (2006). Signaling through acoustic win- Farina, A., Lattanzi, E., Malavasi, R., Pieretti, N. & Pic-
dows: nightingales avoid interspecific competition cioli, L. (2011b). Avian soundscapes and cognitive
by short-term adjustment of song timing. Journal of landscapes: theory, application and ecological pers-
Comparative Physiology, 12, 1279-1285. pectives. Landscape Ecology, 26, 1257-1267.
https://doi.org/10.1007/s00359-006-0158-x https://doi.org/10.1007/s10980-011-9617-z
Brumm, H. & Slater, P.J.B. (2006). Animals can vary Hammond, T. J. & Bailey, W. J. (2003). Eavesdropping
signal amplitude with receiver distance: evidence and defensive auditory masking in an Australian
from zebra finch song. Animal Behaviour, 71, 699-705. bushcricket, Caedicia (Phaneropterinae: Tettigonii-
https://doi.org/10.1016/j.anbehav.2006.01.020 dae: Orthoptera). Animal Behaviour, 140, 79-95.
Brumm, H. & Zollinger, S., A. (2011). The evolution of https://doi.org/10.1163/156853903763999917
the Lombard effect: 100 years of psychoacoustic re- Hosken, D. J., Bailey, W. J., Oshea, J. E. & Roberts, J.
search. Behaviour, 148, 1173-1198 D. (1994). Localization of insect calls by the bat
https://doi.org/10.1163/000579511X605759 Nyctophilus geoffroyi (Chiroptera, Vespertilionidae):
Cynx, J., Lewis, R., Tavel, B. & Tse, H. (1998). Amplitu- a laboratory study. Australian Journal of Zoology, 42,
de regulation of vocalizations in noise by a songbird 177-184.
Taeniopygia guttata. Animal Behaviour, 56, 107-113. Kroodsma, R.L. (1982). Edge effect on breeding forest
https://doi.org/10.1006/anbe.1998.0746 birds along a power-line corridor. Journal of Applied
Deecke, V. B., Ford, J. K. B. & Slater, P. J. B. (2005). The Ecology, 19, 361-370.
vocal behaviour of mammal-eating killer whales: Laurance, S.G., Stouffer, P.C. & Laurance, W.F. (2004).
communicating with costly calls. Animal. Behaviour, Effects of road clearings on movement patterns of
69, 395-405. understory rainforest birds in central Amazonia.
https://doi.org/10.1016/j.anbehav.2004.04.014 Conservation Biology, 18, 1099-1109.
Díaz, M.; Parra, A. & Gallardo C. (2011). Serins respond Manly, B. F. (1997). Randomization, Bootstrap, and Mon-
to anthropogenic noise by increasing vocal activity. te Carlo Methods in Biology. London, UK: Chapman
Behavioral Ecology, 22, 332-336. and Hall.480pp.
https://doi.org/10.1093/beheco/arq210
Biota Colombiana 22 (1) - 2021 | 105DOI: 10.21068/c2021.v22n01a06 Gonçalves-Santo et al.
Mougeot, F. & Bretagnolle, V. (2000). Predation as a Schafer, R. M. (1977). The Tuning of the World. Knopf.
cost of sexual communication in nocturnal seabirds: Michigan University.
an experimental approach using acoustic signals. Sjölander, K. & Beskow, J. (2000). Wavesurfer: an open
Animal Behaviour, 60, 647-656. source speech tool. Interspeech, 464-467.
https://doi.org/10.1006/anbe.2000.1491 Slabbekoorn, H. & Peet, M. (2003). Birds sing at a higher
Muller, P., & Robert, D. (2002). Death comes suddenly pitch in urban noise. Nature, 424, 267.
to the unprepared: singing crickets, call fragmen- https://doi.org/10.1038/424267a
tation, and parasitoid flies. Behavioral Ecology, 13, Slabbekoorn, H. & Ripmeester, E. A. (2008). Birdsong
598-606. and anthropogenic noise: implications and applica-
https://doi.org/10.1093/beheco/13.5.598 tions for conservation. Molecular Ecology, 17, 72-83.
Nemeth, E., and Brumm, H. (2009). Blackbirds sing hi- https://doi.org/10.1111/j.1365-294X.2007.03487.x
gher-pitched songs in cities: adaptation to habitat Sueur, J. & Farina, A. (2015). Ecoacoustics: the ecologi-
acoustics or side-effect of urbanization? Animal Be- cal investigation and interpretation of environmen-
haviour, 78, 637-641. tal sound. Biosemiotics, 8,493–502.
https://doi.org/10.1016/j.anbehav.2009.06.016 https://doi.org/10.1007/s12304-015-9248-x
Perillo, A., Mazzoni, L.G., Passos,L.F., Goulart,V. D. L. Sun, J. W. C. & Narins, P. M. (2005). Anthropogenic
R., Duca, C. & Young, R.J. (2017). Anthropogenic sounds differentially affect amphibian call rate.
noise reduces bird species richness and diversity in Biological Conservation, 121, 419-427.
urban parks, Ibis, 159, 638–646. https://doi.org/10.1016/j.biocon.2004.05.017
https://doi.org/10.1111/ibi.12481 Teixeira, B., Hirsch,A. Goulart,V. D. L. R., Passos,L.,
Pieretti, N., Farina, A. & Morri, D. (2011). A new me- Teixeira,C.P. James, P. & Young, R.J.(2015). Good
thodology to infer the singing activity of an avian neighbours: distribution of black-tufted marmoset
community: The Acoustic Complexity Index (ACI). (Callithrix penicillata) in an urban environment. Wild-
life Research, 42, 579-589.
Ecological Indicators, 11, 868-873.
https://doi.org/10.1071/WR14148
https://doi.org/10.1016/j.ecolind.2010.11.005
Tolentino, V. C. D. M, Baesse, C. Q. & Melo, C. D.
Pieretti, N. & Farina, A. (2013). Application of a recently
(2018). Dominant frequency of songs in tropical bird
introduced index for acoustic complexity to an
species is higher in sites with high noise pollution.
avian soundscape with traffic noise. The Journal of
Environmental Pollution, 235, 983-992.
the Acoustical Society of America, 134, 891. https://doi.org/10.1016/j.envpol.2018.01.045
https://doi.org/10.1121/1.4807812 Vasconcelos, M. F., Mazzoni, L. G., Perillo, A.; Guerra,
Pieretti, N., Duarte, M.H.L., Sousa-Lima, R.S., Rodri- T., Morais, R., Garzon, B., Santos, J. E., Guimarães,
gues, M., Young, R.J. & Farina, A. (2015). Determi- L. S. L., Oliveira, Almeida, T., Peixoto, H. J. C., Du-
ning temporal sampling schemes for passive acous- tra, E. C., Pedroso, L. F., Valério, F. A., Petrocchi, D.,
tic studies in different tropical ecosystems.Tropical Santos, L. P. S. Dias, J. E. M., Morais, S. A., Garcia, F.
Conservation Science, 8, 215–234. I. A., Benfica, C. E. R. T. & Ribeiro, B. P. (2013). Long-
https://doi.org/10.1177/194008291500800117 term avifaunal survey in an urban ecosystem from
Pijanowski, B. C., Villanueva-Rivera, L. J., Dumyahn, southeastern Brazil, with comments on range exten-
S. L., Farina, A., Krause, B. L. Napoletano, B. M., sions, new and disappearing species. Papéis Avulsos
Gage, S. H. & Pieretti, N. (2011). Soundscape Ecolo- de Zoologia da Universidade de São Paulo, 53, 327-344.
gy: The science of sound in the landscape. Bioscience, https://doi.org/10.1590/S0031-10492013002500001
61, 203-216. Warren, P. S., Katti, M., Ermann, M. & Brazel, A. J.
https://doi.org/10.1525/bio.2011.61.3.6 (2006). Urban bioacoustics: it’s not just noise. Ani-
Rossing, T.D. (2007). Springer Handbook of Acoustics. mal Behaviour, 71, 491-502.
NewYork: Springer-Verlag New York Inc. 1182 pp. https://doi.org/10.1016/j.anbehav.2005.07.014
https://doi.org/10.1007/978-0-387-30425-0 Zhao, Z., Xu, Z. Yong, Bellisario, K., Zeng, R. Wen,
Santos, S.G., Duarte, M.H.L., Sousa-Lima, R.S. & Li, N., Zhou, W. Yang, & Pijanowski, B. C. (2019).
Young, R.J. (2017). Comparing contact calling be- How well do acoustic indices measure biodiversity?
tween black tufted-ear marmosets (Callithrix peni- Computational experiments to determine effect of
cillata) in a noisy urban environment and in a quiet sound unit shape, vocalization intensity, and fre-
forest. International Journal of Primatology, 38, 1130- quency of vocalization occurrence on performance
1137. of acoustic indices. Ecological Indicators, 107.
https://doi.org/10.1007/s10764-017-0002-x https://doi.org/10.1016/j.ecolind.2019.105588
106 | Biota Colombiana 22 (1) - 2021Gonçalves-Santo et al. Biophony in a noisy tropical urban forest fragment
Sara Gonçalves Santos
Pontifical Catholic University of Minas Gerais
Belo Horizonte, Minas Gerais, Brazil
sharada_bh@hotmail.com
https://orcid.org/0000-0001-9916-9938
Nadia Pieretti
Polytechnic University of Marche
Ancona, Italy
nadia.pieretti@gmail.com
https://orcid.org/0000-0003-1701-9368
Robert John Young
University of Salford, Manchester
United Kingdom
Biophony in a noisy tropical urban forest fragment
r.j.young@salford.ac.uk
https://orcid.org/0000-0002-8407-2348
Citación del artículo: Gonçalves-Santos, S. Pieretti, N.,
Young, R.J. & Duarte, M. (2021). Biophony in a noisy tro-
pical urban forest fragment. Biota Colombiana, 22(1), 96-107.
Marina Duarte
https://doi.org/10.21068/c2021.v22n01a06
Pontifical Catholic University of Minas Gerais,
Belo Horizonte, Minas Gerais, Brazil
r.j.young@salford.ac.uk
Received: April 4, 2020
https://orcid.org/0000-0002-7799-8791 Accepted: November 9, 2020
Biota Colombiana 22 (1) - 2021 | 107You can also read