Sedimentation process of ashfall during a Vulcanian eruption as revealed by high-temporal-resolution grain size analysis and high-speed camera ...
←
→
Page content transcription
If your browser does not render page correctly, please read the page content below
Miwa et al. Progress in Earth and Planetary Science               (2020) 7:3
https://doi.org/10.1186/s40645-019-0316-8
                                                                                                                                 Progress in Earth and
                                                                                                                                    Planetary Science

 RESEARCH ARTICLE                                                                                                                                 Open Access

Sedimentation process of ashfall during a
Vulcanian eruption as revealed by high-
temporal-resolution grain size analysis and
high-speed camera imaging
T. Miwa1* , Y. Iriyama1, M. Nagai1 and F. Nanayama2

  Abstract
  We here examined the sedimentation process of falling ash particles during a short-lived Vulcanian eruption at
  Sakurajima volcano, Japan, using high-speed camera imaging of airborne ash particles, as well as grain size analyses
  of ash samples collected at high temporal resolution. Ashfalls from a sequence of two Vulcanian eruptions at 10:44
  and 11:26 JST (Japan Standard Time) on 26 March 2016 were investigated. The field site for imaging and sampling
  was located approximately 3.5 km from the vent. The ash particles collected exhibit bimodal grain size distributions
  (GSDs). The median particle size of the main subpopulation decreased throughout the ashfall owing to size-
  dependent segregation of ash particles from a single source released from a constant height. The volume fraction
  of the subordinate subpopulation is interpreted to represent a component of ash aggregates and shows an
  increase in its volume fraction after the eruption onset. High-speed camera imaging reveals that the mean particle
  density decreased over time as the ashfall continued. These data suggest an increasing contribution of low-density
  aggregates during the course of the ashfall. The temporal changes in the density of airborne ash particles and in
  the GSD of ash samples demonstrate that the sedimentation process during a Vulcanian eruption at Sakurajima
  volcano is characterized by sedimentation of ash particles from transient eruption plumes at constant height, in
  which ash aggregation increases over time. Moreover, time series analysis of the ash falling rate shows that
  secondary thickening occurred during these Vulcanian eruptions and that this can be triggered by the settling of
  ash aggregates.
  Keywords: Volcanic ash, Aggregation, High-speed camera imaging, High-resolution temporal sampling, Grain size
  distribution, Vulcanian eruption, Sakurajima volcano

Introduction                                                                            whereas the number of studies that have examined sedi-
Explosive eruptions generate and disperse tephra that                                   mentation processes for Vulcanian eruption is still lim-
deposits around a volcano. The characteristics of these                                 ited (e.g., Bonadonna et al. 2002; Eychenne et al. 2012;
tephra deposits reflect their sedimentation process,                                    Miyabuchi et al. 2013). Vulcanian eruptions are com-
which is controlled by eruptive style, wind conditions,                                 monly defined as short-lived explosive eruptions lasting
and the aerodynamic properties of the particles (e.g.,                                  from few seconds to few hours (Clarke 2013). These
Iriyama et al. 2018; Koyaguchi and Ohno 2001a; Walker                                   eruptions often occur intermittently during persistent
1971; Wohletz et al. 1989). Many previous studies have                                  volcanic activity (Clarke 2013; Hammer et al. 1999; Igu-
investigated deposit characteristics to evaluate the sedi-                              chi et al. 2013). Although the eruptive mass (< 0.1 km3)
mentation process for Plinian and sub-Plinian eruptions,                                and eruptive column height (typically < 10 km) of single
                                                                                        Vulcanian events are relatively small, a series of Vulcan-
* Correspondence: miwao@bosai.go.jp                                                     ian eruptions can produce thick, edifice-forming ash de-
1
 National Research Institute for Earth Science and Disaster Resilience,                 posits (Andronico and Cioni 2002; Imura 1991, 1995).
Tennodai 3-1, Tsukuba 305-0006, Japan
Full list of author information is available at the end of the article

                                         © The Author(s). 2020 Open Access This article is distributed under the terms of the Creative Commons Attribution 4.0
                                         International License (http://creativecommons.org/licenses/by/4.0/), which permits unrestricted use, distribution, and
                                         reproduction in any medium, provided you give appropriate credit to the original author(s) and the source, provide a link to
                                         the Creative Commons license, and indicate if changes were made.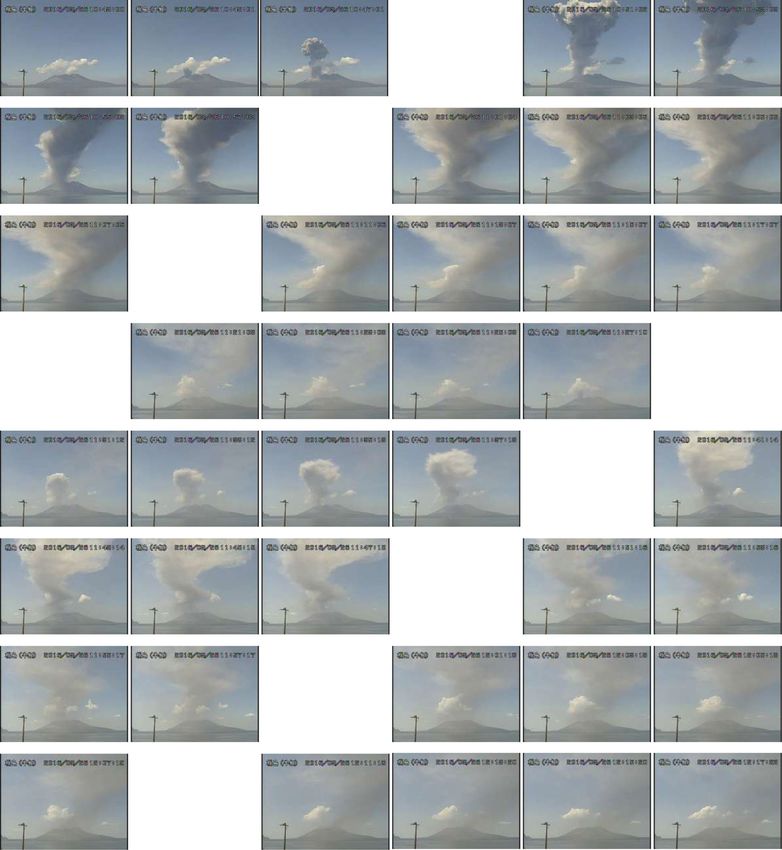
Miwa et al. Progress in Earth and Planetary Science   (2020) 7:3                                                  Page 2 of 16

  High-temporal resolution grain size analysis of tephra           including the effects of ash aggregation, during a short-
deposits can provide information on the process of sedi-           lived Vulcanian eruption.
mentation during Vulcanian eruptions. The tephra
source during a Vulcanian eruption is considered a                 Vulcanian activity at Sakurajima volcano
discrete “volcanic thermal” (Woods and Kienle 1994)                Sakurajima volcano (Fig. 1a) is an active andesitic vol-
which refers to instantaneous emission of batch of vol-            cano located in southern Kyushu, Japan. Large-scale
canic cloud or a ring vortex at the head of a transient            eruptions of Sakurajima have generated both tephra de-
plume (Chojnicki et al. 2014; Chojnicki et al. 2015a;              posits and lava flows (Kobayashi et al. 2013). Recent Vul-
Chojnicki et al. 2015b; Tournigand et al. 2017). We in-            canian activity at Sakurajima has been ongoing since
vestigate tephra sedimentation by assessing temporal               1955, and deposits have attained a maximum cumulative
variations in the grain size distribution (GSD) of tephra,         thickness of 120 cm at a site 2 km west from the vents
which reflects the sedimentation process (e.g., Iriyama            since that time (Imura 1995). The main eruptive vent
et al. 2018; Koyaguchi and Ohno 2001b). The deposit                switched from the Minamidake summit crater to the
from a single Vulcanian eruption is generally too thin to          Showa crater in 2006. The Showa crater is located on
examine its temporal variations from the internal stratig-         the southeastern edifice at an altitude of approximately
raphy (Imura 1991, 1995; Miura et al. 2012; Miyabuchi              800 m.a.s.l. (Iguchi et al. 2010). The Japan Meteoro-
et al. 2013). Therefore, high-temporal resolution sam-             logical Agency (JMA) reported over 5500 explosions in
pling of falling ash is required to obtain the temporal            the Showa crater from 2006 to 2017. The volumes of
variation in GSD during a Vulcanian eruption (Bagheri              some of the individual Vulcanian eruptions are esti-
et al. 2016; Bonadonna et al. 2002). Bonadonna et al.              mated to range from 5.9 × 10⁻⁷ to 3.6 × 10⁻⁶ km3 (Oishi
(2002) sampled falling ash particles at 5 min intervals            et al. 2018). Their eruptive products are characterized by
during a series of Vulcanian eruptions at Soufrière Hills          angular and dense clasts ranging in size from ash parti-
Volcano, Montserrat, and found a progression from a                cles to volcanic bombs (Miwa et al. 2013).
unimodal to bimodal GSD in the ash samples. Previous
studies, however, have not performed a detailed examin-            Methods/Experimental
ation of a polymodal GSD during a Vulcanian eruption,              Studied eruption
including the use of deconvolution analysis to derive the          We studied a sequence of Vulcanian eruptions from the
origin of particle size subpopulations within a tephra de-         Showa crater on 26 March 2016 (Fig. 1b). The first
posit (Evans et al. 2009; Eychenne et al. 2012; Wohletz            eruption occurred at 10:44 and was followed by a second
et al. 1989).                                                      eruption at 11:26 Japan Standard Time (JST). Figure 2
  Ash aggregation alters the aerodynamic properties of             captures the development of the volcanic cloud during
tephra and affects the sedimentation process (e.g., Carey          this sequence of Vulcanian eruptions. The first eruption
and Sigurdsson 1982; Costa et al. 2010). Ash aggregates            comprised an instantaneous initial jet followed by an
from dry eruptions are generally fragile and are rarely            ash-rich mushroom cloud. The volcanic plume ascended
preserved in the deposit after reaching the ground sur-            vertically, reaching a maximum height of 3500 m.a.s.l.
face (Bonadonna et al. 2011; Gilbert et al. 1991; James            180 s after the onset of the eruption (Report of eruptive
et al. 2003; Sparks et al. 1997; Taddeucci et al. 2011).           activity at Sakurajima volcano published by Japan Me-
Therefore, in situ observation of falling particles is             teorological Agency (JMA); https://www.jma-net.go.jp/
needed to quantify the properties (size, falling velocity,         kagoshima/vol/data/skr_exp_2016.html). The second
and density) of the aggregates (Bagheri et al. 2016; Tad-          eruption generated a volcanic cloud consisting of an ini-
deucci et al. 2011). For Vulcanian eruptions, Bagheri              tial jet phase followed by a weak mushroom cloud. The
et al. (2016) described the temporal variation in ash ag-          maximum height of the volcanic cloud during the sec-
gregates at Sakurajima volcano, based on high-speed,               ond eruption was recorded as 2900 m.a.s.l. 180 s after
high-resolution camera imaging. The effects of aggrega-            the start of the eruption (Report of eruptive activity at
tion on the sedimentation process during a Vulcanian               Sakurajima volcano published by JMA; https://www.jma-
eruption are, however, still poorly constrained.                   net.go.jp/kagoshima/vol/data/skr_exp_2016.html). Since
  In this study, we investigated temporal variations in            the maximum height of the second eruption was smaller,
the sedimentation process of falling ash particles during          thermal energy and the ash content should be smaller.
a Vulcanian eruption at Sakurajima volcano, Japan. We              The volcanic clouds from both the first and second
conducted a detailed grain size analysis of ash samples            eruptions were spread by westerly wind with a velocity
collected at high temporal resolution and observed air-            of ~ 10 m s−1 (Fig. 3) (Meteorological data set published
borne ash particles using high-speed camera imaging.               by JMA; http://www.data.jma.go.jp/obd/stats/etrn/index.
The combination of these analyses provides detailed in-            php). Pyroclastic density currents were not observed
sights into the sedimentation process of ash particles,            during the studied eruptions (Fig. 2).
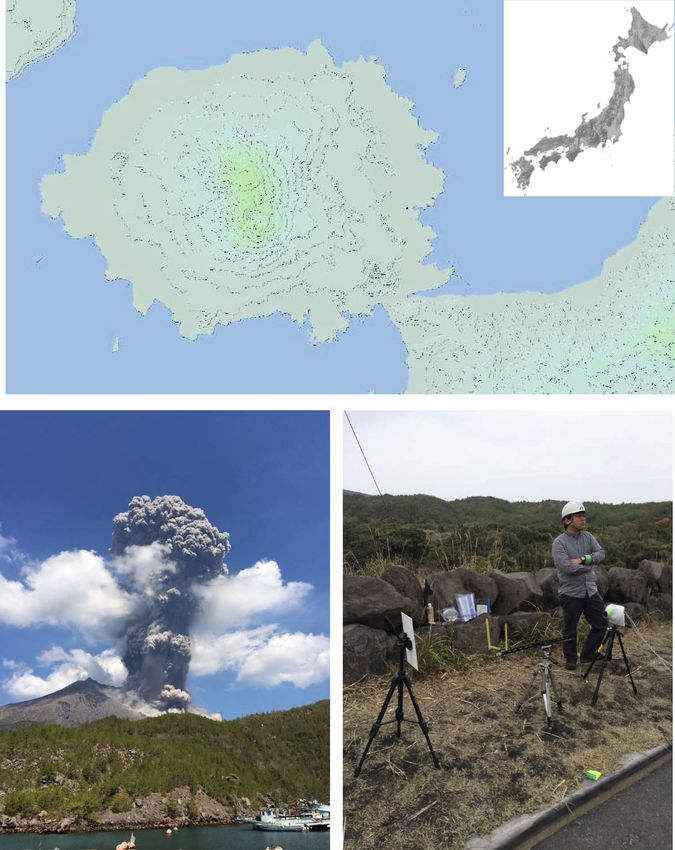
Miwa et al. Progress in Earth and Planetary Science   (2020) 7:3   Page 3 of 16

 Fig. 1 (See legend on next page.)
Miwa et al. Progress in Earth and Planetary Science     (2020) 7:3                                                                   Page 4 of 16

 (See figure on previous page.)
 Fig. 1 a Locations of Sakurajima volcano and the field observation site (N31.581622, E130.705992). The location map was based on the Digital
 Topographic Map published by the Geospatial Information Authority of Japan and processed using Kashmir software. Ushine indicates location of
 the time-lapse camera installed by JMA (see Fig. 2). b Photograph of the studied eruption, which started at 10:44 JST, 26 March 2016. View from
 the location of photo in this figure. The height of column in this photo is approximately 900 m. c Field observation site and view of
 instrument setup

 Fig. 2 Images obtained from the time-lapse camera installed by JMA in the Ushine area, which is located approximately 10 km east of the Showa
 crater (see Fig. 1). The images were taken at 10:43–12:17 JST, 26 March 2016, with a frequency of one image every 2 min
Miwa et al. Progress in Earth and Planetary Science       (2020) 7:3                                                                    Page 5 of 16

 Fig. 3 Height profile of a velocity and b direction of upper wind at Kagoshima region meteorological station. The dashed line in a is the result of
 linear fitting of the relationship between wind velocity and height

Field observations                                                          minimize the particle size analysis error. Calibration
We conducted field observations consisting of high-                         using checkerboard panels showed that the image distor-
speed camera imaging of airborne ash particles and                          tion in the captured images was negligible for the ana-
high-temporal resolution sampling of falling ash (Fig.                      lyses. The camera was set on a tripod to horizontally
1c). The field site was located approximately 3.5 km east                   capture the falling ash, and a white background was se-
of the Showa crater (Fig. 1a) and was roughly under the                     lected for the image background. During the eruption,
dispersal axis of the volcanic cloud. The consideration                     we recorded three footages from 10:57, 11:33, and 12:00.
on location of the dispersal axis is also supported by                      These footages are labeled HSC1057, 1133, and 1200, re-
eastward wind direction at height of 2000–3000 m a.s.l.                     spectively. Each piece of footage lasted for approximately
around Kagoshima area as reported by JMA (Fig. 3)                           1 min, with the duration being limited by camera mem-
(http://www.data.jma.go.jp/obd/stats/etrn/index.php).                       ory and computer processing power. The computer
                                                                            transfer time forced an interval of approximately 30 min
High-speed camera imaging                                                   between recordings.
To estimate the aerodynamic properties of falling ash                         The captured footage was exported as a time series of
particles, we observed airborne ash particles using a                       8-bit bitmap files, and the software package ImageJ was
high-speed camera (Fig. 1c and Additional file 1: Movie                     used to estimate the size and vertical falling velocity of
S1, Additional file 2: Movie S2, and Additional file 3:                     in-flight particles. We identified just-focused particles in
Movie S3). The monochromatic high-speed camera                              the images and made binary images of the particles by
(HAS-L2M by Ditect Co. Ltd.) was used to obtain video                       applying a tone threshold. Using an image resolution of
footage at 3000 fps, with an image size of 180 pixels ×                     0.095 mm/pixel, the lengths (l) of major and minor axes
190 pixels. The lens used had a focal length of 50 mm                       of each filmed particle were estimated, and the 2D
and an aperture of f/1.4, providing a focal distance of 50
                                                                            equivalent diameter was calculated using                 D¼
cm, an image resolution of 0.095 mm/pixel, and 4.75                         pffiffiffiffiffiffiffiffiffiffiffiffiffiffiffiffiffiffiffiffiffiffiffiffiffiffi
mm of focal depth. The aperture was set as large as pos-                       lminor  lmajor . Falling velocities of ash particles were
sible to reduce the focal depth of the images so as to                      estimated using the change in vertical position of
Miwa et al. Progress in Earth and Planetary Science (2020) 7:3 Page 6 of 16 particle centroids using a time sequence of binary im- sampling was held under calm weather condition, con- ages at a frame rate of 3000 fps. tamination from old deposit by wind resuspension is Errors on the estimated particle falling velocities were highly unlikely and our careful cleaning of trays avoided estimated from the uncertainty in the particle centroid contamination from the old sampling. Unfortunately, the positions. Using an exposure time of 333 μs with a fall- ash sample collected during 11:30–11:35 was lost while ing velocity of 0.2–7.0 m/s, we multiplied the exposure being transferred to a plastic bag for the sample. time and falling velocity to estimate the uncertainty of The ash falling rates were calculated by dividing the the particle centroid positions at 67–2300 μm. Thus, the accumulated mass of fallen ash by the duration of sam- percentage error in the centroid positions relative to the pling and the area of the plastic trays. The accumulated falling distance taken from high-speed camera imagery mass was measured using precise scales (error of 1.0 × (18 mm) is estimated at 0.37–12% (100 × uncertainty/ 10−5 g; Shimadzu AUW220D) in National Research In- height of the image), with faster-falling particles having a stitute for Earth Science and Disaster Resilience, Tsu- larger relative error which was estimated to ± 0.001– kuba, Japan. The error in sampling duration is less than 0.910 m/s for the range of falling velocities. 10 s. High-temporal resolution sampling Grain size analysis Additionally, we sampled falling ash particles at high- In order to examine in detail the sedimentation process temporal resolution (Table 1) simultaneously with the of falling ash particles, we analyzed the GSD of 22 ash high-speed camera imaging. The sampling was per- samples obtained at regular intervals throughout the formed from 10:57 to 12:12 with time intervals of 1 min ashfall. The grain size analyses were performed using a for 10:57–11:07 and 5 min for 11:07–12:12. Two plastic Partica LA-960 instrument from HORIBA at the Geo- trays with opening area of 38 cm × 52 cm were used for logical Survey of Japan, Tsukuba. The grain size analyzer the sampling. We alternated the two trays to enable con- measures particle sizes ranging from 0.01 to 3000 μm tinuous sampling of the falling ash particles. Since the using laser diffraction. The ash samples were dispersed Table 1 Summary of high-temporal sampling Sample name Beginning time (JST) End time (JST) Interval [min] Ash falling rate [g min−1 m−2] sj0326-01 10:57 10:58 1 92.85 sj0326-02 10:58 10:59 1 54.92 sj0326-03 10:59 11:00 1 33.12 sj0326-04 11:00 11:01 1 13.14 sj0326-05 11:01 11:02 1 10.08 sj0326-06 11:02 11:03 1 7.98 sj0326-07 11:03 11:04 1 0.40 sj0326-08 11:04 11:05 1 1.13 sj0326-09 11:05 11:06 1 1.53 sj0326-10 11:06 11:07 1 2.77 sj0326-11 11:07 11:12 5 2.48 sj0326-12 11:12 11:17 5 1.38 sj0326-13 11:17 11:22 5 0.65 sj0326-14 11:22 11:27 5 0.23 No sample 11:27 11:32 5 sj0326-15 11:32 11:37 5 0.12 sj0326-16 11:37 11:42 5 0.15 sj0326-17 11:42 11:47 5 0.91 sj0326-18 11:47 11:52 5 3.26 sj0326-19 11:52 11:57 5 3.06 sj0326-20 11:57 12:02 5 0.92 sj0326-21 12:02 12:07 5 0.55 sj0326-22 12:07 12:12 5 0.25
Miwa et al. Progress in Earth and Planetary Science          (2020) 7:3                                                                        Page 7 of 16

in distilled water before the analyses were performed.                          following 7 min (10:57–11:04). The rate then recovered
The plastic bags were washed using distilled water to en-                       and showed a secondary peak 10 min after the onset of
sure measurement of very fine particles.                                        ashfall (11:07–11:08), followed by another decrease (11:
  We first used the GRADISTAT program (Blott and                                08–11:37). The rate gradually increased to reach a third
Pye 2001) to analyze GSDs. The median size (Md) and                             peak (11:37–11:52) and finally decreased until the end of
standard deviation (Sd) were calculated using the graph-                        the ashfall (11:52–12:12). During the field observation,
ical method of Folk and Ward (1957). Although these                             we observed the fallout of ash aggregates which were
parameters can be calculated only in lognormal GSDs                             broken on the impact with the ground surface at least
with a unimodal shape, we characterized the GSDs                                between 11:45 and 11:46 (Additional file 4: Movie S4).
which include bimodal and trimodal distributions by                             However, the type of aggregate observed in this study
using these parameters for convenience in presentation                          could not be determined because we did not perform
(Evans et al. 2009).                                                            high-speed and high-resolution camera imaging of the
  Multiple lognormal curves were fitted to examine sub-                         impact of aggregates (Bagheri et al. 2016).
populations within the GSDs. The fitting was done using
PeakFit software (Hulinks Inc.). PeakFit deconvolved                            Aerodynamic properties of falling ash
subpopulations from the GSDs using a basic function                             Here, we present the results of high-speed camera imaging
with a linear baseline based on least squares regression                        of airborne ash particles. Analysis of the images shows
between the results of analysis and the fitting calcula-                        that particle size ranged from 0.12 to 2.2 mm and that fall-
tion. We tested lognormal, Weibull, and Rosin-Rammler                           ing velocity ranged from 0.2 to 7.0 m/s (Fig. 5a). Size and
distributions as the basic functions for fitting (Eychenne                      falling ash velocity decreased from HSC1057 to HSC1133
et al. 2012; Sheridan et al. 1987; Wohletz et al. 1989)                         and HSC1200. The size-velocity relationship is consistent
and applied lognormal distributions because of their                            with the results presented by Bagheri et al. (2016). Their
simple expression. The number of subpopulations was                             results fall between our results for HSC1057 and others
determined by the number of apparent peaks found in                             (HSC1133 and HSC1200) (Fig. 5a). The relationship is
the GSDs. We named these subpopulations SP#1, SP#2,                             also similar to that obtained for the 2010 eruption of
and SP#3 in descending order of their peak amplitudes.                          Eyjafjallajökull volcano (Taddeucci et al. 2011). Specific-
The Md and Sd values of the subpopulations were                                 ally, the size-velocity relationship found in HSC1057 over-
expressed using the Φ scale (= −log2d; d is particle size                       laps the results for individual particles from
in millimeters).                                                                Eyjafjallajökull, and the relationship identified in HSC1133
                                                                                and HSC1200 is similar to that for aggregated particles for
Results and discussion                                                          Eyjafjallajökull (Taddeucci et al. 2011).
Time series of the ash falling rate                                               The Reynolds number (Re: ratio of inertia to viscous
The ash falling rate at the field site varied during the                        force) and drag coefficient (Cd: drag force of a fluid on a
ashfall (Fig. 4). The ashfall at the field site started at 10:                  moving particle) of falling particles were calculated from
57 (13 min after the first eruption onset) and ceased at                        the size and velocity of ash particles. For the calculation,
12:12. The ash falling rate reached a maximum during                            we applied the model of Wilson and Huang (1979)
the first 1 min (10:57–10:58) and decreased during the                          using:

 Fig. 4 Timeline of field observations and temporal variation in ash falling rate at the field site. Note that logarithmic scale in the vertical axis.
 Numbers refer to sample number
Miwa et al. Progress in Earth and Planetary Science (2020) 7:3 Page 8 of 16 Fig. 5 (See legend on next page.)
Miwa et al. Progress in Earth and Planetary Science (2020) 7:3 Page 9 of 16
(See figure on previous page.)
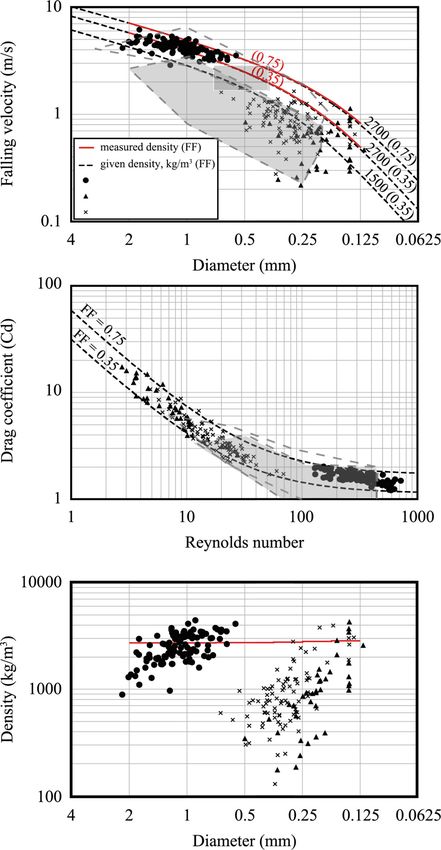
Fig. 5 Aerodynamic properties of falling ash particles obtained using high-speed camera imaging. Black circles, triangles, and crosses show the
results of footages HSC1057, HSC1133, and HSC1200, respectively. a Relationship between falling velocity and diameter of ash particles. Curves
represent the model of Wilson and Huang (1979), and the corresponding density and form factor (FF = (lintermediate + lminor)/(2 × lmajor)) values are
shown. Solid red curves were obtained based on density variation in the ash deposit measured using a helium pycnometer. Dashed black curves
were calculated by the given constant density. Gray square shading indicates the range in particle size and velocity of the aggregates in
Sakurajima volcano, as reported in Bagheri et al. (2016). Colorless and gray areas enclosed by gray dash lines indicate the individual and
aggregate particles from Eyjafjallajökull volcano, respectively (Taddeucci et al. 2011). b Relationship between Reynolds number (Re) and drag
coefficient (Cd). Dashed curves show the model of Wilson and Huang (1979) with form factors of 0.35 and 0.75. Colorless and gray areas enclosed
by gray dash lines indicate the individual and aggregate particles from Eyjafjallajökull volcano, respectively (Taddeucci et al. 2011). c Density and
diameter of falling ash particles calculated from Eqs. (1), (2), and (3). The solid red line represents density variation in the ash deposit, as measured
using a helium pycnometer
Re ¼ ρvL=η ð1Þ of 1500 kg m−3; Miwa et al. 2013). The calculated density
decreased from HSC1057 (mean = 2500 kg m−3, range =
24 −0:828 pffiffiffiffiffiffiffiffiffiffiffiffiffiffiffiffiffi 890–4400 kg m−3) to HSC1133 (mean = 1220 kg m−3,
Cd ¼ FF þ 2 1:07−FF ð2Þ
Re range = 180–4270 kg m−3) and to HSC1200 (mean =
1030 kg m−3, range = 130–3980 kg m−3) (Fig. 5c). Within
where ρ is the density of the medium; v is falling vel-
the footage for HSC1057, HSC1133, and HSC1200, the
ocity; L is the characteristic length of the particle; η is
percentage of particles with a density of < 1500 kg m−3
the viscosity of the medium; and FF is the form factor
was 10 vol.%, 80 vol.%, and 80 vol.% of the total volume,
calculated by the major, intermediate, and minor lengths
respectively.
of the particle: FF = (lintermediate + lminor)/(2 × lmajor). Re-
The numbers of falling particles filmed by the HSC
cently, Kozono et al. (2019) suggested that the relation-
imaging qualitatively decreases from HSC1057 to
ship between size and velocity of ash particles with size
HSC1133 and HSC1200. This seems to be consistent
of < 0.32 mm is explained by the model of Wilson and
with the time series of the ash falling rate (Fig. 4).
Huang (1979) for the Vulcanian eruptions at Sakurajima
volcano. We used the velocity and major and minor
Grain size distributions
lengths of falling ash particles in the 2D images to calcu-
Table 2 summarizes the results of the GSD analyses of
late values of Re and Cd. The equivalent diameter D was
the collected particles. The ash samples exhibited uni-
used for the characteristic length L and intermediate axis
modal, bimodal, or trimodal GSDs and changed through
in the calculation. The estimated value of FF ranged
the course of the ashfall (Fig. 6). Sampled grain sizes
from 0.25 to 0.75 with 0.56 in average. The estimated
ranged from − 1.5Φ to 8Φ (2.8 mm to 3.9 μm). For sam-
values of Re and Cd ranged from 2 to 70 and 1 to 11, re-
ples from 10:57 to 11:37, the GSDs showed bimodal
spectively (Fig. 5b). Both the Re and Cd values decreased
character in 10:57–10:59, unimodal distributions from
from HSC1057 to HSC1133 and HSC1200. The trend of
10:59 to 11:04, and bimodal distributions from 11:04 to
the Re and Cd covers those of the 2010 eruption at Eyjaf-
11:37. For samples from 11:37 to 12:12, trimodal distri-
jallajökull volcano (Taddeucci et al. 2011).
butions were found in 11:37–11:47 and bimodal distri-
The density of airborne ash particles (ρs) was derived
butions in 11:47–12:12.
using a modified equation from Dellino et al. (2005),
Md and Sd values of the bulk samples are summarized
which balances the downward gravitational force (g) and
in Table 2. Md ranged from − 0.01 to 3.06Φ, ranging
the drag force due to air resistance around a spherical
from very fine to very coarse ash. Sd ranged from 0.35 to
particle (Cd):
1.55Φ, ranging from well to poorly sorted. We also iden-
3C d ρv2 tified temporal variations in Md and Sd values for the
ρs ¼ þρ ð3Þ subpopulations (Fig. 7). For the first subpopulation
4gL
(SP#1), Md generally decreased over time, although there
The calculated density ranged from 130 to 4400 kg is a decreasing step of Md value in 11:37–11:42. Sd
m−3, which spans the mean density of ash particles ob- showed very little variation throughout the ashfall. For
tained using a helium pycnometer (= 2700 ± 50 kg m−3; the second subpopulation (SP#2), Md gradually increased
see Additional file 5: Text S1). The maximum calculated from 10:57 to 11:37, showed a stepwise increase at 11:
density (4400 kg m−3) is lower than the highest possible 37–11:42, and then gradually decreased until the end of
density of an ash particle, which is approximately 5200 the ashfall. The fraction of grains that fell within this
kg m−3 derived from the inclusion of magnetite. The second subpopulation generally increased from 10:57 to
minimum calculated density (130 kg m−3) is one order of 11:37 and then decreased from 11:37 to the end of the
magnitude lower than that of vesicular glass (minimum ashfall. Sd for SP#2 gradually increased from 10:57 to 11:Miwa et al. Progress in Earth and Planetary Science (2020) 7:3 Page 10 of 16
Table 2 Summary of grain size analysis
Bulk SP#1 SP#2 SP#3
Md phi σ phi Md phi σ phi Areal% Md phi σ phi Areal% Md phi σ phi Areal%
sj0326-01 -0.01 0.47 0.13 0.38 99.6 7.17 0.30 0.4
sj0326-02 0.19 0.35 0.30 0.32 99.5 7.26 0.27 0.5
sj0326-03 0.44 0.40 0.56 0.34 100.0
sj0326-04 0.65 0.38 0.76 0.34 100.0
sj0326-05 0.77 0.40 0.89 0.36 100.0
sj0326-06 0.92 0.41 1.02 0.37 99.6 7.14 0.27 0.4
sj0326-07 0.88 0.43 0.99 0.39 100.0
sj0326-08 1.04 0.44 1.15 0.39 99.3 6.33 0.39 0.7
sj0326-09 1.17 0.45 1.27 0.40 98.7 6.37 0.48 1.3
sj0326-10 1.24 0.45 1.38 0.35 99.5 6.34 0.35 0.5
sj0326-11 1.51 0.50 1.60 0.43 97.3 6.58 0.59 2.7
sj0326-12 2.04 0.96 2.09 0.45 92.3 5.87 0.83 7.7
sj0326-13 2.13 1.15 2.13 0.46 85.1 5.75 1.08 14.9
sj0326-14 3.06 1.55 2.79 0.39 65.0 5.93 0.88 35.0
sj0326-15 2.78 1.37 2.72 0.38 76.4 5.88 1.26 23.6
sj0326-16 1.14 1.47 0.90 0.44 62.3 2.56 0.73 29.3 6.04 0.82 8.4
sj0326-17 1.14 1.30 1.09 0.45 78.3 2.78 0.86 15.9 6.39 0.73 5.8
sj0326-18 1.50 1.18 1.51 0.48 86.9 3.14 0.61 6.7 6.50 0.73 6.4
sj0326-19 1.83 1.04 1.86 0.49 90.0 3.34 0.43 4.2 6.37 0.74 5.7
sj0326-20 2.22 1.06 2.24 0.47 88.3 3.68 0.49 4.2 6.26 0.67 7.4
sj0326-21 2.44 0.96 2.49 0.43 90.1 3.83 0.49 3.5 6.32 0.66 6.4
sj0326-22 2.64 0.93 2.68 0.39 88.4 3.64 0.44 4.6 6.41 0.61 7.0
37 and then decreased. The third subpopulation (SP#3) volcano is controlled mainly by size-dependent seg-
started to appear only from 11:37 onwards, and its Md regation of ash particles from discrete transient
value and fraction remained fairly constant from 11:37 eruption plumes. The median grain size of SP#1,
until the end of the ashfall. Sd of SP#3 decreased slightly with corresponds to 70–99% of falling ash, de-
throughout the ashfall. Sample collected in 11:37–11:42 creased after each of the two eruptions (Fig. 7), in-
marked a change in median grain size for all three sub- dicating the size-depending segregation of ash
populations, with Md decreasing from that sample to the particles in which larger particles having higher ter-
end of ashfall. minal velocity fall earlier from the volcanic cloud
All GSDs obtained by high-speed imaging exhib- than smaller particles. This decrease in particle size
ited unimodal distributions (Fig. 8). We found was also identified in the GSD obtained by high-
modal grain sizes of − 0.77Φ, 1.52Φ, and 1.32Φ for speed camera imaging where the mode value of par-
HSC1057, HSC1133, and HSC1200, respectively. ticle size is smaller in HSC1133 than that in
The GSDs from the samples that were simultan- HSC1057 (Fig. 8). Trimodal GSDs found after 11:37
eously collected exhibited bimodal distributions, represent the arrival of falling ash particles from the
with this bimodality (compared with the unimodality second thermal cloud. We conclude that the ash
of airborne particles) implying that the size distribu- particles were separately supplied from two distinct
tion of particles changed after colliding with the thermals from each eruption, as inferred from the
ground surface. continuous trend of SP#1 before and SP#2 after 11:
37 (Fig. 7a).
Sedimentation process of ashfall during a vulcanian We examined the relationship between particle size
eruption and its arrival time by using a simple model for the vol-
The results of the GSD analysis and high-speed canic thermal cloud, which is approximated as a single-
camera imaging demonstrate that the sedimentation release source of ash particles at a constant height with
process during Vulcanian eruptions at Sakurajima an effect of advection by horizontal wind (Fig. 9). In thisMiwa et al. Progress in Earth and Planetary Science (2020) 7:3 Page 11 of 16
Fig. 6 GSDs of the ash deposit obtained using laser diffraction. White circles represent data obtained by grain size analysis. Thick blue, orange,
and green lines represent subpopulations #1, #2, and #3, respectively. The thin black line shows the synthetic GSD formed by summing the
subpopulations. The collection time is described in upper right corner in each graph
case, the horizontal (L) and vertical (H) locations of the values of H0 for the first and second eruptions are 3500
falling particle from the release source at time (t) are m and 2900 m, respectively, from the height difference
given as between volcanic cloud and the observation point. Δt is
180 s (Fig. 2), and the modeled particle density 2700 kg
L ¼ vx ðt−t 0 −Δt Þ ð4Þ m−3. This model does not take into account a complex
H ¼ H 0 −vz ðt−t 0 −Δt Þ ð5Þ wind field in proximal area of volcano by orographic ef-
fects (e.g., Poulidis et al. 2017), because there is no dense
observation network for wind condition to capture such
where H0 is a height of the release source of falling a detailed wind field.
particles from the observation point, t0 is the onset time The calculation result mostly explains the trend of
of eruption, and Δt is the time required for the height of temporal variation in the median grain size of SP#1
the release source to reach the height H0. The vx and vz during both the first and second eruptions within the
are horizontal and vertical (falling) velocities of the parti- standard deviations (Fig. 7). This finding indicates
cles, respectively. vx is expressed as function of H, which that a discrete, initially homogeneous batch of ash
is derived from the height profile of westerly component from a discrete volcanic cloud is a plausible source
of upper wind at 9:00 of 26 March 2016 in Kagoshima model for tephra sedimentation during a Vulcanian
regional meteorological station (Meteorological data set eruption. This consideration is consistent with a re-
published by JMA; http://www.data.jma.go.jp/obd/stats/ sult of detailed observation of volcanic plume at
etrn/index.php) (Fig. 3), and approximated to Sakurajima volcano by using high-speed (visible and
vx ¼ 0:0045H−2:9191 ð6Þ thermal) camera, in which ring vortex at the head of
transient plume was interpreted as the main carrier of
By combining the Eqs. (4), (5), and (6) with the rela- tephra (Tournigand et al. 2017).
tionship between the falling velocity (vz) and particle size It should be noted that our model does not account
described as Eqs. (1), (2), and (3) (Wilson and Huang for the effects of multiple release sources in the eruption
1979), we calculated the particle size likely to fall at the cloud (e.g., Folch 2012). The variation of physical prop-
observation point at a particular time. The location of erties (such as grain size concentration of tephra) within
observation point is set to L = 3500 m and H = 0 m. The the eruptive column which determines the parameters ofMiwa et al. Progress in Earth and Planetary Science (2020) 7:3 Page 12 of 16 Fig. 7 Temporal variation in Md and Sd of the subpopulations. Blue, orange, and green lines show subpopulations #1, #2, and #3, respectively. a Md of the subpopulations. Solid lines show the expected sizes of falling ash particles with densities of 2700 kg m−3 for FF (form factor) of 0.56. Error bars indicates the standard deviation of particle size. b Sd of the subpopulations. c Fraction of each subpopulation in the GSDs. Vertical dashed gray lines represent onset times of the two Vulcanian eruptions. Left side gray shade indicates collection time of sj0326-08 (11:04–11:05) in which the aggregation became effective to sedimentation. Right side gray shade indicates collection time of sj0326-16 (11:37–11:42) in which the trimodal GSD started to appear multi-release sources of tephra dispersal has not been individual particle size following the first eruption (Fig. well constrained in the actual eruptions (e.g., Shimbori 7). This suggests that the falling velocity of ash particles 2016), and our field site was limited to one point (ap- increased as a result of aggregate formation. High-speed proximately 3.5 km from the vent), for which is not ap- camera imaging showed that volume fractions of falling propriate to apply such a model. This effect needs to be ash particles with density of < 1500 kg m−3 were higher considered for building a more sophisticated model for in the ashfalls of 11:33–11:34 (HSC1133) and 12:00–12: tephra transport in Vulcanian eruptions by using data 01 (HSC1200) than that of 10:57–10:58 (HSC1057) (Fig. from dense observation network for the falling ash. 5). The low-density particles (< 1500 kg m−3) are inter- The contribution of ash aggregates to ashfall dynamics preted as ash aggregates, since the likely lowest density becomes significant during the course of ashfall follow- of an individual particle at Sakurajima volcano is ap- ing a Vulcanian eruption. We could observe the fallout proximately 1500 kg m−3 (for particles with approxi- of ash aggregates which were broken at the impact on mately 40% vesicularity) (Miwa et al. 2013). This low the ground surface at least between 11:45 and 11:46 density is similar to that of an experimental or natural (Additional file 4: Movie S4). The measured change in ash aggregate with abundant pores (James et al. 2003; the median grain size of SP#1 can be explained by the Taddeucci et al. 2011), thus supporting the interpret- size-dependent segregation of ash particles from the vol- ation. Bimodality in GSDs has been interpreted as evi- canic plume. Specifically, Md was finer than the modeled dence of ash aggregation, which increases the terminal
Miwa et al. Progress in Earth and Planetary Science         (2020) 7:3                                                                       Page 13 of 16

 Fig. 8 Comparison of GSDs obtained from high-speed camera imaging (top) and laser diffraction (bottom). The open column in the GSD
 indicates falling particles with inferred densities of < 1500 kg m−3. The vertical dashed lines indicates lower limit of particle diameter for the high-
 speed camera imaging

velocity of fine ash particles (Brazier et al. 1983; Carey                     7c). The fraction of SP#2 increased particularly in 11:
and Sigurdsson 1982). Within the measured bimodal                              32–11:37, in which over 80 vol.% of falling ash particles
distributions, the finer SP#2 is considered to represent                       with size > 3φ had a density of < 1500 kg m−3 (Fig. 8).
the fine-aggregate component (Bagheri et al. 2016; Bra-                        This suggests that the aggregate content increased 8 min
zier et al. 1983; Schumacher 1994). The fraction of the                        and peaked 40 min after the start of the ashfall. Bagheri
overall GSD constituted by SP#2 increased 8 min after                          et al. (2016) also reported an increase in ash aggregates
the start of ashfall produced by the first eruption (Fig.                      10 min after the commencement of ashfall following a

 Fig. 9 Schematic diagram of the relationship between ash particle size and its arrival time
Miwa et al. Progress in Earth and Planetary Science   (2020) 7:3                                                                  Page 14 of 16

Vulcanian eruption at Sakurajima volcano. Thus, we                 ashfall after both the first and second eruptions. This is
suggest that the increase in ash aggregation of falling ash        explained by size-dependent segregation of ash particles
particles may occur ~ 10 min after the start of ashfall in         from a single constant-height-release source with the ef-
proximal area during normal Vulcanian eruptions emit-              fect of advection by horizontal wind. High-speed camera
ting volcanic clouds with 1000–2000 m of height at                 imaging was performed at 10:57, 11:33, and 12:00 and
Sakurajima volcano. It is noted that particles of SP#2             yielded a particle size range of 0.12–2.2 mm and a falling
and SP#3 never fell as individual particles within the ob-         velocity range of 0.2–7.0 m/s. The fraction of falling ash
servation time. The time required for the individual par-          with a density of < 1500 kg m−3 is interpreted as ash ag-
ticles of SP#2 and SP#3 with size of 6–7 phi (8–16 μm)             gregate and decreased over time. The finer subpopula-
to reach the field site from the vent can be calculated by         tion (SP#2) is interpreted as fine material that forms ash
dividing the difference of altitude between the vent and           aggregate and showed an increase in its volume fraction
field site (900 m) with the falling velocity of such particle      throughout the course of the ashfall. These temporal
(around 0.001 m/s) (Wilson and Huang 1979). There-                 changes in the density of airborne ash particles and the
fore, the time required is calculated to approximately             GSD of ash samples demonstrate that the sedimentation
250 h and is clearly ruled out from the result of our ob-          process during a Vulcanian eruption at Sakurajima vol-
servation in which total time of observation was approxi-          cano can be explained by sedimentation of ash particles
mately 1.5 h. Moreover, we did not observe any                     from the transient volcanic cloud, in which ash aggrega-
pyroclastic density current which could be the source of           tion increases over time. The ash falling rate decreased
fine ash particles during the observation of the eruption          rapidly during the first 8 min and then increased. This
(Fig. 2).                                                          recovery of the ash falling rate was accompanied by an
   Temporal variation in the rate of falling ash particles         increase in the volume fraction and Sd of SP#2 for sam-
during the course of a Vulcanian eruption is affected by           ple collected in 11:04–11:05 (8 min after the start of ash-
ash aggregation. The ash falling rate decreased rapidly            fall). We interpret this as showing that secondary
during the first 8 min and then increased (Fig. 4). This           thickening can occur during an ashfall generated by a
recovery of the ash falling rate was accompanied by a              Vulcanian eruption, with the process being triggered by
slight increase in the volume fraction and Sd of SP#2              the settling of ash aggregates, which is similar with case
(Figs. 4 and 7) in 11:04–11:05 (8 min after the start of           in larger-scale Plinian eruptions. The sedimentation
ashfall), which indicated the onset of ash aggregate for-          process proposed in this study can be applied to models
mation. We suggest that the observed recovery of the               of tephra sedimentation from active volcanoes with fre-
ash falling rate is similar to the process of secondary            quent short-live eruptions.
thickening, which has been found in tephra deposits
generated by Plinian eruptions and attributed to the ag-           Supplementary information
gregation of fine ash particles (Carey and Sigurdsson              Supplementary information accompanies this paper at https://doi.org/10.
1982). By combining a time series of ash falling rate and          1186/s40645-019-0316-8.

characteristics of GSDs, we have been able to demon-
                                                                    Additional file 1: Movie S1. High-speed image of airborne ash particles
strate that secondary thickening can occur during ashfall           taken in HSC1057. The real length of the movie is 0.028 seconds.
generated by Vulcanian eruptions, with the process be-              Additional file 2: Movie S2. High-speed image of airborne ash particles
ing triggered by the settling of ash aggregates.                    taken in HSC1133. The real length of the movie is 0.028 seconds.
                                                                    Additional file 3: Movie S3. High-speed image of airborne ash particles
Conclusions                                                         taken in HSC1200. The real length of the movie is 0.028 seconds.
We quantified the sedimentation process of ash particles            Additional file 4: Movie S4. The movie was taken in the field site
                                                                    around 11:45-11:46. Diameter of circle patterns in the plastic tray was 1.4
during a Vulcanian eruption at Sakurajima volcano,                  cm.
Japan, using GSD analysis and high-speed camera im-                 Additional file 5: Text S1. Density measurement.
aging obtained during the eruption sequence at a site
3.5 km from the vent. We studied two Vulcanian erup-
                                                                   Acknowledgements
tions on 26 March 2016, with the first eruption occur-             We thank R. Kazahaya, N. Geshi, and T. Kozono for advice on the field
ring at 10:44 and the second at 11:26 JST. Ashfall                 observations. We are grateful to E. Sato for the series of images of the
continued from 10:57 to 12:12 at the field site. GSDs of           eruption taken by the JMA time-lapse camera. We acknowledge T. Kanamaru
                                                                   for help with density measurements using the helium pycnometer. We
ash samples obtained by high-temporal resolution (1–5              would appreciate two anonymous reviewers and C. J. N. Wilson for their
min) sampling exhibited unimodal, bimodal, and trimo-              careful readings of the manuscript.
dal distributions. The grain size of the samples ranged
from 6 μm to 3 mm. The Md of the main particle size                Authors’ contributions
                                                                   TM designed this study, performed all the field and laboratory experiments,
subpopulation (SP#1), which accounts for 70–99% of the             analyzed the data of the high-speed camera imaging and grain size analysis,
sampled ash volume, decreased during the course of the             and drafted the manuscript. YI performed the field observations and the
Miwa et al. Progress in Earth and Planetary Science (2020) 7:3 Page 15 of 16
grain size analysis and contributed to the drafting of the manuscript. MN Evans JR, Huntoon JE, Rose WI, Varley NR, Stevenson JA (2009) Particle sizes of
contributed to the study design, performed the field observations, and con- andesitic ash fallout from vertical eruptions and co-pyroclastic flow clouds,
tributed to the drafting of the manuscript. FN performed the grain size ana- Volcán de Colima, Mexico. Geology 37(10):935–938. https://doi.org/10.1130/
lyses and contributed to the drafting of the manuscript. All the authors have G30208A.1
read and approved the final manuscript. Eychenne J, Le Pennec JL, Troncoso L, Gouhier M, Nedelec JM (2012) Causes and
consequences of bimodal grain-size distribution of tephra fall deposited
Funding during the August 2006 Tungurahua eruption (Ecuador). Bull Volcanology
This study was supported by MEXT/JSPS KAKENHI Grant Number 74(1):187–205. https://doi.org/10.1007/s00445-011-0517-5
JP26800261. Folch A (2012) A review of tephra transport and dispersal models: evolution,
current status, and future perspectives. J Volcanology Geothermal Res 235:
96–115. https://doi.org/10.1016/j.jvolgeores.2012.05.020
Availability of data and materials Folk RL, Ward WC (1957) Brazos River bar: a study in the significance of grain size
The dataset used in this study are available at https://doi.org/10.5281/ parameters. J Sedimentary Petrology 27(1):3–26. https://doi.org/10.1306/
zenodo.3379289. 74D70646-2B21-11D7-8648000102C1865D
Gilbert J, Lane S, Sparks R, Koyaguchi T (1991) Charge measurements on particle
Competing interests fallout from a volcanic plume. Nature 349(6310):598–600. https://doi.org/10.
The authors declare that they have no competing interests. 1038/349598a0
Hammer J, Cashman K, Hoblitt R, Newman S (1999) Degassing and microlite
Author details crystallization during pre-climactic events of the 1991 eruption of Mt.
1
National Research Institute for Earth Science and Disaster Resilience, Pinatubo, Philippines. Bull Volcanology 60(5):355–380. https://doi.org/10.
Tennodai 3-1, Tsukuba 305-0006, Japan. 2Geological Survey of Japan, AIST, 1007/s004450050238
AIST No.7, Higashi 1-1-1, Tsukuba 305-8567, Japan. Iguchi M, Tameguri T, Ohta Y, Ueki S, Nakao S (2013) Characteristics of volcanic
activity at Sakurajima volcano’s Showa crater during the period 2006 to 2011
Received: 8 October 2019 Accepted: 13 December 2019 (Special Section, Sakurajima Special Issue). Bull Volcanological Soc Jpn 58(1):
115–135. https://doi.org/10.18940/kazan.58.1_115
Iguchi M, Yokoo A, Tameguri T (2010) Intensity of volcanic explosions at Showa
crater of Sakurajima volcano. Annuals of Disaster Prevention Research
References
Institute of Kyoto University 53:233–240
Andronico D, Cioni R (2002) Contrasting styles of Mount Vesuvius activity in the
period between the Avellino and Pompeii Plinian eruptions, and some Imura R (1991) Pyroclastic deposits of Suwanosejima volcano for the last 200
implications for assessment of future hazards. Bull Volcanology 64(6):372–391. years: a reconstruction of volcanic activity using the volcanic sand formation.
https://doi.org/10.1007/s00445-002-0215-4 J Geological Soc Jpn 97(10):865–868. https://doi.org/10.5575/geosoc.97.865
Bagheri G, Rossi E, Biass S, Bonadonna C (2016) Timing and nature of volcanic Imura R (1995) Pyroclastic deposit accumulated by small-scale eruptions. Bull
particle clusters based on field and numerical investigations. J Volcanology Volcanological Soc Jpn 40(3):119–132. https://doi.org/10.18940/kazan.40.3_119
Geothermal Res 327:520–530. https://doi.org/10.1016/j.jvolgeores.2016.09.009 Iriyama Y, Toramaru A, Yamamoto T (2018) Theory for deducing volcanic activity
Blott SJ, Pye K (2001) GRADISTAT: a grain size distribution and statistics package from size distributions in plinian pyroclastic fall deposits. J Geophysical Res
for the analysis of unconsolidated sediments. Earth Surface Processes Solid Earth 123(3):2199–2213. https://doi.org/10.1002/2017JB014782
Landforms 26(11):1237–1248. https://doi.org/10.1002/esp.261 James MR, Lane SJ, Gilbert JS (2003) Density, construction, and drag coefficient of
Bonadonna C, Genco R, Gouhier M, Pistolesi M, Cioni R, Alfano F, Hoskuldsson A, electrostatic volcanic ash aggregates. J Geophysical Res 108(B9). https://doi.
Ripepe M (2011) Tephra sedimentation during the 2010 Eyjafjallajökull org/10.1029/2002JB002011
eruption (Iceland) from deposit, radar, and satellite observations. J Kobayashi T, Miki D, Sasaki H, Iguchi M, Yamamoto T, Uto K (2013) Geological
Geophysical Res Solid Earth 116(B12). https://doi.org/10.1029/2011JB008462 Map of Sakurajima Volcano, 2nd Ed. 1: 25,000
Bonadonna C, Mayberry GC, Calder ES, Sparks RSJ, Choux C, Jackson P, Lejeune Koyaguchi T, Ohno M (2001a) Reconstruction of eruption column dynamics on
AM, Loughlin SC, Norton GE, Rose WI, Ryan G (2002) Tephra fallout in the the basis of grain size of tephra fall deposits: 1. Methods. J Geophysical Res
eruption of Soufrière Hills Volcano, Montserrat. Geological Soc London 106(B4):6499–6512. https://doi.org/10.1029/2000JB900426
Memoirs 21(1):483–516. https://doi.org/10.1144/GSL.MEM.2002.021.01.22 Koyaguchi T, Ohno M (2001b) Reconstruction of eruption column dynamics on
Brazier S, Sparks RSJ, Carey SN, Sigurdsson H, Westgate J (1983) Bimodal grain the basis of grain size of tephra fall deposits: 2. Application to the Pinatubo
size distribution and secondary thickening in air-fall ash layers. Nature 1991 eruption. J Geophysical Res 106(B4):6513–6533. https://doi.org/10.1029/
301(5896):115–119. https://doi.org/10.1038/301115a0 2000JB900427
Carey SN, Sigurdsson H (1982) Influence of particle aggregation on deposition of Kozono T, Iguchi M, Miwa T, Maki M, Maesaka T, Miki D (2019) Characteristics of
distal tephra from the May 18, 1980, eruption of Mount St. Helens volcano. J tephra fall from eruptions at Sakurajima volcano, revealed by optical
Geophysical Res 87(B8):7061–7072. https://doi.org/10.1029/JB087iB08p07061 disdrometer measurements. Bull Volcanology 81(7):41. https://doi.org/10.
Chojnicki KN, Clarke AB, Adrian RJ, Phillips JC (2014) The flow structure of jets 1007/s00445-019-1300-2
from transient sources and implications for modeling short-duration Miura K, Ban M, Ohba T, Fujinawa A (2012) Sequence of the 1895 eruption of the
explosive volcanic eruptions. Geochemistry Geophysics Geosystems 15(12): Zao volcano, Tohoku Japan. J Volcanology Geothermal Res 247:139–157.
4831–4845. https://doi.org/10.1002/2014gc005471 https://doi.org/10.1016/j.jvolgeores.2012.08.005
Chojnicki KN, Clarke AB, Phillips JC, Adrian RJ (2015a) Rise dynamics of unsteady Miwa T, Geshi N, Shinohara H (2013) Temporal variation in volcanic ash texture
laboratory jets with implications for volcanic plumes. Earth Planetary Sci Lett during a Vulcanian eruption at the Sakurajima volcano, Japan. J Volcanology
412(0):186–196. https://doi.org/10.1016/j.epsl.2014.11.046 Geothermal Res 260:80–89. https://doi.org/10.1016/j.jvolgeores.2013.05.010
Chojnicki KN, Clarke AB, Phillips JC, Adrian RJ (2015b) The evolution of volcanic Miyabuchi Y, Hanada D, Niimi H, Kobayashi T (2013) Stratigraphy, grain-size and
plume morphology in short-lived eruptions. Geology 43(8):707–710. https:// component characteristics of the 2011 Shinmoedake eruption deposits,
doi.org/10.1130/G36642.1 Kirishima Volcano, Japan. J Volcanology Geothermal Res 258:31–46. https://
Clarke AB (2013) Unsteady explosive activity: Vulcanian eruptions. In: Fagents SA, doi.org/10.1016/j.jvolgeores.2013.03.027
Gregg TKP, Lopes RMC (eds) Modeling volcanic processes: the physics and Oishi M, Nishiki K, Geshi N, Furukawa R, Ishizuka Y, Oikawa T, Yamamoto T,
mathematics of volcanism. Cambridge University Press, England, pp 129–152. Nanayama F, Tanaka A, Hirota A, Miwa T (2018) Distribution and mass of
https://doi.org/10.1017/CBO9781139021562.007 tephra-fall deposits from volcanic eruptions of Sakurajima Volcano based on
Costa A, Folch A, Macedonio G (2010) A model for wet aggregation of ash posteruption surveys. Bull Volcanology 80(4):42. https://doi.org/10.1007/
particles in volcanic plumes and clouds: 1. Theoretical formulation. Journal of s00445-018-1215-3
Geophysical Research 115(B9). https://doi.org/10.1029/2009JB007175 Poulidis AP, Takemi T, Iguchi M, Renfrew IA (2017) Orographic effects on the
Dellino P, Mele D, Bonasia R, Braia G, La Volpe L, Sulpizio R (2005) The analysis of transport and deposition of volcanic ash: a case study of Mount Sakurajima,
the influence of pumice shape on its terminal velocity. Geophysical Res Lett Japan. J Geophysical Res Atmospheres 122(17):9332–9350. https://doi.org/10.
32(21). https://doi.org/10.1029/2005GL023954 1002/2017JD026595Miwa et al. Progress in Earth and Planetary Science (2020) 7:3 Page 16 of 16
Schumacher R (1994) A reappraisal of Mount St. Helens’ ash clusters–depositional
model from experimental observation. Bull Volcanology 59(3):253–260.
https://doi.org/10.1016/0377-0273(94)90099-X
Sheridan M, Wohletz K, Dehn J (1987) Discrimination of grain-size subpopulations
in pyroclastic deposits. Geology 15(4):367–370. https://doi.org/10.1130/0091-
7613(1987)152.0.CO;2
Shimbori T (2016) Tephra transport: modeling and forecasting. Bull Volcanological
Soc Jpn 61(2):399–427. https://doi.org/10.18940/kazan.61.2_399
Sparks RSJ, Bursik MI, Carey S, Gilbert J, Glaze L, Sigurdsson H, Woods A (1997)
Volcanic plumes. Wiley, New Jersey
Taddeucci J, Scarlato P, Montanaro C, Cimarelli C, Del Bello E, Freda C, Andronico
C, Gudmundsson MT, Dingwell DB (2011) Aggregation-dominated ash
settling from the Eyjafjallajökull volcanic cloud illuminated by field and
laboratory high-speed imaging. Geology 39(9):891–894. https://doi.org/10.
1130/G32016.1
Tournigand P-Y, Taddeucci J, Gaudin D, Peña Fernández JJ, Del Bello E, Scarlato
P, Kueppers U, Sesterhenn J, Yokoo A (2017) The initial development of
transient volcanic plumes as a function of source conditions. J Geophysical
Res Solid Earth 122(12):9784–9803. https://doi.org/10.1002/2017JB014907
Walker GPL (1971) Grain-size characteristics of pyroclastic deposits. J Geology
79(6):696–714. https://doi.org/10.1086/627699
Wilson L, Huang T (1979) The influence of shape on the atmospheric settling
velocity of volcanic ash particles. Earth Planetary Sci Lett 44(2):311–324.
https://doi.org/10.1016/0012-821X(79)90179-1
Wohletz KH, Sheridan MF, Brown WK (1989) Particle size distributions and the
sequential fragmentation/transport theory applied to volcanic ash. J
Geophysical Res 94(B11):15703–15721. https://doi.org/10.1029/
JB094iB11p15703
Woods AW, Kienle J (1994) The dynamics and thermodynamics of volcanic
clouds: theory and observations from the April 15 and April 21, 1990
eruptions of Redoubt Volcano, Alaska. J Volcanology Geothermal Res 62(1–4):
273–299. https://doi.org/10.1016/0377-0273(94)90037-X
Publisher’s Note
Springer Nature remains neutral with regard to jurisdictional claims in
published maps and institutional affiliations.You can also read