Nasal airflow of patient with septal deviation and allergy rhinitis
←
→
Page content transcription
If your browser does not render page correctly, please read the page content below
Lim et al. Visual Computing for Industry, Biomedicine, and Art                (2021) 4:14
https://doi.org/10.1186/s42492-021-00080-2
                                                                                                               Visual Computing for Industry,
                                                                                                                        Biomedicine, and Art

 ORIGINAL ARTICLE                                                                                                                                    Open Access

Nasal airflow of patient with septal
deviation and allergy rhinitis
Zi Fen Lim1, Parvathy Rajendran1,2* , Muhamad Yusri Musa3 and Chih Fang Lee1

  Abstract
  A numerical simulation of a patient’s nasal airflow was developed via computational fluid dynamics. Accordingly,
  computerized tomography scans of a patient with septal deviation and allergic rhinitis were obtained. The three-
  dimensional (3D) nasal model was designed using InVesalius 3.0, which was then imported to (computer aided 3D
  interactive application) CATIA V5 for modification, and finally to analysis system (ANSYS) flow oriented logistics upgrade
  for enterprise networks (FLUENT) to obtain the numerical solution. The velocity contours of the cross-sectional area
  were analyzed on four main surfaces: the vestibule, nasal valve, middle turbinate, and nasopharynx. The pressure and
  velocity characteristics were assessed at both laminar and turbulent mass flow rates for both the standardized and the
  patient’s model nasal cavity. The developed model of the patient is approximately half the size of the standardized
  model; hence, its velocity was approximately two times more than that of the standardized model.
  Keywords: Three-dimensional nasal airflow model, Septal deviation, Allergy rhinitis, Computational fluid dynamics

Introduction                                                                            a critical role in nasal obstruction symptoms, the aesthetic
The nasal cavity is one of the most critical parts of the hu-                           appearance of the nose, increased nasal resistance, and
man respiratory system [1–3]. Nasal obstructions, such as                               sometimes snoring [7]. Symptoms of a deviated septum
nasal septum deviations, enlarged turbinates, nasal polyps,                             include sinus infections, sleep apnea, snoring, repetitive
enlarged adenoids, tumors, and nasal congestion, can trigger                            sneezing, facial pain, nosebleeds, and difficulty with
breathing difficulties. In this study, two major nasal obstruc-                         breathing, as well as mild to severe loss of smell [8].
tions are considered: septal deviation and allergic rhinitis.                              Rhinitis is defined as an inflammation of the nasal mu-
   The nasal septum is the bone that divides one side of                                cosa, which affects approximately 40% of the population
the nose from the other. It is rarely perfectly straight,                               [9–11]. Allergic rhinitis is the most common cause of
and it is comprises a central supporting skeleton covered                               mucosal inflammation, and it affects one in six individuals
on each side by mucous membranes [4, 5]. The front                                      [12]. There are two types of allergic rhinitis: seasonal and
part of this natural partition is a firm but bendable                                   perennial. Seasonal allergic rhinitis can occur in spring,
structure, made mostly of cartilage and covered by skin                                 summer, and early fall. It is usually caused by allergic sen-
with a substantial supply of blood vessels. In addition, it                             sitivity to airborne mold spores or pollen from grass, trees,
is slightly crooked in over 80% of people [6].                                          and weeds. Allergy rhinitis is estimated to affect nearly
   When the septum is crooked or deviated, it blocks nasal                              one in every six Americans, and generates $2 to $5 billion
passage, and a surgical operation, submucosal resection, is                             in direct health expenditures annually [12].
required to restore clear breathing. Septal deviations play                                To better understand the physiology of the nasal cavity,
                                                                                        this study adopts the computational fluid dynamics (CFD)
* Correspondence: aeparvathy@usm.my
                                                                                        method to obtain and compare flow patterns. Hence, CFD
1
 School of Aerospace Engineering, Universiti Sains Malaysia, 11800 Pulau                has become a fast and convenient research tool for study-
Pinang, Malaysia                                                                        ing airflow in the human airway, especially when investi-
2
 Faculty of Engineering & Computing, First City University College, 47800
Selangor, Malaysia
                                                                                        gating heat and humidity transfer, which is difficult to
Full list of author information is available at the end of the article                  investigate with other experimental techniques [13–16].
                                        © The Author(s). 2021 Open Access This article is licensed under a Creative Commons Attribution 4.0 International License,
                                        which permits use, sharing, adaptation, distribution and reproduction in any medium or format, as long as you give
                                        appropriate credit to the original author(s) and the source, provide a link to the Creative Commons licence, and indicate if
                                        changes were made. The images or other third party material in this article are included in the article's Creative Commons
                                        licence, unless indicated otherwise in a credit line to the material. If material is not included in the article's Creative Commons
                                        licence and your intended use is not permitted by statutory regulation or exceeds the permitted use, you will need to obtain
                                        permission directly from the copyright holder. To view a copy of this licence, visit http://creativecommons.org/licenses/by/4.0/.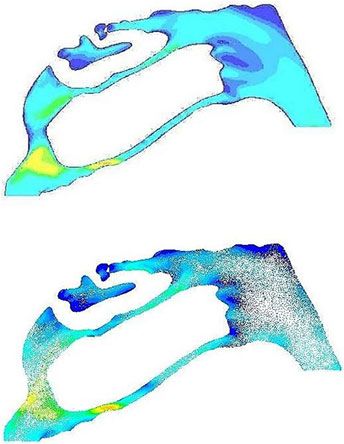
Lim et al. Visual Computing for Industry, Biomedicine, and Art   (2021) 4:14                                                  Page 2 of 11

CFD simulations help to better understand the complex                   Table 1 Number of 2D slices for CT scans of patient
anatomy of the nasal, as well as the implications of disease            Axis          Total number of slices      Number of slices used
and surgery. It has the potential to help surgeons and rhi-             Axial         238                         103–171
nologists plan surgery and simulate surgery by correcting               Coronal       511                         216–427
perceived anatomical abnormalities on a model called “vir-
                                                                        Sagittal      511                         215–301
tual surgery” and then comparing flow predictions to help
surgeons and rhinologists decide whether minor or major
corrective surgery is needed [17]. Hence, CFD simulation                after mesh creation in CATIA. Surface and volume
findings, such as cross-sectional areas, velocity magni-                creation will also be performed in CATIA to recon-
tudes, contours, and streamlines, can be examined in de-                struct a solid model. Then, the 3D model saved as
tail, allowing for improvements and corrections if there                a STEP file was imported into ANSYS FLUENT for
are any inadequacies or insufficiencies in information for              simulation.
rhinologists as a pre-operative tool to aid in clinical deci-
sion making.                                                            Simulation
   In this study, the computerized tomography (CT)                      The nasal wall was assumed to be rigid, with a no-slip
scans of a female adult patient with septal deviation and               boundary condition, and mucous effects were assumed
allergic rhinitis were obtained with consent from the                   to be negligible [23, 24]. The nostril inlet is defined by
Advanced Medical and Dental Institute, University of                    the mass flow inlet, while the outflow boundary condi-
Science Malaysia. The three-dimensional (3D) model of                   tion represents the outlet at the nasopharynx. Any back-
the nasal cavity was developed from CT scans and                        flow at the outlet was assumed to be at 32.6 °C, and
exported to CATIA V5, and then airflow simulation was                   100% relative humidity was imported into ANSYS FLU-
performed. To analyze the impact of septal deviation                    ENT [15]. The pressure-based model was adopted for
and allergic rhinitis on nasal airflow, the obtained results            this simulation, as the density of air was assumed to be
will be compared with a standardized nasal cavity.                      constant throughout the geometry [25]. The flow of
                                                                        mucus was not considered owing to its minimal thick-
Methods                                                                 ness and low velocity [23, 26]. The mesh models of the
CFD can predict airflow and particle deposition in the                  three meshing types for the mesh dependency study
nasal cavity [11, 18–21]; hence, it is widely used in the               (Fig. 1) and its model elements are presented in Table 2.
airflow prediction of complex structures. In this case,                    The accuracy of the numerical results is closely re-
FLUENT was adopted for the simulation to obtain an                      lated to the mesh density, as well as its distribution.
accurate airflow simulation of the patient’s nasal cavity.              Therefore, the mesh plays a significant role in the
To determine the impact of septal deviation and allergic                outcome of numerical simulations [10, 27]. A func-
rhinitis, the CFD results of fluid mechanical properties                tional mesh must be able to resolve the velocity vec-
were then analyzed and compared with the standardized                   tors and effectively capture the fluid properties in all
nasal cavity model of a health female adult.                            regions inside the nasal cavity [28, 29]. After the
                                                                        mesh dependency study, a simulation was performed
Model reconstruction                                                    for the medium meshed model in ANSYS FLUENT.
InVesalius 3.0 is an open-source software for virtual                   The mesh dependency study exhibited an optimized
modeling, and it can obtain an accurate model of the                    meshing of 7,814,330 elements. The model was
anatomical region to be studied, as high-quality medical                adopted for mass flow rates ranging from 100 mL/s to
images are necessary [22]. The digital imaging and com-                 425 mL/s, as the inspiratory flow rate for healthy
munications in medicine files of a female patient were                  adults is varied between 80 mL/s and 200 mL/s for
imported into the InVesalius 3.0. The number of two-                    light breathing and a range of 200–660 mL/s for non-
dimensional (2D) slices in three axes is presented in                   normal conditions such as during exercises [30].
Table 1. Because this study focused solely on the nasal
cavity, the number of slices that did not involve the nasal             Results
cavity was not considered.                                              The results obtained from the simulation are pre-
  An inverted model of the patient’s airway was con-                    sented and discussed in three sections. The Geomet-
structed by filling the space in which the air flows,                   rical comparisons section presents a geometrical
including the 2D slices mentioned in Table 1. The re-                   comparison of two nasal cavity models: the current
constructed airway of the subject can be visualized                     study with the female adult-patient model and the
using this software. Then, the model was exported as                    standardized female adult model generated by Lee
a STL file and imported into CATIA V5 as the cloud                      et al. [31] in their previous research. In this section,
point. The model was then smoothened and modified                       the comparison is performed via the visual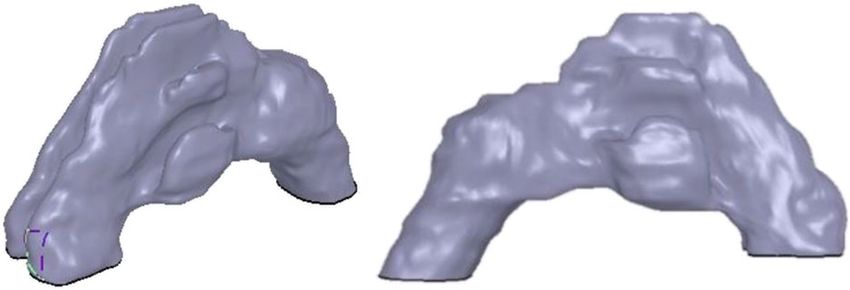
Lim et al. Visual Computing for Industry, Biomedicine, and Art     (2021) 4:14                                              Page 3 of 11

 Fig. 1 Mesh dependency study at mass flow rate of 125 mL/s

observation of both the 3D nasal cavity models and                        resistance and functions of the nose [32–35]. Geometric
their cross-sectional areas at different planes. The                      configuration plays a significant role in the flow distribu-
Pressure section focuses on the pressure at different                     tion inside the nasal cavity, especially in disease cases, as
planes with varying mass flow rates, and the decrease                     the imbalance of the nasal cavity owing to septal devi-
in pressure of the nasal model. The Velocity section                      ation is considered to be a common etiology of nasal air-
then compares both models, including the velocity                         way obstruction [4, 13, 16]. The geometric comparisons
magnitude in different planes and graphical results                       of the 3D models are presented in Table 3.
obtained from the CFD analysis, as well as the vel-                         As presented in Table 3, the model of the patient’s
ocity contour of both models.                                             nasal cavity exhibits several disconnections that cause
                                                                          difficulties in breathing [15, 36]. In addition, the cross-
Geometrical comparisons                                                   section of the middle turbinate significantly differs from
Respiratory physiology and pathology significantly de-                    the standardized model in size, and the standardized
pend on the airflow inside the nasal cavity. Because nasal                model has a smoother and cleaner airway than that of
airflow is profoundly affected by the geometry of the                     the patient’s model. The patient’s model shows many
flow passage, changes in the shape of the nasal cavity                    creases on the surface as there are several growths in the
due to diseases or surgical treatments alter the nasal                    nasal airway owing to allergic rhinitis [9, 37, 38].

Table 2 Meshing of model
Meshed model                                                     Meshing type                                       Number of elements
                                                                 Coarse                                             6,072,337

                                                                 Medium                                             7,814,330

                                                                 Fine                                               8,755,534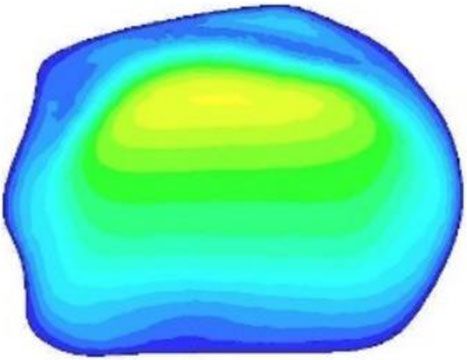
Lim et al. Visual Computing for Industry, Biomedicine, and Art (2021) 4:14 Page 4 of 11
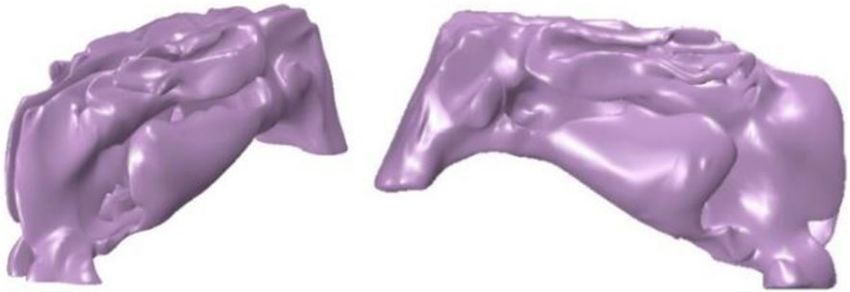
Table 3 Geometrical comparisons of 3D models
Nasal model 3D geometry
Female adult patient with septal deviation and allergic rhinitis
Standardized female adult by Lee et al. [31]
For better observations, the comparisons are focused on volume of the patient’s model is 48% smaller than
four different cross-sectional areas: vestibule, nasal valve, that of the standardized model. The cross-sectional
middle turbinate, and nasopharynx. To demonstrate the area and volume results are relatively similar to the
differences due to septal deviation and allergic rhinitis, the patient’s model, which is approximately half the size
cross-sectional areas at different planes of both models of the standardized model.
were compared and are presented in Table 4.
In general, the standardized model by Lee et al. [31] Pressure
exhibits a higher cross-sectional area than the patient’s To prevent diseases and determine their treatment
model. On average, the patient’s model is 58% smaller methods, it is necessary to understand the breathing
than the standardized model. The percentage differences mechanism [39, 40]. In several studies, the pressure of air-
in each plane ranges from 53% to 63%, which indicates ways is conventionally measured as a function of time at
that the patient’s model is smaller in size than that of the domain exit [40, 41]. Therefore, a computational ana-
the standardized model. As presented in Fig. 2, both lysis was performed on the patient’s 3D nasal model, and
models exhibit a similar trend in their cross-sectional the pressure drop was calculated for mass flow rates ran-
areas. In addition, the smallest and largest cross- ging from 100 to 425 mL/s. The pressure obtained for this
sectional areas of both models are at their nasal valve part is the pressure relative to the atmospheric pressure.
and middle turbinate, respectively. Here, negative pressure indicates human breathing with a
To obtain a more accurate figure that demonstrates pressure lower than atmospheric pressure. The pressure
the apparent differences between both models, the drop across the nasal cavity, from the model inlet to its
volume of each model was also calculated. The vol- outlet, was obtained, as illustrated in Fig. 2.
ume of the patient’s model is 23.71 cm3, whereas that The inlet pressure increased drastically as the mass
of the standardized model is 45.23 cm3. Therefore, the flow rate increased, whereas the outlet pressure
Table 4 Comparison between cross-sectional areas at different planes of both models
Plane Cross-sectional area (cm2) Percentage difference
Standardized model by Lee et al. [31] Patient’s model
Inlet 0.34872949 0.15066816 57%
Vestibule 0.35425289 0.15388511 57%
Nasal valve 0.29106226 0.13621432 53%
Middle turbinate 0.64515747 0.26335791 59%
Nasopharynx 0.54266273 0.19838503 63%
Outlet 0.35474969 0.16834382 53%
Average 0.422769088 0.178475725 58%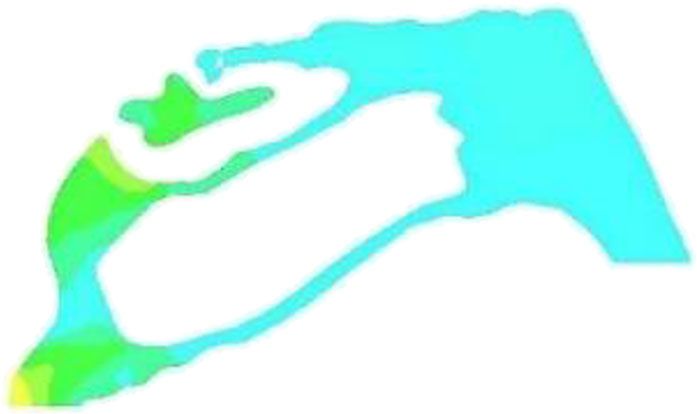
Lim et al. Visual Computing for Industry, Biomedicine, and Art     (2021) 4:14                                              Page 5 of 11

 Fig. 2 Graph of pressure drop against mass flow rate

remained constant at different mass flow rates. From the                  mass flow rate higher than 250 mL/s is considered turbu-
obtained graph, it can be observed that the pressure                      lent airflow [25, 43, 44]. The resistance in the airways trig-
drop increases gradually as the mass flow rate increases.                 gers a pressure drop. Airway resistance is due to the flow
The pressure difference induces different local flow rates                triggered by frictional forces. It is defined as the ratio of
and wall shear stress distributions, thus triggering fur-                 the driving pressure to the airflow rate.
ther local dynamics [41, 42]. To observe the pressure                        Resistance to airflow in the airways depends on (1) the
changes throughout the nasal airway, the pressures at                     flow (laminar or turbulent flow), (2) dimensions of the
different planes and different mass flow rates are ob-                    airway, and (3) viscosity of the gas [39]. Therefore, pres-
tained, as presented in Fig. 3.                                           sure drops climactically at the turbulent flow. It is also
   The graph shows that the pressure drop increases stead-                apparent that the pressure continues to drop from the
ily throughout the nasal airway owing to the wall shear                   inlet to the outlet at the same flow rate. Inlet pressure is
stress [41, 42]. The wall shear stress during inspiration                 always the highest pressure, followed by pressures at the
was predominantly higher in the anterior region than in                   vestibule, nasal valve, middle turbinate, nasopharynx,
other regions [43]. After a mass flow rate of 250 mL/s, the               and finally, the nasal outlet, which has the lowest pres-
pressure change increases drastically, and some re-                       sure. The pressure contour obtained from the side view
searchers have stated that a mass flow rate of less than                  in Table 5 depicts the pressure distribution for both
250 mL/s is defined as laminar airflow. In comparison, a                  laminar and turbulent flows.

 Fig. 3 Pressure on different planes at different mass flow rate
Lim et al. Visual Computing for Industry, Biomedicine, and Art (2021) 4:14 Page 6 of 11
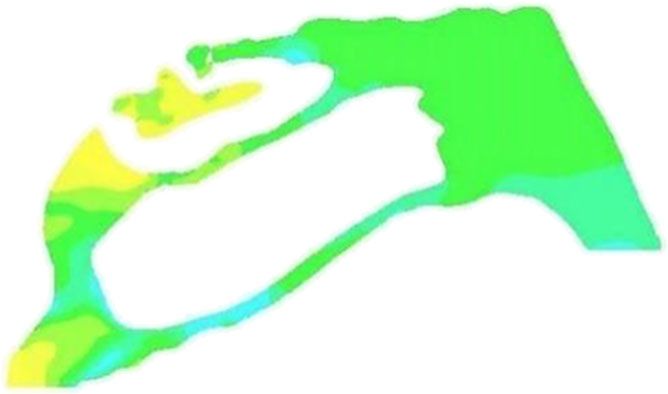
Table 5 Side view pressure contour for both laminar and turbulent flows
Mass flow rate 125 mL/s 400 mL/s
Type of flow Laminar Turbulent
Velocity any inconvenience to the patient [45]. From the graph, it
The magnitude of velocity between the patient’s model is evident that both models have the same velocity char-
and the standardized model by Lee et al. [31] were com- acteristics throughout the inhalation process. Both
pared at different planes. The velocity magnitude of the models exhibit their highest and lowest velocities at the
models at the same mass flow rate, 125 mL/s, is pre- nasal valve and middle turbinate, respectively.
sented with percentage differences in Table 6, and plot- The primary function of the nasal valve is to limit the
ted as a graph to demonstrate the velocity characteristics amount of airflow generated in the nasal cavity and to
of the patient model. The results obtained are also pre- converge the flow. Therefore, the nasal valves always re-
sented in Table 6. quire a high velocity before the separate airflows con-
In general, the velocity magnitude of the patient’s verge from two to one. Because the middle turbinate has
model is significantly higher than that of the standard- the largest surface area, it decreases the erectile and vas-
ized model, with percentage differences ranging from cular tissue density, and is less prominent in nasal air-
70% to 128%, and an average of 99% higher velocity than flow patterns. Therefore, the middle turbinates always
the standardized model. The lowest differences in vel- have the lowest air velocity magnitude throughout the
ocity for both models are at the middle turbinate. There- nasal cavity [46].
fore, septal deviation and allergic rhinitis had the least To observe the differences in velocity distribution for
effect on the middle turbinate. both laminar and turbulent flows, the velocity contour
However, the highest velocity difference occurs at the and velocity vector of the side view for both airflow
nasopharynx, which cleans the inspired air of pollutant types are presented in Table 7. The model for the turbu-
particles and protects the delicate lower respiratory tract. lent flow distribution exhibits a higher radial flow after
Therefore, a high velocity at this plane does not cause the middle turbinate than the model for the laminar flow
Table 6 Comparison between velocity magnitude at different planes at 125 mL/s
Planes Velocity magnitude (m/s) Percentage different
Standardized model by Lee et al. [31] Patient’s model
Inlet 0.38773257 0.796214 −105%
Vestibule 0.35802209 0.675221 −89%
Nasal valve 0.42031079 0.880186 −109%
Middle turbinate 0.19572208 0.331966 −70%
Nasopharynx 0.25819995 0.589943 −128%
Outlet 0.35236112 0.642273 −82%
Average 0.328724767 0.652633833 −99%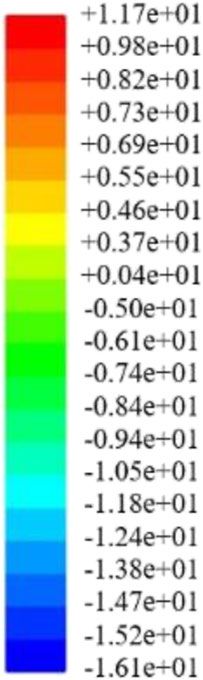
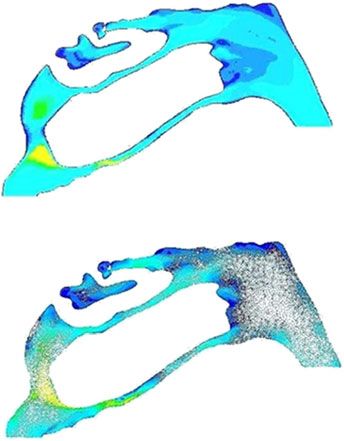
Lim et al. Visual Computing for Industry, Biomedicine, and Art   (2021) 4:14                                             Page 7 of 11

Table 7 Side view of velocity contour and vector for both laminar and turbulent flows
Mass flow rate                            Type of flow                         Side view of velocity contour
125 mL/s                                  Laminar

400 mL/s                                  Turbulent

distribution. This verifies that there are significant differ-          velocity with the coronal cross-section. These flow vol-
ences in the velocity pattern characteristics for both lam-             umes were used to estimate the relative flow allocation
inar and turbulent flows.                                               within each cross-section region as a percentage of the
   The flow distributions for both laminar and turbulent                total volumetric flow for that cross-section [49]. Consid-
flows are almost the same at the beginning. However,                    ering the steady airflow, sequentially recorded data could
differences emerge after the middle turbinate, as it has                be used to determine the location of errors with magni-
the most complex structure throughout the nasal cavity.                 tudes relative to their respective velocity vectors [41, 50].
Vortices occur after the middle turbinate because the mid-              It is necessary to ensure a no-slip condition at all solid
dle and inferior turbinates are crucial structures for filtra-          boundaries, which means that the contour plots must be
tion and are used to enhance heating and humidification,                zero at all physical limitations [41, 48]. A comparison
when the mucosal wall surface area is enlarged [47].                    between the velocity contours at a mass flow rate of 125
   The velocity vectors and contours are presented in                   mL/s is presented in Table 8.
Table 7 to compare the differences between the laminar                    The velocity distribution inside the airway can be ob-
and turbulent flows of 125 mL/s and 400 mL/s, respect-                  served from the obtained velocity contours [31, 51]. The
ively. Both models exhibit similar patterns of velocity                 velocity of the airflow and its spatial and temporal varia-
contours, with significant differences in velocity magni-               tions close to the wall, as well as corresponding shear
tudes. The higher mass flow rate of the turbulent flow                  rate or shear stress at the wall are essential factors ne-
increases the magnitudes of velocity observed along the                 cessary for several physiological processes, such as the
nasal cavity. However, the nasal valve usually has the                  pressure drop throughout the nose, particle deposition,
highest velocity magnitude for both laminar and turbu-                  and exchange processes at the wall [16, 51, 52]. Wall
lent flows. Simultaneously, this validates the role of the              shear has also been identified as a putative agent for the
nasal valve in converging airflow from two to one, as                   mechano-transduction between the airflow and nasal
well as that of the middle turbinate in heating and hu-                 epithelium [52, 53].
midifying the air owing to the increase in the surface                    The standardized model has an excellent oval shape
area of the meatus regions [47].                                        for both the vestibule and nasal valve; however, the
   The velocity contour was considered for comparison.                  patient’s model has an irregular and inconsistent
It clearly illustrates the physical differences between                 shape. The shape irregularity at the septal deviation
both models, as it presented 2D velocity fields in planes               caused the air to enter unevenly. The middle turbin-
parallel to the flow pattern throughout the nasal cavity                ate of the standardized model is almost symmetrical
[41, 48]. The airflow through each of these regions was                 on the left and right sides, and it has a broader air-
computed by integrating the axial component of the                      way. However, the middle turbinate of the patient
Lim et al. Visual Computing for Industry, Biomedicine, and Art   (2021) 4:14                                            Page 8 of 11

Table 8 Comparison of velocity contours at mass flow rate 125 mL/s
Planes                      Standardized model by Lee et al. [31]                      Patient’s model
Vestibule

Nasal valve

Middle turbinate

Nasopharynx

model is narrower and unsymmetrical compared to                         Conclusions
the standardized model. This irregularity is due to the                 In conclusion, a 3D nasal cavity model of a female adult
airway’s growth towing to allergic rhinitis, which re-                  patient with septal deviation and allergic rhinitis was de-
duces the patient’s nasal airway [9, 15]. The velocity                  veloped. The airflow characteristics owing to septal devi-
of the standardized model ranged from 0 to 0.852 m/                     ation and allergic rhinitis were investigated and studied
s, whereas that of the patient’s model ranged from 0                    by analyzing the airflow simulation results using ANSYS
to 1.84 m/s. The standardized model has a smaller                       Fluent. The developed model for the patient is approxi-
range in velocity than the patient’s model, as it has a                 mately half the size of the standardized model; hence, its
broader airway, while the patient’s model has overall                   velocity is approximately two times higher than that of
higher velocity magnitudes than the standardized                        the standardized model during inspiration. Comparisons
model, during breathing.                                                were carried out to study the impact of septal deviation
                                                                        and allergic rhinitis on the patient’s nasal airflow. The
Discussion                                                              standardized model with a smoother and wider airway
A summary of clinical implications and translations for                 exhibited a better velocity distribution during breathing
this nasal airflow study is presented in Table 9. There-                than the patient’s model. In contrast, the patient’s model
fore, using the 3D reconstruction model with airflow                    with growth blockage had an asymmetrical and narrow
analysis as presented in this paper, specialists can see a              airway, thereby causing the patient’s breathing to be
clear picture of patients’ bodies, enabling a better under-             higher in velocity than that of the healthy standardized
standing of the condition, which helps foresee a patient’s              model, at the same mass flow rate. Using the presented
body responds to illness treatment. Moreover, these 3D                  model, specialists can understand the human form in
reconstruction models are useful in the rapid prototyp-                 three dimensions, which allows them to predict how the
ing technology of modified anatomical implants and                      body will respond to illness better. Furthermore, these
demonstrate multiple abnormalities requiring an add-                    3D reconstruction models can be used in the rapid
itional diagnostic value. The outcome of the study may                  prototyping of modified anatomical implants and can
also minimize disease risk through preventive medicine                  show multiple abnormalities, which adds to the diagnos-
and conventional drug therapies.                                        tic value. The study’s findings may also help to reduce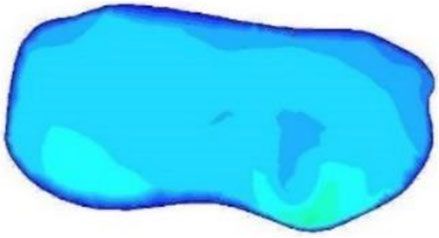
Lim et al. Visual Computing for Industry, Biomedicine, and Art            (2021) 4:14                                                               Page 9 of 11

Table 9 A summary of clinical implications
Division       Standardized model by Lee et al.              Patient’s model
               [31]
Nasal airway A smooth and clean airway                       Lots of creases on the surface as there are many growths in the nasal airway due to allergy
surface                                                      rhinitis;
                                                             Many disconnections that lead to difficulties in breathing.
Cross-         Good nasal cross-sectional areas              Averagely 58% smaller cross-sectional areas than the standardized model.
sectional
               Smallest cross-sectional area at the nasal valve and the largest cross-sectional area in the middle turbinate.
areas
Volume         Good nasal volume                             Forty-eight percent less volume than the standardized model
Nasal          Pressure drop increases gradually throughout the nasal airway due to the wall shear stress;
pressure       Wall shear stress during inspiration is predominantly higher in the anterior region;
               Inlet pressure has always been the highest, followed by the vestibule, nasal valve, middle turbinate, nasopharynx, and finally, the nasal
               outlet with the lowest pressure.
Velocity       Good nasal velocity magnitude                 The patient’s model’s overall velocity magnitude is much higher than the standardized
                                                             model, ranged from 70% to 128% of differences and have an average of 99% higher velocity
                                                             than the standardized model;
                                                             Septal deviation and allergy rhinitis cause the least effect on the middle turbinate;
                                                             High velocity at the nasopharynx does not cause any inconvenience for the patient.
               The lowest differences in velocity are at the middle turbinate;
               The highest velocity difference occurs at the nasopharynx to clean the inspired air of pollutant particles and protect the delicate lower
               respiratory tract.
Velocity       The flow distributions for both laminar and turbulent are almost the same at the beginning;
contour        Turbulent flow distribution has more radial flow after the middle turbinate.
Shape          Excellent oval shape for both the             Has irregular and inconsistent shapes;
               vestibule and nasal valve;                    Shape irregularity at the septal deviation that caused the air to enter unevenly;
               Middle turbinate is almost symmetry           Middle turbinate is narrower and unsymmetrical.
               for the left and right side.

disease risk through preventive medicine and traditional                          Author details
                                                                                  1
drug therapies.                                                                    School of Aerospace Engineering, Universiti Sains Malaysia, 11800 Pulau
                                                                                  Pinang, Malaysia. 2Faculty of Engineering & Computing, First City University
                                                                                  College, 47800 Selangor, Malaysia. 3Advanced Medical and Dental Institute,
Abbreviations                                                                     Universiti Sains Malaysia, 11800 Pulau Pinang, Malaysia.
2D: Two-dimensional; 3D: Three-dimensional; ANSYS: Analysis system;
CATIA: Computer aided three-dimensional interactive application;                  Received: 15 February 2021 Accepted: 27 April 2021
CFD: Computational fluid dynamics; CT: Computerized tomography;
FLUENT: Flow oriented Logistics Upgrade for Enterprise Networks
                                                                                  References
                                                                                  1. Hansen F, Wood DE (2013) The adrenal fatigue solution. https://adrenalfa
Acknowledgements
                                                                                      tiguesolution.com/. Accessed 9 Apr 2021
Not applicable.
                                                                                  2. Marks TN, Maddux SD, Butaric LN, Franciscus RG (2019) Climatic adaptation
                                                                                      in human inferior nasal turbinate morphology: evidence from Arctic and
Authors’ contributions                                                                equatorial populations. Am J Phys Anthropol 169(3):498–512 https://doi.
ZFL, PR, and CFL conceptualized the project; ZFL and MYM developed the                org/10.1002/ajpa.23840
methodology and modeled the work; ZFL, PR, and CFL analyzed and                   3. Tracy LF, Basu S, Shah PV, Frank-Ito DO, Das S, Zanation AM et al (2019)
processed the data; ZFL, PR, and CFL contributed to the original draft                Impact of endoscopic craniofacial resection on simulated nasal airflow and
preparation; ZFL, PR, MYM, and CFL simulated the patient’s data; MYM, PR,             heat transport. Int Forum Allergy Rhinol 9(8):900–909 https://doi.org/10.1
and CFL supervised the study; ZFL, PR, MYM, and CFL validated the study               002/alr.22328
and contributed to writing, reviewing, and editing this manuscript. The           4. Kim SK, Heo GE, Seo A, Na Y, Chung SK (2014) Correlation between nasal
authors read and approved the final manuscript.                                       airflow characteristics and clinical relevance of nasal septal deviation to
                                                                                      nasal airway obstruction. Respir Physiol Neurobiol 192:95–101 https://doi.
                                                                                      org/10.1016/j.resp.2013.12.010
Funding                                                                           5. Radulesco T, Meister L, Bouchet G, Varoquaux A, Giordano J, Mancini J et al
This research was funded by the Universiti Sains Malaysia, No. 1001/PAERO/            (2019) Correlations between computational fluid dynamics and clinical
814276.                                                                               evaluation of nasal airway obstruction due to septal deviation: an
                                                                                      observational study. Clin Otolaryngol 44(4):603–611 https://doi.org/10.1111/
Availability of data and materials                                                    coa.13344
All data generated or analyzed during this study are included in this             6. Deviated Septum (2021). American academy of otolaryngology-head and
published article.                                                                    neck surgery. https://www.entnet.org/content/deviated-septum-overview.
                                                                                      Accessed 9 Apr 2021
                                                                                  7. Teixeira J, Certal V, Chang ET, Camacho M (2016) Nasal septal deviations: a
Declarations                                                                          systematic review of classification systems. Plast Surg Int 2016:7089123–
                                                                                      7089128 https://doi.org/10.1155/2016/7089123
Competing interests                                                               8. Holbrook EH, Meyers AD (2021) Disorders of taste and smell. https://
The authors declare that they have no competing interests.                            emedicine.medscape.com/article/861242-overview. Accessed 9 Apr 2021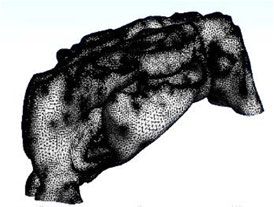
Lim et al. Visual Computing for Industry, Biomedicine, and Art                   (2021) 4:14                                                                Page 10 of 11

9.    Solé D, Sakano E, Cruz AA, Pastorino A, Prado E, de Mello FCF et al (2012) III     29. Mylavarapu G, Murugappan S, Mihaescu M, Kalra M, Khosla S, Gutmark E
      Consenso Brasileiro sobre Rinites. Braz J Otorhinolaryngol 75(6):3                     (2009) Validation of computational fluid dynamics methodology used for
10.   Borojeni AAT, Garcia GJM, Moghaddam MG, Frank-Ito DO, Kimbell JS, Laud                 human upper airway flow simulations. J Biomech 42(10):1553–1559 https://
      PW et al (2020) Normative ranges of nasal airflow variables in healthy adults.         doi.org/10.1016/j.jbiomech.2009.03.035
      Int J Comput Assist Radiol Surg 15(1):87–98 https://doi.org/10.1007/s11548-        30. Wen J, Inthavong K, Tu JY, Wang SM (2008) Numerical simulations for
      019-02023-y                                                                            detailed airflow dynamics in a human nasal cavity. Respir Physiol Neurobiol
11.   Zhang Y, Zhou XD, Lou M, Gong MJ, Zhang JB, Ma RP et al (2019)                         161(2):125–135 https://doi.org/10.1016/j.resp.2008.01.012
      Computational fluid dynamics (CFD) investigation of aerodynamic                    31. Lee CF, Abdullah MZ, Ahmad KA, Shuaib IL (2013) Standardization of
      characters inside nasal cavity towards surgical treatments for secondary               malaysian adult female nasal cavity. Comput Math Methods Med 2013:
      atrophic rhinitis. Math Probl Eng 2019:6240320–6240328 https://doi.org/1               519071–519011 https://doi.org/10.1155/2013/519071
      0.1155/2019/6240320                                                                32. Lee KB, Jeon YS, Chung SK, Kim SK (2016) Effects of partial middle
12.   Schoenfeld BJ, Contreras B, Tiryaki-Sonmez G, Wilson JM, Kolber MJ,                    turbinectomy with varying resection volume and location on nasal
      Peterson MD (2015) Regional differences in muscle activation during                    functions and airflow characteristics by CFD. Comput Biol Med 77:214–221
      hamstrings exercise. J Strength Cond Res 29(1):159–164 https://doi.org/10.1            https://doi.org/10.1016/j.compbiomed.2016.08.014
      519/JSC.0000000000000598                                                           33. Frank-Ito DO, Kimbell JS, Borojeni AAT, Garcia GJM, Rhee JS (2019) A
13.   Kim SK, Na Y, Kim JI, Chung SK (2013) Patient specific CFD models of nasal             hierarchical stepwise approach to evaluate nasal patency after virtual
      airflow: overview of methods and challenges. J Biomech 46(2):299–306                   surgery for nasal airway obstruction. Clin Biomech 61:172–180 https://doi.
      https://doi.org/10.1016/j.jbiomech.2012.11.022                                         org/10.1016/j.clinbiomech.2018.12.014
14.   Bruening J, Goubergrits L, Hildebrandt T (2016) Team 190: CFD simulation of        34. Li C, Sun XZ, Zhao M, Yu S, Huang Q, Zhang XQ et al (2019) Comparison of
      airflow within a nasal cavity The UberCloud. https://community.                        airflow characteristics after Draf III frontal sinus surgery and normal person
      theubercloud.com/wp-content/uploads/2016/09/Team-190-Jan-Bruening.                     by numerical simulation. Math Biosci Eng 16(4):1750–1760 https://doi.org/1
      pdf. Accessed 9 Apr 2021                                                               0.3934/mbe.2019084
15.   Garcia GJM, Bailie N, Martins DA, Kimbell JS (2007) Atrophic rhinitis: a CFD       35. Hildebrandt T, Brüning JJ, Schmidt NL, Lamecker H, Heppt W, Zachow S et al
      study of air conditioning in the nasal cavity. J Appl Physiol 103(3):1082–             (2019) The healthy nasal cavity-characteristics of morphology and related
      1092 https://doi.org/10.1152/japplphysiol.01118.2006                                   airflow based on a statistical shape model viewed from a surgeon’s
16.   Faramarzi M, Baradaranfar MH, Abouali O, Atighechi S, Ahmadi G, Farhadi P              perspective. Facial Plast Surg 35(1):9–13 https://doi.org/10.1055/s-0039-1677721
      et al (2014) Numerical investigation of the flow field in realistic nasal septal   36. Dilek F, Ozkaya E, Gultepe B, Yazici M, Iraz M (2016) Nasal fluid secretory
      perforation geometry. Allergy Rhinol (Providence) 5(2):70–77 https://doi.              immunoglobulin a levels in children with allergic rhinitis. Int J Pediatr
      org/10.2500/ar.2014.5.0090                                                             Otorhinolaryngol 83:41–46 https://doi.org/10.1016/j.ijporl.2016.01.018
17.   Bailie N, Hanna B, Watterson J, Gallagher G (2006) An overview of numerical        37. Hamerschmidt R, Hamerschmidt R, Moreira ATR, Tenorio SB, Timi JRR (2016)
      modelling of nasal airflow. Rhinology 44(1):53–57                                      Comparison of turbinoplasty surgery efficacy in patients with and without
18.   Lin CL, Tawhai MH, McLennan G, Hoffman EA (2009) Multiscale simulation                 allergic rhinitis. Braz J Otorhinolaryngol 82(2):131–139 https://doi.org/10.101
      of gas flow in subject-specific models of the human lung. IEEE Eng Med                 6/j.bjorl.2015.10.010
      Biol Mag 28(3):25–33 https://doi.org/10.1109/MEMB.2009.932480                      38. Kutlug S, Gunbey E, Sogut A, Celiksoy MH, Kardas S, Yildirim U et al (2016)
19.   Nomura T, Ushio M, Kondo K, Kikuchi S (2018) Effects of nasal septum                   Evaluation of olfactory function in children with allergic rhinitis and
      perforation repair on nasal airflow: an analysis using computational fluid             nonallergic rhinitis. Int J Pediatr Otorhinolaryngol 86:172–176 https://doi.
      dynamics on preoperative and postoperative three-dimensional models.                   org/10.1016/j.ijporl.2016.04.038
      Auris Nasus Larynx 45(5):1020–1026 https://doi.org/10.1016/j.anl.2018.02.006       39. Chovancová M, Elcner J (2014) The pressure gradient in the human
20.   Borojeni AAT, Frank-Ito DO, Kimbell JS, Rhee JS, Garcia GJM (2017) Creation            respiratory tract. EPJ Web Conf 67:02047 https://doi.org/10.1051/epjconf/2
      of an idealized nasopharynx geometry for accurate computational fluid                  0146702047
      dynamics simulations of nasal airflow in patient-specific models lacking the       40. Kim JH, Roberge RJ, Powell JB, Shaffer RE, Ylitalo CM, Sebastian JM (2015)
      nasopharynx anatomy. Int J Numer Method Biomed Eng 33(5):e2825                         Pressure drop of filtering facepiece respirators: how low should we go? Int J
      https://doi.org/10.1002/cnm.2825                                                       Occup Med Environ Health 28(1):71–80 https://doi.org/10.13075/ijomeh.1
21.   Li LF, Zang HR, Han DM, Ramanathan M Jr, Carrau RL, London NR Jr (2020)                896.00153
      Impact of a concha bullosa on nasal airflow characteristics in the setting of      41. Lee JH, Na Y, Kim SK, Chung SK (2010) Unsteady flow characteristics
      nasal septal deviation: a computational fluid dynamics analysis. Am J Rhinol           through a human nasal airway. Respir Physiol Neurobiol 172(3):136–146
      Allergy 34(4):456–462 https://doi.org/10.1177/1945892420905186                         https://doi.org/10.1016/j.resp.2010.05.010
22.   Camilo AA, Amorim PHJ, Moraes TF, de S. Azevedo F, da Silva JVL (2012)             42. Rapoport D, Norman R, Nielson M (2001) Nasal pressure airflow
      Invesalius: medical image edition. Paper presented at the 1st international            measurement. https://studylib.net/doc/18755900/nasal-pressure-airflow-mea
      conference on design and processes for medical devices, West Garda Hotel,              surement. Accessed 9 Apr 2021
      Brescia, 2-4 May 2012                                                              43. Riazuddin VN, Zubair M, Abdullah MZ, Ismail R, Shuaib IL, Hamid SA et al
23.   Ruiz CP, Ruiz CF, López AC, Español CC (2005) Computational fluid dynamics             (2011) Numerical study of inspiratory and expiratory flow in a human nasal
      simulations of the airflow in the human nasal cavity. Acta Otorrinolaringol Esp        cavity. J Med Biol Eng 31(3):201–206 https://doi.org/10.5405/jmbe.781
      56(9):403–410 https://doi.org/10.1016/S0001-6519(05)78638-6                        44. Lee CF, Abdullah MZ, Ahmad KA, Shuaib IL (2014) Analytical comparisons of
24.   Wang DY, Lee HP, Gordon BR (2012) Impacts of fluid dynamics simulation in              standardized nasal cavity. J Med Imaging Health Inf 4(1):14–20 https://doi.
      study of nasal airflow physiology and pathophysiology in realistic human               org/10.1166/jmihi.2014.1214
      three-dimensional nose models. Clin Exp Otorhinolaryngol 5(4):181–187              45. Li HF, Tian ZF, Tu JY, Yang W, Yeoh GH, Xue CL et al (2006) Studies of
      https://doi.org/10.3342/ceo.2012.5.4.181                                               airflow through a human nasopharynx and pharynx airway. In: Abstracts of
25.   Smith K (2008) CFD analysis of pressure and flow characteristics of the                the 5th international conference on CFD in the process industries, CSIRO,
      human nose. Dissertation, Worcester Polytechnic Institute                              Melbourne, 13-15 December 2006
26.   Farzal Z, Del Signore AG, Zanation AM, Ebert JC Jr, Frank-Ito D, Kimbell JS et     46. Cook PR, Begegni A, Bryant WC, Davis WE (1995) Effect of partial middle
      al (2019) A computational fluid dynamics analysis of the effects of size and           turbinectomy on nasal airflow and resistance. Otolaryngol Head Neck Surg
      shape of anterior nasal septal perforations. Rhinology 57(2):153–159 https://          113(4):413–419 https://doi.org/10.1016/S0194-5998(95)70078-1
      doi.org/10.4193/Rhin18.111                                                         47. Wen J, Inthavong K, Tian ZF, Tu JY, Xue CL, Li CG (2007) Airflow patterns in
27.   Zubair M, Abdullah MZ, Ahmad KA (2013) Hybrid mesh for nasal airflow                   both sides of a realistic human nasal cavity for laminar and turbulent
      studies. Comput Math Methods Med 2013:727362–727367 https://doi.org/1                  condition. In: Abstracts of the 16th Australasian fluid mechanics conference,
      0.1155/2013/727362                                                                     School of Engineering, the University of Queensland, Brisbane, 3-7
28.   Cheng YS, Yeh HC, Guilmette RA, Simpson SQ, Cheng KH, Swift DL (1996)                  December 2007
      Nasal deposition of ultrafine particles in human volunteers and its                48. Garcia GJM, Hariri BM, Patel RG, Rhee JS (2016) The relationship between
      relationship to airway geometry. Aerosol Sci Technol 25(3):274–291 https://            nasal resistance to airflow and the airspace minimal cross-sectional area. J
      doi.org/10.1080/02786829608965396                                                      Biomech 49(9):1670–1678 https://doi.org/10.1016/j.jbiomech.2016.03.051
Lim et al. Visual Computing for Industry, Biomedicine, and Art (2021) 4:14 Page 11 of 11
49. Segal RA, Kepler GM, Kimbell JS (2008) Effects of differences in nasal anatomy
on airflow distribution: a comparison of four individuals at rest. Ann Biomed
Eng 36(11):1870–1882 https://doi.org/10.1007/s10439-008-9556-2
50. Kelly JT, Prasad AK, Wexler AS (2000) Detailed flow patterns in the nasal cavity.
J Appl Physiol 89(1):323–337 https://doi.org/10.1152/jappl.2000.89.1.323
51. Doorly DJ, Taylor DJ, Schroter RC (2008) Mechanics of airflow in the human
nasal airways. Respir Physiol Neurobiol 163(1–3):100–110 https://doi.org/10.1
016/j.resp.2008.07.027
52. Elad D, Wolf M, Keck T (2008) Air-conditioning in the human nasal cavity.
Respir Physiol Neurobiol 163(1–3):121–127 https://doi.org/10.1016/j.resp.2
008.05.002
53. Elad D, Naftali S, Rosenfeld M, Wolf M (2006) Physical stresses at the air-wall
interface of the human nasal cavity during breathing. J Appl Physiol 100(3):
1003–1010 https://doi.org/10.1152/japplphysiol.01049.2005
Publisher’s Note
Springer Nature remains neutral with regard to jurisdictional claims in
published maps and institutional affiliations.You can also read


