Application of Refined Kano's Model to Shoe Production and Consumer Satisfaction Assessment - MDPI
←
→
Page content transcription
If your browser does not render page correctly, please read the page content below
sustainability

Article
Application of Refined Kano’s Model to Shoe Production and
Consumer Satisfaction Assessment
Chi-Hung Lo

                                          Department of Industrial Design, Tunghai University, Taichung 407224, Taiwan; chlo@thu.edu.tw

                                          Abstract: Many industries are labor-intensive and energy- and resource-consuming. A sustainable
                                          development plan is necessary for the industries as industrial structures have been changing recently.
                                          Taiwan’s shoe industry also has experienced such changes and requires a sustainable product
                                          development plan for continuous development. Therefore, this study aims to propose a new method
                                          by introducing a model of sustainable product development to facilitate the sustainable development
                                          of the industry. By taking air-cushioned casual shoe production as an example, this study suggested
                                          the refined Kano quality model for exploring the product attributes that improved the customers’
                                          satisfaction. The refined Kano model that was established with interviews and questionnaire surveys
                                          was effective to define the product attributes that contributed to satisfying the customers and
                                          understanding their perception of product attributes. In the air-cushioned casual shoe production, the
                                          model found function, design, innovation, marketing, and service to be important for manufacturers
                                          to develop products with limited. It also suggested the priority be put on the attributes of high
                                          value-added quality, key quality, and potential quality. The model helped manufacturers decide
                                          which product attributes they need to invest in and develop. The relation of product attributes and
                                          consumer satisfaction for a sustainable product development model was also found by using the

                                   refined Kano model. The result of this study is expected to apply to various industries for establishing
                                          an appropriate sustainable product development model.
Citation: Lo, C.-H. Application of
Refined Kano’s Model to Shoe
Production and Consumer
                                          Keywords: product attributes; Kano quality model; refined Kano quality model; sustainable product
Satisfaction Assessment.                  development; consumer satisfaction
Sustainability 2021, 13, 2484.
https://doi.org/10.3390/su13052484

Academic Editor: Flavio Boccia            1. Introduction
                                               Sustainable product development (SPD) refers to a method for enabling sustainable
Received: 1 February 2021                 planning and developing products with a framework for strategic sustainable develop-
Accepted: 19 February 2021
                                          ment (FSSD) or the natural step (TNS) framework especially in the early stage of product
Published: 25 February 2021
                                          design [1–3]. As the demand for environment-friendly products and the related regulations
                                          increase, sustainability in product development becomes critical [4]. Ishioka and Yasuda [5]
Publisher’s Note: MDPI stays neutral
                                          proposed three factors to define the strategies of SPD: performance, attractiveness, and
with regard to jurisdictional claims in
                                          competitiveness. However, the concept of SPD still needs clear definitions in industries.
published maps and institutional affil-
                                          A “good” brand created from good SPD is identified and differentiated with the products
iations.
                                          and creates the consumers’ loyalty. The brand and products need to be in accordance to
                                          obtain the consumer’s trust. Thus, the products prolong their life cycles through upcycling,
                                          recycling for sustainability development, which is an example of a well-managed brand.
                                               Well-managed brands help the manufacturers and related industries increase revenues
Copyright: © 2021 by the author.
                                          through price competitiveness. Therefore, governments encourage companies to develop
Licensee MDPI, Basel, Switzerland.
                                          their brands for the global market, which raises countries’ recognition. The creation and
This article is an open access article
                                          promotion of brands have become key factors in industries. Park et al. argued that brands
distributed under the terms and
                                          have a “life cycle” that comprises introduction, refinement, and consolidation. Each period
conditions of the Creative Commons
                                          demands a different development strategy, and eventually, the strategies in a life cycle
Attribution (CC BY) license (https://
                                          must be harmonized to last for a long time [6]. Richardson et al. [7] mentioned that a brand
creativecommons.org/licenses/by/
4.0/).
                                          image is an external clue for consumers to evaluate the product quality. Reynolds and

Sustainability 2021, 13, 2484. https://doi.org/10.3390/su13052484                                     https://www.mdpi.com/journal/sustainability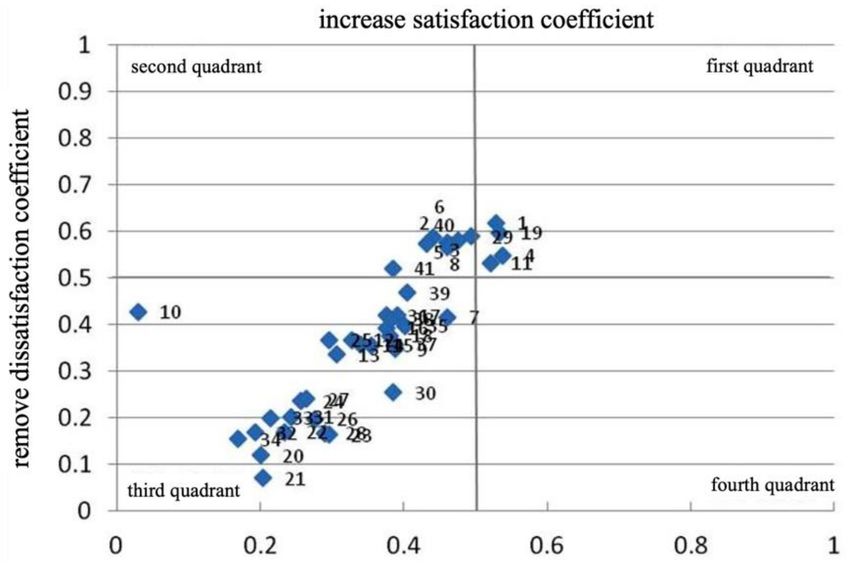
Sustainability 2021, 13, 2484                                                                                          2 of 22

                                Gutman [8] used the Means-End Chain method to define a brand image with a serial chain
                                of product attributes and individual values. Hsu [9] argued that product attributes have a
                                direct impact on consumers’ willingness to purchase through evaluating how innovative
                                products are. Anderson and Sullivan [10] investigated the causes and consequences of
                                customer satisfaction, which is found to increase when the quality exceeds the expectations,
                                and it has excessive impact on repurchase intentions. The formation of a brand image
                                throughout a life cycle requires understanding how consumers consider product attributes
                                when choosing brands and products. Consumers try to realize the gains and benefits of
                                products by considering their values. As the main goal of SPD, the gains and benefits
                                are defined as the physical, measurable, abstract, and subjective attributes of a product.
                                Huiskonen and Pirttila [11] found that quality factors have a non-linear relationship with
                                product attributes. In other words, they pointed out that not all consumers experience a
                                linear positive correlation between the product attributes and satisfaction with a product.
                                      Shoes are daily necessities and require functionality as well as fashionable design.
                                At the same time, consumers base their perceptions and values on shoes in terms of
                                sustainability. Thus, a good brand of shoe must satisfy consumers with the quality of
                                functionality and design, and sustainability [12]. Consumer perceptions of a brand image
                                and product attributes affect the evaluation and selection when purchasing shoes, too.
                                However, the conventional shoe industry has wasted so much energy and natural resources,
                                which hinders sustainable development and has not obtained recognition as a good brand
                                from consumers. Therefore, a well-established SPD enables the industry to focus on the
                                product attributes that need to be improved.
                                      This study’s purpose is to define SPD for the shoe industry of Taiwan to suggest a way
                                to meet the consumer demand and increase their satisfaction. The Kano two-dimensional
                                model [13] was adopted to define the quality classification of consumer demand for product
                                attributes by refining the Kano model by referring to Yang’s result [14] for minimizing the
                                weakness of the original Kano model. For an SPD plan for the shoe industry, consumer
                                preference of the quality and sustainability were considered, which provides the industry
                                with accurate information for establishing marketing strategies and obtaining consumer
                                loyalty. The result of this study, thus, presents a new method for establishing a SPD for the
                                shoe industry.

                                2. Theoretical Background
                                2.1. Kano’s Two-Dimensional Model
                                      The Kano two-dimensional model was proposed by Kano et al. [10] and used the
                                Motivator–Hygiene theory (M-H theory) by Herzberg, which introduced the quality-related
                                field and the “M-H property of quality.” A Kano model includes the following five qualities.
                                (1)   “Attractive Quality” as a tool to create product differentiation;
                                (2)   “One-dimensional Quality” as a standard for product grading to match consumer
                                      satisfaction and product price;
                                (3)   “Must-be Quality” as a basic accessory to a product. Only product accessories at lower
                                      costs prevent any form of waste by devoting excessively high costs to the must-be
                                      quality element;
                                (4)   “Indifferent Quality” as the minimum level of quality for consumers to accept after
                                      comparing to other products;
                                (5)   “Reverse Quality” as a high degree of product and service achievement resulting in
                                      dissatisfaction and a low degree of product.
                                     Different needs and performances are defined by the relationship between quality
                                attributes and consumer satisfaction. In the model, the horizontal coordinate indicates
                                the fulfillment of the quality attributes, while the vertical coordinate indicates consumer
                                satisfaction (Figure 1). The quality attributes are classified into five major categories
                                according to the relation of the quality and satisfaction.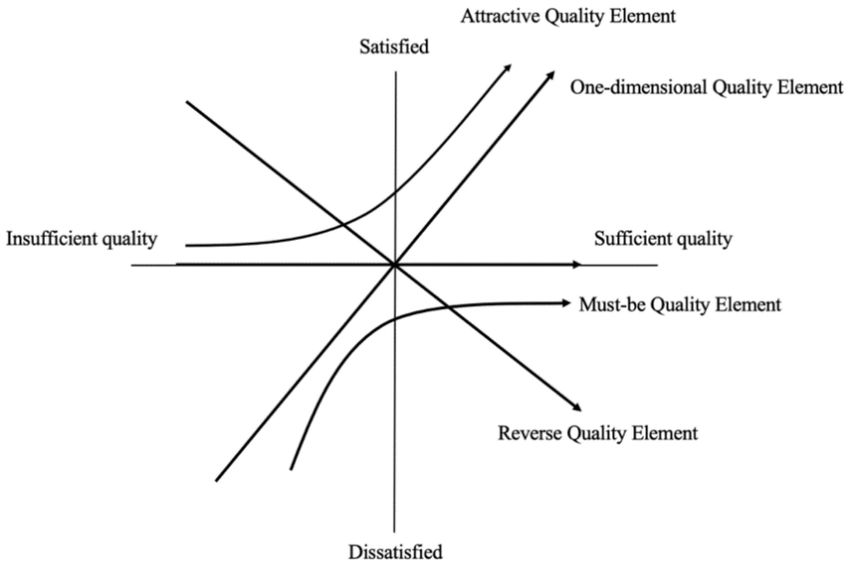
Sustainability 2021, 13, 2484                                                                                             3 of 22

                                Figure 1. The Kano two-dimensional model.

                                     In the model, Kano proposed the life cycle of the attractive quality as follows: in-
                                different quality → attractive quality → one-dimensional quality → must-be quality. By
                                assuming that other attributes are equally influential, a product or service with sufficient
                                attractive quality would attract consumers and thus create a competitive advantage. De-
                                spite the attractive quality being at the highest level of quality satisfaction, it evolves into
                                the one-dimensional quality and must-be quality as a result of competition with other
                                products [15]. The evolution of the life cycle starts from the indifferent quality, which
                                becomes the attractive quality after a certain time. Therefore, manufacturers must decide
                                whether they should abandon the indifferent quality perceived by the consumers.

                                2.2. Advantages of Kano’s Two-Dimensional Model
                                     The traditional way to measure consumer satisfaction is to determine the satisfaction
                                of consumers with one-dimensional quality. Jane and Dominguez [16] argued that the Kano
                                model is not only theoretical but also practical. As different from other general theories
                                that explore consumer preferences, the Kano model focuses on consumer expectations and
                                the attributes that affect consumer satisfaction. The Kano two-dimensional quality model
                                especially provides service quality attributes precisely. Classified service quality attributes
                                reveal the needs of different consumers simply and clearly. Kano’s two-dimensional quality
                                model gets rid of the false idea of “no complaint means consumer satisfaction” and helps
                                employees set priorities for their work [16–19]. Quality with the largest impact brings
                                consumer satisfaction to the next level by defining the consumer’s requirement for the
                                product, which allows the product developer to find the most prioritized project. The
                                improvement of one-dimensional and attractive quality has a larger impact on consumer
                                satisfaction than must-be quality. Different demands exist in the attractive quality, one-
                                dimensional quality, and must-be quality segment services and solutions. Therefore, Kano’s
                                two-dimensional quality model provides effective guidelines on how to impact consumer
                                satisfaction. Kano’s two-dimensional quality model also forms a competitive strategy for
                                quality differentiation.

                                2.3. Classification of Kano’s Two-Dimensional Model
                                     By using Kano’s two-dimensional quality model, researchers have different classifica-
                                tion methods to assess consumer feelings and satisfaction according to quality attributes.
                                The quality attributes are classified with consumers’ responses. The various classification
                                methods were proposed with the cross-reference of the consumer’s options as following.
                                (1)   Noriaki proposed the six grade evaluation (“satisfied,” “must-have,” “irrelevant,” “un-
                                      solvable,” “dissatisfied,” and “others”) based on two-dimensional quality attributes
                                      as provided in Table 1 [13].
Sustainability 2021, 13, 2484 4 of 22
(2) Schvaneveldt proposed (“like,” “as expected,” “of no impact,” “of no help,” and “dis-
like”) to evaluate consumer expectations with two-dimensional quality attributes [20].
(3) Matzler and Hinterhuber proposed the five grade evaluation (“like,” “take for granted,”
“indifferent,” “tolerable,” and “dislike”) to evaluate consumer expectations [21].
In this study, the classification method by Matzler and Hinterhuber [21] was used to
analyze Kano’s two-dimensional quality model.
Table 1. Kano’s two-dimensional quality evaluation [13].
Insufficient
Sufficient Satisfied Must-Have Indifferent Unsolvable Dissatisfied Others
One-
Cannot Be Attractive Attractive Attractive Other
Satisfied dimensional
Evaluated Quality Quality Quality Quality
Quality
Reverse Indifferent Indifferent Indifferent Must-Be Other
Must-Have
Quality Quality Quality Quality Quality Quality
Reverse Indifferent Indifferent Indifferent Must-Be Other
Indifferent
Quality Quality Quality Quality Quality Quality
Reverse Indifferent Indifferent Indifferent Must-Be Other
Unsolvable
Quality Quality Quality Quality Quality Quality
Reverse Reverse Reverse Reverse Cannot Be Other
Dissatisfied
Quality Quality Quality Quality Evaluated Quality
Other Other Other Other Other Other
Others
Quality Quality Quality Quality Quality Quality
A questionnaire based on Kano’s two-dimensional quality evaluation comprised the
sets of positive and negative questions to evaluate the responses for product attributes
(Table 2). The questions cross-classified the respondents’ requirements for the quality at-
tributes. The level of satisfaction or dissatisfaction with the quality attributes was evaluated
with the coefficients of satisfaction and dissatisfaction.
Table 2. An example of questionnaire options in Kano’s two-dimensional model.
Question 1
Air-cushioned casual shoes should “come Air-cushioned casual shoes should not “come
with” a warranty period. What do you think? with” a warranty period. What do you think?
Like Like
Take for granted Take for granted
Indifferent Indifferent
Acceptable Acceptable
Dislike Dislike
2.4. Classification by the Refined Kano Two-Dimensional Quality Model
With Kano’s two-dimensional quality model, Yang [11] subdivided the attributes
of attractive, one-dimensional, must-be, and indifferent quality into eight sub-elements
according to the level of importance (Table 3). After the quality attributes are classified by
Kano’s two-dimensional quality analysis, Kano’s two-dimensional quality classification is
refined based on the consumer evaluation. The example of a refined Kano two-dimensional
questionnaire is shown in Table 4.Sustainability 2021, 13, 2484 5 of 22
Table 3. Example of a refined Kano two-dimensional quality model.
Classification Important Attribute Less Important Attribute
Attractive quality High Attractive Quality Low Attractive Quality
One-dimensional quality High Value-Added Low Value-Added
Must-be quality Critical Quality Required Quality
Indifferent quality Potential Quality Irrelevant Quality
Table 4. Example of refined Kano two-dimensional questionnaire options.
Question 1
Importance Satisfaction
Very Unimportant
Very dissatisfied
Very Important
Very satisfied
Unimportant
Importance: Does the consumer attach great importance to the product attributes
Dissatisfied
Important
Satisfied
Neutral
Neutral
provided by the air-cushioned casual shoes?
Satisfaction: Is the consumer satisfied with the product attributes provided by the
air-cushioned casual shoes?
Comfortable and soft to wear # # # # #
2.5. Consumer Satisfaction Coefficient
To measure consumer demand for product quality, Kano et al. [10] argued that one
may start with the unavailable or lacking ratio of attributes of the attractive, linear, and
must-be quality. The consumer satisfaction coefficient is used to find out the requirements
for product quality. To improve the effectiveness of consumer satisfaction, the attractive
and one-dimensional quality need to be evaluated together as follows.
Satisfaction coefficient CSi = (A + O)/(A + O + M + I) (1)
Dissatisfaction coefficient CDi = (O + M)/(A + O + M + I)(−1) (2)
where A, O, M, and I are the attributes of the attractive, one-dimensional, must-be, and
indifferent quality, respectively. A larger satisfaction coefficient indicates higher consumer
satisfaction, while a smaller dissatisfaction coefficient means higher dissatisfaction. Thus,
products with higher coefficients need to be prioritized. As high coefficients indicate a
better effect of product improvement than low ones, this method analyzes the improvement
of a certain quality attribute for improving the quality of product and satisfying consumer
demand.
By assuming that CSi and CDi are equally important to consumer satisfaction, the
maximum impact coefficient is defined as Equation (3) [22].
CSi CDi
Ci = Max m , (3)
∑i CSi ∑im CDi
Based on a questionnaire survey of the Kano model, Lu and Juan [23] proposed a
performance indicator of high-quality residence buildings in Taiwan. According to the
indicator, they investigated the residents’ satisfaction with new residential buildings. By in-
tegrating the Kano model and theory of inventive problem-solving (TRIZ), Zhang et al. [24]
introduced a Kano–TRIZ industrial design method. Tu and Yang [25] used Kano’s two-
dimensional model to find the quality attributes of hand-touch products. Wu et al. [26]
suggested the priorities of product/service improvement through product/service per-
formance monitoring and consumer demand analysis from large-scale online consumers’Sustainability 2021, 13, 2484 6 of 22
reviews. Chen et al. [27] proposed the combined method of a refined Kano model and
the quality function deployment (QFD) method. The refined Kano model was used to
understand how consumers perceive service attributes developed based on the Dineserv
measurement. Min et al. [28] defined the feature of each part in the Kano model to analyze
the dynamics of consumer demand and evaluation as the main indicator of service quality.
3. Methodology and Procedures
A company that produces and sells air-cushioned casual shoes in Taiwan was chosen
for this study. First, this research interviewed experts to confirm the research framework as
the product design and brand of the shoe industry in Taiwan are much diversified. The
expert interview was performed to discuss the establishment and adjustment of the product
attributes of air-cushioned casual shoes and the statistical method. Then, this research
created a questionnaire to evaluate the satisfaction with the brand of the shoes. The main
purpose was to establish a refined Kano two-dimensional model for understanding the
consumer demand for product quality in a QFD relationship matrix (Figure 2).
Figure 2. The research framework of the establishment of sustainable product development (SPD) of
the air-cushioned casual shoe company in Taiwan.
3.1. Questionnaire Design
The purpose of the questionnaire survey was to understand which quality attributes
satisfied consumers. The questionnaire was created to have two parts: a pre-test and a
formal questionnaire (Figure 3). The quality attributes of air-cushioned casual shoes were
determined through the literature review and expert interviews. Based on the responses of
the pretest questionnaire, the quality attributes were selected according to the responses
of the formal questionnaires. The interviews with experts (Table 5) helped improve theSustainability 2021, 13, 2484 7 of 22
validity of the questionnaire structure. As the result, 55 product attributes in four categories
were obtained (Tables 6 and 7).
Figure 3. The questionnaire design and implementation of this study.
Table 5. List of experts who were interviewed for selecting product attributes and statistical method.
No. Service Company and Unit Job Title Career (Year)
Shoe design section of Footwear & Recreation
1 Deputy manager 5
Technology Research Institute
Shoe planning section of Footwear & Recreation
2 Industry analyst 5
Technology Research Institute
Assistive device section of Footwear & Recreation
3 Researcher 4.6
Technology Research Institute
4 LA NEW Shop Owner 9
5 BAW Shop Clerk 1
Table 6. The categories of product attributes and their definitions for air-cushioned casual shoes.
Categories Facet Definition
Basic functions and practical and functional features should be
1 Application and function
provided for use
2 Innovation and R&D Breakthroughs and forward-looking innovations
Relevant attributes extended from brand marketing and
3 Brand marketing and service
services
4 Appearance and aesthetic Presentation of visual appraisal
Table 7. The product attributes in each category of air-cushioned casual shoes.
Categories Product Attributes
Size and fitness
Easy to wear and lightweight
Comfortable to wear and softness
Sweat absorption and permeability
Protectiveness and coverage
Air-cushioned flexibility and vibration absorption
Air-cushioned support
Air-cushioned comfort and functionality
Application and
Function Upper material property and functionality (waterproof, thermostatic,
(15 attributes) moisture-wicking)
Sole material (anti-slip and abrasion resistant)
Laces, hook and loop fasteners or other adjustments
Suitable for daily activity
Ease of maintenance and care
Durability and service life
Product warranty
Peripheral products (lacing, filler, shoe care kit, etc.)Sustainability 2021, 13, 2484 8 of 22
Table 7. Cont.
Categories Product Attributes
Innovation and improvement of production technology
Innovation and improvement of style design
Innovation and improvement of structural design (air-cushioned, outsole,
insole, etc.)
Innovation and improvement of air-cushioned technology
Innovation and Innovation and improvement of material development
Development
(10 attributes) Ergonomic
Parts are made of eco-friendly materials
Customization
Fragrant and deodorant
Washable by the washing machine
High twists and turns
Well-known designer or cross-disciplinary cooperation
Topical and full of story
Limited edition
Trademark
Brand awareness
Brand social welfare activities
Product packaging
Product display (window display, model, etc.)
With fashion elements
Brand Marketing Made in Taiwan
and Service With department stores and outlets as marketing channel
(21 attributes)
Service attitude of the shop clerk
Product display at the shop
Image and style of the celebrity endorser
Advertising slogan
Advertising appeals
Advertising frequency and intensity
Pre-sales and post-sales service
Price
Discount or promotional activity
Style (exterior) design
Upper drawing, material matching and design
Style uniqueness
Appearance and
Shoe type and visual effect
aesthetics
(8 attributes) Overall coloring
Overall texture (stitches, overflow, etc.)
Handmade
Compatibility with other clothing accessoriesSustainability 2021, 13, 2484 9 of 22
3.2. Participants
3.2.1. Experts
The experts in this study were brand consultants, marketers, or personnel for the
development, design, and planning of shoes. The experts were invited from Taiwan
External Trade Development Council (TAITRA), Taiwanese brand consulting companies,
China Productivity Center, shoe factories, and Footwear & Recreation Technology Research
Institute.
3.2.2. Consumers
This study adopted a non-random sampling or purposive sampling approach. The
questionnaire survey was performed on- and off-line with customers of stores selling
air-cushioned casual shoes.
4. Results and Analysis
4.1. Pre-Test Questionnaire Survey
The pre-test questionnaire survey was performed from 12–18 May 2019. All partici-
pants were consumers who visited stores at Taichung Station, Yizhong Street, Chungyo
Department Store, and Taroko Mall. The online questionnaire survey was also performed
on the websites of mountain climbing, apparel, men’s and women’s footwear. A total of
103 valid questionnaires were returned. All responses were processed with SPSS 17.0. In
this study, SPSS 17.0 statistical software was used for pre-test questionnaire analysis, and
three statistical methods, item analysis, factor analysis and reliability analysis, were used
to examine the results of the questionnaire. Item analysis was used to evaluate the decisive
value of each item, and Cronbach’s α was used to delete non-identifying questions; reliabil-
ity analysis was designed to increase the confidence of the facet by removing unnecessary
questions from each facet.
4.1.1. Item Analysis
Item analysis evaluates the critical ratio of each attribute for question deletion. A
significance level of p < 0.05 was a criterion to delete questions. All of the attributes were
significant (p < 0.05) so that no attribute was deleted.
4.1.2. Factor Analysis
The factor analysis result shows the relationship between product categories and
attributes. In the principal component analysis, the attributes with a factor load of >0.5
were selected. The result showed that 12 out of 55 attributes were deleted: Q1—Size and
fitness, Q2—Easy to wear and lightweight, and Q12—Suitable for daily activity in the
category of application and functional facet, Q25—Fragrant and deodorant, Q26—Washable
by the washing machine, Q27—High twists and turns in the category of innovation and
development, Q29—Topical and full of story, Q37—Made in Taiwan, Q45—Pre-sales and
post-sales service, Q46—Price, Q47—Discount or promotional activity in the category of
appearance and aesthetics facets, and Q54—Handmade in the category of brand marketing
and service.
4.1.3. Reliability Analysis
Reliability analysis removes the unnecessary attributes from each category for improv-
ing the reliability of the analysis. The criterion was a correlation coefficient ofSustainability 2021, 13, 2484 10 of 22
Figure 4. Forty-one product attributes in four categories of air-cushioned casual shoes for the SPD of this study.
4.2. Questionnaire Survey with Kano’s Two-Dimensional Quality Model
The survey was carried out from 12–26 June 2020 with 217 questionnaires returned
and 194 valid questionnaires (Tables 8 and 9).
4.3. Kano’s Two-Dimensional Quality Model
The questionnaire survey adopted the “relative majority ratio” by Matzler and Hinter-
huber (Table 10). According to this principle, the proportion of each Kano quality attribute
was calculated for 41 attributes: 11 attributes of the one-dimensional quality, 2 of the
required quality, and 28 of the different quality.
Table 8. Statistics of the questionnaire survey.
Off-Line Online Total
Total number of returned questionnaires 137 80 217
Invalid questionnaires 17 6 23
Valid questionnaires 120 74 194
Effective rate 87.6% 92.5% 89.4%
Period 12–26 June 2020 for a total of 15 daysSustainability 2021, 13, 2484 11 of 22
Table 9. Demographics of questionnaire respondents.
Basic Data Item Amount Percentage Ratio
Male 85 43.8
Gender
Female 109 56.2
Under 18 6 3.1
From 19 to 25 54 27.8
From 26 to 30 30 15.5
From 31 to 35 29 14.9
Age From 36 to 40 12 6.2
From 41 to 45 22 11.3
From 46 to 50 16 8.2
From 51 to 55 16 8.2
Over 56 9 4.6
Elementary school and below 4 2.1
Junior high school 10 5.2
Education Senior high school 25 12.9
College and university 112 57.7
Graduate school and above 43 22.2
None 3 1.5
Student 44 22.7
Military and public servant 49 25.3
Agricultural industry 2 1.0
Occupation Business industry 20 10.3
Manufacturer 25 12.9
Service industry 29 14.9
Freelancer 9 4.6
Others 13 6.7
TWD 10,000 and below 39 20.1
TWD 10,000~30,000 53 27.3
Monthly income TWD 30,000~50,000 59 30.4
TWD 50,000~70,000 17 8.8
TWD 70,000~100,000 19 9.8
TWD 100,000 and above 7 3.6Sustainability 2021, 13, 2484 12 of 22
Table 10. Kano’s quality classification of casual shoes with air-cushioned.
Proportion of Each Type of Kano Quality Attribute
Classification
Facet Attribute (%)
Attribute
A O M I R Q
Comfortable to wear and softness 14.90 37.60 23.70 23.10 0.00 0.15 O
Sweat absorption and permeability 10.30 34.00 24.80 31.10 0.00 0.50 O
Protectiveness and coverage 14.00 31.50 25.20 27.80 0.50 1.00 O
Air-cushioned flexibility and vibration
19.10 34.50 20.00 25.80 0.70 0.50 O
absorption
Application and functional facet
Air-cushioned support 12.90 32.50 23.20 29.90 0.50 1.00 O
Air-cushioned comfort and functionality 13.90 33.50 24.20 27.80 0.00 0.00 O
Upper material property and functionality
21.10 24.70 16.50 37.00 0.00 0.50 I
(waterproof, thermostatic, moisture-wicking)
Sole material (anti-slip and abrasion
19.60 26.30 29.90 22.70 1.70 0.50 M
resistant)
Laces, hook and loop fasteners or other
20.60 18.00 16.50 44.20 0.50 0.00 I
adjustments
Ease of maintenance and care 19.10 21.60 21.10 38.10 0.00 0.00 I
Durability and service life 19.10 31.90 20.00 26.80 0.50 1.50 O
Product warranty 14.90 17.00 18.60 46.90 2.50 0.00 I
Peripheral products (lacing, filler, shoe care
12.90 16.00 15.50 49.70 5.60 0.00 I
kit, etc.)
Innovation and improvement of production
17.50 16.50 19.00 46.80 0.00 0.00 I
technology
Innovation and R&D facet
Innovation and improvement of style design 19.10 16.00 19.10 44.80 1.00 0.00 I
Innovation and improvement of structural
17.40 20.10 19.00 43.20 0.00 0.00 I
design (air-cushioned, outsole, insole, etc.)
Innovation and improvement of
16.40 22.70 19.10 41.60 0.00 0.00 I
air-cushioned technology
Innovation and improvement of material
18.00 19.60 17.50 43.70 1.00 0.00 I
development
Ergonomic 15.90 37.10 22.10 24.20 0.00 0.50 O
Well-known designer or cross-disciplinary
16.00 3.10 8.20 67.60 4.90 1.00 I
cooperation
Limited edition 16.50 1.50 4.70 65.40 10.80 1.00 I
Marketing and service facet
Trademark 14.50 7.70 8.20 63.90 5.10 0.50 I
Brand awareness 22.60 5.70 9.80 57.10 4.00 0.50 I
Brand social welfare activities 14.90 9.80 12.80 58.70 3.50 0.00 I
Product packaging 13.40 15.50 20.10 48.40 2.50 0.00 I
Product display (window display, model,
18.00 8.80 10.30 59.70 3.00 0.00 I
etc.)
With fashion elements 16.50 9.30 14.00 57.70 1.00 1.50 I
With department stores and outlets as
17.00 10.80 5.10 62.80 3.50 0.50 I
marketing channel
Service attitude of the shop clerk 13.90 34.50 23.20 26.30 0.00 2.10 OSustainability 2021, 13, 2484 13 of 22
Table 10. Cont.
Proportion of Each Type of Kano Quality Attribute
Classification
Facet Attribute (%)
Attribute
A O M I R Q
Product display at the shop 22.70 14.90 9.80 49.90 2.10 0.50 I
Image and style of the celebrity endorser 16.50 7.20 12.40 61.20 2.00 0.50 I
Advertising slogan 13.90 4.60 11.40 66.00 2.50 1.50 I
Advertising appeals 16.50 4.10 15.00 60.25 2.00 1.00 I
Advertising frequency and intensity 13.40 3.10 11.80 68.50 3.10 0.00 I
Appearance and aesthetic facet
Style (exterior) design 16.50 22.20 16.00 41.60 2.00 1.50 I
Upper drawing, material matching and
13.40 23.20 17.50 43.30 1.50 1.00 I
design
Style uniqueness 19.00 18.60 16.00 43.20 1.50 1.50 I
Shoe type and visual effect 15.40 21.60 18.00 41.60 2.00 1.00 I
Overall coloring 15.10 24.20 21.10 36.50 1.50 1.00 O
Overall texture (stitches, overflow, etc.) 15.50 27.30 29.30 26.80 0.50 0.50 M
Compatibility with other clothing accessories 10.80 26.30 23.80 35.50 2.00 1.50 O
Note: “A” stands for attractive quality, “O” stands for one-dimensional quality, “M” stands for must-be quality, “I” stands for different
quality, and “R” stands for reverse quality.
4.3.1. Attraction Quality
The attractive quality is used as a tool to create product differentiation and reflects
a consumer’s desire for a specific product attribute. This attribute represents consumer
satisfaction. The result of this study showed that consumers were not satisfied with but
accepted “property and functionality of the upper in shoes (waterproof, thermostatic,
moisture-wicking)” and “laces, hook and loop fasteners or other adjustments.” Through
the “brand awareness” and “comfort and style of the shop” in the category of marketing
and service, consumers placed a high value on the product quality and commitment of a
brand. The layout of the stores also seemed to affect the consumers’ purchasing process.
This suggests that the stores must do appropriate marketing activities to promote the brand
images and raise recognition.
4.3.2. One-Dimensional Quality
The one-dimensional quality indicates the adequacy of quality for consumer satisfac-
tion. The attributes of this quality are used as a basis for manufacturers to differentiate
prices at the levels of products. For air-cushioned casual shoes, the attributes were related
to the following:
(1) Application and function: “comfortable and softness to wear,” “sweat absorption and
permeability,” “protectiveness and coverage,” “flexibility and vibration absorption of
air-cushions,” “air-cushioned support,” “comfort and functionality of air-cushions”
and “durability and service life”;
(2) Innovation and R&D: “ergonomic”;
(3) Brand marketing and service: “service attitude of the shop clerk”;
(4) Appearance and aesthetics: “overall coloring” and “compatibility with other clothing
accessories.”
The customers considered the basic functionality to be important, which suggests that
manufacturers must maintain and improve the one-dimensional quality attributes. The
higher the price of the air-cushioned casual shoes, the more sufficient the product attributes
must be, so the gap between the quality and price of the shoes is minimized.Sustainability 2021, 13, 2484 14 of 22
4.3.3. Must-Be Quality
This is the quality that manufacturers must provide for consumers. Manufacturers
need to regard the must-be quality attributes when developing new products. The attributes
included sole material (anti-slip and abrasion) in the category of application, and functional
and overall texture (stitches and overflow) in the category of appearance and aesthetic. For
these attributes, zero defects need to be achieved. Manufacturers need to exercise strict
quality control and inspection.
4.3.4. Indifferent Quality
This had little effect on customer satisfaction. The customers were more satisfied with
the improvement of the attributes in the category of application and functional rather than
those of innovation and R&D. Innovative improvements by R&D is a hidden attribute but
necessary to improve the applicability and comfortability of the shoes to provide products
of high quality and materials worth the price. The attributes such as a well-known designer
or cross-disciplinary cooperation, limited edition, and advertising slogan in the category
of marketing and service were not effective for improving the customers’ satisfaction.
The attributes in the category of appearance and aesthetics were more important for the
consumers than those of marketing and service.
4.3.5. Reverse Quality
This study did not consider the reverse quality attribute in the analysis, and found
that the consumers were not attracted to purchase a “limited edition” in the marketing and
service facet.
4.4. Consumer Satisfaction Index
Kano’s quality product attributes were classified as shown in Table 10. The consumer
satisfaction coefficient with “consumer satisfaction index (CSi )” and “consumer dissatis-
faction index (CDi )” was used to evaluate the degree of the customers’ satisfaction and
dissatisfaction with the attributes. The maximum coefficient was obtained by the weight
calculation method by Sireli et al. [22]. The results provide information on how to meet
the consumer demand (Table 11). In the coefficients and the quality scatter diagram [30], a
total of 41 product attributes were classified into four quadrants as shown in Figure 5.
Table 11. Consumer satisfaction index of product attributes of air-cushioned casual shoes.
Quality Clas- Weight of Item Category
Category Attributes CSi CDi
sification Attribute Ranking Average
Comfortable to wear and softness O 0.529 −0.617 0.617 1
Application and functional facet
Sweat absorption and permeability O 0.442 −0.587 0.587 4
Protectiveness and coverage O 0.462 −0.576 0.576 6
Air-cushioned flexibility and
O 0.539 −0.548 0.548 10
vibration absorption
0.504
Air-cushioned support O 0.461 −0.565 0.565 9
Air-cushioned comfort and
O 0.477 −0.580 0.580 5
functionality
Upper material property and
functionality (waterproof, I 0.461 −0.415 0.461 17
thermostatic, moisture-wicking)Sustainability 2021, 13, 2484 15 of 22
Table 11. Cont.
Quality Clas- Weight of Item Category
Category Attributes CSi CDi
sification Attribute Ranking Average
Sole material (anti-slip and
M 0.466 −0.571 0.571 8
abrasion resistant)
Laces, hook and loop fasteners or
I 0.389 −0.347 0.389 27
other adjustments
Ease of maintenance and care I 0.031 −0.427 0.427 14
Durability and service life O 0.521 −0.531 0.531 11
Product warranty I 0.328 −0.366 0.366 22
Peripheral products (lacing, filler,
I 0.307 −0.335 0.335 28
shoe care kit, etc.)
Innovation and improvement of
I 0.341 −0.356 0.356 25
production technology
Innovation and R&D facet
Innovation and improvement of
I 0.355 −0.355 0.355 26
style design
Innovation and improvement of
structural design (air-cushioned, I 0.376 −0.392 0.392 20
outsole, insole, etc.) 0.417
Innovation and improvement of
I 0.392 −0.419 0.419 15
air-cushioned technology
Innovation and improvement of
I 0.381 −0.376 0.381 21
material development
Ergonomic O 0.534 −0.596 0.596 2
Well-known designer or
I 0.201 −0.119 0.201 40
cross-disciplinary cooperation
Limited edition I 0.204 −0.070 0.204 41
Trademark I 0.235 −0.169 0.235 35
Brand awareness I 0.297 −0.163 0.297 38
Brand social welfare activities I 0.257 −0.235 0.257 31
Marketing and service facet
Product packaging I 0.297 −0.366 0.366 23
Product display (window display,
I 0.277 −0.197 0.277 34
model, etc.)
With fashion elements I 0.265 −0.239 0.265 30
0.279
With department stores and outlets
I 0.290 −0.166 0.290 37
as marketing channel
Service attitude of the shop clerk O 0.494 −0.589 0.589 3
Product display at the shop I 0.386 −0.254 0.386 29
Image and style of the celebrity
I 0.244 −0.201 0.244 32
endorser
Advertising slogan I 0.193 −0.167 0.193 36
Advertising appeals I 0.215 −0.199 0.215 33
Advertising frequency and
I 0.170 −0.154 0.170 39
intensitySustainability 2021, 13, 2484 16 of 22
Table 11. Cont.
Quality Clas- Weight of Item Category
Category Attributes CSi CDi
sification Attribute Ranking Average
Style (exterior) design I 0.402 −0.397 0.402 19
Appearance and aesthetic facet
Upper drawing, material matching
I 0.376 −0.418 0.418 16
and design
Style uniqueness I 0.388 −0.357 0.388 24
Shoe type and visual effect I 0.383 −0.410 0.410 18 0.454
Overall coloring O 0.406 −0.467 0.467 13
Overall texture (stitches, overflow,
M 0.433 −0.572 0.572 7
etc.)
Compatibility with other clothing
O 0.385 −0.520 0.520 12
accessories
Figure 5. Product attribute coefficients in a quality scatter diagram.
The first quadrant of the scatter diagram has the product attributes of the one-
dimensional quality that increased the customers’ satisfaction. Thus, manufacturers need
to prioritize the improvement and implementation of the attributes in the first quadrant to
improve consumer satisfaction. The attributes of the one-dimensional quality and must-be
quality elements are found in the second quadrant. This indicates that the increase in
satisfaction was smaller than that in dissatisfaction. Therefore, manufacturers need to
improve the attributes in the second quadrant for reducing the customers’ dissatisfaction.
The third quadrant of the scatter diagram contains the product attributes of the must-be or
one-dimensional quality. Manufacturers tend to invest fewer resources on the indifferent
quality that relates to must-be or one-dimensional quality [22]. Therefore, manufacturers
need to implement and consolidate the attributes of the one-dimensional, must-be, and
attraction quality for the effective enhancement of consumer satisfaction.
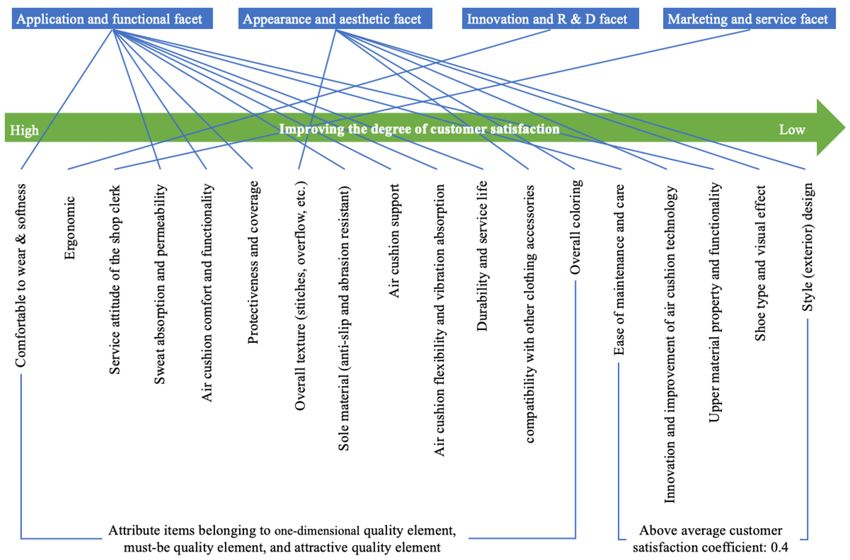
We ranked the priorities of the product attributes based on the weights (Table 11).
The average weights of the attributes in each category were the criteria for improving
customer satisfaction. The weights became highest in the category of application and
function and decreased in the categories of appearance and aesthetic, innovation and
R&D, and marketing and service, in that order (Figure 6). Therefore, manufacturers need
to give priority to improving the product attributes in the category of application and
function. Out of 41 product attributes, 19 product attributes showed higher weights than
0.4. These attributes belonged to one-dimensional quality, must-be quality, and attractive
quality. Thus, the relationship between foot anatomy (forefoot, sole, and arch of the foot)Sustainability 2021, 13, 2484 17 of 22
and comfort and functionality of air-cushions, air-cushioned support, and flexibility and
vibration absorption of air-cushions must be considered in manufacturing air-cushioned
casual shoes.
Figure 6. Prioritizing the improvement of product attribute to meet consumer satisfaction.
4.5. Refined Kano’s Two-Dimensional Quality Classification
A refined Kano two-dimensional quality model was used to find out which attributes
the customers considered to be important. The importance that the customers put on air-
cushioned casual shoes was used to classify eight items for the manufacturers to develop
and improve. The product quality was classified with the criteria of the average score of
3.97 as shown in Table 12.
Table 12. Classification of the attributes in the refined Kano two-dimensional model of air-cushioned casual shoes.
Kano’s Model Refined Kano’s
Facet Attributes Importance Satisfaction Quality Quality
Classification Classification
Comfortable to wear and softness 4.73 4.22 O High value-added
Sweat absorption and permeability 4.69 4.01 O High value-added
Application and functional facet
Protectiveness and coverage 4.57 4.10 O High value-added
Air-cushioned flexibility and vibration
4.56 4.08 O High value-added
absorption
Air-cushioned support 4.56 4.00 O High value-added
Air-cushioned comfort and functionality 4.55 4.07 O High value-added
Upper material property and
functionality (waterproof, thermostatic, 4.32 3.82 I Potential
moisture-wicking)
Sole material (anti-slip and abrasion
4.44 3.91 M Key
resistant)Sustainability 2021, 13, 2484 18 of 22
Table 12. Cont.
Kano’s Model Refined Kano’s
Facet Attributes Importance Satisfaction Quality Quality
Classification Classification
Laces, hook and loop fasteners or other
3.93 3.74 I Care-free
adjustments
Ease of maintenance and care 4.18 3.84 I Potential
Durability and service life 4.26 3.85 O High value-added
Product warranty 4.03 3.65 I Potential
Peripheral products (lacing, filler, shoe
3.08 3.57 I Care-free
care kit, etc.)
Innovation and improvement of
4.08 3.71 I Potential
production technology
Innovation and R&D facet
Innovation and improvement of style
4.07 3.65 I Potential
design
Innovation and improvement of
structural design (air-cushioned, outsole, 4.16 3.83 I Potential
insole, etc.)
Innovation and improvement of
4.19 3.76 I Potential
air-cushioned technology
Innovation and improvement of material
4.16 3.78 I Potential
development
Ergonomic 4.55 4.01 O High value-added
Well-known designer or
3.21 3.26 I Care-free
cross-disciplinary cooperation
Limited edition 2.86 3.22 I Care-free
Trademark 3.18 3.35 I Care-free
Brand awareness 3.51 3.55 I Care-free
Brand social welfare activities 3.59 3.45 I Care-free
Marketing and service facet
Product packaging 3.56 3.58 I Care-free
Product display (window display, model,
3.42 3.45 I Care-free
etc.)
With fashion elements 3.67 3.34 I Care-free
With department stores and outlets as
3.51 3.52 I Care-free
marketing channel
Service attitude of the shop clerk 4.38 3.92 O High value-added
Product display at the shop 3.95 3.82 I Care-free
Image and style of the celebrity endorser 3.57 3.60 I Care-free
Advertising slogan 3.41 3.46 I Care-free
Advertising appeals 3.56 3.47 I Care-free
Advertising frequency and intensity 3.31 3.39 I Care-freeSustainability 2021, 13, 2484 19 of 22
Table 12. Cont.
Kano’s Model Refined Kano’s
Facet Attributes Importance Satisfaction Quality Quality
Classification Classification
Appearance and aesthetic facet
Style (exterior) design 4.01 3.60 I Potential
Upper drawing, material matching and
4.10 3.59 I Potential
design
Style uniqueness 4.01 3.52 I Potential
Shoe type and visual effect 4.18 3.67 I Potential
Overall coloring 4.27 3.76 O High value-added
Overall texture (stitches, overflow, etc.) 4.33 3.86 M Key
Compatibility with other clothing
4.24 3.75 O High value-added
accessories
Average 3.97 3.70
4.5.1. High and Low Attraction Quality
The high attraction quality is the best tool to attract customers and its attributes can
be used to improve consumer satisfaction, while manufacturers are advised to overlook
the low attraction quality. Since there was no attraction quality in the analysis of this study,
no element was classified in the refined Kano model.
4.5.2. High Value-Added Quality
The attributes of high value-added quality not only increase consumer satisfaction
but also profits. Efforts are needed to implement the attributes. Eleven attributes of one-
dimensional quality of air-cushioned casual shoes were identified in the refined Kano
model. Based on the average score of the importance, the following attributes of the one-
dimensional quality were regarded as those of the high value-added quality: wear and
softness, sweat absorption and permeability, protectiveness and coverage, air-cushioned
flexibility and vibration absorption, air-cushioned support, air-cushioned comfort and
functionality, durability and service life, ergonomic, service attitude of store clerks, overall
coloring, and compatibility with other clothing accessories. Therefore, the manufacturers
need to develop the functionality of the air-cushioned casual shoes to improve consumer
satisfaction and sales revenue.
4.5.3. Low Value-Added Quality
Low value-added quality hardly contributes to consumer satisfaction. However, the
manufacturers must consider the attributes to avoid insufficient service and consumer
dissatisfaction. None of the attributes was classified into the low value-added quality in
the refined Kano model.
4.5.4. Key Quality
The key quality is essential for manufacturers to meet consumer demand. Shoe
abrasion and slip resistance and overall texture (stitches and overflow) of the must-be
quality in Kano’s original model were classified into the key quality in the refined Kano
model. Manufacturers need to consider this quality to satisfy consumers, which has
important attributes that affect consumer’s perceptions of air-cushioned casual shoes.
4.5.5. Required Quality
Manufacturers must provide the required quality to avoid causing consumer dissatis-
faction. None of the elements in this study was classified as the required quality elements
of the refined Kano model.Sustainability 2021, 13, 2484 20 of 22
4.5.6. Potential Quality
Several attributes of the potential quality belong and evolve into the attraction quality.
Manufacturers need to consider the potential quality to attract consumers. The origi-
nal Kano model had 12 attributes of the potential quality in the refined Kano model,
they belonged to the innovation and development, and the appearance and aesthetics
categories. The attributes were upper material property and functionality (waterproof,
thermostatic, moisture-wicking), ease of maintenance and care, product warranty, inno-
vation and improvement of production technology, innovation and improvement of style
design, innovation and improvement of structural design (air-cushioned, outsole, insole),
innovation and improvement of air-cushioned technology, innovation and improvement
of material development, style (exterior) design, upper drawing, material matching, and
design, style uniqueness, and shoe type and visual effect. Manufacturers must consolidate
the attributes in the category of application and function as a short-term strategy and do
research and development as a long term strategy to maintain the existing and future
consumers.
4.5.7. Care-Free Quality
The refined Kano’s model contained 16 attributes of the care-free quality in the cate-
gory of marketing and service. Since air-cushioned casual shoes are functional footwear,
the basic application and functional attributes need to be taken into consideration first,
followed by marketing and promoting brands.
In brief, the refined Kano quality model has the following qualities in the order of
importance: high value-added quality, key quality, and potential quality. Table 12 shows 11
attributes of the one-dimensional quality of Kano’s original model are classified as those of
the high value-added quality in the refined Kano model.
(1) The key quality is important to satisfy consumers. The attributes of the key quality are
sole material (anti-slip and abrasion resistant) and overall texture (stitches, overflow).
(2) The attributes of the potential quality also belong to the attractive quality of Kano’s
original model. The attributes are upper material property and functionality (wa-
terproof, thermostatic, moisture-wicking), ease of maintenance and care, product
warranty, innovation and improvement of production technology, innovation and
improvement of style design, innovation and improvement of structural design (air-
cushioned, outsole, insole), innovation and improvement of air-cushioned technology,
and innovation and improvement of material development, style (exterior) design,
upper drawing, material matching, and design, style uniqueness, and shoe type
and visual effect. These attributes are considered as a strategy to attract potential
consumers. The potential quality attracts the consumers who are concerned with the
price.
(3) Care-free quality pertains to the marketing and service category of Kano’s model.
Since air-cushioned casual shoes are functional, it is required for manufacturers to
consider the comfort and performance of developing value-added products.
5. Conclusions
The traditional shoe industry has consumed a lot of energy and resources, such as
fossil fuels, rubber, cotton, and toxic materials. The introduction of SPD helps the industry
save energy and resources as it allows manufacturers to focus on specific product attributes,
which increases revenue as well as consumer satisfaction with appropriate design, functions,
and recycling materials. For proposing an SPD model for the shoe industry, Kano’s two-
dimensional model was adopted with interviews and questionnaire surveys.
The interview with experts with careers in the shoe industry contributed to selecting
product attributes of an air-cushioned casual shoe company that were chosen as the re-
search subject. Taiwan’s small and medium-sized shoe manufacturers are experiencing the
transformation to sustainable development. For the development, brand management and
satisfying customer demand are major challenges as long as the past development processSustainability 2021, 13, 2484 21 of 22
and marketing are maintained. An appropriated SPD model with the product attributes
provides the basis to improve consumer satisfaction and brand image to enable the shoe
industry to develop continuously and strategically. In the shoe industry, functionality from
the ergonomic aspect in innovation and R&D and design for overall color matching and
matching with other clothing accessories are important factors to greatly increase consumer
satisfaction and reduce dissatisfaction.
Therefore, this study suggests the way to define and select the product attributes
with which manufacturers understand consumer demand and target market. For the
air-cushioned casual shoes, the refined Kano model allowed to reveal that wear-resistant
and non-slip sole and overall texture (stitch, overflow) were important attributes for the
customers to purchase the shoes. In terms of innovation and R&D and marketing and
service, it indicated that the shoe manufacturers need to focus on innovation in technology
and materials.
The product attributes that were defined by the model to stimulate consumers’ desire
to purchase will help the manufacturers define marketing strategies. When air-cushioned
casual shoes on the market are similar in terms of design and function, the result of the
refined Kano model recommends that manufacturers respond actively to different demands
from various age groups and focus on highlighting the difference from competing products.
A new method with the refined Kano model provides a way to define the SPD model with
product attributes that enable the sustainable development of the industry by establishing
a product attribute framework to improve consumer satisfaction for practical applicability.
The SPD model is applied to an industry that has limited resources but needs sustainable
development. It also helps to determine the demanded qualities for improving consumer
satisfaction, which allows manufacturers to maintain sustainable product development.
Funding: This work was supported by the Ministry of Science and Technology of the Republic of
China under grant MOST 108-2628-E-029-001-MY3.
Institutional Review Board Statement: The study did not require ethical approval.
Informed Consent Statement: Informed consent was obtained from all subjects involved in the
study.
Data Availability Statement: The data are not publicly available due to data belonging to the
company’s internal professional managers.
Conflicts of Interest: The authors declare no conflict of interest.
References
1. Jaghbeer, Y.; Hallstedt, S.I.; Larsson, T.; Wall, J. Exploration of simulation-driven support tools for sustainable product develop-
ment. Procedia Cirp 2017, 64, 271–276. [CrossRef]
2. Stark, R.; Buchert, T.; Neugebauer, S.; Bonvoisin, J.; Finkbeiner, M. Benefits and obstacles of sustainable product development
methods: A case study in the field of urban mobility. Des. Sci. 2017, 3, e17. [CrossRef]
3. Ahmad, S.; Wong, K.Y.; Tseng, M.L.; Wong, W.P. Sustainable product design and development: A review of tools, applications
and research prospects. Resour. Conserv. Recycl. 2018, 132, 49–61. [CrossRef]
4. Gordon, M.; Musso, C.; Rebentisch, E.; Gupta, N. Businesses with the best product-development track records stand apart from
their less-successful peers in three crucial ways. In The Path to Successful New Products; McKinsey Quarterly: Seattle, WA, USA,
2010.
5. Ishioka, M.; Yasuda, K. Product development concept with product sustainability. In Proceedings of the PICMET’09-2009 Portland
International Conference on Management of Engineering & Technology, Portland, OR, USA, 2 August 2009; pp. 1699–1706.
6. Park, C.W.; Jaworski, B.J.; Maclnnis, D.J. Strategic brand concept-image management. J. Mark. 1986, 50, 135–145. [CrossRef]
7. Richardson, P.; Dick, A.S.; Jain, A.K. Extrinsic and intrinsic cue effects on perceptions of store brand quality. J. Mark. 1994, 58,
28–36. [CrossRef]
8. Reynolds, T.J.; Gutman, J. Advertising as image management. J. Advert. Res. 1984, 24, 27–38.
9. Hsu, C. Determinants of mature traveler’s motorcoach tour satisfaction and brand loyalty. J. Hosp. Tour. Res. 2000, 24, 223–238.
[CrossRef]
10. Anderson, E.W.; Sullivan, M.W. The antecedents and consequences of consumer satisfaction for firms. Mark. Sci. 1993, 12, 124–143.
[CrossRef]Sustainability 2021, 13, 2484 22 of 22
11. Huiskonen, J.; Pirttila, T. Sharpening logistic consumer service strategy planning by applying Kano’s quality element classification.
Int. J. Prod. Econ. 1998, 56, 253–260. [CrossRef]
12. Kotler, P.; Gartner, D. Country as brand, product, and beyond: A place marketing and brand management perspective. J. Brand
Manag. 2002, 9, 249–261. [CrossRef]
13. Kano, N.; Seraku, N.; Takahashi, F.; Tsuji, S. Attractive quality and must-be quality. Qual. Control Mon. 1984, 41, 39–48.
14. Yang, C.C. The refined kano’s model and its application. Total Qual. Manag. 2005, 16, 1127–1137. [CrossRef]
15. Yoji, A. New Product Development-Practical Application of Quality Functions; China Productivity Center: New Taipei, Taiwan, 1992.
16. Jane, A.C.; Dominguez, S.M. Citizens role in health services: Satisfaction behavior: Kano’s model, Part2. Qual. Manag. Health Care
2003, 12, 72–80. [CrossRef]
17. Joiner, B.L. Fourth generation management: The new business consciousness. Acad. Manag. Perspect. 1994, 8, 118–119. [CrossRef]
18. Vasilash, G.S. Attractive quality: Getting it can help. Production 1995, 107, 64–65.
19. Tan, K.C.; Pawitra, T.A. Integrating SERVQUAL and Kano’s Model into QFD for service excellence development. Manag. Serv.
Qual. 2001, 11, 418–430. [CrossRef]
20. Schvaneveldt, S.; Takao, E.J.; Masami, M. Consumer evaluation perspective of service quality: Evaluation factors and two-way
model of quality. Total Qual. Manag. 1991, 2, 149–161. [CrossRef]
21. Matzler, K.; Hinterhuber, H.H. How to make product development projects more successful by integrating Kano’s model of
consumer satisfaction into quality function deployment. Technovation 1998, 18, 25–38. [CrossRef]
22. Sireli, Y.; Kauffmann, P.; Ozan, E. Integration of Kano’s model into QFD for multiple product design. IEEE Trans. Eng. Manag.
2007, 54, 380–390. [CrossRef]
23. Lu, T.J.; Juan, Y.K. Applying kano two-dimensional quality model to build the performance evaluation indicators of long-life
high-quality condominiums. Sustainability 2019, 11, 4046. [CrossRef]
24. Zhang, X.; Li, J.; Hu, Z.; Qi, W.; Zhang, L.; Hu, Y.; Su, H.; Ferrigno, G.; Momi, E.D. Novel design and lateral stability tracking
control of a four-wheeled rollator. Appl. Sci. 2019, 9, 2327. [CrossRef]
25. Tu, J.C.; Yang, C.H. Consumer needs for hand-touch product designs based on the experience economy. Sustainability 2019, 11,
2064. [CrossRef]
26. Wu, J.; Wang, Y.; Zhang, R.; Cai, J. An approach to discovering product/service improvement priorities: Using dynamic
importance-performance analysis. Sustainability 2018, 10, 3564. [CrossRef]
27. Chen, K.L.; Yeh, T.M.; Pai, F.Y.; Chen, D.F. Integrating refined Kano’s model and QFD for service quality improvement in healthy
fast-food chain restaurants. Int. J. Env. Res. Public Health 2018, 15, 1310. [CrossRef] [PubMed]
28. Min, H.; Yun, J.; Geum, Y. Analyzing dynamic change in consumer requirements: An approach using review-based kano analysis.
Sustainability 2018, 10, 746. [CrossRef]
29. Qiu, H.Z. Structural Equation Model (LISREL’s Theory, Technology and Application); Shuang Yeh Publications: Taipei, Taiwan, 2003.
30. Qianli, X.; Roger, J.J.X.Y.; Helander, M. An analytical Kano’s model for consumer need analysis. Des. Stud. 2009, 30, 87–110.You can also read