Crowdsourcing and Machine Learning Approaches for Extracting Entities Indicating Potential Foodborne Outbreaks From Social Media
←
→
Page content transcription
If your browser does not render page correctly, please read the page content below
Crowdsourcing and Machine Learning Approaches for Extracting Entities Indicating Potential Foodborne Outbreaks From Social Media Dandan Tao University of Illinois Urbana-Champaign Dongyu Zhang Worcester Polytechnic Institute Ruofan Hu Worcester Polytechnic Institute Elke Rundensteiner Worcester Polytechnic Institute Hao Feng ( haofeng@illinois.edu ) University of Illinois Urbana-Champaign Research Article Keywords: mining, Machine learning, Twitter, Foodborne diseases, BERTweet model Posted Date: June 1st, 2021 DOI: https://doi.org/10.21203/rs.3.rs-496521/v1 License: This work is licensed under a Creative Commons Attribution 4.0 International License. Read Full License
1 Crowdsourcing and machine learning approaches for extracting entities indicating

 2 potential foodborne outbreaks from social media

 3

 4 Dandan Tao1, Dongyu Zhang2, Ruofan Hu2, Elke Rundensteiner2, 3* and Hao Feng1*

 5

6 1 – Department of Food Science and Human Nutrition, University of Illinois at Urbana-Champaign

 7 2 – Data Science Program, Worcester Polytechnic Institute

 8 3 – Department of Computer Science, Worcester Polytechnic Institute

 9 * –Corresponding author. Hao Feng. Email: haofeng@illinois.edu; Tel: 217-244-2571

10 Address: College of Agricultural, Consumer and Environmental Sciences, 382F Agricultural Engineering

11 Sciences Building, 1304 W. Pennsylvania Ave. Urbana, IL 61801

12 * Elke Rundensteiner. Email: rundenst@wpi.edu; Tel: 508-831-5815

13 Address: Worcester Polytechnic Institute, Fuller Labs 135, 100 Institute Road, Worcester, MA 01609
14 Abstract

15 Foodborne outbreaks are a serious but preventable threat to public health that often lead to

16 illness, loss of life, significant economic loss, and the erosion of consumer confidence.

17 Understanding how consumers respond when interacting with foods, as well as extracting

18 information from posts on social media may provide new means of reducing the risks and

19 curtailing the outbreaks. In recent years, Twitter has been employed as a new tool for identifying

20 unreported foodborne illnesses. However, there is a huge gap between the identification of

21 sporadic illnesses and the early detection of a potential outbreak. In this work, the dual-task

22 BERTweet model was developed to identify unreported foodborne illnesses and extract

23 foodborne-illness-related entities from Twitter. Unlike previous methods, our model leveraged

24 the mutually beneficial relationships between the two tasks. The results showed that the F1-score

25 of relevance prediction was 0.87, and the F1-score of entity extraction was 0.61. Key elements

26 such as time, location, and food detected from sentences indicating foodborne illnesses were

27 used to analyze potential foodborne outbreaks in massive historical tweets. A case study on

28 tweets indicating foodborne illnesses showed that the discovered trend is consistent with the true

29 outbreaks that occurred during the same period.

30

31 Keywords: Text mining; Machine learning; Twitter; Foodborne diseases; BERTweet model
32 1. Introduction

33 Foodborne diseases caused by the consumption of contaminated foods are an important

34 public health issue that severely threatens the human health[1]. Approximately 4 million illnesses

35 in Canada, 48 million in the United States, and 600 million worldwide, with 420,000 deaths,

36 occur each year[2, 3, 4]. When two or more people become ill after consuming the same food, a

37 foodborne outbreak occurs. They usually result in significant losses in work time, economic

38 burdens, and losses of precious lives[5]. In the United States alone, the annual economic cost of

39 foodborne illnesses has been estimated to be $15- $60 billion, depending on the cost-of-illness

40 model used[6, 7]. The underreporting of foodborne illnesses is also an issue that affects the

41 accurate estimation of the scale and economic burden of foodborne illnesses[8].

42 Early detection of foodborne outbreaks would reduce the risk and curtail infections by

43 means of product recalls and restaurant closures[9, 10]. However, the current outbreak detection

44 method in the United States, carried out by the Centers for Disease Control and Prevention

45 (CDC), usually entails a significant delay between the first infections and when action is taken to

46 inform the public about the incidence of an outbreak. In addition, risk assessment tools such as

47 qualitative microbial risk assessment (QMRA) are based on assumptions and may not be able to

48 facilitate a fast outbreak detection for reducing the losses [11]. On the other hand, these approaches

49 are often relying on structured data that are collected via planned field-trial studies. These data

50 are expensive to obtain and often not available in the most up-to-date form.

51 In recent years, the readily available and rapidly disseminated digital data (e.g., social

52 media) have been utilized for detecting foodborne illnesses [12 – 17]. Crowdsourcing, a method that

53 leverages massive online data from user responses, coupled with machine learning approaches

54 provide a new means for conducting food safety risk analysis and risk communications[18, 19]. For
55 example, Ordun et al. (2013) used feeds from the open-source media outlets Twitter and Rich

56 Site Summary to characterize the 2012 Salmonella event related to cantaloupes and estimate the

57 numbers of sick, dead, and hospitalized[12]. Harrison et al. (2014) developed a model to capture

58 signals of foodborne illnesses from Twitter [14]. Effland et al. (2018) employed Yelp reviews to

59 build a system for detecting foodborne outbreaks from restaurants[16]. The models have been

60 adopted by a number of local health departments, including Chicago and New York City.

61 Increasingly, the potential of employing social media data for public health surveillance has

62 gained the attention of governments. In the past, prevention of foodborne outbreaks has mainly

63 relied on reducing contaminations that can happen throughout the food supply chain, including

64 the production, processing, packaging, transport, and storage[1]. In comparison, the incorporation

65 of social media data explores the role that consumers can play in prevention of foodborne

66 outbreaks.

67 Twitter (Twitter.com) has been recognized as one of the most popular social media

68 platforms employed in public health-related studies[20]. Using text mining and machine learning

69 techniques, researchers have explored the use of intelligent systems that can identify trending

70 topics, mine consumer opinions, and capture food safety hazards from Twitter [21]. However, the

71 characteristics of Twitter - short tweets, informal grammar, abbreviations, typographical errors,

72 and hashtags – make the text analysis of the data challenging[22]. With the rapid development of

73 natural language processing (NLP) technology, the state-of-the-art methods have improved the

74 performances in various NLP tasks. The language model BERTweet, a variant of BERT

75 (Bidirectional Encoder Representations from Transformers) was designed specifically for NLP

76 tasks on Twitter23. The BERTweet model outperforms strong baselines in name-entity extraction

77 and text classification tasks. While Twitter has been employed for detecting unreported
78 foodborne illnesses, the previous studies have only considered a binary classification problem in

79 which the models only predicted if a consumer’s post on social media indicated the occurrence

80 of a foodborne illness, while failing to collect other critical information (e.g., food, location, and

81 symptom) for predicting a potential foodborne outbreak[13, 14, 15].

82 Therefore, this work aims to employ Twitter as the data source and modify the language

83 model BERTweet to not only predict if a consumer’s post (a tweet) indicates an incidence of

84 foodborne illness, but also to extract critical entities related to the foodborne illness incidence in

85 an automatic manner. The key elements of time, location, and food will be detected in tweets

86 related to the unreported foodborne illnesses and used as critical information for analysis of

87 potential outbreaks.

88 2. Materials and Methods

89 2.1 Data collection

90 Twitter provides sampled data (~1%) for research purposes. In this study, both real-time

91 and historical data were collected for enriching the dataset for analysis. Around 43GB real-time

92 tweets were collected through the Twitter Streaming API using a keyword filter starting from

93 October 2020, which can download twitter messages in real time, Keywords were selected based

94 on the relevance to foodborne illnesses including common symptoms and their variations,

95 including ‘#foodpoisoning’, ‘#stomachache’, ‘food poison’, ‘food poisoning’, ‘stomach’,

96 ‘vomit’, ‘puke’, ‘diarrhea’, and ‘the runs,’ while some very ambiguous words (e.g., ‘sick,’

97 ‘fever’) were discarded to exclude diseases not related to foodborne illnesses[16] (Effland et al.,

98 2018). In addition, 36GB historical Twitter data were collected through a third-party tool Twint
99 from 2011/1/1 to 2020/12/31 with the same keyword list. The two datasets were mixed and

100 sampled for labeling process.

101 2.2 Crowdsourcing and human labeling

102 Amazon Mechanical Turk was employed as the platform for crowdsourcing, in which

103 registered labelers were recruited to complete the tasks. For a given tweet, workers were asked to

104 read carefully, score on a scale of 0-5 on how much they agreed that the tweet indicated a

105 possible foodborne illness incidence (0: not at all, 5: very sure), highlighted all words/phrases

106 belonging to specific labels (food, location, symptom, and foodborne illness keywords), and

107 decided if each of the highlighted words/phrases was related to the foodborne illness incidence.

108 An illustration of the labeling interface is shown in Figure 1.

109 Three thousand tweets were selected from the pool mixed with historical and real-time

110 data as the dataset to be labeled, and each tweet was assigned to five workers to collect the

111 results. The quality of the labeled data is of significant importance to ensure model performance.

112 Thus, a few steps were designed to identify and reject bad annotations to ensure data quality.

113 First, the dataset was split into six batches and published on the Amazon Mechanical Turk

114 platform one batch per time (i.e., 500 tweets/time). The maximum number of tweets that one

115 worker can label was set to 10 in each batch to prevent spammers providing too many low-

116 quality annotations. An algorithm modified from Finin et al. (2010) was adopted to evaluate the

117 inter-worker agreement, for eliminating low-quality annotations[24]. The pseudocode for the

118 algorithm is shown in Figure 2. The annotations with less similarity than the threshold (0.6) were

119 rejected and republished for others to label to obtain high-quality annotations, while the

120 spammers who labeled the low-quality annotations were blocked from labeling in future batches.
121 After collecting the labeled data, majority voting, a common method used in aggregating data

122 from crowdsourcing, was used to aggregate the results from different labelers.

123 2.3 Dual-task BERTweet model

124 BERTweet is the first public large scale pre-trained language model for English Tweets.

125 The model architecture of BERTweet is the same as the BERT base model. BERTweet uses the

126 RoBERTa pre-training procedure. Experiments illustrated that the BERTweet outperforms state-

127 of-the-art models on named-entity recognition and text classification tasks[23]. In this study, we

128 aimed to design a language model that allowed us to complete two tasks, i.e., 1) to classify if a

129 sentence/tweet indicated a foodborne illness incidence and 2) to extract entities related to the

130 incidence, simultaneously. Therefore, a dual-task BERTweet model was developed by modifying

131 the architecture of the BERTweet model, as shown in Figure 3. Before feeding into the model,

132 tweets were first tokenized and special tokens were added to the tweets. [CLS] was a special

133 symbol added in front of every input sentence. [SEP] was a special separator added right after

134 the end of every input sentence. [PAD] was added after the [SEP] token to make all input

135 sentences have the same length. Then the model took the preprocessed tweet as the input. Then

136 the BERTweet model generated a sequence of vectors that served as the representation of each

137 token in the tweet. The representation of [CLS], having been pre-trained as the classification

138 representation of input sentence, was fed into a sequence classifier to predict the relevance of the

139 input tweet. Meanwhile, all token representations were fed into the token classifier to generate

140 the prediction of the entity type of each corresponding token. The entity extraction and sequence

141 classification can benefit each other by sharing the representations from the BERTweet model.
142 2.4 Model training

143 The aggregated results of the 3,000 labeled data were collected for machine learning with

144 training, validation and testing, in which training set (2,400 tweets) was used to learn a dual-task

145 model best describes the dataset, validation set (300 tweets) was used to generalize the model,

146 and testing set (300 tweets) was used to evaluate the performance of the trained model (see

147 Supplementary Figure S1). The trained dataset was fed into the dual-task BERTweet model,

148 which generalized when the validation set was introduced. The performance of the model was

149 evaluated based on applying the trained model to the test set.

150 2.5 Evaluation

151 Given a dataset, a binary classification gives a number of positives (Yes) and the number

152 of the negatives (No). To evaluate a classifier, one needs to compare the predicted conditions

153 with true conditions. As shown in Supplementary Table S3, the four numbers (true positive/TP,

154 false negative/FN, false positive/FP, and true negative/TN) are the basics for computing

155 performance metrics in binary classification tasks. The performance of each classifier was

156 evaluated on the 300 tweets in the test dataset. For the task of sentence classification, we

157 evaluated the performance of the dual-task BERTweet model in the sentence classification task

158 using 4 common performance metrics: precision, recall, F1-score and accuracy[25]. Precision, or

159 positive predictive value, is the proportion of true positives out of the total number of positive

160 predictions, expressed as = . Recall, or sensitivity, is the true positive rate,
 +

161 expressed by = . F1-score is the harmonic mean of precision and recall, expressed
 +

 × 2
162 as F1-score = 2 × = . Accuracy is the rate of predicting right out of
 + 2 + +
 +
163 all the predictions, expressed as = . The range for all the four metrics is
 + + +

164 between 0 and 1, with 0 being the worst score and 1 the best score. Among them, F1-score is

165 most popular in evaluating binary classification problems, and will be adopted as the primary

166 metric in result discussions.

167 We evaluated the performance of model on entity extraction task using the same four

168 metrics in different expressions ( = , =

169 , = , F1-score = 2 ×

 ×
170 ). F1-score is also a popular metric used in evaluating entity extraction, thus will
 +

171 be mainly adopted in result discussions [26].

172 2.6 Frequency analysis

173 The dual-task BERTweet model was applied to the historical Twitter data collected from

174 the 1/1/2018 to 12/31/2018. Given a tweet, the model gives two results – one is “Yes” or “No”

175 for sentence classification task to classify if the tweet indicates a foodborne illness incidence,

176 and another is sequence annotations for each element in that tweet, including predicted entities.

177 For example, one tweet is “I got food poisoning from a grilled cheese last night and I’ve never

178 felt so betrayed in my life.” The results based on the model are [“Yes”], [‘O’, ‘O’, ‘B-other’, ‘I-

179 other’, ‘O’, ‘O’, ‘B-food’, ‘I-food’, ‘O’, ‘O’, ‘O’, ‘O’, ‘O’, ‘O’, ‘O’, ‘O’, ‘O’, ‘O’, ‘O’]. The

180 non-O continuous tag sequence of the same type is an entity. Here, the model predicts two

181 entities – one is “food poisoning” labeled as KEY entity, another is “grilled cheese” labeled as

182 FOOD entity. Only when the sentence classification result was “Yes” and the FOOD entity was
183 predicted, the tweet was included in frequency analysis, in which the changes in total number of

184 relevant tweets with time were observed.

185 3. Results and Discussions

186 3.1 Observations from a shallow data-processing pipeline

187 To obtain instant and historical online data related to foodborne illnesses, we first

188 developed a data-processing pipeline that automatically extracted and detected information on

189 potential food-poisoning incidents from Twitter posts. Tweets mentioning the keyword “food

190 poisoning” in the timespan of January 1, 2018, to September 18, 2018, were extracted as

191 potential signals of foodborne illnesses. The daily number of collected tweets as signal intensities

192 was observed (see Supplementary Figure S2). The black line represents the raw data, and the red

193 line presents the data after pre-processing (e.g., the removal of retweets and hyperlinks). Though

194 the average intensity significantly declined after the preprocessing, the temporal pattern

195 remained consistent. The peaks appeared in the months of March, April, June, and September,

196 those related to the recent foodborne outbreaks. These results encouraged us to look closer at the

197 content of each data point to figure out the potential correlations of these tweets to the outbreaks.

198 Personal-experience tweets, which tend to use more personal pronouns (e.g., I, you, we), and

199 also to have stronger sentiments (mostly negative), than those that are non-personal experience

200 tweets (see Supplementary Table S4). Some entities identified by human taggers were listed in

201 the example tweets, including symptoms common in produce-induced foodborne illnesses, and

202 name entries of produce or food products (e.g., lettuce, salad, sandwich). However, this method

203 is limited to the data collection mechanism with only one keyword (“food poisoning”). Harris et

204 al. (2014) used the same strategy to collect data for building a machine learning model to classify
205 foodborne illnesses from Twitter[13]. Effland et al. (2018) expanded the keyword list by including

206 hashtags (e.g., “#foodpoisoning”) and other forms (e.g., “food poison”) of keyword “food

207 poisoning,” and symptoms of foodborne illnesses (e.g., “stomach,” “vomit,” “puke,” “diarrhea,”

208 and “the runs”)[16]. It needs to be clear that adding more keywords to the search strategy will

209 collect more data potentially related to a foodborne illness incidence, while introducing more

210 noises (irrelevant information) at the same time. In this approach, the method from Effland et al.

211 (2018) was adopted for maximizing relevant dataset [16]. On the other hand, the cost of identifying

212 entities was rather high as it relied on human tagging, in which a machine learning approach

213 would be more efficient by allowing the computer to detect the entities in an automatic manner.

214 A dual-task BERTweet machine learning model was, therefore, developed to not only classify

215 the unreported foodborne illness incidence, but also detect important entities related to the

216 incidence.

217 3.2 Performance of the dual-task BERTweet model

218 The performance of the dual-task BERTweet model is shown in Table 1. The F1-score,

219 defined as the harmonic mean of precision and recall, is widely used as a popular metric to

220 evaluate the performance of machine learning models[16, 27]. The model achieved F1-scores of

221 0.87 and 0.61 on the sentence classification task and the entity extraction task, respectively. Of

222 the 300 tweets in the test dataset, there are 203 positive examples (labeled as “Yes) and 97

223 negative examples (labeled as “No”) for the sentence classification task. In the protocol designed

224 for human taggers on Amazon Mechanical Turk (see Figure 1), the task of classifying if a tweet

225 is relevant (“Yes”) or irrelevant (“No”) to a foodborne illness incidence was designed as point

226 scale (0 – 5) instead of binary scale (“Yes” or “No”). It was based on the assumption that the

227 point scale would help human taggers to make the decision easier when faced with ambiguous
228 tweets. The results obtained were then transferred to a binary scale by denoting tweets labeled

229 with 0 – 2 as negatives (“No”) and tweets labeled with 3 – 5 as positives (“Yes”) before feeding

230 into the model. Some examples of tweets in the test dataset and correct and incorrect predictions

231 are shown in Table 2. Many of the false positives cannot be identified by the model based on n-

232 grams up to n = 3. For example, a tweet wrote, “It happens too fast to be food poisoning,” which

233 would require 6-grams for the model to capture the negation (too… to…). It illustrates a major

234 shortcoming of language models based on n-grams: important relationships between words often

235 span large distances across a sentence. Another major source of false positives are tweets that,

236 though talking about an experience of food poisoning, either happened in the past or in a

237 hypothetical/future sense, thus are not labeled as “Yes.” Similar observations were found in the

238 study by Effland et al. (2018) on the task of classifying “sick” reviews from Yelp [16].

239 The performance of the dual-task BERTweet model on sentence classification task was

240 based on the number of sentences predicted by the model. In contrast, the performance of the

241 model on entity extraction task was based on the number of entities predicted by the model.

242 Some examples of entity extraction are shown in Table 2. It can be seen that all the labeled

243 entities were predicted correctly by the dual-task BERTweet model, while the model also

244 predicted some entities that were not labeled. For instance, words such as “starving” and “sick”

245 were predicted as symptoms (simplified as SYM) while they were not labeled in the dataset.

246 Keywords (simplified as KEY) such as “food poisoning,” or food names (simplified as FOOD)

247 such as “grilled cheese,” labeled out in the dataset, were also predicted correctly by the model. It

248 indicates that the dual-task BERTweet model is capable of capturing most of the important

249 entities related to a foodborne illness incidence. It allows us to collect critical information such

250 as food, symptoms, location, which would be impossible with human tagging when the dataset is
251 large as the Twitter streaming data. Along with the time information provided by the collected

252 dataset, one can conduct event detection of potential foodborne outbreaks by utilizing the

253 collective data.

254 The changes in the number of tweets indicating foodborne illnesses associated with

255 lettuce without location differentiation is shown in Figure 4, in which Figure 4a is the result

256 extracted by our dual-task BERTweet model, (food entity = “lettuce”) and Figure 4b is the result

257 extracted by keyword search (keyword = “lettuce”). It can be seen that the two results look

258 almost the same, with similar spike distributions across time, evidencing the high precision of the

259 dual-task BERTweet model in extracting specific entities. While keyword searching is a

260 common method to extract relevant information for a given food item, our model has the

261 advantage that it can extract all food items automatically without supervision. In reality, the food

262 item causing a foodborne outbreak is often unknown during initial period or even till the end of

263 the events. Therefore, this model provides an opportunity to monitor the changes of potential

264 risky food items with time for assisting outbreak investigation.

265 Social media has been utilized to detect unreported foodborne illness incidences in a

266 number of recent studies, and the methods were adopted by several local health departments,

267 including those in Chicago [13], Las Vegas[26], New York City[16], and St. Louis[28]. The models

268 developed by these works are summarized in Supplementary Table S5, in which the name of the

269 models and their performance in predicting Twitter data using F1-scores are listed. These models

270 were used as baseline models for comparing with our BERTweet model. In the individual

271 models that only classify foodborne illness incidences, the F1-scores of the Foodborne Chicago

272 model and of the FoodSafety SLT model were not provided in their reports, while the F1-score

273 of the FINDER model was 0.74. The dual-task model developed by Effland et al., 2018 was
274 recognized as the one with best performance in the task of classifying unreported foodborne

275 illness incidents from social media[16]. In contrast with our study, the dataset they used was Yelp

276 reviews instead of Twitter posts. The F1-score for the task of classifying “sick” reviews was 0.87

277 as indicated in their paper. By deploying the FoodborneNYC model released on Github.com to

278 analyze tweets, we found that the F1-score dropped to 0.84, which could be attributed to the

279 differences in the two datasets. The F1-score of our dual-task BERTweet model is 0.87, meaning

280 that, in the task of classifying unreported foodborne illness incidences from Twitter data, our

281 model outperforms the previous models. In addition, this model also can extract entities of

282 importance to conduct outbreak analysis. The FoodborneNYC is also a dual-task model that can

283 classify if a review contains “multiple” illnesses, which might be indicative of a potential

284 outbreak from one restaurant. However, large-scale outbreaks such as multistate outbreaks are

285 not occurring in one restaurant. The advantage of using entities related to foodborne illness

286 incidences is that it is not restricted by location, and thus has potential to be applied to detect

287 large-scale outbreaks.

288 3.3 Trends of foodborne illnesses across time

289 In contrast with the results in section 3.1 that was based on data all over the world, only

290 tweets in the United States will be discussed in this section. Carmen, a location inference tool for

291 Twitter data, was used to obtain the location information for each tweet [29]. To note that, the tool

292 utilizes all location-related information, including geolocations and user profiles, to estimate the

293 approximate locations for a tweet. The locations estimated based on user profiles would be less

294 accurate than those from geolocations since the places users mention in their profiles won’t

295 always be the places they post tweets. Due to the fact that there is a lot of missing data in either

296 geolocation along with the posted tweet or the location information in the user’ profiles, the
297 locations identified were accounting for only 1% of all the collected data. Non-US tweets were

298 excluded by removing the tweets whose location was either not identified or in other countries.

299 The remaining tweets were fed into the dual-task BERTweet model to determine if they

300 indicated foodborne illnesses incidences and to extract important entities (e.g., food, location,

301 symptoms). The change of daily volume (number of tweets per day) within the United States

302 domain in 2018 is shown in Figure 5. It can be seen that the number of tweets per day is

303 significantly smaller than those in Supplementary Figure S2. Some spikes were observed in the

304 days of January – February, March – May, September – October, and in December. However, it

305 is challenging to connect the spikes to a foodborne outbreak due to the noises from sporadic

306 incidents of foodborne illnesses that are not attributing to a foodborne outbreak. On the other

307 hand, multiple foodborne outbreaks can happen spontaneously, which makes the task even more

308 difficult if only the time-series data is provided. More information of relevance to a foodborne

309 outbreak is needed when connecting the trend on Twitter with real-life events.

310 3.4 Effects of the dual-task model on extracting food entities

311 The top 20 food entities identified by the dual-task BERTweet model in tweets located in

312 the US. and associated with foodborne illnesses included coffee, pizza, chicken, milk, cheese,

313 ice, salad, spices, cream, meat, lettuce, tea, soup, fries, sushi, taco, burger, chocolate, chip, beer,

314 fish, and beef (data not shown). These observations were compared with the foods involved in

315 foodborne outbreaks[30]. It was found that the model not only correctly extracted foods frequently

316 involved in foodborne outbreaks, such as pizza, chicken, milk, cheese, and salad, but also

317 extracted other foods less frequently appeared, such as coffee, ice, tea, chocolate, and chip. It

318 indicates that language structure might be the major factor affecting the entity extraction results,

319 because of whichever elements with similar language structures would be extracted as same type
320 of entities. In addition to specific food terms, the model also extracted general terms such as

321 food, breakfast, drink, dinner, and lunch, due to similar language structure. For example, one

322 might say “I had a pizza yesterday and got sick, vomiting,” or “I had breakfast from McDonald

323 and got food poisoning.” The positions of the words (pizza and breakfast) were the same in the

324 two sentences, and thus can be easily recognized as the same types of entities by the language

325 models. Besides, non-food items such as plastic bags, stomach, eat, half-eaten, and bowl were

326 also extracted, indicating that the model mis-classifies them as food entities. The F1-score of the

327 entity extraction task was 0.61, relatively lower than that of the sentence classification task

328 (0.87).

329 Named entity extraction for social media data is challenging due to its inherent noisiness

330 such as improper grammatical structures, spelling inconsistencies and numerous informal

331 abbreviations[26]. A variety of methods have been developed to tackle this problem. The

332 BERTweet model was recognized as an effective method to conduct tasks of named entity

333 extraction[23]. The food entities extracted by the model provide extra information for signals of

334 unreported foodborne illnesses, which allows the analysis of foodborne illness incidents

335 associated with specific foods. To connect the volume changes from online data with real-life

336 events, we conducted a case study by selecting specific food entities extracted by the model. As

337 shown in Figure 6a, changes in the number of tweets indicating foodborne illnesses and

338 mentioning the food entity “lettuce” was observed. It can be seen that there are some spikes in

339 Early January, from April to June, and from November to December. However, the data is

340 relatively small due to the sparsity of location information in the dataset. Two large lettuce-

341 related outbreaks occurred in 2018. One is from March to June, and another is from December to

342 January (2019), indicating the time span of these spikes are consistent with the real-life data. In
343 particular, the romaine lettuce outbreak happened in March 2018 was a serious multi-state

344 outbreak in the United States, leading to 210 illnesses reported by the CDC. We also included

345 more related food items, including “salad” and “sandwich” in which “lettuce” is a common

346 ingredient, to increase the data volume. As shown in Figure 6b, the spike spanning from April to

347 June becomes significantly more obvious than the other two spikes, with a rapid increase in late

348 April, which is consistent with the romaine lettuce outbreak occurring at the same time.

349 Social media platforms such as Twitter provide a unique opportunity to monitor food

350 safety related incidents and their spread across time and space in a near real-time fashion. The

351 availability of the what, where and when information about people’s everyday life on the social

352 media websites has proven to be valuable for predicting the flu well before outbreaks have

353 formally been reported by the CDC, and for preventing public health crisis[31]. In the food safety

354 scenario, what refers to the content of the tweet describing a potential food safety incident, e.g.,

355 the food item and the complaints about it, while where and when encode the geolocation and the

356 timeframe of the incidents respectively. These properties together form the core entities essential

357 for food safety outbreak monitoring and prevention.

358 4. Conclusions

359 Social media platform Twitter has been used as a novel data source for identifying unreported

360 foodborne illnesses. A number of language models were developed to classify if a Tweeter post

361 (tweet) indicated a foodborne illness. However, the sporadic signals being captured won’t be

362 able to predict a large-scale outbreak without the availability of critical information related to an

363 outbreak. Therefore, in this work, a dual-task BERTweet model, a derivative of the original

364 BERTweet model, was developed to achieve two goals: 1) classifying if a given tweet was

365 associated with a foodborne illness incidence, and 2) extracting critical entities including food,
366 symptoms and location related to that incidence. The performance of the model in the first task

367 outperformed all previous models with a F1-score of 0.87. The model also showed high precision

368 in extracting specific food entities, using “lettuce” as an example. By narrowing down the dataset

369 to the US. domain through location inference, the time-series trend of “sick” tweets related to

370 “lettuce” in 2018 exhibited a similar behavior with the two lettuce-related outbreaks that

371 happened that year. However, the volume became relatively low when focusing on a specific

372 region due to the scarcity of location information. Therefore, the next-step work should focus on

373 how to improve the location inference method so that the dataset could be more precision when

374 connecting to real-life events. Another limitation of this work is data availability. While Twitter

375 provides its API for collecting data for research purposes, the data size available only accounts

376 for about 1% of the whole dataset. As a result, the data for analysis would always be sampled

377 data, which could raise bias concern inherently. More statistical methods should be considered

378 dealing with incomplete sample data when one is trying to connect the observations with a

379 population-level event. Nevertheless, this work develops a model that can provide key elements

380 such as time, location, and food detected from “sick” tweets, which are essential for the

381 development of an early warning method to predict potential foodborne outbreaks in future.

382 Data availability

383 The datasets collected and analyzed during the current study are available from the

384 corresponding author on reasonable request.

385 References

386 1. Huang, X. et al. AIEgens: an emerging fluorescent sensing tool to aid food safety and quality

387 control. Compr. Rev. Food Sci. F. 19, 2297-2329 (2020).
388 2. Scallan, E. et al. Foodborne illness acquired in the United States—major pathogens. Emerg.

389 Infect. Dis. 17, 7 (2011).

390 3. Thomas, M. K. et al. Estimates of the burden of foodborne illness in Canada for 30 specified

391 pathogens and unspecified agents, circa 2006. Foodborne Pathog. Dis. 10, 639-648 (2013).

392 4. Havelaar, A. H. et al. World Health Organization global estimates and regional comparisons

393 of the burden of foodborne disease in 2010. PLoS Med. 12, e1001923 (2015).

394 5. Hoffmann, S., Batz, M. B., & Morris, J. G. Annual cost of illness and quality-adjusted life

395 year losses in the United States due to 14 foodborne pathogens. J. Food Prot. 75, 1292-1302

396 (2012).

397 6. Hoffmann, S., & Scallan Walter, E. Acute complications and sequelae from foodborne

398 infections: informing priorities for cost of foodborne illness estimates. Foodborne Pathog.

399 Dis. 17, 172-177 (2020).

400 7. Scharff, R. L. The economic burden of foodborne illness in the United States. In Food safety

401 economics 123-142. Springer, Cham (2018).

402 8. Quade, P., & Nsoesie, E. O. (2017). A platform for crowdsourced foodborne illness

403 surveillance: description of users and reports. JMIR Public Health Surveil. 3, e42.

404 9. Boxrud, D., Monson, T., Stiles, T., & Besser, J. The role, challenges, and support of pulsenet

405 laboratories in detecting foodborne disease outbreaks. Public Health Rep. 125, 57-62 (2010).

406 10. Casas, J., Mugellini, E., & Abou Khaled, O. (2020, April). Early Detection of Foodborne

407 Illnesses in Social Media. In International Conference on Human Interaction and Emerging

408 Technologies (pp. 415-420). Springer, Cham.

409 11. Boone, I. et al. NUSAP: a method to evaluate the quality of assumptions in quantitative

410 microbial risk assessment. J. Risk Res. 13, 337-352 (2010).
411 12. Ordun, C. et al. Open source health intelligence (OSHINT) for foodborne illness event

412 characterization. Online J. Public Health Inform. 5, (2013).

413 13. Harris, J. K. et al. Health department use of social media to identify foodborne illness—

414 Chicago, Illinois, 2013–2014. MMWR Morb. Mortal Wkly. Rep. 63, 681 (2014).

415 14. Harrison, C. et al. Using online reviews by restaurant patrons to identify unreported cases of

416 foodborne illness—New York City, 2012–2013. MMWR Morb. Mortal Wkly. Rept. 63, 441

417 (2014).

418 15. Sadilek, A. et al. Deploying nEmesis: Preventing foodborne illness by data mining social

419 media. AI Mag. 38, 37-48 (2017).

420 16. Effland, T. et al. Discovering foodborne illness in online restaurant reviews. J. Am. Med.

421 Inform. Assoc. 25, 1586-1592 (2018).

422 17. Maharana, A. et al. Detecting reports of unsafe foods in consumer product reviews. JAMIA

423 Open. 2, 330-338 (2019).

424 18. Soon, J. M., & Saguy, I. S. Crowdsourcing: A new conceptual view for food safety and

425 quality. Trends Food Sci. Technol. 66, 63-72 (2017).

426 19. Deng, X., Cao, S., & Horn, A. L. Emerging Applications of Machine Learning in Food

427 Safety. Annu. Rev. Food Sci. T. 12, 513-538 (2021).

428 20. Paul, M., & Dredze, M. You are what you tweet: Analyzing twitter for public health.

429 In Proceedings of the International AAAI Conference on Web and Social Media (Vol. 5, No.

430 1) (2011).

431 21. Tao, D., Yang, P., & Feng, H. Utilization of text mining as a big data analysis tool for food

432 science and nutrition. Compr. Rev. Food Sci. F. 19, 875-894 (2020).
433 22. Han, B., Cook, P., & Baldwin, T. Lexical normalization for social media text. In ACM

434 Transactions on Intelligent Systems and Technology (TIST), 4, 1-27 (2013).

435 23. Nguyen, D. Q., Vu, T., & Nguyen, A. T. BERTweet: A pre-trained language model for

436 English Tweets. Preprint at https://arxiv.org/abs/2005.10200 (2020).

437 24. Finin, T. et al. Annotating named entities in twitter data with crowdsourcing. In Proceedings

438 of the NAACL HLT 2010 Workshop on Creating Speech and Language Data with Amazon’s

439 Mechanical Turk 80-88 (2010).

440 25. Hossin, M., & Sulaiman, M. N. A review on evaluation metrics for data classification

441 evaluations. International Journal of Data Mining & Knowledge Management Process, 5, 1

442 (2015).

443 26. Aguilar, G., Maharjan, S., López-Monroy, A. P., & Solorio, T. A multi-task approach for

444 named entity recognition in social media data. Preprint at https://arxiv.org/abs/1906.04135

445 (2019).

446 27. Sadilek, A. et al. Machine-learned epidemiology: real-time detection of foodborne illness at

447 scale. NPJ Digit. Med. 1, 1-7 (2018).

448 28. Harris, J. K. et al. Evaluating the implementation of a Twitter-based foodborne illness

449 reporting tool in the city of St. Louis Department of Health. Int. J. Env. Res. Pub. He. 15, 833

450 (2018).

451 29. Dredze, M., Paul, M. J., Bergsma, S., & Tran, H. Carmen: A twitter geolocation system with

452 applications to public health. In AAAI workshop on expanding the boundaries of health

453 informatics using AI (HIAI) (Vol. 23, p. 45). Citeseer. (2013).
454 30. Nsoesie, E. O., Kluberg, S. A., & Brownstein, J. S. (2014). Online reports of foodborne

455 illness capture foods implicated in official foodborne outbreak reports. Pre. Med. 67, 264-

456 269.

457 31. Aramaki, E., Maskawa, S., & Morita, M. Twitter catches the flu: detecting influenza

458 epidemics using Twitter. In Proceedings of the 2011 Conference on empirical methods in

459 natural language processing 1568-1576 (2011).

460 Acknowledgements

461 This work was supported by the Agriculture and Food Research Initiative (AFRI) award no.

462 2020-67021-32459 from the U. S. Department of Agriculture (USDA) National Institute of Food

463 and Agriculture (NIFA) and the Illinois Agricultural Experiment Station.

464 Author contributions

465 Dandan Tao conceived the idea, developed the protocol for crowdsourcing, led the collaboration

466 team and drafted the manuscript. Dongyu Zhang developed the dual-task BERTweet model.

467 Ruofan Hu collected, cleaned, and processed the data. Dr. Elke Rundensteiner provided

468 suggestions on discussion of technical parts. Dr. Hao Feng reviewed and edited the manuscript.

469 Competing Interests

470 The author(s) declare no competing interests.
471 Figure legends

472 Figure 1. User interface used for data collection on Amazon Mechanical Turk.

473 Figure 2. Pseudocode of the inter-worker agreement algorithm.

474 Figure 3. Diagram of the dual-task BERTweet model.

475 Figure 4. Number of tweets related to foodborne illness incidents associated with lettuce (a –

476 extracted by the dual-task BERTweet model and b – extracted by keyword searching).

477 Figure 5. Number of tweets related to foodborne illness incidents in the United States.

478 Figure 6. Number of tweets related to foodborne illness incidents in the United States (a –

479 including “lettuce” in the tweets and b – including “lettuce” or “salad” or “sandwich” in the

480 tweets).

481 Table 1. Performance evaluation of the dual-task BERTweet model.

482 Table 2. Examples of tweets and predictions using the dual-task BERTweet model.
483 Tables

484 Table 1. Performance evaluation of the dual-task BERTweet model.

 Precision Recall F1-score Accuracy
 Sentence
 0.8495 ± 0.0331 0.8867 ± 0.0343 0.8667 ± 0.0033 0.8153 ± 0.0102
 classification
 Entity
 0.4927 ± 0.0343 0.8143 ± 0.0077 0.6134 ± 0.0271 0.9241 ± 0.0090
 extraction
485

486 Table 2. Examples of tweets and predictions using the dual-task BERTweet model.

 No Sentence Sentence Entity Entity
 Tweets
 . Label Classification Label Extraction
 “It happens too fast to be food [KEY]:
 poisoning. It’s like I forced
 [KEY]: “food
 “food
 1 myself to eat too much, even Not sick Sick (×) poisoning,”
 poisoning
 though I didn’t eat that much
 ” [SYM]:
 and I was starving before.” “starving”
 “Never had one. Never will. I [KEY]:
 [KEY]:
 remember a number of years
 “food “food
 agon reading an article by
 poisoning, poisoning,”
 2 doctor, who said a high Not sick Not sick (√)
 ” [KEY]: [KEY]:
 percentage of supposedly
 “stomach “stomach
 stomach flu cases were
 flu” flu”
 actually food poisoning.”
 [KEY]:
 [KEY]:
 “food
 “I got food poisoning from a “food
 poisoning,
 grilled cheese last night and poisoning,”
 3 Sick Sick (√) ”
 I’ve never felt so betrayed in [FOOD]:
 [FOOD]:
 my life.” “grilled
 “grilled
 cheese”
 cheese”
 “Text U know what’s said? [KEY]:
 I’m so OCD about washing my [KEY]: “food
 hands and not getting sick, “food
 4 Sick Not sick (×) poisoning,”
 everyone around me doesn’t poisoning
 care and guess who gets food ” [SYM]:
 poisoning.” “sick”
487 - Note: × means incorrect predictions and √ means correct predictions.

488
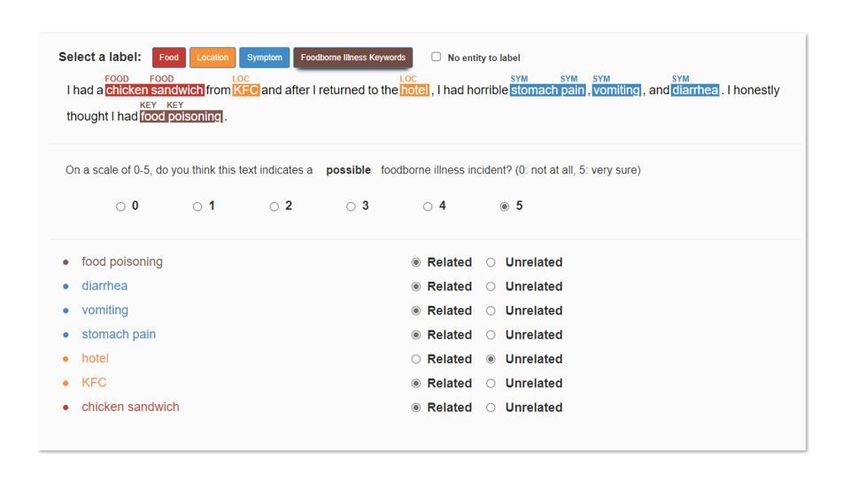
Figures

Figure 1

User interface used for data collection on Amazon Mechanical Turk.
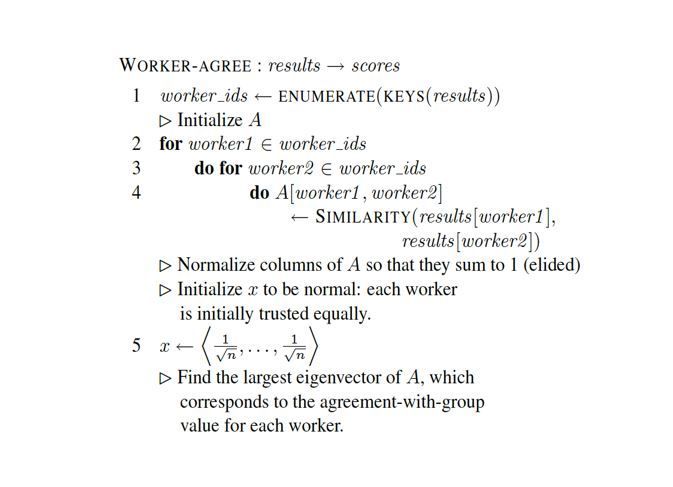
Figure 2

Pseudocode of the inter-worker agreement algorithm.
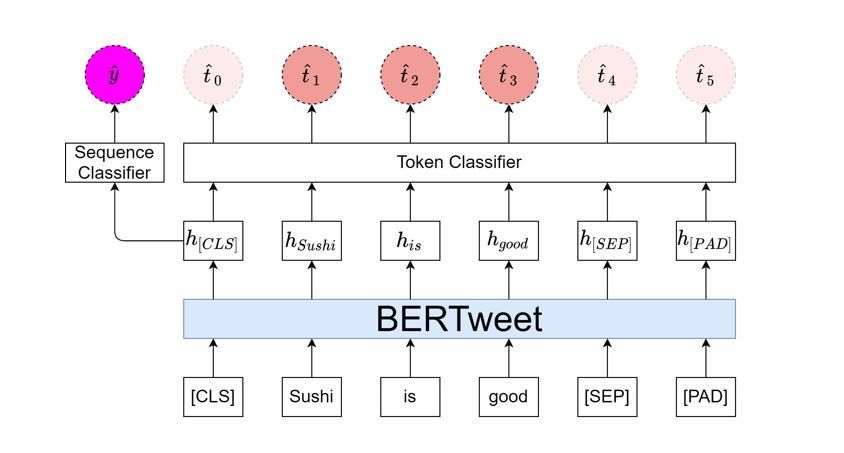
Figure 3

Diagram of the dual-task BERTweet model.
Figure 4

Number of tweets related to foodborne illness incidents associated with lettuce (a – extracted by the
dual-task BERTweet model and b – extracted by keyword searching).
Figure 5

Number of tweets related to foodborne illness incidents in the United States.
Figure 6

Number of tweets related to foodborne illness incidents in the United States (a – including “lettuce” in the
tweets and b – including “lettuce” or “salad” or “sandwich” in the tweets).

Supplementary Files
This is a list of supplementary les associated with this preprint. Click to download.

 Supplementaryinformation les.docx
You can also read