The dynamics of explore-exploit decisions reveal a signal to noise mechanism for random exploration
←
→
Page content transcription
If your browser does not render page correctly, please read the page content below
www.nature.com/scientificreports
OPEN The dynamics of explore–exploit
decisions reveal a signal‑to‑noise
mechanism for random exploration
Samuel F. Feng1,4, Siyu Wang2, Sylvia Zarnescu2 & Robert C. Wilson2,3*
Growing evidence suggests that behavioral variability plays a critical role in how humans manage the
tradeoff between exploration and exploitation. In these decisions a little variability can help us to
overcome the desire to exploit known rewards by encouraging us to randomly explore something else.
Here we investigate how such ‘random exploration’ could be controlled using a drift-diffusion model
of the explore–exploit choice. In this model, variability is controlled by either the signal-to-noise ratio
with which reward is encoded (the ‘drift rate’), or the amount of information required before a decision
is made (the ‘threshold’). By fitting this model to behavior, we find that while, statistically, both drift
and threshold change when people randomly explore, numerically, the change in drift rate has by far
the largest effect. This suggests that random exploration is primarily driven by changes in the signal-
to-noise ratio with which reward information is represented in the brain.
When choosing a class in college, should you exploit the Math class you are sure to ace, or explore the Photog-
raphy class you know nothing about? Exploiting Math may be the way to a better grade, but exploring Photog-
raphy—and finding that it scratches an itch you never knew you had—could be the path to a better life. As with
all such ‘explore–exploit’ decisions, picking the optimal class is hard—explore too much and you’ll never finish
your degree, exploit too much and, like us, you will do Math for the rest of your life.
From a computational perspective, the difficulty of explore–exploit decisions arises due to uncertainty about
the outcome of each choice (Will I like photography or won’t I?) and the long time horizon over which the conse-
quences of a choice can play out (If I like photography should I change my major?). To make an ‘optimal decision,’
that is a decision that maximizes our expected future reward, we need to average over all possible futures out to
some time horizon1. However, averaging over all possible futures requires us to mentally simulate all possible
futures—a computation that scales badly with uncertainty and horizon, and that is surely beyond what any brain
can perform. Thus it is necessary for humans and animals to use heuristics and approximations to make practical
explore–exploit choices that may be suboptimal in theory, but good enough in practice.
Inspired by research in machine learning (see2 for review), recent findings in psychology suggest that humans
use two strategies to make explore–exploit decisions: an explicit bias for information (‘directed exploration’), and
the randomization of choice (‘random exploration’)3–13. In directed exploration, a decision is made by comparing
the expected values of exploring and exploiting. These expected values combine the predicted short-term payoff
from picking an option once, the ‘expected reward,’ with an estimate of the long-term value of the information
obtained from choosing that option, the ‘information bonus,’ also known as the future expected v alue14. The
information bonus increases the value of exploratory options such that, when all else is equal, a directed explorer
will always explore. In random exploration, the tendency to exploit the option with highest short-term expected
reward is countered by ‘noise’ in the decision process. This noise introduces random variability to the decision,
which sometimes leads to exploration by chance.
A key feature of both types of exploration is that they appear to be subject to cognitive control. Thus, when it
is more valuable to explore—because there is more time to explore4, because the options are more uncertain5,9,
or because exploring is the only way to gain information10—people exhibit more information seeking (directed
exploration) and more variability in their behavior (random exploration). Exactly how the brain achieves this
control of directed and random exploration is unknown.
In this work we develop a value-based drift-diffusion m odel15–18 of explore–exploit behavior to investigate
how random exploration could be controlled. In this model, we assume that the decision between exploration
1
Department of Mathematics, Khalifa University of Science and Technology, Abu Dhabi, UAE. 2Department of
Psychology, University of Arizona, Tucson, AZ, USA. 3Cognitive Science Program, University of Arizona, Tucson,
AZ, USA. 4Khalifa University Centre for Biotechnology, Khalifa University of Science and Technology, Abu Dhabi,
UAE. *email: bob@arizona.edu
Scientific Reports | (2021) 11:3077 | https://doi.org/10.1038/s41598-021-82530-8 1
Vol.:(0123456789)www.nature.com/scientificreports/
Figure 1. Schematic of the drift diffusion model showing the parameterization used in this paper.
and exploitation is accomplished by accumulating evidence over time. At any moment, we assume that this
evidence is made up of a signal, µ, proportional to the difference in expected values between the two options,
and noise with variance c 2. The accumulation process starts from a starting point, x0, that captures the initial
bias towards one option or the other, and makes a decision when the accumulated evidence crosses a threshold
at +β for (e.g.) exploration and −β for exploitation (Fig. 1).
In the drift-diffusion model, behavioral variability can be controlled by three different parameters corre-
sponding to three different mechanisms for random exploration: (1) the signal, µ, (2) the variance of the noise,
c 2, or (3) the threshold, β . As shown in the “Results” section, at the level of choice it is impossible to distinguish
between these three parameters. That is, identical changes in choice variability can be caused by changes in either
signal, noise, or threshold (or a combination of all three). Thus, from choice data alone (which has been the
main focus of the explore–exploit literature up to now), it is impossible to determine which of these processes
controls random exploration.
In contrast to choices alone, it is possible to separate two of these processes (although unfortunately not all
three19) using response times. In particular, we can distinguish a change in threshold from a change in the ratio
of the signal to the noise. However, we cannot go further and attribute a signal-to-noise ratio (SNR) change to a
change in signal, noise or both. For this reason, it is common to fix the variance of the noise, c 2 = 1, and interpret
the drift parameter as a signal-to-noise ratio.
In this work, we fit a drift-diffusion model to choices and response times in a popular explore–exploit task (the
Horizon Task4). Using this approach we find evidence that random exploration is primarily driven by changes
in the signal-to-noise ratio, not the threshold.
Results
Before presenting the results of our analysis modeling response times, we briefly describe the behavioral task as
well as the previous findings relating to choice in this task.
The Horizon Task. In the Horizon Task4 participants play a series of games, lasting 5 or 10 trials each cor-
responding to free response horizons of 1 and 6 (Fig. 2). During these games they make choices between two
slot machines (also known as ‘one-armed bandits’). When chosen, a slot machine pays out a probabilistic reward
sampled from a Gaussian distribution that is truncated and rounded so that the rewards are integers between 1
and 100 points. The means of the Gaussians are different for each option, such that one option is always better on
average, but the standard deviation is the same for both options (8 points). The participants’ goal is to maximize
their reward by exploiting the best option, but they are not told the means of the Gaussians, and thus they must
explore both options to find out which one is best.
Critically, the first four trials of each game are ‘instructed’ trials (Fig. 2A). On these trials participants are
told which option to play and forbidden from choosing the other option. This instruction allows us to control
the information participants have before they make a free choice. In some games, participants are instructed
to play one option once and the other three times. This sets up an ‘unequal’ information condition, in which
participants are more uncertain about the option played once. In these ‘[1 3]’ games choosing this more uncertain
option is more informative and we refer to this as the ‘high information’ choice. In other games, participants
play both options twice to set up an equal (or [2 2]) information condition, in which both options are equally
informative to play.
After the four instructed trials, participants make either 1 (short horizon condition) or 6 (long horizon con-
dition) free choices (Fig. 2B,C). This horizon manipulation allows us to change the relative value of exploration
and exploitation. When the horizon is short, participants should favor exploitation, because there is no time in
the future to use any information gained by exploration. Conversely, in the long horizon condition, participants
should favor exploration, at least at first. Thus, by contrasting behavior between horizon conditions on the first
free choice of the game, the Horizon Task allows us to quantify directed and random exploration as changes in
information seeking and behavioral variability with horizon (Fig. 2D).
Information seeking and behavioral variability increase with horizon. Choice behavior on the
first free-choice trial of the Horizon Task shows clear evidence of directed and random exploration. Consistent
with directed exploration, in the [1 3] condition participants are more likely to choose the more informative
option in horizon 6 than horizon 1, as indicated by a shift in the indifference point of the choice curves (Fig. 3A).
Scientific Reports | (2021) 11:3077 | https://doi.org/10.1038/s41598-021-82530-8 2
Vol:.(1234567890)www.nature.com/scientificreports/
A B C
D
Figure 2. The Horizon Task. (A) Each game begins with four instructed trials in which participants are forced
to pick the bandit with the green square. Note that the instructed trials are identical across horizon conditions
except for the length of the bandits. (B,C) After the instructed trials, participants make free choices to the end of
the game. In the short horizon condition, the game ends after one free choice (B). In the long horizon condition,
participants make six free choices to complete the game (C). (D) The focus of analysis is the first free choice
trial. On this trial, behavior is compared between two uncertainty conditions (unequal and equal) and two
horizon conditions (short and long).
Consistent with random exploration, people’s behavior is less predictable (more random) in horizon 6 than hori-
zon 1, as indicated by a lower slope of the choice curves in the horizon 6 condition (Fig. 3B).
In4 we quantified the choice curves using a simple logistic model. In this model, we write the choice probabili-
ties in terms of the difference in observed mean reward of the two options, R = Rleft − Rright , and the difference
in information between the two options, I = Ileft − Iright (with information defined such that I = +1 when
the left choice is more informative in the [1 3] condition, I = −1 when the right choice is more informative
in the [1 3] condition, and I = 0 when neither option is more informative in the [2 2] condition). That is, we
write the probability of choosing the left option as
1
p( choose left) =
(1)
1 + exp − �R+A�I+B
√
2σ
where the free parameters are: the information bonus, A, the spatial bias in favor of choosing left, B, and the
standard deviation of the decision noise, σ . The spatial bias and noise parameters, B and σ , are fit separately in
each of the information and horizon conditions. The information bonus A is fit in the two horizon conditions of
Scientific Reports | (2021) 11:3077 | https://doi.org/10.1038/s41598-021-82530-8 3
Vol.:(0123456789)www.nature.com/scientificreports/
A B
C D E
Figure 3. Choice behavior in the Horizon Task. (A,B) Choice curves showing the choice probability as a
function of the difference in observed mean reward. (A) The probability of choosing the more informative
option (i.e. the option played once during the instructed trials) as a function of the difference in observed
reward between the more informative, R( high info) and less informative R( low info) bandits. (B) The
probability of choosing the left bandit as a function of the difference in observed mean reward between the
left and right options. (C,D,E) Fit parameter values, in units of points, from the logistic model showing the
information bonus (C), as well as the standard deviation of the decision in the unequal (D) and equal (E)
conditions. *** denotes a significant difference at p < 0.001.
the unequal information condition, which is the only condition in which it applies (there is no directed explora-
tion when both options are equally uncertain).
Fit values of the information bonus and decision noise for each participant are plotted in Fig. 3C–E. As the
horizon increases from 1 to 6, people exhibit both a larger information bonus, consistent with directed explora-
tion (i.e. A increases, t(45) = 6.53, p < 0.001), and more decision noise, consistent with random exploration
(i.e. σ increases t(45) = 7.66, p < 0.001 for [1 3] condition; t(45) = 5.78, p < 0.001 for [2 2] condition). Thus
we have previously concluded that humans use both directed and random exploration in the Horizon T ask4.
Response times suggest the decision is made on the first free‑choice trial. Response times in
the Horizon Task vary considerably with trial number (Fig. 4A,B). In the instructed trials, participants respond
slowly on the first trial of each game (RT ≈ 0.6s), before speeding up for the remaining instructed trials (RT ≈
0.4s). They then slow down on the first free-choice trial (RT ≈ 0.7s), before speeding up again on later trials.
This pattern of response times suggests that people may be playing through the instructed trials as quickly as
possible (at least once they decide to initiate the game on the first trial), and saving their deliberation for the first
free-choice trial.
Scientific Reports | (2021) 11:3077 | https://doi.org/10.1038/s41598-021-82530-8 4
Vol:.(1234567890)www.nature.com/scientificreports/
A B
C D
E F G
Figure 4. Response times in the Horizon Task. (A,B) Average response time as a function of trial number for
the unequal (A) and equal (B) information conditions. Instructed trials are labeled i1-4, free-choice trials 1–6.
(C,D) Response time as a function of difference in mean observed reward in the unequal (C) and equal (D)
information conditions. (E,F G) Linear regression analysis showing the baseline response time (E), and the
effects of a R (F), and a I (G) on response times.
In line with the idea that people are deciding on the first free-choice trial, we find that response times on this
trial are modulated by the difference in observed mean reward between the two options. In particular, people
respond more slowly when the difference in reward is closer to zero (Fig. 4C,D). Such a pattern of response times
is similar to that observed in value-based drift diffusion models of b ehavior16,17. In addition, the modulation of
response time by reward seems to change between the two horizon conditions, with a weaker dependence of
response time on R in horizon 6 than horizon 1.
To quantify these effects we fit a linear regression model to the response times. In this model we assume that
on each trial the response time is given by
RT = β0 + βR a�R + βI a�I (2)
Scientific Reports | (2021) 11:3077 | https://doi.org/10.1038/s41598-021-82530-8 5
Vol.:(0123456789)www.nature.com/scientificreports/
Variable Description
µ
c0 Baseline value of drift
µ
cR Effect of R on drift
µ
cI Effect of I on drift
β
c0 Baseline value of threshold
β
cR Effect of R on threshold
cI
β Effect of I on threshold
c0α Baseline value of bias
cRα Effect of R on bias
cIα Effect of I on bias
T0 Non-decision time
Table 1. Free parameters in the drift diffusion model. Note that all parameters are horizon dependent giving a
total of 20 free parameters overall, per subject.
where a corresponds to the choice, or action, on the trial, coded as +1 for left and −1 for right. The regression
coefficients β0, βR, and βI capture the baseline response time, the effect of reward on response time, and the effect
of information on response time respectively.
Results from this regression model are shown in Fig. 4E–G. Both the baseline response time, β0 (panel E), and
the modulation of response time by reward, βR (panel F), change with horizon. In particular, people’s baseline
response time becomes faster in the horizon 6 condition, while the dependence on reward gets weaker (i.e. less
negative).
Taken together, this pattern of response times suggests that (1) people make their decision on the first free-
choice trial, (2) modulate their response times according to reward, and (3) modulate their response times
according to horizon. In the following sections we show how a value-based drift-diffusion model can account
for these effects and shed light on the mechanisms underlying random exploration.
Drift‑diffusion model of the first free‑choice trial. We model choice and response time on the first
free choice of the Horizon Task using a value-based drift-diffusion model (e.g.16–18). In this model, we assume
that the drift rate, bias, and threshold can all vary with the difference in reward R and difference in information
I . Thus we write
µ µ µ
µ = c0 + cR �R + cI �I (3)
β β β
β = c0 + cR �R + cI �I (4)
α = 2L(c0α + cRα �R + cIα �I) − 1 (5)
where the bias α relates to the starting point, as x0 = αβ , and we use a logistic link function
1
L(x) = (6)
1 + exp(−x)
to ensure that α ∈ [−1, 1].
The free parameters of this model are the 9 coefficients, cji (i ∈ {µ, β, α}; j ∈ {0, R, I}), and an additional
non-decision time, T0, in which the integration process does not occur. We further assume that each of these 10
parameters can change with horizon giving us 20 free parameters in total, per subject, as summarized in Table 1.
Note that there are two limitations to this model that arise from the linear dependence of the threshold on R
and I in Eq. 4. First is the mathematical concern that the threshold, β, could become negative for certain values
of R or I , a situation for which the drift diffusion model’s behavior is undefined. Second is the psychological
concern that the effects of R and I are asymmetric. That is, simply switching the locations of left and right
bandits in Fig. 2D, without otherwise changing the decision, would lead to different thresholds (and different
behavior) because the signs of R and I have changed. In the Supplementary Material, we fit a model in which
threshold can vary as a function of the absolute value of R and I . As shown there, repeating our analysis with
this modified model does not change our scientific conclusions. In the main text, however, we persist with the
linear dependence on R and I because of the stronger mathematical connection to the logistic choice model
and the insights this connection provides.
The logistic choice model is a special case of the drift‑diffusion model. The form of the model
described in Eqs. 3, 4, and 5can be mapped exactly to the logistic choice model (Eq. 1) in two special cases. While
the full model is more general than either of these special cases, working through this mapping helps shed light
on how random exploration could be controlled in the drift-diffusion model and provides a hint at what the pat-
tern of response times in Fig. 4 might mean.
Scientific Reports | (2021) 11:3077 | https://doi.org/10.1038/s41598-021-82530-8 6
Vol:.(1234567890)www.nature.com/scientificreports/
To make the mapping to the logistic model, we make use of the standard expression for choice probability in
drift-diffusion models19. This allows us to write the choice probability as
1 1 − exp (−2αβµ)
p( choose left) = − (7)
1 + exp(2βµ) exp(2βµ) − exp(−2βµ)
If we assume that the initial condition is zero, i.e. α = 0, then the second term on the right hand side goes to zero
β β µ µ
and the choice probabilities are logistic in β and µ. If we further assume that either cR = cI = 0 or cR = cI = 0,
then this logistic function maps exactly onto the logistic choice function in Eq. 1.
β β
In the case where cR = cI = 0, the threshold does not depend on either reward or information. In this case
the choice probability becomes
1
p( choose left) =
(8)
β
µ µ µ
1 + exp 2c0 c0 + cR �R + cI �I
By comparing Eq. 8 with the logistic choice function (Eq. 1), we can make the identification that the noise
parameter in the logistic choice function is given by
1
σ = √ µ β (9)
2 2cR c0
Thus, if threshold is independent of reward and information, random exploration can be controlled by adjusting
β µ
either the baseline threshold c0 , or the extent to which drift is modulated by reward cR . We refer to this latter
quantity as the signal-to-noise ratio (SNR), because it reflects the extent to which the value signal modulates
the drift rate.
µ µ
In the case where cR = cI = 0 , the drift rate is independent of the reward and information. Setting the
drift-rate to be independent of reward is certainly not standard practice for value-based drift-diffusion models,
however we include this possibility for completeness and let the data rule it in or out. In this case, the equation
for choice probabilities becomes
1
p( choose left) =
(10)
µ β β β
1 + exp 2c0 c0 + cR �R + cI �I
with the identification
1
σ = √ µ β (11)
2 2c0 cR
Note that Eq. 11 involves different parameters to Eq. 9, suggesting that, in this case, random exploration can be
µ β
controlled by either the baseline drift rate, c0 or the effect of reward on threshold, cR.
Thus, at the level of choice, the drift-diffusion model suggests there are four different parameters by which
β µ
random exploration could be controlled: (1) the baseline threshold, c0 , (2) the effect of R on drift rate, cR or
β µ
SNR, (3) the effect of R on threshold, cR , and (4) the baseline drift rate c0 . However, because all four of these
mechanisms lead to identical logistic choice curves (Fig. 5A), it is impossible to distinguish between these
mechanisms using choice data alone. For that we need response times.
Different mechanisms for random exploration lead to different patterns of response
times. While the different mechanisms for random exploration lead to identical choices, they lead to mark-
edly different patterns of response times. In particular, using the standard equation for the response times in
drift-diffusion models19 we can write the response time as
β β 2 1 − exp (−2αβµ)
RT = T0 + tanh(βµ) + − αβµ (12)
µ µ exp(2βµ) − exp(−2βµ)
When α = 0, this reduces to
β
RT = T0 + tanh(βµ) (13)
µ
β β
In the case where threshold does not depend on reward or information, i.e. cR = cI = 0, this expression for
response times becomes
β
c0
β µ µ µ
RT = T0 + µ µ µ tanh c0 c0 + cR �R + cI �I (14)
c0 + cR �R + cI �I
µ µ
Conversely, when drift does not depend on reward or information, i.e. cR = cI = 0 , the response times are
given by
Scientific Reports | (2021) 11:3077 | https://doi.org/10.1038/s41598-021-82530-8 7
Vol.:(0123456789)www.nature.com/scientificreports/
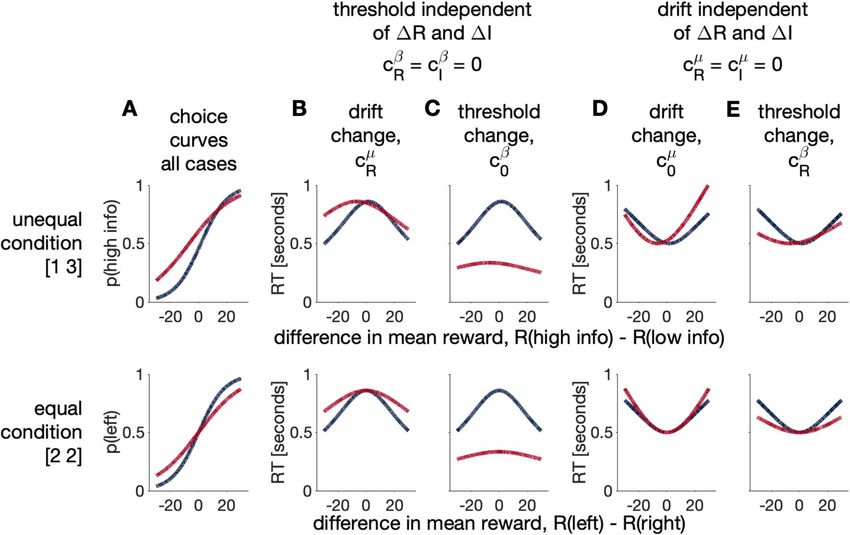
Figure 5. Qualitative predictions for the logistic versions of the drift-diffusion model using manually chosen
parameters. Blue and red lines correspond to horizon 1 and 6, respectively. (A) With appropriately chosen
parameter values, there are four ways in which the diffusion model reduces to the logistic choice model. All
four models have identical choice behavior. However, they differ in the patterns of response times that they
β β
produce (B,C,D,E). (B,C) In the case where threshold is independent of reward and information, cR = cI = 0,
there is a maximum response time. A change in drift with horizon leads to slower response times in horizon
6 than horizon 1 (B), while a change in threshold with horizon leads to faster response times in horizon 6
µ µ
than horizon 1 (C). (D,E) When drift rate is independent of reward and information, cR = cI = 0, there is a
minimum response time. A change in baseline drift with horizon leads to (mostly) an increase in response times
in horizon 6, while a change in threshold leads to a decrease in response times in horizon 6. See section 3 of the
Supplementary Material for parameter values.
β β β
c0 + cR �R + cI �I
µ β β β
RT = T0 + µ tanh c0 c0 + cR �R + cI �I (15)
c0
Note the different dependence on R in Eqs. 14 and 15. In Eq. 14, RT has a global maximum at
µ µ
cI �I + c0
�R∗ = − µ (16)
cR
, and decreases as R moves away from this point (Fig. 5B,C). In Eq. 15, RT has a global minimum at
β β
cI �I + c0
�R∗ = − β (17)
cR
, and increases as R moves away from this point (Fig. 5D,E). Comparison with human behavior in Fig. 4 already
µ µ
suggests that the models where cR = cI = 0 are not a good description of behavior.
How the response times change with horizon allows us to further distinguish between the two remaining
β β µ
models when cR = cI = 0. If random exploration is controlled by the effect of R on drift, cR , then response
µ
times in horizon 6 will be slower than horizon 1 because behavioral variability is increased by reducing cR in hori-
β
zon 6 (Fig. 5B). Conversely, if random exploration is controlled by the baseline threshold, c0 , then response times
β
in horizon 6 will be faster than horizon 1 because behavioral variability is increased by reducing c0 (Fig. 5C).
Comparison with human behavior in Fig. 4 suggests that response times are slower in horizon 6 (except for
β
R = 0 in the unequal condition), suggesting a drift mechanism for random exploration in which cR , the signal-
to-noise ratio, is reduced in horizon 6. Of course, this qualitative analysis of response times can only take us so
far, to be sure that behavioral variability is controlled by SNR we need to explicitly fit the full model.
Scientific Reports | (2021) 11:3077 | https://doi.org/10.1038/s41598-021-82530-8 8
Vol:.(1234567890)www.nature.com/scientificreports/
Model fitting suggests that both signal‑to‑noise ratio and threshold change with hori‑
zon. While the qualitative analysis of response times presented above suggests a drift mechanism for random
µ
exploration controlled by the signal-to-noise ratio, cR , it does not rule out the possibility that the other param-
eters also play a role in random exploration. To test this possibility, and to relax the assumption that the starting
point is always zero, we fit the full 20-parameter model to the behavior.
For each subject in each horizon condition, we fit parameters using the a maximum likelihood approach
(see Methods). In the Supplement we show that this method leads to excellent parameter recovery in this task
(Supplementary Figure S2) and that the parameters estimated with this approach almost exactly match those
computed using the Bayesian HDDM python t oolbox20 (Supplementary Figure S1).
In Fig. 6 we plot the fit parameter values from the maximum likelihood procedure for each subject in the
two horizon conditions, as well as the difference in parameter value (e.g. T0 ( horizon 6 ) − T0 ( horizon 1 )).
µ
Consistent with directed exploration, adding an information bonus to the drift rate, cI increases with horizon
(t(45) = 6.55, p < 0.001). That is, participants show greater drift towards the more informative option in horizon
6 than they do in horizon 1.
µ
Consistent with random exploration making behavior more variable in horizon 6, both cR (t(45) = 6.65,
β
p < 0.001) and c0 decrease with horizon (t(45) = 3.55, p < 0.001). Unlike the qualitative analysis, this suggests
µ β
that both drift changes, cR , and threshold changes, c0 , may underlie random exploration.
In addition to these effects on drift rate and threshold, we also see an effect of horizon on the bias. In par-
ticular, the effect of reward on bias, cRα is reduced in horizon 6 relative to horizon 1. This could reflect processing
of reward before the first free-choice trial, which is entirely possible given that participants gain information
throughout the instructed trials.
Beyond the parameters that change with horizon, there were several parameters that were not significantly
µ
different from zero in either horizon condition: the baseline drift rate, c0 , the baseline starting point, c0α, the effect
β β
of R on threshold, cR , the effect of I on threshold, cI , and the effect of I on bias, cIα.
Finally, comparing the theoretical choice and response time curves (Eqs. 7 and 12using the fit parameter
values) shows that the drift-diffusion model captures the main qualitative features of the choice and response
time curves (Fig. 7).
Sensitivity analysis suggests that random exploration is dominated by changes in SNR. The
µ β
results of model fitting suggest that both signal-to-noise ratio, cR , and threshold, c0 , change with horizon and
thus may be behind the changes in behavioral variability associated with random exploration. However, a hori-
zon-based change in parameter value does not, in and of itself, indicate how large the effect on behavioral vari-
ability will be. Thus we next examine the extent to which each process (SNR change or threshold change) con-
tributes to the change in variability with horizon.
To do this we make use of the relationship between the drift-diffusion model and the logistic choice model.
In particular, we note that in the diffusion model fits (Fig. 6), the baseline bias, c0α is approximately zero, as are
β β
cR , cI . This suggests that for the fit parameter values, the drift-diffusion model approximates the logistic model
with noise given by Eq. 9; i.e.
1
σ = √ µ β (18)
2 2cR c0
µ β
To test this relationship between σ , cR , and c0 , we computed the predicted noise parameter from the fit drift-
diffusion model parameters (RHS of Eq. 9) and compared it to the noise parameter σ from the logistic model
(LHS Eq. 9). These quantities were tightly coupled (r > 0.76, p < 0.001 for both horizon conditions, Supple-
mentary Figure S3) implying that the approximations required to derive Eq. 9 hold.
If Eq. 9 does hold, then this implies that the relative change in random exploration between horizon 1 and
6 can be written as
µ β
σ ( horizon 1 ) c ( horizon 6 )c0 ( horizon 6 )
= Rµ β (19)
σ ( horizon 6 ) cR ( horizon 1 )c0 ( horizon 1 )
µ β
and therefore that the relative contribution of cR and c0 to random exploration is determined by the relative
amount by which each parameter changes from horizon 1 to horizon 6. Computing these ratios for the fit
µ µ µ β
parameters, we find that cR changes by a larger amount ( cR ( horizon 6 )/cR ( horizon 1 ) ∼ 0.645 ) than c0
β β
(c0 ( horizon 6 )/c0 ( horizon 1 ) ∼ 0.933, Fig. 8). This is to be compared with a change in logistic decision noise
of around 0.4 ( σ ( horizon 1 )/σ ( horizon 6 ) = 0.456 in the [1 3] condition and 0.426 in the [2 2] condition).
µ
This suggests that random exploration is primarily driven by the change in signal-to-noise ratio, cR , and not the
change in baseline threshold.
Discussion
In this paper we developed a drift-diffusion model of explore–exploit decision making to investigate the mecha-
nisms underlying random exploration. This model includes the logistic model of exploration used in previous
work as a special case, and suggests four different mechanisms by which the control of behavioral variability
for random exploration could be achieved. While it is impossible to distinguish between these mechanisms
using choice data alone, they lead to qualitatively different patterns of response times. Thus, by fitting the
model to response time data in a popular explore–exploit task, we found evidence that random exploration was
driven by two of these mechanisms: changes in drift rate, specifically how strongly reward modulated drift, the
Scientific Reports | (2021) 11:3077 | https://doi.org/10.1038/s41598-021-82530-8 9
Vol.:(0123456789)www.nature.com/scientificreports/
Figure 6. Fit drift-diffusion model parameters in the Horizon Task. Each row corresponds to a different
parameter in the drift-diffusion model (drift rate, threshold, bias and non-decision time). Each column
corresponds to a different component of each parameter (its baseline value, how it changes with reward, and
how it changes with information). Parameters that change significantly between horizon 1 and horizon 6 are
highlighted with a yellow background. * denotes a significant horizon difference at p < 0.01, *** at p < 0.001.
All significance checks were Bonferroni corrected for 10 multiple comparisons.
µ β
signal-to-noise ratio cR , and baseline threshold, c0 . Further analysis suggested that the change in drift dominates,
accounting for most of the change in variability associated with random exploration.
Taken together, our findings suggest that random exploration is primarily driven by a change in the signal-
to-noise ratio with which reward information is encoded in the brain. That is, when it valuable to explore, the
representation of reward cues—or at least the extent to which these cues are incorporated into the decision—is
reduced, leading to weaker drift rates, slower response times, and more random exploration overall. Such a
mechanism is consistent with recent reports that neural variability is increased when monkeys are in an explora-
tory ‘state’7 and that fMRI signal variability is increased in motor cortex when participants randomly e xplore21.
Scientific Reports | (2021) 11:3077 | https://doi.org/10.1038/s41598-021-82530-8 10
Vol:.(1234567890)www.nature.com/scientificreports/
Figure 7. The drift-diffusion model (solid lines) captures the main qualitative effects of human choice and
response time data (dots) in all conditions of the experiment.
A B
Figure 8. Sensitivity analysis. (A) The ratio of decision noise in horizon 6 compared to decision noise in
horizon 1 computed using the σ parameter from the logistic model for the equal and unequal conditions. In
µ β
both cases the median ratio is just over 2. (B) The ratios of drift-diffusion parameters, cR and c0 , in horizon 1 to
those in horizon 6. Note that for comparison with panel (A), the ratios are reversed (i.e. horizon 1:horizon 6 for
(B) instead of horizon 6:horizon 1 for (A), see Eq. 18). *** indicates a significant difference at p < 0.001.
This SNR mechanism is also consistent with older findings from the bird song literature, in which increased
variability in song during practice, is associated with increased neural v ariability22–25. More generally, such a
signal-to-noise ratio mechanism also gives a point of contact with other theories of how environmental noise
supports information processing in the brain and other physical systems26–30.
A natural next step will be to leverage the model reductions suggested by our results. Indeed, our analysis
fits 20 parameters per subject (10 per horizon condition), and in order to obtain robust fits we needed at least
130 games per horizon condition per subject (which limited our final sample size). Moving forward, however,
β
we can make assumptions that decrease this total number of parameters per subject (e.g. assume that cI is the
same for both horizon conditions), which opens the door for fitting participants with fewer trails. In addition
to replicating our findings, such improvements would open the door to future studies in populations limited to
low numbers of trials (e.g. aging or mentally disordered subjects).
Future investigation may also seek an explanation for the behavior on the rest of the Horizon Task, as opposed
to the first free response trial analyzed here. In other words, how are the various parameters of the DDM
“learned” in the Horizon task? This would require modeling both the learning and decision processes at work.
Ongoing research in this area aims to link reinforcement learning models with sequential sampling models that
are mathematically equivalent to the DDM used in this study (see31,32 for recent reviews). Assuming that human
Scientific Reports | (2021) 11:3077 | https://doi.org/10.1038/s41598-021-82530-8 11
Vol.:(0123456789)www.nature.com/scientificreports/
agents exert control over their DDM parameters, future work could take a similar reinforcement learning and
DDM approach to understand the dynamics that give rise to the signal-to-noise mechanism revealed in the
current study.
Another key question is whether the change in signal-to-noise ratio is driven by a change in the signal, a
change in the noise, or a change in both. Because of a scaling condition in the equations of the drift-diffusion
model, signal and noise are confounded in behavior, and this question is impossible to address with our data.
However, with neuroimaging and electrophysiology it should be possible to separately measure signal and noise
in the brain and resolve this question. If increased variability is caused by reduced signal, then the strength of
reward signals in the brain should be reduced when exploration is valuable. Conversely, if increased variability
is due to increased noise, then the average reward signal will be the same, but the variability in the signal (from
trial to trial and within a single trial) will be larger.
Lastly, we ask what exactly is the ‘evidence’ that is being integrated over time in the explore–exploit choice?
odels19, it is less
While evidence has a relatively clear meaning for perceptual decisions in classic drift-diffusion m
clear for their value-based cousins. One intriguing possibility for explore–exploit choices, is that the evidence
that is being integrated corresponds to mental simulations of possible futures. Indeed, we have recently pro-
posed such a mental simulation model of explore–exploit choices in a different t ask33. In this ‘Deep Exploration’
model of explore–exploit behavior, decisions are made by mental simulation of plausible future outcomes (e.g.
what outcome might I receive if I explore first, what would I do then, etc ...). Each simulation generates a sample
from the expected value of exploring or exploiting, and the decision is made by accumulating these samples to
pick the option with the highest average simulated value. In our previous work, we considered the case where
the number of simulations was fixed, but the model, at least in principle, is readily extended to the case where
the decision is made by a threshold crossing process instead. A major goal for future work will therefore be to
explicitly connect the drift-diffusion model presented here with the Deep Exploration account in33 to create a
complete theory of the dynamics of explore–exploit choice.
Methods
Participants. Data used in this paper come from two previous published data sets: 30 participants (11 male,
20 female, ages 18–24, mean 19.7) from the original Horizon Task paper4 and an additional 30 participants (9
male, 20 female, ages 18–50, mean 22.7) who made up additional young adults in34. Both data sets were acquired
at Princeton University. In both cases participants gave informed consent and the studies were approved by the
Princeton Institutional Review Board. All experiments were performed in accordance with relevant guidelines
and regulations.
Exclusion criteria. In order to obtain meaningful parameters from the drift-diffusion model, we excluded
trials in which participants responded to quickly (response time less than 0.1 seconds) or too slowly (response
time less than 3 seconds). After this exclusion of trials, we then excluded participants who had less than 131
remaining trials for either horizon condition. This left 46 participants (10 male, 36 female, ages 18–28, mean
20.7) for the main analysis.
The horizon task. In the Horizon Task (Fig. 2), participants choose between two slot machines, or one-
armed bandits. When chosen, the slot machines pay out rewards, sampled from Gaussian distributions that are
truncated (to lie between 1 and 100 points) and rounded (to be integers). The means of the Gaussians are differ-
ent for each machine such that one machine is always better on average. In particular, the mean of one machine,
randomly assigned to be on the left or right, is always set to either 40 or 60 points, while the mean of the other
machine is set to be one of 4, 8, 12, 20, or 30 points higher or lower. The standard deviation of the Gaussians
is the same for both options and is set to 8 points. In the instructions, participants are told that one option is
always better and that the variability of the bandits (i.e. the standard deviation) remains the same over the entire
experiment.
Trials in the Horizon Task are lumped together into ‘games’ lasting either 5 or 10 trials each. For each game
the means of the Gaussians are selected using the process described above, but then remain constant for the
remainder of the game before changing again for the next game. The duration of each game is indicated by the
length of the bandits, which contain ‘slots’ that record the outcome of each trial. Short bandits, with 5 slots for
the outcomes indicate short games. Long bandits, with 10 slots for the outcomes indicate long games.
Each game begins with four instructed trials, during these trials participants are instructed to play one
option and are unable to play the other. By controlling which options participants play on these trials, we use
the instructed trials to setup one of two information conditions: an unequal condition, in which one option is
played once and the other three times (also known as the [1 3] condition), and an equal condition, in which both
options are played twice (aka the [2 2] condition).
After the instructed trials, depending on the length of the game, participants have either 1 (5-trial games,
short horizon condition) or 6 (10-trial games, long horizon condition) free choices between the two bandits.
This horizon manipulation is the critical component of the Horizon Task. When the horizon is long, explora-
tion is valuable, but when the horizon is short participants should always exploit. Thus by contrasting behavior
between horizon conditions on the first free-choice trial of each game, we can quantify the directed and random
exploration as the change in information seeking and behavioral variability with horizon.
Logistic model of choice. In the logistic model of choice, we assume that choices are generated according
to
Scientific Reports | (2021) 11:3077 | https://doi.org/10.1038/s41598-021-82530-8 12
Vol:.(1234567890)www.nature.com/scientificreports/
1
p( choose left) =
(20)
1 + exp − �R+A�I+B
√
2σ
where R = Rleft − Rright is the difference in the mean of the observed rewards for the left and right options, and
I is the difference in information. I is defined categorically such that I = +1 when left is the more informa-
tive option in the [1 3] condition, i.e. when left has been played once during the instructed trials, I = −1 when
right is the more informative option in the [1 3] condition, and I = 0 in the [2 2] condition.
The parameters of the logistic model are: the information bonus, A, the side bias, B, and the standard deviation
of the decision noise σ . These parameters are fit to separately to the choices on the first free-choice trial for each
horizon condition (A) and each horizon × uncertainty condition (B and σ ). Together this gives 6 free parameters.
Fitting the logistic model. Following4, we fit the logistic model using a maximum a posteriori approach.
In particular, to avoid excessively large parameter values, we used the following exponential prior on σ (with
length scale 20), and a Gaussian prior on A, with mean 0 and standard deviation 20. Maximization was per-
formed using the fmincon function in Matlab.
Linear model of response times. In the linear model of response times we assume that the response is
given by
RT = β0 + βR a�R + βI a�I (21)
where a corresponds to the choice, or action, on the trial, coded as +1 for left and −1 for right. The regression
coefficients β0 , βR , and βI capture the baseline response time, the effect of reward on response time, and the
effect of information on response time respectively. This model was fit to participant data using the glmfit func-
tion in Matlab.
Drift diffusion model. We model the response times using a model based on the well-known drift-
diffusion model (DDM, Fig. 1), originally introduced b y15, which has been used to model a variety of 2AFC
19,35–37
paradigms . More recently, such models have been successfully employed in studying value based decisions
more similar to those in the present task e.g.16–18. Our model is an adaptation of what is commonly called the
‘simple’ or ‘pure’ DDM16,19.
At every instant, the model encodes a relative value signal ( X ) representing the accumulated ‘evidence’
favoring the hypothesis that the left bandit has a higher value ( X > 0) than the bandit on the right ( X < 0).
This relative value signal evolves according to a simple stochastic differential equation, written in Itô form as:
dX(t) = µdt + cdW(t) (22)
where µdt is a drift rate representing the average change in evidence supporting a left (µ > 0) or right (µ < 0)
response and cdW(t) is Gaussian distributed ‘white noise’ with mean 0 and variance c 2 dt .
A choice is made when the relative value crosses a threshold at +β for left and −β for right. We also include
a fixed nondecision time T0, an initial period of the response time when there is no accumulation happening
(i.e. X(t) does not change for t ∈ [0, T0 ]).
Finally, the accumulation starts at some initial state of evidence: X(0) = X0 which we usually write as X0 = αβ
where −1 ≤ α ≤ 1. In this context, we call α the ‘bias’. It is commonly known that one of µ, β, c can be fixed
without changing the model’s response time d istributions19, we thus fix c = 1. Our formulation of the simple/
pure DDM then has 4 parameters: µ, β, α, T0. Our modeling effort, then, is to incorporate the elements of the
Horizon Task into these key parameters.
To model behavior on the first free-choice of each game, we assume that the drift rate, threshold, and bias,
can all vary with difference in reward R and difference in information I . Thus we write
µ µ µ
µ = c0 + cR �R + cI �I
β β
β = c0 + cR �R + cI �I
β
(23)
α = 2L(c0α + cRα �R + cIα �I) − 1
where L is a logistic link function (main text, Eq. 6). This yields 9 free parameters to describe the baseline value,
effect of reward, and effect of information on each of drift, threshold and bias. Combined with the non-decision
time, T0, this gives us 10 free parameters that we fit each each horizon condition, giving 20 free parameters overall.
Fitting the drift diffusion model. We fit the drift-diffusion model to participant choices and response
times using a maximum likelihood approach. This approach centered on the method of38 for fast and accurate
computation of the first passage time distribution of the drift-diffusion process. Fits were performed in Matlab
using the fmincon function. All codes and data used to reproduce the figures and analysis are available at https
://github.com/sffeng/horizon_ddm.
Scientific Reports | (2021) 11:3077 | https://doi.org/10.1038/s41598-021-82530-8 13
Vol.:(0123456789)www.nature.com/scientificreports/
Received: 13 May 2020; Accepted: 16 December 2020
References
1. Bellman, R. A problem in the sequential design of experiments. Sankhyā Indian J. Stat. (1933–1960) 16(3/4), 221–229 (1956).
2. Bubeck, S. et al. Regret analysis of stochastic and nonstochastic multi-armed bandit problems. Found. Trends Mach. Learn. 5(1),
1–122 (2012).
3. Frank, M. J., Doll, B. B., Oas-Terpstra, J. & Moreno, F. Prefrontal and striatal dopaminergic genes predict individual differences in
exploration and exploitation. Nat. Neurosci. 12(8), 1062 (2009).
4. Wilson, R. C., Geana, A., White, J. M., Ludvig, E. A. & Cohen, J. D. Humans use directed and random exploration to solve the
explore-exploit dilemma. J. Exp. Psychol. Gen. 143(6), 2074 (2014).
5. Speekenbrink, M. & Konstantinidis, E. Uncertainty and exploration in a restless bandit problem. Topics Cogn. Sci. 7(2), 351–367
(2015).
6. Dezza, I. C., Angela, J. Y., Cleeremans, A. & Alexander, W. Learning the value of information and reward over time when solving
exploration–exploitation problems. Sci. Rep. 7(1), 1–13 (2017).
7. Ebitz, R. B., Albarran, E. & Moore, T. Exploration disrupts choice-predictive signals and alters dynamics in prefrontal cortex.
Neuron 97(2), 450–461 (2018).
8. Wu, C. M., Schulz, E., Speekenbrink, M., Nelson, J. D. & Meder, B. Generalization guides human exploration in vast decision
spaces. Nat. Hum. Behav. 2(12), 915–924 (2018).
9. Gershman, S. J. Deconstructing the human algorithms for exploration. Cognition 173, 34–42 (2018).
10. Findling, C., Skvortsova, V., Dromnelle, R., Palminteri, S. & Wyart, V. Computational noise in reward-guided learning drives
behavioral variability in volatile environments. Nat. Neurosci. 22, 2066–2077 (2019).
11. Schulz, E. & Gershman, S. J. The algorithmic architecture of exploration in the human brain. Curr. Opin. Neurobiol. 55, 7–14 (2019).
12. Costa, V. D., Mitz, A. R. & Averbeck, B. B. Subcortical substrates of explore–exploit decisions in primates. Neuron 103(3), 533–545
(2019).
13. Wilson, R., Bonawitz, E., Costa, V. & Ebitz, B. Balancing exploration and exploitation with information and randomization. Curr.
Opin. Behav. Sci. 38, 49–56 (2021).
14. Averbeck, B. B. Theory of choice in bandit, information sampling and foraging tasks. PLoS Comput. Biol. 11(3), e1004164 (2015).
15. Ratcliff, R. A theory of memory retrieval. Psychol. Rev. 85(2), 59 (1978).
16. Milosavljevic, M., Malmaud, J., Huth, A., Koch, C. & Rangel, A. The drift diffusion model can account for the accuracy and reac-
tion time of value-based choices under high and low time pressure. Judgm. Decis. Mak. 5(6), 437 (2010).
17. Krajbich, I. & Rangel, A. Multialternative drift-diffusion model predicts the relationship between visual fixations and choice in
value-based decisions. Proc. Natl. Acad. Sci. 108(33), 13852–13857 (2011).
18. Krajbich, I., Dingchao, L., Camerer, C. & Rangel, A. The attentional drift-diffusion model extends to simple purchasing decisions.
Front. Psychol. 3, 193 (2012).
19. Bogacz, R., Brown, E., Moehlis, J., Holmes, P. & Cohen, J. D. The physics of optimal decision making: A formal analysis of models
of performance in two-alternative forced-choice tasks. Psychol. Rev. 113(4), 700 (2006).
20. Wiecki, T. V., Sofer, I. & Frank, M. J. Hddm: Hierarchical bayesian estimation of the drift-diffusion model in python. Front. Neu-
roinform. 7, 14 (2013).
21. Tomov, M. S., Truong, V. Q., Hundia, R. A. & Gershman, S. J. Dissociable neural correlates of uncertainty underlie different explo-
ration strategies. Nat. Commun. 11(1), 1–12 (2020).
22. Doya, K. & Sejnowski, T. J. A novel reinforcement model of birdsong vocalization learning. In Advances in Neural Information
Processing Systems 101–108 (1995)
23. Kao, M. H., Doupe, A. J. & Brainard, M. S. Contributions of an avian basal ganglia-forebrain circuit to real-time modulation of
song. Nature 433(7026), 638–643 (2005).
24. Tumer, E. C. & Brainard, M. S. Performance variability enables adaptive plasticity of crystallized adult birdsong. Nature 450(7173),
1240–1244 (2007).
25. Olveczky, B. P., Andalman, A. S. & Fee, M. S. Vocal experimentation in the juvenile songbird requires a basal ganglia circuit. PLoS
Biol. 3(5), e153–e153 (2005).
26. Ushakov, Y. V., Dubkov, A. A. & Spagnolo, B. Spike train statistics for consonant and dissonant musical accords in a simple auditory
sensory model. Phys. Rev. E 81, 041911 (2010).
27. Ushakov, Y. V., Dubkov, A. A. & Spagnolo, B. Regularity of spike trains and harmony perception in a model of the auditory system.
Phys. Rev. Lett. 107, 108103 (2011).
28. Spagnolo, B. et al. Noise-induced effects in nonlinear relaxation of condensed matter systems. Chaos Solitons Fract. 81, 412–424
(2015).
29. Valenti, D., Magazzù, L., Caldara, P. & Spagnolo, B. Stabilization of quantum metastable states by dissipation. Phys. Rev. B 91,
235412 (2015).
30. Spagnolo, B. et al. Nonlinear relaxation phenomena in metastable condensed matter systems. Entropy 19(1), 20 (2017).
31. Pedersen, M. L., Frank, M. J. & Biele, G. The drift diffusion model as the choice rule in reinforcement learning. Psychon. Bull. Rev.
24(4), 1234–1251 (2017).
32. Miletić, S., Boag, R. J. & Forstmann, B. U. Mutual benefits: Combining reinforcement learning with sequential sampling models.
Neuropsychologia 136, 107261 (2020).
33. Wilson, R., Wang, S., Sadeghiyeh, H., & Cohen, J. D. Deep exploration as a unifying account of explore-exploit behavior (2020).
34. Somerville, L. H. et al. Charting the expansion of strategic exploratory behavior during adolescence. J. Exp. Psychol. Gen. 146(2),
155 (2017).
35. Forstmann, B. U., Ratcliff, R. & Wagenmakers, E.-J. Sequential sampling models in cognitive neuroscience: Advantages, applica-
tions, and extensions. Annu. Rev. Psychol. 67, 641–666 (2016).
36. Simen, P. et al. Reward rate optimization in two-alternative decision making: Empirical tests of theoretical predictions. J. Exp.
Psychol. Hum. Percept. Perform. 35(6), 1865 (2009).
37. Ratcliff, R. & Smith, P. L. A comparison of sequential sampling models for two-choice reaction time. Psychol. Rev. 111(2), 333
(2004).
38. Navarro, D. J. & Fuss, I. G. Fast and accurate calculations for first-passage times in Wiener diffusion models. J. Math. Psychol.
53(4), 222–230 (2009).
Acknowledgements
This work was supported by NIA Grants R56AG061888 and R01AG061888 to RCW. This publication is based
upon work supported by the Khalifa University of Science and Technology under Award No. CIRA-2019-050 to
SFF. We also thank the three anonymous referees for carefully reviewing the paper.
Scientific Reports | (2021) 11:3077 | https://doi.org/10.1038/s41598-021-82530-8 14
Vol:.(1234567890)www.nature.com/scientificreports/
Author contributions
S.F. and R.C.W. conceived the study. S.W. and S.Z. performed model-free analysis of reaction times. R.C.W. and
S.F. performed the modeling. R.C.W. and S.F. wrote the manuscript with input from the other authors.
Competing interests
The authors declare no competing interests.
Additional information
Supplementary Information The online version contains supplementary material available at https://doi.
org/10.1038/s41598-021-82530-8.
Correspondence and requests for materials should be addressed to R.C.W.
Reprints and permissions information is available at www.nature.com/reprints.
Publisher’s note Springer Nature remains neutral with regard to jurisdictional claims in published maps and
institutional affiliations.
Open Access This article is licensed under a Creative Commons Attribution 4.0 International
License, which permits use, sharing, adaptation, distribution and reproduction in any medium or
format, as long as you give appropriate credit to the original author(s) and the source, provide a link to the
Creative Commons licence, and indicate if changes were made. The images or other third party material in this
article are included in the article’s Creative Commons licence, unless indicated otherwise in a credit line to the
material. If material is not included in the article’s Creative Commons licence and your intended use is not
permitted by statutory regulation or exceeds the permitted use, you will need to obtain permission directly from
the copyright holder. To view a copy of this licence, visit http://creativecommons.org/licenses/by/4.0/.
© The Author(s) 2021
Scientific Reports | (2021) 11:3077 | https://doi.org/10.1038/s41598-021-82530-8 15
Vol.:(0123456789)You can also read